interim report - zonebourse.com · » read more about this under “other disclosures” in this...
TRANSCRIPT

Interim ReportJanuary – March 2010
NIVEA Sun: Innovative Sun Protection.

2
beier sdorf inter im rep or t january – m arch 2010
content s · highl ight s in the f ir s t quar ter
Contents
NIVEA Sun: innovative sun protection.NIVEA Sun, one of the leading brands in the segment of sun protection products, started 2010 with a packaging relaunch. In addition to a new, curved bottle design and a new logo, the relaunch focuses on enabling consumers to find the information they need quickly by displaying the sun protection factors in a larger format. In addition, NIVEA Sun launched three new pro-ducts: two transparent facial fluids and the “Swim & Play” sun lotion for children. At +17.6%, NIVEA Sun performed extremely well in the first quarter of 2010.
about the cover
03 Business Developments – Overview04 Segment Overview05 Beiersdorf's Shares
Interim Management Report – Group06 Results of Operations – Group07 Results of Operations – Business Segments11 Balance Sheet Structure – Group12 Financial Position – Group, Employees13 Other Disclosures, Opportunities and Risks14 Outlook for 2010
Interim Consolidated Financial Statements15 Income Statement. Statement of Comprehensive Income16 Balance Sheet17 Cash Flow Statement18 Statement of Changes in Equity19 Selected Explanatory Notes20 Financial Calendar, Contact Information
highlights in the first quarter
Beiersdorf reorganizes.Beiersdorf’s Executive Board has resolved to develop its successful Consumer Business Strategy further and has defined two core elements: “Focus on skin care. Closer to markets.” As part of this process, the Executive Board has reorganized itself effective May 1, and created three functional and three regional areas of responsibility.
» Read more about this under “Other Disclosures” in this interim report.
NIVEA Q10 – fit for the future. The Q10 products from NIVEA Visage and NIVEA Body Care have been global bestsellers for more than ten years. In order to secure its strong position, Beiersdorf implemented a major international relaunch of its NIVEA Q10 product line at the beginning of the year, while at the same time driving forward the expansion of the product range and providing communications support.
» More information about NIVEA Q10 can be found at www.nivea.com/q10.
“Feel the care” – Beiersdorf launches new NIVEA campaign.Beiersdorf has revamped its communication activities for the NIVEA brand and is focusing on the topic of care as the brand’s core value in its new umbrella brand campaign. The new brand claim “Feel the care” further intensifies NIVEA’s closeness to its consumers and emphasizes the idea of care in its advertising as the common thread linking all NIVEA products.
Most Trusted Brand: NIVEA maintains its leading consumer trust position.NIVEA has been named the “Most Trusted Brand” for skin care for the sixth time in a row in the high-profile consumer study conducted by “Reader’s Digest” magazine. Consumers in all 16 European countries participating in the study gave the classic brand top marks for its price/performance ratio, quality, and image, among other things.

3
beier sdorf inter im rep or t january – m arch 2010
busine s s de velopment s – overv ie w
Business Developments – Overview
Beiersdorf at a Glance
Beiersdorf back on growth path» Group sales (+6.0%) and EBIT (+28.2%) clearly above the previous year» Consumer sales (organic) up 4.0%» tesa reaches sales growth of 20.2%» Consolidated profit after tax €122 million
Outlook for Fiscal Year 2010» Above-market Consumer sales growth» Consumer EBIT margin clearly above 11%» Above-market tesa sales growth» tesa EBIT margin slightly above 8%
Jan. 1 – Mar. 31, 2009 Jan. 1 – Mar. 31, 2010
Group sales (in € million) 1,438 1,537
Change (organic) (in %) –4.0 6.0
Consumer sales (in € million) 1,267 1,328
Change (organic) (in %) –0.5 4.0
tesa sales (in € million) 171 209
Change (organic) (in %) –23.8 20.2
Operating result (EBIT) (in € million) 145 186
Profit after tax (in € million) 100 122
Return on sales after tax (in %) 6.9 7.9
Earnings per share (in €) 0.43 0.53
Gross cash flow (in € million) 117 132
Capital expenditure (including non-current investments) (in € million) 27 17
Research and development expenses (in € million) 37 37
Employees (number as of Mar. 31) 21,866 20,728
Sales growth (organic) in %
5,971
7.5
1,523
9.2
2008
5,748
–0.7
1,438
–4.0
2009
1,537
6.0
2010
group sales // in € million jan. 1 – mar. 31 full year
Return on sales after tax in %
490
8.2
143
9.4
2008*
380
6.6
100
6.9
2009
122
7.9
2010
profit after tax // in € million jan. 1 – mar. 31 full year
* Excluding special factors.

4
beier sdorf inter im rep or t january – m arch 2010
segment overv ie w
Segment Overview
Business Developments by Business Segment
sales // in € million Jan. 1 – Mar. 31, 2009 Jan. 1 – Mar. 31, 2010 Change in %
% of total % of total nominal adj. for curr. trans. effects
Consumer 1,267 88.1 1,328 86.4 4.8 4.0
tesa 171 11.9 209 13.6 22.7 20.2
Total 1,438 100.0 1,537 100.0 6.9 6.0
ebitda // in € million Jan. 1 – Mar. 31, 2009 Jan. 1 – Mar. 31, 2010 Change in %
% of sales % of sales nominal
Consumer 166 13.1 185 13.9 12.9
tesa 6 3.9 31 14.9 -
Total 172 12.0 216 14.1 26.8
operating result (ebit) // in € million Jan. 1 – Mar. 31, 2009 Jan. 1 – Mar. 31, 2010 Change in %
% of sales % of sales nominal
Consumer 144 11.3 161 12.1 12.0
tesa 1 0.7 25 11.9 -
Total 145 10.1 186 12.1 28.2
gross cash flow // in € million Jan. 1 – Mar. 31, 2009 Jan. 1 – Mar. 31, 2010 Change in %
% of sales % of sales nominal
Consumer 110 8.7 107 8.1 –2.8
tesa 7 3.8 25 11.7 -
Total 117 8.1 132 8.6 12.8
Business Developments by Region
sales // in € million Jan. 1 – Mar. 31, 2009 Jan. 1 – Mar. 31, 2010 Change in %
% of total % of total nominal adj. for curr. trans. effects
Europe 962 66.9 1,004 65.3 4.3 2.4
Americas 198 13.7 228 14.8 15.2 21.7
Africa/Asia/Australia 278 19.4 305 19.9 9.8 7.7
Total 1,438 100.0 1,537 100.0 6.9 6.0
operating result (ebit) // in € million Jan. 1 – Mar. 31, 2009 Jan. 1 – Mar. 31, 2010 Change in %
% of sales % of sales nominal
Europe 133 13.8 158 15.7 18.4
Americas 5 2.5 19 8.4 -
Africa/Asia/Australia 7 2.5 9 3.0 30.2
Total 145 10.1 186 12.1 28.2
Figures in percent are calculated based on thousands of euros.
5
beier sdorf inter im rep or t january – m arch 2010
beier sdorf 's share s
Beiersdorf’s Shares
Following a sharp downturn, the global economy recovered again in the course of 2009 to record positive growth rates that stabilized at the beginning of 2010. Current indicators point to a continuing recovery; this return to growth is accounted for by the stimuli provided by monetary and financial policy as well as increased consumer confidence. Global labor market indicators also showed a more favorable trend in the first quarter, especially in the manufacturing sector. Over the past months, the global Purchasing Managers’ Index (PMI) continued to rise in seasonally adjusted terms; according to the most recent figures available total global trade volumes also rose further, particular in Latin America and Asia. Oil prices picked up markedly compared to their lows in the previous year due to more upbeat fundamentals and were in the USD 70 to 80 per barrel range; in the medium term, market players expect oil prices to continue to rise.
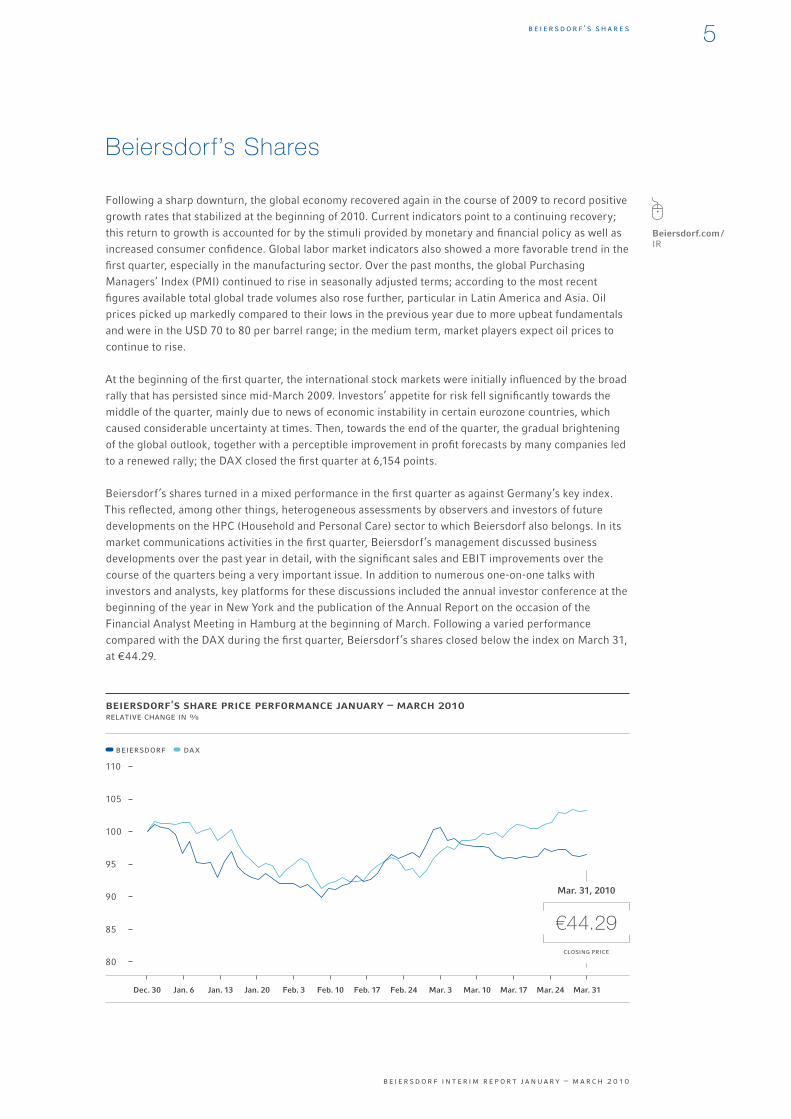
At the beginning of the first quarter, the international stock markets were initially influenced by the broad rally that has persisted since mid-March 2009. Investors’ appetite for risk fell significantly towards the middle of the quarter, mainly due to news of economic instability in certain eurozone countries, which caused considerable uncertainty at times. Then, towards the end of the quarter, the gradual brightening of the global outlook, together with a perceptible improvement in profit forecasts by many companies led to a renewed rally; the DAX closed the first quarter at 6,154 points.
Beiersdorf’s shares turned in a mixed performance in the first quarter as against Germany’s key index. This reflected, among other things, heterogeneous assessments by observers and investors of future developments on the HPC (Household and Personal Care) sector to which Beiersdorf also belongs. In its market communications activities in the first quarter, Beiersdorf’s management discussed business developments over the past year in detail, with the significant sales and EBIT improvements over the course of the quarters being a very important issue. In addition to numerous one-on-one talks with investors and analysts, key platforms for these discussions included the annual investor conference at the beginning of the year in New York and the publication of the Annual Report on the occasion of the Financial Analyst Meeting in Hamburg at the beginning of March. Following a varied performance compared with the DAX during the first quarter, Beiersdorf’s shares closed below the index on March 31, at €44.29.
Beiersdorf.com / IR
Dec. 30 Mar. 24 Mar. 31Feb. 24Jan. 20 Mar. 10Feb. 10Jan. 6 Mar. 17Feb. 17Jan. 13 Mar. 3Feb. 3
beiersdorf's share price performance january – march 2010 relative change in %
110
105
100
95
85
90
80closing price
Mar. 31, 2010
€44.29
beiersdorf dax

6
beier sdorf inter im rep or t january – m arch 2010
interim m anagement rep ort – group · re sult s of oper at ions – group
Results of Operations – Group
Interim Management Report – Group
» Sales growth (organic) of 6.0% » EBIT margin increases to 12.1%» Profit after tax rises to €122 million
In the first quarter Group sales organically increased by 6.0% compared to the previous year. The Consumer business segment registered organic growth of 4.0%, and tesa of 20.2%. Thus tesa was almost able to reach the sales level of 2008. At current exchange rates, sales were up 6.9% as against the previous year, and amounted to €1,537 million (previous year: €1,438 million).
income statement // in € million
Jan. 01 – Mar. 31, 2009 Jan. 01 – Mar. 31, 2010 Change in %
Sales 1,438 1,537 6.9
Cost of goods sold –459 –487 5.9
Gross profit 979 1,050 7.3
Marketing and selling expenses –712 –733 3.0
Research and development expenses –37 –37 –1.9
General and administrative expenses –70 –70 1.0
Other operating result –15 –24 -
Operating result (EBIT) 145 186 28.2
Financial result 3 –4 -
Profit before tax 148 182 22.5
Income taxes –48 –60 22.9
Profit after tax 100 122 22.3
Basic/diluted earnings per share (in €) 0.43 0.53 22.5
The operating result (EBIT) amounted to €186 million (previous year: €145 million). Corresponding EBIT margin was 12.1% (previous year: 10.1%).
The financial result amounted to –€4 million (previous year: €3 million). Development was mainlyinfluenced by the sharp decline in the interest rate level for financial investments as well as currency translation effects.
Profit after tax rose to €122 million (previous year: €100 million). The corresponding return on sales after tax was 7.9% (previous year: 6.9%).
Earnings per share were €0.53 on the basis of 226,818,984 shares (previous year: €0.43).

7
beier sdorf inter im rep or t january – m arch 2010
interim m anagement rep ort – group · re sult s of oper at ions – busine s s segment s
Results of Operations – Business Segments
Consumer» Consumer business segment up 4.0% on previous year» Consumer EBIT margin of 12.1%
consumer (jan. 1 – mar. 31)
Europe AmericasAfrica/Asia/
Australia Total
Sales 2010 (in € million) 855 204 269 1,328
Change (organic) (in %) 0.5 21.4 4.0 4.0
Change (adjusted for currency translation effects) (in %) 0.5 21.4 4.0 4.0
Change (nominal) (in %) 2.4 14.0 5.9 4.8
EBIT 2010 (in € million) 144 15 2 161
EBIT margin 2010 (in %) 16.8 7.6 0.7 12.1
EBIT 2009 (in € million) 135 4 5 144
EBIT margin 2009 (in %) 16.2 2.2 2.0 11.3
The first quarter saw organic sales growth of 4.0%. At current exchange rates, sales in the Consumer business segment reached €1,328 million, up 4.8% on the previous year (€1,267 million).
Global NIVEA sales rose by 3.6%. NIVEA Sun, NIVEA Deodorant, and NIVEA Bath Care in particu-lar generated high growth rates. Our La Prairie brand, which was hit particularly hard by the global economic crisis in the previous year, recovered noticeably, with sales growth of 16.8%. Eucerin re-corded clear double-digit growth of 13.8% in the first quarter. The launch of the Eucerin Aquaporin Active series was particularly encouraging here.
EBIT rose to €161 million (previous year: €144 million), while the EBIT margin was 12.1% (previous year: 11.3%).
8
beier sdorf inter im rep or t january – m arch 2010
interim m anagement rep ort – group · re sult s of oper at ions – busine s s segment s
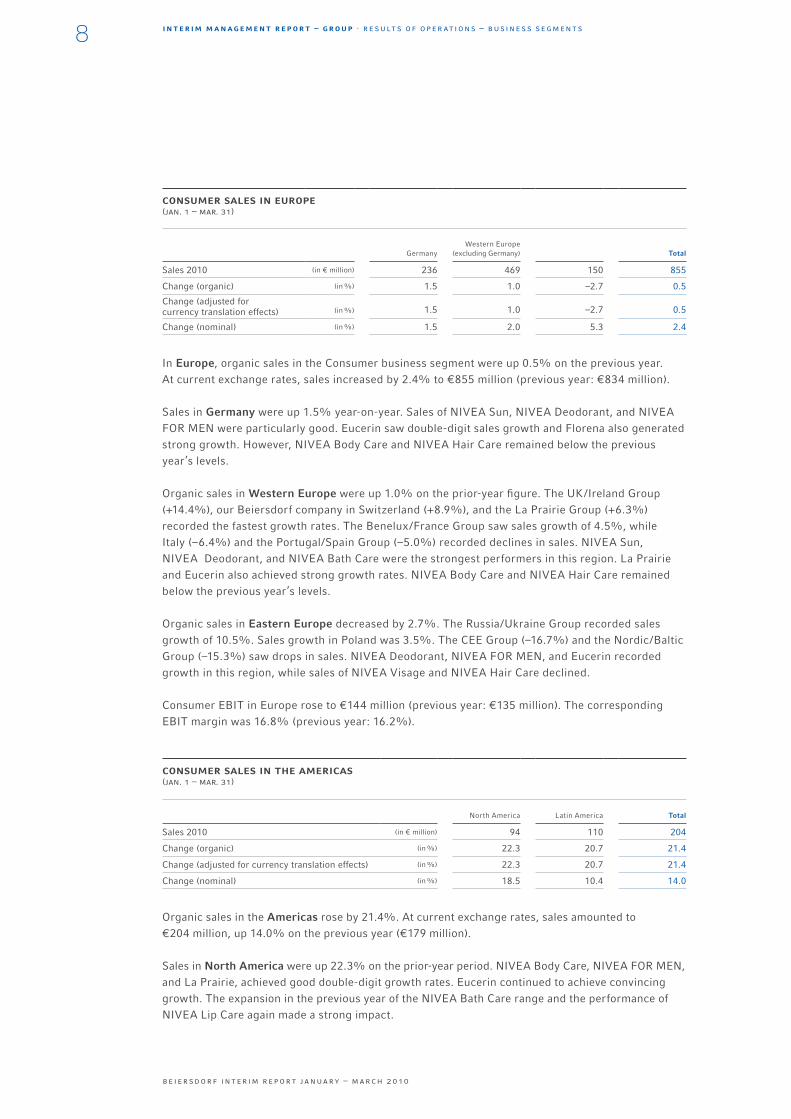
consumer sales in europe (jan. 1 – mar. 31)
GermanyWestern Europe
(excluding Germany) Total
Sales 2010 (in € million) 236 469 150 855
Change (organic) (in %) 1.5 1.0 –2.7 0.5
Change (adjusted for currency translation effects) (in %) 1.5 1.0 –2.7 0.5
Change (nominal) (in %) 1.5 2.0 5.3 2.4
In Europe, organic sales in the Consumer business segment were up 0.5% on the previous year. At current exchange rates, sales increased by 2.4% to €855 million (previous year: €834 million).
Sales in Germany were up 1.5% year-on-year. Sales of NIVEA Sun, NIVEA Deodorant, and NIVEA FOR MEN were particularly good. Eucerin saw double-digit sales growth and Florena also generated strong growth. However, NIVEA Body Care and NIVEA Hair Care remained below the previous year’s levels.
Organic sales in Western Europe were up 1.0% on the prior-year figure. The UK/Ireland Group (+14.4%), our Beiersdorf company in Switzerland (+8.9%), and the La Prairie Group (+6.3%) recorded the fastest growth rates. The Benelux/France Group saw sales growth of 4.5%, while Italy (–6.4%) and the Portugal/Spain Group (–5.0%) recorded declines in sales. NIVEA Sun, NIVEA Deodorant, and NIVEA Bath Care were the strongest performers in this region. La Prairie and Eucerin also achieved strong growth rates. NIVEA Body Care and NIVEA Hair Care remained below the previous year’s levels.
Organic sales in Eastern Europe decreased by 2.7%. The Russia/Ukraine Group recorded sales growth of 10.5%. Sales growth in Poland was 3.5%. The CEE Group (–16.7%) and the Nordic/Baltic Group (–15.3%) saw drops in sales. NIVEA Deodorant, NIVEA FOR MEN, and Eucerin recorded growth in this region, while sales of NIVEA Visage and NIVEA Hair Care declined.
Consumer EBIT in Europe rose to €144 million (previous year: €135 million). The corresponding EBIT margin was 16.8% (previous year: 16.2%).
consumer sales in the americas (jan. 1 – mar. 31)
North America Latin America Total
Sales 2010 (in € million) 94 110 204
Change (organic) (in %) 22.3 20.7 21.4
Change (adjusted for currency translation effects) (in %) 22.3 20.7 21.4
Change (nominal) (in %) 18.5 10.4 14.0
Organic sales in the Americas rose by 21.4%. At current exchange rates, sales amounted to €204 million, up 14.0% on the previous year (€179 million).
Sales in North America were up 22.3% on the prior-year period. NIVEA Body Care, NIVEA FOR MEN, and La Prairie, achieved good double-digit growth rates. Eucerin continued to achieve convincing growth. The expansion in the previous year of the NIVEA Bath Care range and the performance of NIVEA Lip Care again made a strong impact.

9
beier sdorf inter im rep or t january – m arch 2010
interim m anagement rep ort – group · re sult s of oper at ions – busine s s segment s
Latin America saw organic sales growth of 20.7%. The Andean Group, Argentina, and Chile contrib- uted to this positive performance with clear double-digit growth rates. Sales growth in Mexico was 6.3%. NIVEA Deodorant, NIVEA Body Care, and NIVEA Sun performed particularly well in this key region.
Consumer EBIT in the Americas was €15 million (previous year: €4 million). The EBIT margin in- creased to 7.6% (previous year: 2.2%).
consumer sales in africa/asia/australia (jan. 1. – mar 31.)
Total
Sales 2010 (in € million) 269
Change (organic) (in %) 4.0
Change (adjusted for currency translation effects) (in %) 4.0
Change (nominal) (in %) 5.9
The Africa/Asia/Australia region recorded organic growth of 4.0%. At current exchange rates, sales amounted to €269 million, up 5.9% on the previous year (€254 million).
NIVEA Sun, NIVEA FOR MEN, and our Chinese hair care brand SLEK recorded the fastest growth in this region. Our companies in the Middle East (+23.4%) and in Thailand (+10.1%) performed very well here. The China Group recorded sales growth of 4.5%. However, Australia remained below the previous year's level showing a decline in sales of –8,4%. In the Middle East, NIVEA Deodorant and NIVEA Body Care made a particular contribution to sales growth. In Thailand, NIVEA FOR MEN, NIVEA Sun, and Eucerin were particularly successful. Sales in Japan were down 1.8% on the previ-ous year; the strong growth achieved by NIVEA Sun was unable to completely offset the decline in sales of 8x4 and NIVEA Body Care.
EBIT in this region continued to be impacted by substantial marketing investments in the Chinese hair care business. EBIT amounted to €2 million (previous year: €5 million). The EBIT margin was 0.7% (previous year: 2.0%).

10
beier sdorf inter im rep or t january – m arch 2010
interim m anagement rep ort – group · re sult s of oper at ions – busine s s segment s
tesa (jan. 1 – mar. 31)
Europe AmericasAfrica/Asia/
Australia Total
Sales 2010 (in € million) 149 24 36 209
Change (organic) (in %) 14.6 24.6 47.7 20.2
Change (adjusted for currency translation effects) (in %) 14.6 24.6 47.7 20.2
Change (nominal) (in %) 16.8 26.8 50.9 22.7
EBIT 2010 (in € million) 14 4 7 25
EBIT margin 2010 (in %) 9.2 15.7 20.4 11.9
EBIT 2009 (in € million) –2 1 2 1
EBIT margin 2009 (in %) –1.4 4.7 8.8 0.7
The tesa business segment generated organic sales growth of 20.2% in the first quarter of 2010; however, the first quarter of the previous year was extremely weak due to the effects of the global economic crisis. At current exchange rates, tesa’s sales increased by 22.7% to €209 million (previous year: €171 million).
In the first three months of this year, tesa continued its positive performance of the second half of 2009. The industry segment in particular recorded substantial sales growth from customers in the automotive and electrical industries. Sales in the consumer business, which experienced only a slight drop in 2009, rose slightly.
This positive performance was achieved in all regions. Due to the disproportionately high sales increase in the first quarter EBIT in the tesa business segment rose to €25 million (previous year: €1 million), while the EBIT margin amounted to 11.9% (previous year: 0.7%).
tesa» tesa business segment reports sales growth of 20.2%» tesa EBIT margin therefore increased to 11.9%
tesa.com

11
beier sdorf inter im rep or t january – m arch 2010
interim m anagement rep ort – group · bal ance shee t s truc t ure – group
Balance Sheet Structure – Group
balance sheet // in € million
Assets Dec. 31, 2009 Mar. 31, 2009 Mar. 31, 2010
Non-current assets 1,177 1,187 1,202
Inventories 561 653 637
Other current assets 2,089 2,310 2,314
Cash and cash equivalents 767 479 882
4,594 4,629 5,035
Equity and liabilities Dec. 31, 2009 Mar. 31, 2009 Mar. 31, 2010
Equity 2,636 2,557 2,801
Non-current liabilities 532 554 524
Current liabilities 1,426 1,518 1,710
4,594 4,629 5,035
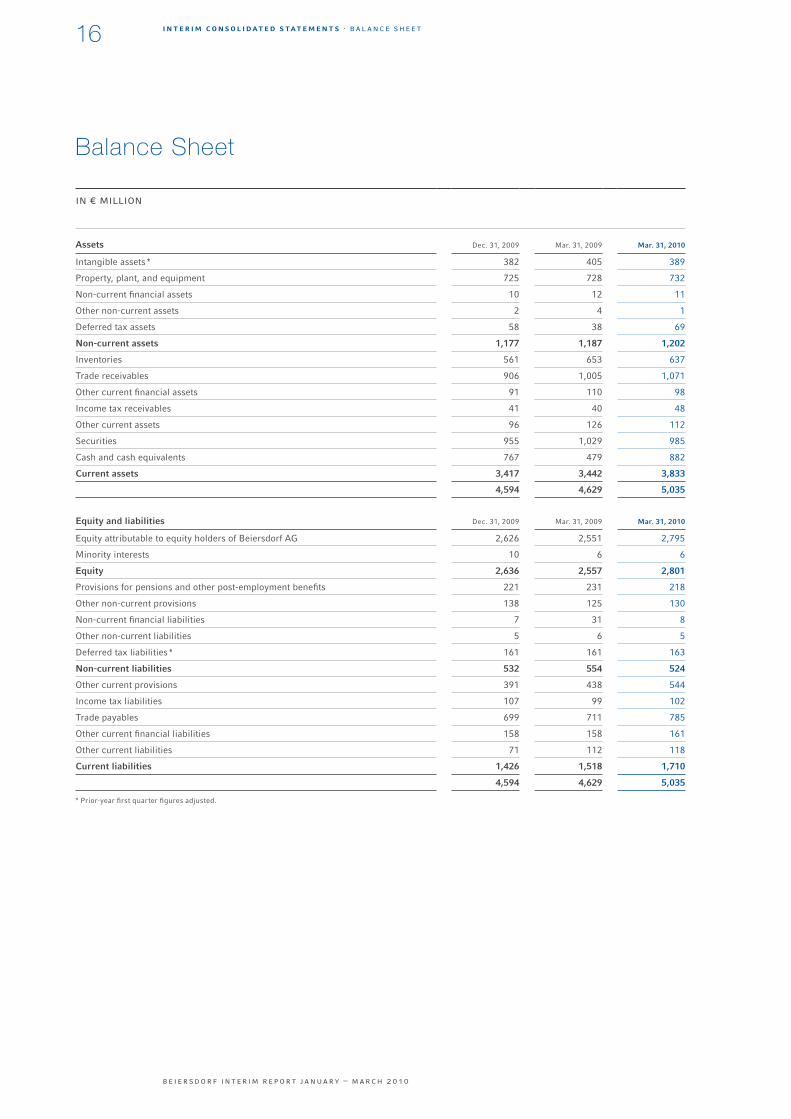
Non-current assets increased by €25 million as against the figure for December 31, 2009, to €1,202 mil- lion, primarily caused by deferred taxes and exchange rate effects at non-current assets. Capital expenditure in the first quarter of 2010 amounted to €17 million (previous year: €27 million). €11 million of this figure was attributable to the Consumer business segment (previous year: €18 million) and €6 million to tesa (previous year: €9 million). Inventories rose by €76 million as against the end of the year to €637 million, due to seasonal factors. Other current assets climbed to €2,314 million. Trade receivables increased in particular compared to the year-end due to seasonal factors.
Non-current liabilities decreased by €30 million compared to the prior-year quarter. This is primarily caused by the reclassification of the second tranche of the option to purchase the minority interests in C-BONS Hair Care Group under current financial liabilities. Additional reasons for the growth in current liabilities were the increase in current provisions due to operational factors and the increase in trade payables.
Mar. 31, 2009 3355
Mar. 31, 2010 3456
Dec. 31, 2009 3157
equity non-current liabilities current liabilities
financing structure // in %
12
10
12

12
beier sdorf inter im rep or t january – m arch 2010
interim m anagement rep ort – group · f inancial p os it ion – group · employ ee s
Financial Position – Group
Employees
cash flow statement // in € million
Jan. 1 – Mar. 31, 2009 Jan. 1 – Mar. 31, 2010
Gross cash flow 117 132
Change in working capital –45 33
Net cash flow from operating activities 72 165
Net cash flow from investing activities –144 –35
Free cash flow –72 130
Net cash flow from financing activities –67 –28
Other changes 5 13
Net change in cash and cash equivalents –134 115
Cash and cash equivalents as of Jan. 1 613 767
Cash and cash equivalents as of Mar. 31 479 882
Gross cash flow reached €132 million. The cash inflow from the change in working capital amoun-ted to €33 million. The increases in receivables of €177 million and in inventories of €76 million were partially matched by a €286 million rise in liabilities and provisions. Overall, the net cash flow from operating activities totaled €165 million. The net cash outflow from investing activities was €35 mil lion. Capital expenditure of €17 million and the balance of purchases and sales of securities of €28 million were faced by €9 million in interest income and other cash inflows. Free cash flow amounted to €130 million. The net cash outflow from financing activities in the amount of €28 mil-lion was mainly due to loan repayments. Cash and cash equivalents reached to €882 million.
The number of employees grew by 382 compared with the figure on December 31, 2009, to 20,728. As of March 31, 17,042 employees worked in the Consumer business segment and 3,686 at tesa.
Beiersdorf.com / Career
Americas10.7
Europe51.8
Africa / Asia / Australia37.5
employees by region // in % as of march 31, 2010; total 20,728 employees

13
beier sdorf inter im rep or t january – m arch 2010
interim m anagement rep ort – group · other disclosure s · opp or t unit ie s and r isk s
Other Disclosures
Beiersdorf reorganizesBeiersdorf’s Executive Board has reorganized itself effective May 1, 2010 creating three functional and three regional areas of responsibility. Under the new structure, Thomas-B. Quaas will remain the Chairman of the Executive Board, while Executive Board member Pieter Nota will continue to be responsible for Marketing and Innovations. Dr. Bernhard Düttmann will remain the CFO but will also take on responsibility for Human Resources. Markus Pinger will assume responsibility for the Ameri- cas region and will continue to be responsible for the global Supply Chain. James C. Wei will lead the Asia region. A new Executive Board member will be appointed for Europe. Peter Kleinschmidt, the Executive Board member previously responsible for Human Resources and Sustainability, left the Company on April 30, 2010 after 25 years’ successful service with Beiersdorf.
Opportunities and Risks
For more information on opportunities and risks, please refer to our Risk Report in the Group Man- agement Report as of December 31, 2009. In addition, the following information must be reported:
Along with other companies, affiliates of the Beiersdorf Group in Belgium, Germany, France, the United Kingdom, the Netherlands, Switzerland, and Italy are involved in antitrust proceedings relat- ing to cosmetic products on a national level. Statements of objections have been issued in Germany, the Netherlands, and Italy. At present no reliable, comprehensive assessment of the overall risk is possible from the Group's perspective.

14
beier sdorf inter im rep or t january – m arch 2010
interim m anagement rep ort – group · ou tlook for 2010
Outlook for 2010
Expected Macroeconomic DevelopmentsAssessing economic developments for 2010 remains subject to uncertainty. However, signs of re-covery were already visible in the first quarter. In view of this, our planning assumes that the global economy will stabilize. We expect to see slight growth again in the United States, Western Europe, and Germany. We believe that the pace of growth will pick up again in the growth regions of Asia (excluding Japan), Eastern Europe, and Latin America, but that it will not yet reach its previous levels.
In our opinion, the global cosmetics market will improve again in 2010, but will remain below the long-term trend. We are anticipating a slight recovery in the major saturated Western European markets. The North American market is likely to be flat at best. Growth will probably pick up again in Eastern Europe. Asia and Latin America will remain the strongest growth regions.
We expect the trend towards economic recovery in tesa's industrial markets to continue. We antici-pate that demand in tesa’s consumer business will fall slightly in a delayed reaction to the crisis. We believe that Asia, Latin America, and Eastern Europe will return to their pre-crisis trends, while the recovery process in Western Europe and North America will last several years and be at a significant-ly lower level.
Business DevelopmentsFor full-year 2010, the Beiersdorf Group aims to generate organic growth in excess of the market. We aim to increase the EBIT margin to above 11% again.
The goal for the Consumer business segment in 2010 is for organic growth to outperform the market. We continue to see China, Russia, and Brazil as particularly important here. We believe that these fast-growing markets offer good opportunities to further increase our market share. In China in particular, we will continue to promote sales growth of our Chinese hair care and styling brands by investing heavily in marketing. We aim to generate an EBIT margin clearly above 11%.
tesa expects sales growth to exceed the market in a gradually recovering economic environment that is nevertheless still plagued by uncertainty. We believe that the Company’s overall market position is extremely stable. We shall drive forward our innovation projects at high speed so as to further expand our market position. Based on the measures introduced and implemented in 2009 to preserve EBIT, we are aiming for an EBIT margin of slightly above 8%.
Hamburg, May 2010
Beiersdorf AG
The Executive Board

15
beier sdorf inter im rep or t january – m arch 2010
interim consolidated statements · income s tatement · s tatement of comprehensive income
Interim Consolidated Financial Statements
Statement of Comprehensive Income
in € million
Jan. 1 – Mar. 31, 2009 Jan. 1 – Mar. 31, 2010
Sales 1,438 1,537
Cost of goods sold –459 –487
Gross profit 979 1,050
Marketing and selling expenses –712 –733
Research and development expenses –37 –37
General and administrative expenses –70 –70
Other operating result –15 –24
Operating result (EBIT) 145 186
Financial result 3 –4
Profit before tax 148 182
Income taxes –48 –60
Profit after tax 100 122
Profit attributable to equity holders 99 120
Profit attributable to minority interests 1 2
Basic/diluted earnings per share (in €) 0.43 0.53
Income Statement
in € million
Jan. 1 – Mar. 31, 2009 Jan. 1 – Mar. 31, 2010
Profit after tax 100 122
Remeasurement gains and losses on cash flow hedges –6 –15
Deferred taxes on remeasurement gains and losses on cash flow hedges 2 5
Remeasurement gains and losses on cash flow hedges recognized in other comprehensive income –4 –10
Remeasurement gains and losses on available-for-sale financial assets 1 -
Deferred taxes on remeasurement gains and losses on available-for-sale financial assets - -
Remeasurement gains and losses on available-for-sale financial assets recognized in other comprehensive income 1 -
Exchange differences 5 59
Other items recognized in other comprehensive income - -
Deferred taxes on other items recognized in other comprehensive income - -
Remeasurement gains and losses on other items recognized in other comprehensive income - -
Other comprehensive income net of tax 2 49
Total comprehensive income 102 171
Of which attributable to
– Equity holders of Beiersdorf AG 101 169
– Minority interests 1 2
16
beier sdorf inter im rep or t january – m arch 2010
interim consolidated statements · bal ance shee t
Balance Sheet
in € million
Assets Dec. 31, 2009 Mar. 31, 2009 Mar. 31, 2010
Intangible assets * 382 405 389
Property, plant, and equipment 725 728 732
Non-current financial assets 10 12 11
Other non-current assets 2 4 1
Deferred tax assets 58 38 69
Non-current assets 1,177 1,187 1,202
Inventories 561 653 637
Trade receivables 906 1,005 1,071
Other current financial assets 91 110 98
Income tax receivables 41 40 48
Other current assets 96 126 112
Securities 955 1,029 985
Cash and cash equivalents 767 479 882
Current assets 3,417 3,442 3,833
4,594 4,629 5,035
Equity and liabilities Dec. 31, 2009 Mar. 31, 2009 Mar. 31, 2010
Equity attributable to equity holders of Beiersdorf AG 2,626 2,551 2,795
Minority interests 10 6 6
Equity 2,636 2,557 2,801
Provisions for pensions and other post-employment benefits 221 231 218
Other non-current provisions 138 125 130
Non-current financial liabilities 7 31 8
Other non-current liabilities 5 6 5
Deferred tax liabilities * 161 161 163
Non-current liabilities 532 554 524
Other current provisions 391 438 544
Income tax liabilities 107 99 102
Trade payables 699 711 785
Other current financial liabilities 158 158 161
Other current liabilities 71 112 118
Current liabilities 1,426 1,518 1,710
4,594 4,629 5,035
* Prior-year first quarter figures adjusted.

17
beier sdorf inter im rep or t january – m arch 2010
interim consolidated statements · c a sh flow s tatement
Cash Flow Statement
in € million
Jan. 1 – Mar. 31, 2009 Jan. 1 – Mar. 31, 2010
Operating result (EBIT) 145 186
Income taxes paid –46 –73
Depreciation and amortization 27 30
Change in non-current provisions (excluding interest) –9 –11
Gain/loss on disposal of property, plant, and equipment, and intangible assets - -
Gross cash flow 117 132
Change in inventories –18 –76
Change in receivables and other assets –155 –177
Change in liabilities and current provisions 128 286
Net cash flow from operating activities 72 165
Investments –27 –17
Proceeds from divestments 2 1
Payments for the purchase of securities –141 –98
Proceeds from the sale of securities 10 70
Interest received 8 5
Proceeds from dividends and other financing activities 4 4
Net cash flow from investing activities –144 –35
Free cash flow –72 130
Proceeds from loans 56 27
Loan repayments –109 –38
Interest paid –3 –2
Other financing expenses paid –11 –15
Net cash flow from financing activities –67 –28
Effect of exchange rate fluctuations and other changes on cash held 5 13
Net change in cash and cash equivalents –134 115
Cash and cash equivalents as of Jan. 1 613 767
Cash and cash equivalents as of Mar. 31 479 882

18
beier sdorf inter im rep or t january – m arch 2010
interim consolidated statements · s tatement of change s in equit y
Statement of Changes in Equity
in € million
Accumulated other consolidated income
Share capital
Additional paid-in capital
Retained earnings*
Currency translation adjustment
Hedging instruments
from cash flow hedges
Available-for-sale
financial assets
Total attributable
to equity holders of
Beiersdorf AG
Minority interests Total
Jan. 1, 2009 252 47 2,280 –154 21 4 2,450 10 2,460
Total earnings for the period - - 99 5 –4 1 101 1 102
Dividend of Beiersdorf AG for previous year - - - - - - - - -
Dividend of minority interests for previous year - - - - - - - –5 –5Mar. 31, 2009 252 47 2,379 –149 17 5 2,551 6 2,557
Jan. 1, 2010 252 47 2,450 –127 –1 5 2,626 10 2,636
Total earnings for the period - - 120 59 –10 - 169 2 171
Dividend of Beiersdorf AG for previous year - - - - - - - - -
Dividend of minority interests for previous year - - - - - - - –6 –6Mar. 31, 2010 252 47 2,570 –68 –11 5 2,795 6 2,801
* The cost of treasury shares amounting to €955 million has been deducted from retained earnings.
19
beier sdorf inter im rep or t january – m arch 2010
interim consolidated statements · selec ted e xpl anatory note s
Selected Explanatory Notes
Information on the Company and on the GroupThe registered office of Beiersdorf AG is at Unnastrasse 48 in Hamburg (Germany) and the Company is registered with the commercial register of the Hamburg Local Court under the number HRB 1787. The ultimate parent of the Company is maxingvest ag. The activities of Beiersdorf AG and its affili- ates (“Beiersdorf Group”) consist primarily of the manufacture and distribution of branded consu-mer goods in the areas of skin and beauty care, and of the manufacture and distribution of technical adhesive tapes.
Basis of PreparationThe interim consolidated financial statements for the period from January 1 to March 31, 2010 were prepared in accordance with IAS 34 “Interim Financial Reporting.” The interim consolidated financial statements should be read in conjunction with the consolidated financial statements as of December 31, 2009.
Accounting PoliciesThe figures disclosed in this interim report were prepared in accordance with International Financial Reporting Standards (IFRSs). The same accounting policies were used in the interim consolidated financial statements as in the annual consolidated financial statements for 2009. The interim report was not audited or reviewed.
Related Party DisclosuresPlease refer to the consolidated financial statements as of December 31, 2009 for related party dis-closures. There were no significant changes as of March 31, 2010.
Corporate GovernanceThe declaration of compliance issued by the Supervisory Board and the Executive Board for fiscal year 2009 regarding the recommendations of the German Corporate Governance Code in accord-ance with § 161 Aktiengesetz (German Stock Corporation Act) was published at the end of December 2009 and is permanently available on our website at www.Beiersdorf.com/Corporate_Governance.
Events After the Balance Sheet DateNo significant events occurred after the balance sheet date that would have a material effect on the Beiersdorf Group’s business developments.
Hamburg, May 2010
Beiersdorf AG
The Executive Board

Financial Calendar
August 5, 2010 Interim Report January to June 2010
November 4, 2010 Interim Report January to September 2010, Financial Analyst Meeting
January 2011 Publication of Preliminary Group Results
February/March 2011 Publication of Annual Report 2010, Annual Accounts Press Conference, Financial Analyst Meeting
April 21, 2011 Annual General Meeting
May 2011 Interim Report January to March 2011
August 2011 Interim Report January to June 2011
November 2011 Interim Report January to September 2011, Financial Analyst Meeting
Contact Information
editorial office and concept
Corporate Identity:Telephone: +49 40 4909-2102, E-mail: [email protected]
published by
Beiersdorf Aktiengesellschaft Unnastrasse 48, 20245 Hamburg,Germany
The Interim Report is also available in German and a digital version is available on the Internet at www.Beiersdorf.com/interim_report.
additional information
Corporate Media Relations: Telephone: +49 40 4909-3077, E-mail: [email protected]
Investor Relations: Telephone: +49 40 4909-5000, E-mail: [email protected]
Beiersdorf on the Internet: www.Beiersdorf.com