interim report january–september 2016 - uponor...3 i 28 october 2016 i interim report january –...
TRANSCRIPT

Interim report January–September 2016 28 October 2016

2 I 28 October 2016 I Interim report January – September 2016
INTERIM REPORT JANUARY – SEPTEMBER 2016 Uponor improved performance in Europe, the North American segment suffered from supply issues • Modest growth in net sales and operating profit in Building Solutions - Europe and in Uponor Infra, while
growth in Building Solutions – North America decelerated and profit remained below prior year
• Net sales for July – September totalled €284.1 (274.1) million, up 3.6% or 4.3% in constant currency
• Operating profit for July – September came to €25.1 (23.6) million, a change of 6.0%; comparable operating profit(* came to €29.0 (24.6) million, an increase of 17.7%
• Net sales in January – September totalled €830.5 (788.8) million, up 5.3% or 6.5% in constant currency
• Operating profit for January – September came to €63.5 (57.4) million, a change of 10.5%; comparable operating profit amounted to €74.6 (59.2) million, up by 25.9%
• January – September earnings per share amounted to €0.47 (0.44)
• January – September return on investment was 16.9% (17.3%), and gearing at the end of September was 56.6% (37.9%)
• January – September cash flow from business operations totalled €22.0 (17.0) million
• Uponor repeats its guidance for the year 2016, announced on 12 February 2016: Assuming that economic development in Uponor's key geographies otherwise continues undisturbed, the Group’s net sales and comparable operating profit are expected to improve from 2015.
*) Comparable operating profit excludes items affecting comparability (IAC) President and CEO Jyri Luomakoski comments on developments during the quarter: • Our European building solutions segment faced a softer third quarter in terms of organic top line
development, but the transformation programme initiated in Q4/2015 helped to improve the comparable operating profit, confirming the relevance of the transformation. The programme has progressed well and we estimate that the final measures will be completed during Q1/2017.
• Building Solutions - North America suffered from fittings resin supply shortages, which added to the cost burdens of the business. The underlying market growth of the PEX pipe continued to be solid in both the residential and commercial markets throughout the quarter.
• I am delighted to see the turnaround in Uponor Infra, which after a series of cost reduction programmes and continued weak demand in the Nordic countries, again reports a clear comparable operating profit improvement. We have also started a cost reduction and operational improvement programme in Canada to further improve the overall performance of Uponor Infra.

3 I 28 October 2016 I Interim report January – September 2016
Key financial figures
Consolidated income statement (continuing operations), M€
1-9 2016
1-9 2015
2015 2014 2013 2012
Net sales 830.5 788.8 1,050.8 1,023.9 906.0 811.5 Operating expenses 737.8 705.0 942.7 926.4 823.6 726.5 Depreciation and impairments 31.6 27.3 39.1 36.5 33.0 28.2 Other operating income 2.4 0.9 2.4 2.4 0.8 0.9 Operating profit 63.5 57.4 71.4 63.4 50.2 57.7 Comparable operating profit 74.6 59.2 75.8 67.7 55.2 57.7 Financial income and expenses -7.2 -5.7 -8.9 -7.4 -7.1 -8.6 Profit before taxes 56.5 51.9 62.8 56.3 43.2 49.4 Result from continuing operations 35.6 32.7 37.1 36.3 27.1 32.9 Profit for the period 36.0 32.4 36.9 36.0 26.8 32.8 Earnings per share 0.47 0.44 0.51 0.50 0.38 0.45
Information on the January–September 2016 interim report This interim report has been compiled in accordance with the IAS 34 reporting standard and is unaudited. Figures given in the report are for continuing operations, unless otherwise stated. Any change percentages have been calculated from the exact figures and not from the rounded figures published here. Uponor follows the new recommendation from the European Securities and Markets Authority (ESMA) concerning Alternative Performance Measures. Thus, the term “non-recurring items” (NRI) has been changed to “items affecting comparability” (IAC). See the table section for more details. Webcast and presentation A webcast, in English, of the results briefing will be broadcast on 28 October at 10:00 a.m. EET. Connection details are available at www.uponor.com > Investors. Questions can be sent in advance to [email protected]. The recorded webcast can be viewed at www.uponor.com > Investors shortly after publication. The presentation document will be available at www.uponor.com > Investors > News & downloads. The next results report Uponor Corporation will publish its financial statements 2016 bulletin on Monday 13 February 2017. During the silent period from 1 January to 13 February 2017, Uponor will not comment on market prospects or factors affecting business and performance, nor will the company engage in any discussion of events or trends related to the reporting period or the current fiscal period.

4 I 28 October 2016 I Interim report January – September 2016
Markets Construction activity in Europe continued to strengthen in the third quarter, albeit from a low base. In North America, construction activity remained healthy in general, but the substantial increase against the previous year, as witnessed during earlier quarters, turned out to be weaker in the third quarter. In Central Europe, Germany has continued to benefit from consumer-driven expansion in the economy. A strong labour market and low mortgage rates have translated into higher demand for residential buildings, leading to a significant increase in residential building permits and several all-time-high builder confidence survey results. The non-residential segment has remained healthy, but external political and economic uncertainties are causing hesitancy amongst businesses about the initiation of new projects. In the Netherlands, construction activity has moderated. In Southern Europe, construction activity in Spain and France has made some gains from a low base, while the Italian market continues to be challenging. In the UK, the fallout from the EU referendum has thus far been muted. Within the Nordic countries, construction activity has continued to trend upward. Sweden’s residential boom continues, with starts over the last 12 months reaching their highest level since the early 1990’s. In Finland, the market remains weak, but building permit figures and construction volumes indicate that the slight improvements noted earlier in the year have been sustained. In North America, residential and non-residential construction remain largely healthy, but the substantial year-over-year gains witnessed during the quarters since the recovery began were no longer materialising in the third quarter. Rather, housing starts and construction spending were largely in line with the same period in 2015. With regard to Uponor’s infrastructure solutions, demand in the Nordic markets was stable on the whole, with demand in Sweden and Norway improving somewhat. The markets in Poland and other central-eastern Europe remained subdued, lacking EU funding. Depressed energy prices continue to restrain oil-related investments in Canada, which is also negatively impacting on the infrastructure business in other market segments. Net sales Uponor’s continuing operations reported net sales of €284.1 (274.1) million for the third quarter, entailing growth of 3.6%, or 0.4% in organic terms, i.e. excluding any divestments and acquisitions. The impact of currency changes versus the same period last year was -€1.9 million. Building Solutions – Europe’s net sales grew due to the acquisitions made in January 2016, but organic net sales in the third quarter declined slightly. The main reasons for the decline were a lower relative share of single-family buildings in contrast to flats in the sales mix, a softer commercial building market - especially in Germany, and tight competition from private label offerings, particularly in the lower price–performance categories. Weakening market demand witnessed in the Netherlands also impacted on net sales development. Net sales developed favourably in some other key markets, such as Finland, the UK and Russia. In Building Solutions – North America, growth in net sales was modest compared to several previous quarters, reflecting a more stable housing market in the U.S., in contrast to the strong growth that prevailed in 2015. In the U.S., sales of the commercial product offering in particular developed favourably, while residential sales fluctuated. Sales development was also affected by the engineered polymer resin shortage, which created challenges in the supply of plastic fittings since it started in 2015. Demand also weakened in Canada and net sales there remained slightly below those of the comparison period.

5 I 28 October 2016 I Interim report January – September 2016
Uponor Infra reported top line growth, mainly originating in the Nordic countries, while the continued weak market situation in Central and Eastern Europe and North America had a negative impact on net sales development. Breakdown of net sales by segment (July–September): M€ 7-9/2016 7-9/2015 Change Building Solutions – Europe 127.4 121.2 5.1% Building Solutions – North America 77.5 75.1 3.1% (Building Solutions – North America (M$) 86.2 83.6 3.2%) Uponor Infra 80.8 79.0 2.3% Eliminations -1.6 -1.2 Total 284.1 274.1 3.6%
Uponor’s January–September net sales came to €830.5 (788.8) million, achieving growth of 5.3%, or 2.6% in organic terms. This was mainly driven by the strong growth in Building Solutions - North America throughout the first half of the year. The currency impact on year-to-date net sales, versus last year, totalled -€9.4 million, mainly based on the CAD, GBP and RUB. Breakdown of net sales by segment (January–September): M€ 1-9/2016 1-9/2015 Change Building Solutions – Europe 385.2 352.8 9.2% Building Solutions – North America 228.4 201.8 13.2% (Building Solutions – North America (M$) 254.4 224.4 13.4%) Uponor Infra 220.7 237.0 -6.9% Eliminations -3.8 -2.8 Total 830.5 788.8 5.3%
Results and profitability Uponor’s operating profit in the third quarter came to €25.1 (23.6) million, representing a change of 6.0%. Profitability measured in terms of the operating profit margin reached 8.8% (8.6%). Comparable operating profit, i.e. excluding any items affecting comparability, came to €29.0 (24.6) million in the quarter under review, showing an increase of 17.7%. Thus, the comparable operating profit margin reached 10.2 (9.0) per cent. Building Solutions – Europe’s operating profit improved somewhat, partly as a result of an increase in net sales as well as the savings generated by the transformation programme. Plastic raw material availability and pricing were more predictable than in the previous year, which helped planning and production efficiency development. The segment’s operating profit includes a total of €0.9 million in items affecting comparability, which in the comparison period amounted to €1.0 million. Building Solutions – North America’s operating profit declined somewhat in the third quarter. Despite being down versus last year, at 16.0% Building Solutions – North America’s profitability remained at a high level as a percentage of net sales. The segment has been growing its plumbing business, including plastic fittings, during H2/2015 outpacing the supply of engineered polymer resin which is used to produce the fittings. In order to secure customer satisfaction, Uponor’s first response was to offer certain high-volume items in lead-free brass, which has a higher cost and is therefore less attractive to the customer. For Uponor, these sourced items also generate lower gross margins compared to plastic fittings, in which our manufacturing
6 I 28 October 2016 I Interim report January – September 2016
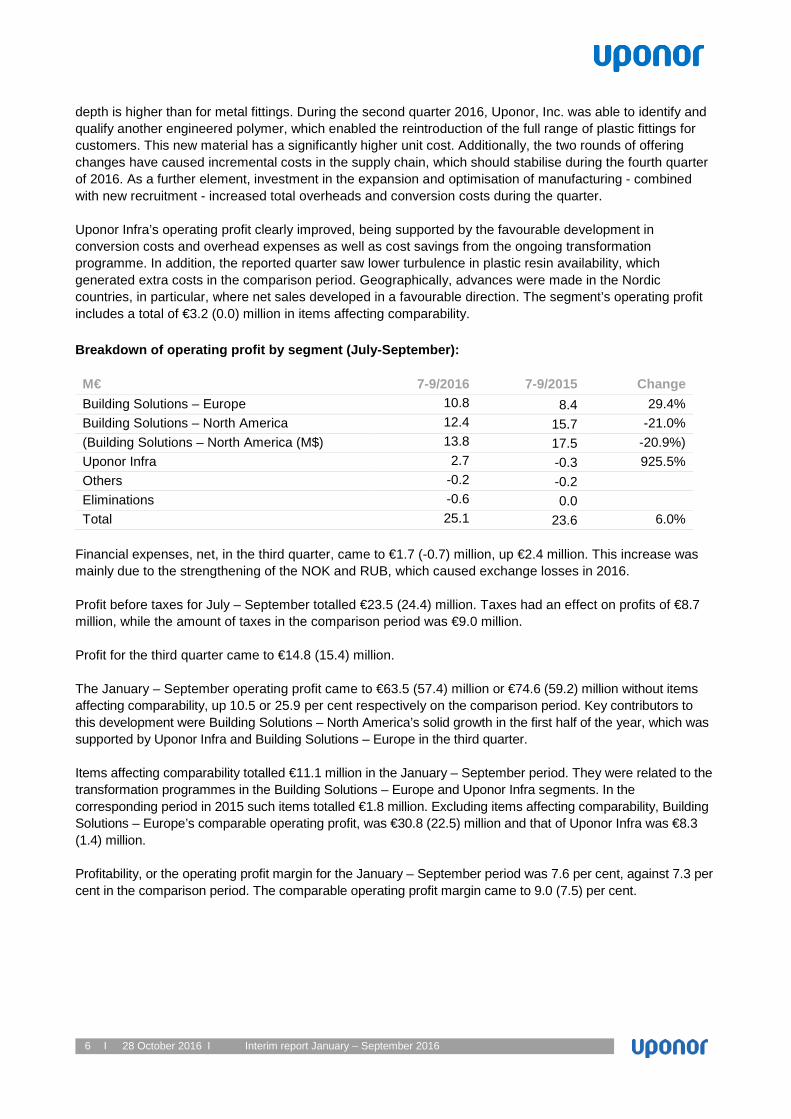
depth is higher than for metal fittings. During the second quarter 2016, Uponor, Inc. was able to identify and qualify another engineered polymer, which enabled the reintroduction of the full range of plastic fittings for customers. This new material has a significantly higher unit cost. Additionally, the two rounds of offering changes have caused incremental costs in the supply chain, which should stabilise during the fourth quarter of 2016. As a further element, investment in the expansion and optimisation of manufacturing - combined with new recruitment - increased total overheads and conversion costs during the quarter. Uponor Infra’s operating profit clearly improved, being supported by the favourable development in conversion costs and overhead expenses as well as cost savings from the ongoing transformation programme. In addition, the reported quarter saw lower turbulence in plastic resin availability, which generated extra costs in the comparison period. Geographically, advances were made in the Nordic countries, in particular, where net sales developed in a favourable direction. The segment’s operating profit includes a total of €3.2 (0.0) million in items affecting comparability. Breakdown of operating profit by segment (July-September): M€ 7-9/2016 7-9/2015 Change Building Solutions – Europe 10.8 8.4 29.4% Building Solutions – North America 12.4 15.7 -21.0% (Building Solutions – North America (M$) 13.8 17.5 -20.9%) Uponor Infra 2.7 -0.3 925.5% Others -0.2 -0.2 Eliminations -0.6 0.0 Total 25.1 23.6 6.0%
Financial expenses, net, in the third quarter, came to €1.7 (-0.7) million, up €2.4 million. This increase was mainly due to the strengthening of the NOK and RUB, which caused exchange losses in 2016. Profit before taxes for July – September totalled €23.5 (24.4) million. Taxes had an effect on profits of €8.7 million, while the amount of taxes in the comparison period was €9.0 million. Profit for the third quarter came to €14.8 (15.4) million. The January – September operating profit came to €63.5 (57.4) million or €74.6 (59.2) million without items affecting comparability, up 10.5 or 25.9 per cent respectively on the comparison period. Key contributors to this development were Building Solutions – North America’s solid growth in the first half of the year, which was supported by Uponor Infra and Building Solutions – Europe in the third quarter. Items affecting comparability totalled €11.1 million in the January – September period. They were related to the transformation programmes in the Building Solutions – Europe and Uponor Infra segments. In the corresponding period in 2015 such items totalled €1.8 million. Excluding items affecting comparability, Building Solutions – Europe’s comparable operating profit, was €30.8 (22.5) million and that of Uponor Infra was €8.3 (1.4) million. Profitability, or the operating profit margin for the January – September period was 7.6 per cent, against 7.3 per cent in the comparison period. The comparable operating profit margin came to 9.0 (7.5) per cent.
7 I 28 October 2016 I Interim report January – September 2016
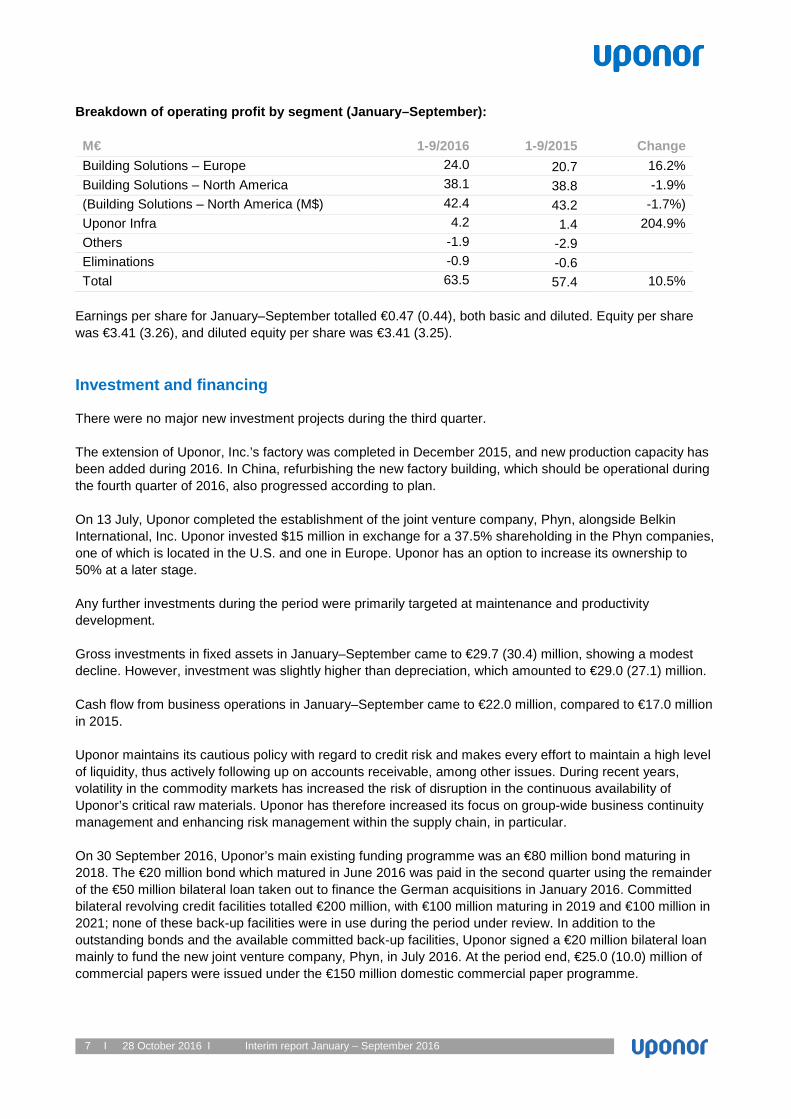
Breakdown of operating profit by segment (January–September): M€ 1-9/2016 1-9/2015 Change Building Solutions – Europe 24.0 20.7 16.2% Building Solutions – North America 38.1 38.8 -1.9% (Building Solutions – North America (M$) 42.4 43.2 -1.7%) Uponor Infra 4.2 1.4 204.9% Others -1.9 -2.9 Eliminations -0.9 -0.6 Total 63.5 57.4 10.5%
Earnings per share for January–September totalled €0.47 (0.44), both basic and diluted. Equity per share was €3.41 (3.26), and diluted equity per share was €3.41 (3.25). Investment and financing There were no major new investment projects during the third quarter. The extension of Uponor, Inc.’s factory was completed in December 2015, and new production capacity has been added during 2016. In China, refurbishing the new factory building, which should be operational during the fourth quarter of 2016, also progressed according to plan. On 13 July, Uponor completed the establishment of the joint venture company, Phyn, alongside Belkin International, Inc. Uponor invested $15 million in exchange for a 37.5% shareholding in the Phyn companies, one of which is located in the U.S. and one in Europe. Uponor has an option to increase its ownership to 50% at a later stage. Any further investments during the period were primarily targeted at maintenance and productivity development. Gross investments in fixed assets in January–September came to €29.7 (30.4) million, showing a modest decline. However, investment was slightly higher than depreciation, which amounted to €29.0 (27.1) million. Cash flow from business operations in January–September came to €22.0 million, compared to €17.0 million in 2015. Uponor maintains its cautious policy with regard to credit risk and makes every effort to maintain a high level of liquidity, thus actively following up on accounts receivable, among other issues. During recent years, volatility in the commodity markets has increased the risk of disruption in the continuous availability of Uponor’s critical raw materials. Uponor has therefore increased its focus on group-wide business continuity management and enhancing risk management within the supply chain, in particular. On 30 September 2016, Uponor’s main existing funding programme was an €80 million bond maturing in 2018. The €20 million bond which matured in June 2016 was paid in the second quarter using the remainder of the €50 million bilateral loan taken out to finance the German acquisitions in January 2016. Committed bilateral revolving credit facilities totalled €200 million, with €100 million maturing in 2019 and €100 million in 2021; none of these back-up facilities were in use during the period under review. In addition to the outstanding bonds and the available committed back-up facilities, Uponor signed a €20 million bilateral loan mainly to fund the new joint venture company, Phyn, in July 2016. At the period end, €25.0 (10.0) million of commercial papers were issued under the €150 million domestic commercial paper programme.

8 I 28 October 2016 I Interim report January – September 2016
The Group’s solvency ratio decreased to 39.2% (41.1%). Net interest-bearing liabilities grew to €177.5 (114.8) million, mainly as a result of acquisitions and the establishment of the joint venture company. The period-end cash balance totalled €22.4 million, up from the prior year’s €20.7 million, in addition to which there was €41.1 million in restricted cash in 2015. Gearing at the end of the period came to 56.6% (37.9%). Events during the period During the July-September period, progress was made in initiatives that had been launched earlier in the year. On 13 July, Uponor Corporation and Belkin International, Inc. completed the partnership agreement, announced on 25 May 2016, and formed a joint venture company in the United States and Europe for the development and commercialisation of intelligent water technology. The new joint venture, named Phyn, develops water sensing and conservation technology for both consumers and the building industry. As a minority-owned business, the joint venture company was consolidated into Uponor’s financial accounts using the equity method. The finalisation of the new factory premises in Taicang, China, has continued as planned and the first production lines are currently being installed and tested. Employees began to move into the new office in October 2016. As part of the transformation programmes in Europe, Building Solutions – Europe relocated its office in the UK to a location close to London and completed its consultations with personnel. By the end of the third quarter, a total of 10 offices throughout Europe had been closed since the start of the year, while net reduction in personnel, relating to the transformation programme, amounts to 143 persons. Uponor Infra continued to streamline manufacturing by centralising production in fewer locations in Finland and Denmark. A total of 31 jobs were lost in Uponor Infra as part of the transformation programme during 2016. The quarter also saw the launch of a new product, Uponor Barrier PLUS, the first 100% plastic potable water pipe for use in water transport in areas with contaminated soil, in order to avoid potential risks to human health in urban and other brownfield environments. For the first time, the new Uponor Barrier PLUS is based on a non-permeable polymer in place of the aluminium layer, resulting in a durable but fully-recyclable pipe system. The system, which uses standard fittings for pressurised potable water piping, will be sold by Uponor Infra organisations in Finland, Denmark, Norway and Sweden. Human resources and administration The number of Group employees (full-time equivalent) in continuing operations averaged 3,873 (3,872) during the period under review, showing an increase of 1 employee from the equivalent period in 2015. At the end of the period, the Group had 3,834 (3,777) full-time employees, up by 57 from the end of the comparison period. This growth is mainly a result of personnel growth in Building Solutions – North America. As a result of the transformation programme, there was a net reduction of personnel in Uponor Infra. Similarly, also Building Solutions – Europe’s personnel was reduced as a result of the transformation programme but the total amount of personnel in the segment grew due to the acquisitions completed in January 2016 and new recruitment in China, which is reported as part of the Building Solutions – Europe segment.

9 I 28 October 2016 I Interim report January – September 2016
Share capital and shares Uponor Corporation’s share capital amounts to €146,446,888 and the number of shares totals 73,206,944. There were no changes in the share capital and the number of shares during the reporting period. The number of Uponor shares traded on Nasdaq Helsinki in the reporting period was 13.9 (21.5) million shares, totalling €197.0 (310.1) million. The market value of share capital at the end of the period was €1.2 (0.9) billion and the number of shareholders 14,200 (14,629). Based on the authorisation granted by the Annual General Meeting of 17 March 2015, on 12 February 2016 the Board of Directors decided on a directed share issue to the company’s management, as part of the long-term share-based incentive plan for 2013-2015. As a result, 28,601 of the company’s own shares were transferred to 9 key employees. Further details are available in the stock exchange release announced on 12 February 2016. On 10 March 2016, the Annual General Meeting authorised the Board of Directors to buy back a maximum of 3.5 million of the company’s own shares. The authorisation is valid until the end of the next Annual General Meeting, and for no longer than 18 months. The Board was also authorised to resolve on issuing a maximum of 7.2 million new shares or transferring the company’s own shares, amounting to approximately 9.8 per cent of the total number of shares. This authorisation is valid until the end of the next Annual General Meeting. Neither of these authorisations has been exercised. Further details regarding the Annual General Meeting are available at http://investors.uponor.com/governance/general-meeting/agm-2016. On 20 May 2016, Uponor issued a public request to its shareholders to accept the remaining shares issued as part of the share bonus issues of 1998 and 2004. Any unaccepted shares issued on the basis of the above bonus issues must be accepted by 20 May 2017, or they will be declared forfeit. Any unclaimed shares will be sold in public trading for the benefit of the parties entitled to the shares. Funds not withdrawn within four years from the sale shall revert to the company. Events after the reporting period In October 2016, Uponor Infra decided to restructure its Canadian manufacturing operations. This initiative will include the further consolidation of manufacturing as well as measures to streamline operations. Measures aimed at creating operational savings will also have a minor impact on jobs in various locations in Canada. Short-term outlook The near-term economic outlook in Uponor’s core geographical markets remains rather stable although uncertainty regarding longer-term stability is mounting. The main drivers for such uncertainty are continued political turbulence in Europe and its neighbouring regions, doubts about the economic strength of the European Union, as well as the sustainability of the global economic development currently being supported by public expenditure. In addition, increased volatility, which is becoming the norm in the business environment, may cause short-term bumps on the road. Notwithstanding what is said above, demand in the building and infrastructure market in Europe is likely to develop satisfactorily, due to the fact that economic development in some countries, such as Germany, continues to be strong and is driving private consumption, while in several others pent-up demand for residential building is being actively satisfied in the form of new build and renovation.

10 I 28 October 2016 I Interim report January – September 2016
In North America, the brisk building market in the U.S. may begin to plateau, a trend which may be reinforced in the shorter term by the nation’s focus on issues on the political agenda rather than business or personal life. No major changes are anticipated in Canada. The next two quarters will mark the completion of Uponor’s internal transformation programmes in Europe. While, in 2016, the focus has largely been on transforming and renewing the businesses and structures, the subsequent quarters will see the targeted benefits and savings coming in. For both Building Solutions – Europe and for Uponor Infra, Uponor considers its businesses to be in a much better position to meet future challenges, targeting stronger profit development than in the last few years. In Building Solutions - North America, investments in manufacturing capacity will support further growth in step with the markets. In connection with the results briefing on 12 February 2016, Uponor stated that the Group's capital expenditure would increase from that experienced over the last few years. Uponor estimated that capital expenditure, excluding any investment in shares, will amount to circa €58 million in 2016, against €50 million in 2015. Some key reasons for the increase were the continued high emphasis on new offering development, extensive European transformation initiatives including manufacturing footprint optimisation, as well as a plan to establish a factory in China. While most of the initiatives have been executed as planned, there have been some delays, which may result in capital expenditure remaining somewhat below the previously communicated figure of €58 million. Assuming that economic development in Uponor's key geographies continues undisturbed, Uponor repeats its full-year guidance, announced on 12 February 2016: the Group’s net sales and operating profit (excluding any items affecting comparability) are expected to improve from those of 2015. Uponor’s financial performance may be affected by a range of strategic, operational, financial, legal, political and hazard-based risks. A more detailed risk analysis is provided in the section ‘Key risks associated with business’ in the Financial Statements 2015. Uponor Corporation Board of Directors For further information, please contact: Jyri Luomakoski, President and CEO, tel. +358 20 129 2824 Riitta Palomäki, CFO, tel. +358 20 129 2822 Tarmo Anttila Vice President, Communications Tel. +358 20 129 2852 Distribution: Nasdaq Helsinki Media www.uponor.com
11 I 28 October 2016 I Interim report January – September 2016
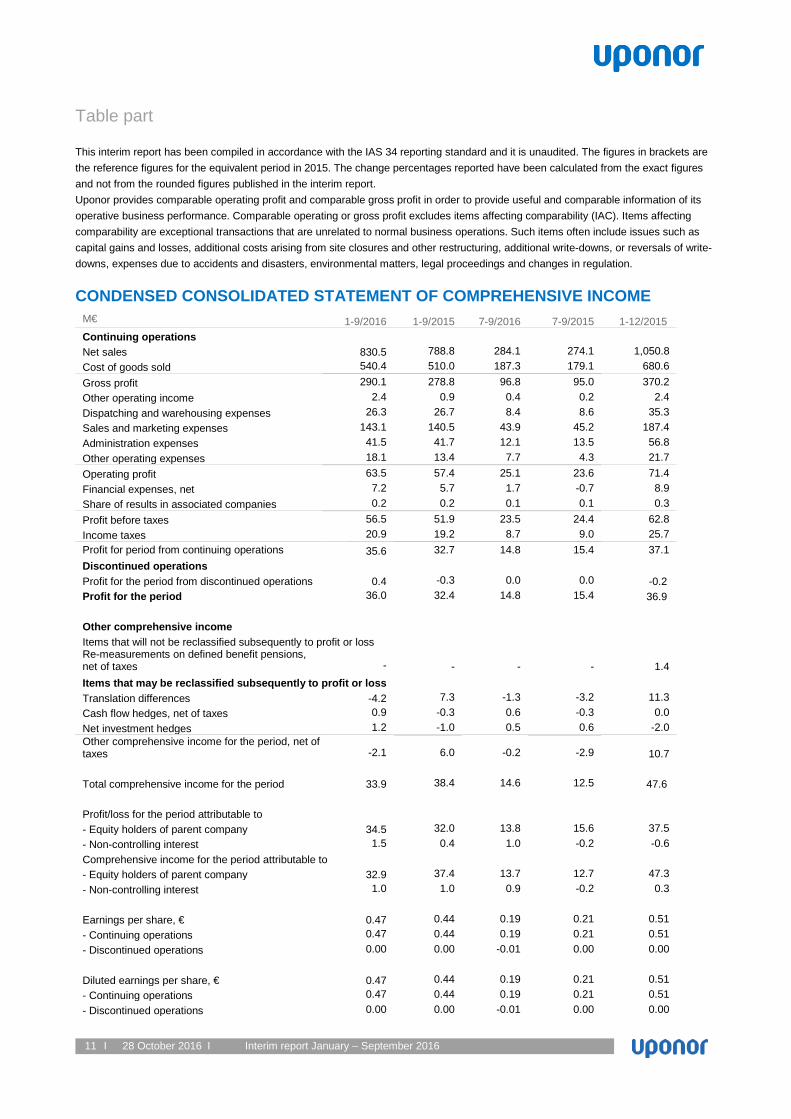
Table part This interim report has been compiled in accordance with the IAS 34 reporting standard and it is unaudited. The figures in brackets are the reference figures for the equivalent period in 2015. The change percentages reported have been calculated from the exact figures and not from the rounded figures published in the interim report. Uponor provides comparable operating profit and comparable gross profit in order to provide useful and comparable information of its operative business performance. Comparable operating or gross profit excludes items affecting comparability (IAC). Items affecting comparability are exceptional transactions that are unrelated to normal business operations. Such items often include issues such as capital gains and losses, additional costs arising from site closures and other restructuring, additional write-downs, or reversals of write-downs, expenses due to accidents and disasters, environmental matters, legal proceedings and changes in regulation. CONDENSED CONSOLIDATED STATEMENT OF COMPREHENSIVE INCOME
M€ 1-9/2016 1-9/2015 7-9/2016 7-9/2015 1-12/2015 Continuing operations Net sales 830.5 788.8 284.1 274.1 1,050.8 Cost of goods sold 540.4 510.0 187.3 179.1 680.6 Gross profit 290.1 278.8 96.8 95.0 370.2 Other operating income 2.4 0.9 0.4 0.2 2.4 Dispatching and warehousing expenses 26.3 26.7 8.4 8.6 35.3 Sales and marketing expenses 143.1 140.5 43.9 45.2 187.4 Administration expenses 41.5 41.7 12.1 13.5 56.8 Other operating expenses 18.1 13.4 7.7 4.3 21.7 Operating profit 63.5 57.4 25.1 23.6 71.4 Financial expenses, net 7.2 5.7 1.7 -0.7 8.9 Share of results in associated companies 0.2 0.2 0.1 0.1 0.3 Profit before taxes 56.5 51.9 23.5 24.4 62.8 Income taxes 20.9 19.2 8.7 9.0 25.7 Profit for period from continuing operations 35.6 32.7 14.8 15.4 37.1 Discontinued operations Profit for the period from discontinued operations 0.4 -0.3 0.0 0.0 -0.2 Profit for the period 36.0 32.4 14.8 15.4 36.9
Other comprehensive income Items that will not be reclassified subsequently to profit or loss Re-measurements on defined benefit pensions, net of taxes - - - - 1.4 Items that may be reclassified subsequently to profit or loss Translation differences -4.2 7.3 -1.3 -3.2 11.3 Cash flow hedges, net of taxes 0.9 -0.3 0.6 -0.3 0.0 Net investment hedges 1.2 -1.0 0.5 0.6 -2.0 Other comprehensive income for the period, net of taxes -2.1 6.0 -0.2 -2.9 10.7
Total comprehensive income for the period 33.9 38.4 14.6 12.5 47.6
Profit/loss for the period attributable to - Equity holders of parent company 34.5 32.0 13.8 15.6 37.5 - Non-controlling interest 1.5 0.4 1.0 -0.2 -0.6 Comprehensive income for the period attributable to - Equity holders of parent company 32.9 37.4 13.7 12.7 47.3 - Non-controlling interest 1.0 1.0 0.9 -0.2 0.3 Earnings per share, € 0.47 0.44 0.19 0.21 0.51 - Continuing operations 0.47 0.44 0.19 0.21 0.51 - Discontinued operations 0.00 0.00 -0.01 0.00 0.00 Diluted earnings per share, € 0.47 0.44 0.19 0.21 0.51 - Continuing operations 0.47 0.44 0.19 0.21 0.51 - Discontinued operations 0.00 0.00 -0.01 0.00 0.00
12 I 28 October 2016 I Interim report January – September 2016
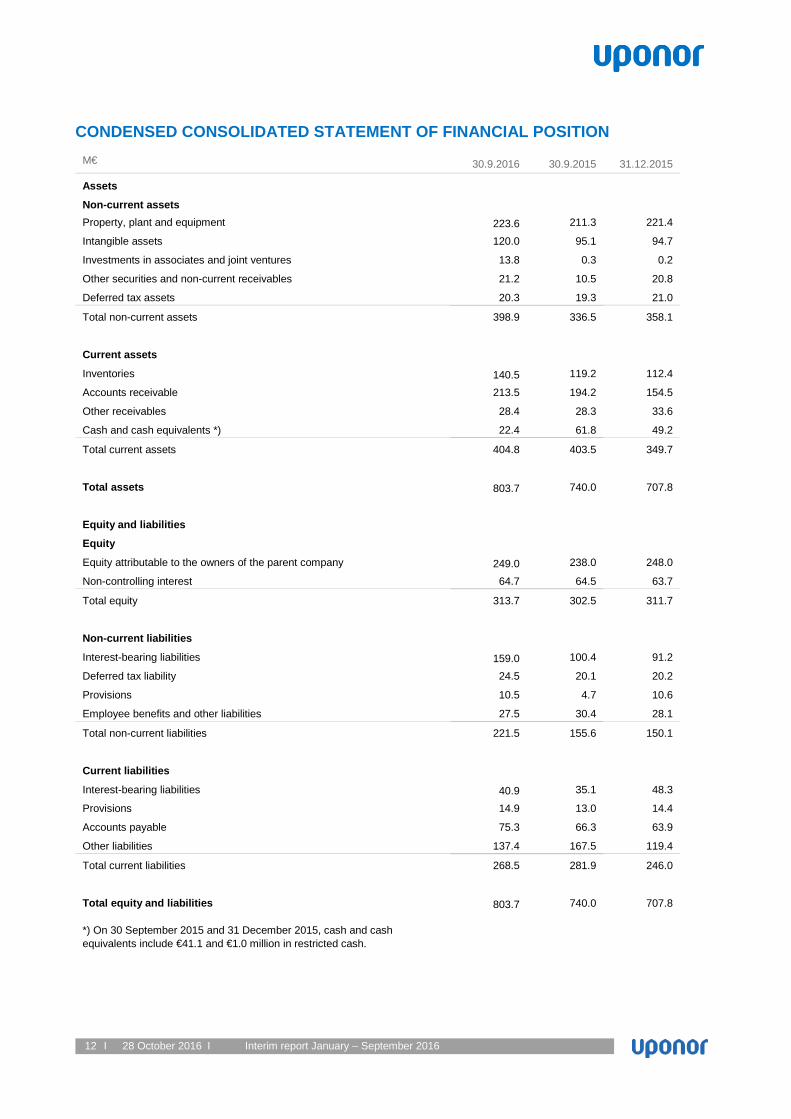
CONDENSED CONSOLIDATED STATEMENT OF FINANCIAL POSITION
M€ 30.9.2016 30.9.2015 31.12.2015
Assets
Non-current assets Property, plant and equipment 223.6 211.3 221.4
Intangible assets 120.0 95.1 94.7
Investments in associates and joint ventures 13.8 0.3 0.2
Other securities and non-current receivables 21.2 10.5 20.8
Deferred tax assets 20.3 19.3 21.0
Total non-current assets 398.9 336.5 358.1
Current assets
Inventories 140.5 119.2 112.4
Accounts receivable 213.5 194.2 154.5
Other receivables 28.4 28.3 33.6
Cash and cash equivalents *) 22.4 61.8 49.2
Total current assets 404.8 403.5 349.7
Total assets 803.7 740.0 707.8
Equity and liabilities
Equity
Equity attributable to the owners of the parent company 249.0 238.0 248.0
Non-controlling interest 64.7 64.5 63.7
Total equity 313.7 302.5 311.7
Non-current liabilities
Interest-bearing liabilities 159.0 100.4 91.2
Deferred tax liability 24.5 20.1 20.2
Provisions 10.5 4.7 10.6
Employee benefits and other liabilities 27.5 30.4 28.1
Total non-current liabilities 221.5 155.6 150.1
Current liabilities
Interest-bearing liabilities 40.9 35.1 48.3
Provisions 14.9 13.0 14.4
Accounts payable 75.3 66.3 63.9
Other liabilities 137.4 167.5 119.4
Total current liabilities 268.5 281.9 246.0
Total equity and liabilities 803.7 740.0 707.8 *) On 30 September 2015 and 31 December 2015, cash and cash equivalents include €41.1 and €1.0 million in restricted cash.

13 I 28 October 2016 I Interim report January – September 2016
CONDENSED CONSOLIDATED STATEMENT OF CASH FLOW
M€ 1-9/2016 1-9/2015 1-12/2015
Cash flow from operations Net cash from operations 92.5 82.9 105.6
Change in net working capital -45.9 -41.4 -15.0
Income taxes paid -21.9 -22.7 -29.5
Interest paid -2.8 -2.1 -3.2
Interest received 0.1 0.3 0.3
Cash flow from operations 22.0 17.0 58.2
Cash flow from investments Acquisition of subsidiaries and businesses* -31.3 - -0.1
Proceeds from disposal of subsidiaries and businesses 0.0 5.9 7.6
Acquisition of joint venture -13.5 - -
Purchase of fixed assets -29.7 -30.4 -50.1
Proceeds from sale of fixed assets 2.7 0.2 0.7
Dividends received - - 0.2
Loan repayments 0.0 0.0 0.0
Cash flow from investments -71.8 -24.3 -41.7
Cash flow from financing Borrowings of debt 95.2 26.4 17.4
Repayment of debt -51.7 -33.3 -33.3
Change in other short-term loan 13.5 6.3 19.1
Dividends paid -32.2 -30.7 -30.7
Payment of finance lease liabilities -0.8 -0.7 -0.9
Cash flow from financing 24.0 -32.0 -28.4
Conversion differences for cash and cash equivalents 0.0 -0.2 -0.1
Change in cash and cash equivalents -25.8 -39.5 -12.0
Cash and cash equivalents at 1 January 48.2 60.2 60.2
Cash and cash equivalents at end of period 22.4 20.7 48.2 Changes according to balance sheet -25.8 -39.5 -12.0
*) Acquisition of subsidiaries and businesses consists of €32.5 million paid for the acquisition of the KaMo/Delta business and €1.1 million received in cash and cash equivalents from the acquisition.
14 I 28 October 2016 I Interim report January – September 2016
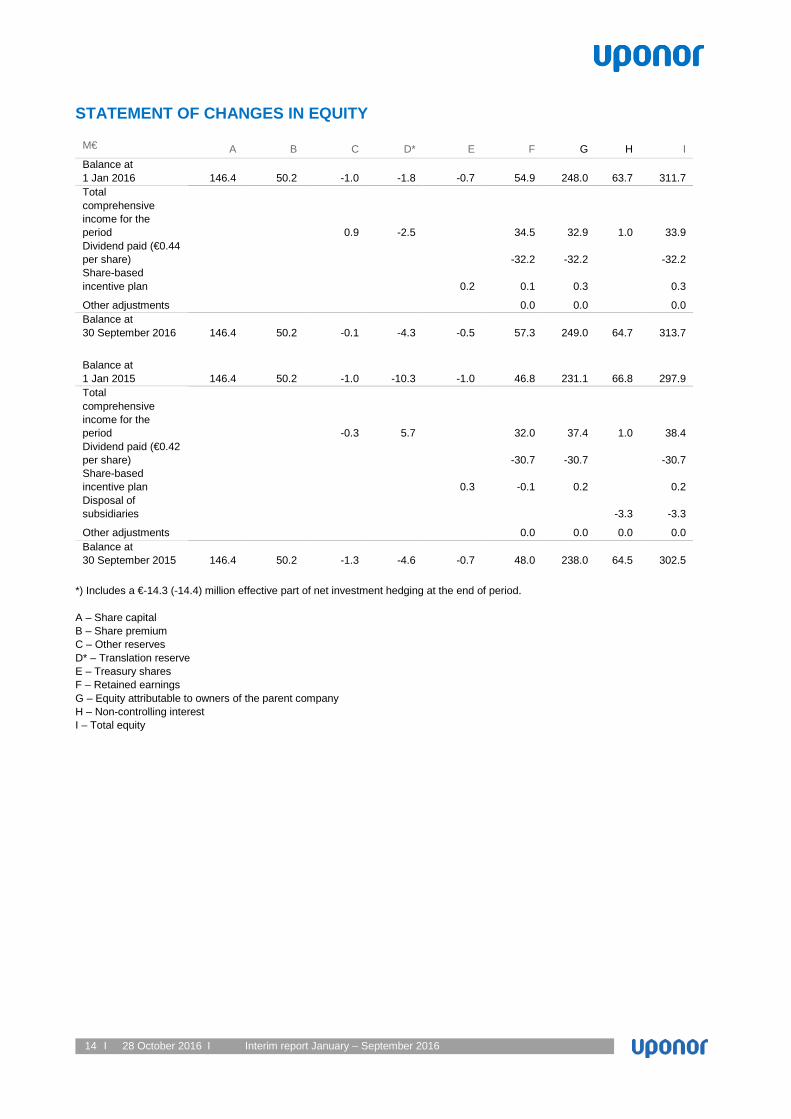
STATEMENT OF CHANGES IN EQUITY
M€ A B C D* E F G H I Balance at 1 Jan 2016 146.4 50.2 -1.0 -1.8 -0.7 54.9 248.0 63.7 311.7 Total comprehensive income for the period 0.9 -2.5 34.5 32.9 1.0 33.9 Dividend paid (€0.44 per share) -32.2 -32.2 -32.2 Share-based incentive plan 0.2 0.1 0.3 0.3
Other adjustments 0.0 0.0 0.0 Balance at 30 September 2016 146.4 50.2 -0.1 -4.3 -0.5 57.3 249.0 64.7 313.7
Balance at 1 Jan 2015 146.4 50.2 -1.0 -10.3 -1.0 46.8 231.1 66.8 297.9 Total comprehensive income for the period -0.3 5.7 32.0 37.4 1.0 38.4 Dividend paid (€0.42 per share) -30.7 -30.7 -30.7 Share-based incentive plan 0.3 -0.1 0.2 0.2 Disposal of subsidiaries -3.3 -3.3
Other adjustments 0.0 0.0 0.0 0.0 Balance at 30 September 2015 146.4 50.2 -1.3 -4.6 -0.7 48.0 238.0 64.5 302.5
*) Includes a €-14.3 (-14.4) million effective part of net investment hedging at the end of period. A – Share capital B – Share premium C – Other reserves D* – Translation reserve E – Treasury shares F – Retained earnings G – Equity attributable to owners of the parent company H – Non-controlling interest I – Total equity

15 I 28 October 2016 I Interim report January – September 2016
NOTES TO THE CONSOLIDATED INTERIM YEAR FINANCIAL STATEMENTS ACCOUNTING PRINCIPLES The interim year report has been prepared in compliance with International Financial Reporting Standards (IFRS) as adopted by the EU and IAS 34 Interim Financial Reporting. In its interim reports, Uponor Group follows the same principles as in the annual financial statements for 2015.
PROPERTY, PLANT AND EQUIPMENT AND INTANGIBLE ASSETS M€ 30.9.2016 30.9.2015 31.12.2015
Gross investment 29.7 30.4 50.1
- % of net sales 3.6 3.9 4.8
Depreciation and impairments 31.6 27.3 39.1
Book value of disposed fixed assets 1.7 0.2 0.9
PERSONNEL Converted to full time employees 1-9/2016 1-9/2015 1-12/2015
Average 3,873 3,872 3,842
At the end of the period 3,834 3,777 3,735
OWN SHARES 30.9.2016 30.9.2015 31.12.2015
Own shares held by the company, pcs 68,959 97,560 97,560 - of share capital, % 0.1 0.1 0.1 - of voting rights, % 0.1 0.1 0.1 Accounted par value of own shares held by the company, M€ 0.1 0.2 0.2
SEGMENT INFORMATION
1-9/2016 1-9/2015 M€ External Internal Total External Internal Total Net sales by segment, continuing operations Building Solutions – Europe 384.6 0.6 385.2 352.2 0.6 352.8 Building Solutions - North America 228.4 0.0 228.4 201.8 - 201.8 Uponor Infra 217.5 3.2 220.7 234.8 2.2 237.0 Eliminations 0.0 -3.8 -3.8 0.0 -2.8 -2.8 Total 830.5 - 830.5 788.8 - 788.8 7-9/2016 7-9/2015 M€ External Internal Total External Internal Total Net sales by segment, continuing operations Building Solutions – Europe 127.0 0.4 127.4 120.9 0.3 121.2 Building Solutions - North America 77.5 0.0 77.5 75.1 - 75.1 Uponor Infra 79.6 1.2 80.8 78.1 0.9 79.0 Eliminations 0.0 -1.6 -1.6 - -1.2 -1.2 Total 284.1 - 284.1 274.1 - 274.1 1-12/2015 M€ External Internal Total Net sales by segment, continuing operations Building Solutions – Europe 466.4 0.7 467.1 Building Solutions - North America 275.8 - 275.8 Uponor Infra 308.6 3.4 312.0 Eliminations 0.0 -4.1 -4.1 Total 1,050.8 - 1,050.8

16 I 28 October 2016 I Interim report January – September 2016
M€ 1-9/2016 1-9/2015 7-9/2016 7-9/2015 1-12/2015 Operating result by segment, continuing operations Building Solutions - Europe 24.0 20.7 10.8 8.4 24.0 Building Solutions - North America 38.1 38.8 12.4 15.7 51.0 Uponor Infra 4.2 1.4 2.7 -0.3 0.2 Others -1.9 -2.9 -0.2 -0.2 -3.8 Eliminations -0.9 -0.6 -0.6 0.0 0.0 Total 63.5 57.4 25.1 23.6 71.4 M€ 1-9/2016 1-9/2015 1-12/2015 Segment depreciation and impairments, continuing operations Building Solutions - Europe 10.2 7.8 10.2 Building Solutions - North America 7.8 7.3 9.8 Uponor Infra 10.6 8.8 14.5 Others 3.0 3.3 4.5 Eliminations 0.0 0.1 0.1
Total 31.6 27.3 39.1
Segment investments, continuing operations Building Solutions – Europe 8.8 9.6 15.4 Building Solutions - North America 11.2 14.7 22.6 Uponor Infra 8.9 5.7 11.3 Others 0.8 0.4 0.8
Total 29.7 30.4 50.1
M€ 30.9.2016 30.9.2015 31.12.2015 Segment assets Building Solutions - Europe 405.9 348.9 325.5 Building Solutions - North America 240.3 234.3 216.0 Uponor Infra 211.3 229.2 212.9 Others 229.9 146.0 227.7 Eliminations -283.7 -218.4 -274.3
Total 803.7 740.0 707.8
Segment liabilities Building Solutions - Europe 267.1 227.5 211.3 Building Solutions - North America 162.9 129.3 160.2 Uponor Infra 77.1 94.7 80.0 Others 291.5 228.3 245.7 Eliminations -308.6 -242.3 -301.0
Total 490.0 437.5 396.2
1-9/2016 1-9/2015 1-12/2015 Segment personnel, continuing operations, average Building Solutions – Europe 2,042 2,024 2,014 Building Solutions - North America 672 582 592 Uponor Infra 1,091 1,203 1,173 Others 68 63 63
Total 3,873 3,872 3,842
Reconciliation M€ 1-9/2016 1-9/2015 1-12/2015 Operating result by segment, continuing operations Total result for reportable segments 66.3 60.9 75.2 Others -1.9 -2.9 -3.8 Eliminations -0.9 -0.6 0.0
Operating profit 63.5 57.4 71.4 Financial expenses, net 7.2 5.7 8.9 Share of results in associated companies 0.2 0.2 0.3 Profit before taxes 56.5 51.9 62.8

17 I 28 October 2016 I Interim report January – September 2016
CONTINGENT LIABILITIES AND ASSETS
M€ 30.9.2016 30.9.2015 31.12.2015
Commitments of purchase PPE (Property, plant, equipment) 11.3 12.2 5.7
Other commitments 1.0 1.1 1.5
- on own behalf
Pledges at book value 0.1 0.1 0.1
Mortgages issued 3.8 - -
Guarantees issued 4.6 4.8 4.8
- on behalf of a subsidiary
Pledges at book value -
Guarantees issued 38.5 19.2 19.6
Letter of Comfort commitments undertaken on behalf of subsidiaries
are not included in the above figures
Pledges at book value 0.1 0.1 0.1
Mortgages issued 3.8 - -
Guarantees issued 43.1 24.0 24.4
Total 47.0 24.1 24.5 Uponor Corporation’s subsidiary in Spain, Uponor Hispania, S.A.U, had a tax audit in December 2011 – May 2012, covering financial years 2006 and 2007. As a result of the audit, the tax authority claims €3.9 million in taxes, delay interest and penalties from Uponor Hispania. The claim mainly relates to the tax deductibility of certain costs such as services rendered by Uponor Group and advertising. Uponor Hispania disagrees with the assessment of the tax authority and has appealed the case. In May 2015, the Spanish tax authority accepted Uponor Hispania’s appeal for the most part, however rejecting the tax deductibility of costs related to Group services. As a result of this, Uponor Hispania has started a process to avoid double taxation. While the case is still in progress, Uponor Hispania has provided a bank guarantee of €2.7 million covering the tax amount and delay interests due to the Spanish tax authority. The bank guarantee given is included in Guarantees issued on behalf of a subsidiary above. In the beginning of 2012, Uponor Corporation and its subsidiary Uponor Business Solutions Oy paid €15.0 million in taxes, surtaxes and penalties based on the taxation adjustment decisions made by the Finnish tax authority for the years 2005-2009. Uponor appealed against the decisions and filed a request for rectification to the Board of Adjustment. The Board of Adjustment rejected Uponor Business Solutions Oy’s appeal in April 2013 and, for the most part, also Uponor Corporation’s appeal in June 2013. On July 2013, Uponor placed the issue before the administrative court and applied for rectification of the Board of Adjustment’s ruling. Uponor has also started a process to avoid possible double taxation. In November 2015, the administrative court rejected the appeals. This decision by the administrative court will not lead to any new payments or payment returns at this stage, and will therefore not affect Uponor’s consolidated cash flow. Uponor does not agree with the dismissal of the case by the administrative court and has sought leave to appeal to the supreme administrative court. The surtaxes (€1.9 million) and the interest on delayed payments (€3.3 million) were recorded as expenses in 2011. The paid taxes (€9.8 million) relating to an increase in taxable income were booked as receivables from the tax authority in 2012. Tax authority returned €0.3 million to Uponor Corporation in June 2013; thus the tax receivable decreased to €9.6 million. The tax receivable is reported in non-current receivables, as the process can last years. If Uponor, against expectations, should fail to get the appeal approved, the surtaxes and interests would remain as the company’s loss. If the appeal would be approved, the surtaxes and interests would be returned to the company.
M€ 30.9.2016 30.9.2015 31.12.2015
OPERATING LEASE COMMITMENTS 46.0 44.1 45.9

18 I 28 October 2016 I Interim report January – September 2016
DERIVATIVE CONTRACTS M€ Nominal
value 30.9.2016
Fair value
30.9.2016
Nominal value
30.9.2015
Fair value
30.9.2015
Nominal value
31.12.2015
Fair value
31.12.2015
Currency derivatives - Forward agreements 184.2 -0.4 179.6 1.4 230.0 0.7
Interest derivatives
- Interest rate swaps 55.0 -2.0 70.0 -2.9 61.0 -2.4
- Interest rate options 20.0 0.0
Commodity derivatives
- Forward agreements 4.1 -0.7 5.6 -1.8 5.0 -1.8
FINANCIAL ASSETS AND LIABILITIES BY MEASUREMENT CATEGORY
30.9.2016 M€ Derivative
contracts, under hedge
accounting
Financial assets/liabilities
at fair value through profit and
loss Loans and
receivables
Available for sales financial
assets
Financial liabilities
measured at
amortised cost
Carrying amount
by balance
sheet item
IFRS 7 Fair value hierarchy
level Non-current financial assets Other shares and holdings 0.3 0.3 Electricity derivatives 0.0 0.0 1 Non-current receivables 21.0 21.0 Current financial assets Accounts receivable and other receivables 234.8 234.8 Electricity derivatives 0.0 0.0 1 Other derivative contracts 0.1 0.9 1.0 2 Cash and cash equivalents 22.4 22.4 Carrying amount 0.1 0.9 278.2 0.3 279.5
Non-current financial liabilities Interest bearing liabilities 159.0 159.0 Electricity derivatives 0.3 0.3 1 Current financial liabilities Interest bearing liabilities 40.9 40.9 Electricity derivatives 0.4 0.4 1 Other derivative contracts 2.1 1.3 3.4 2 Accounts payable and other liabilities 131.1 131.1 Carrying amount 2.8 1.3 331.0 335.1

19 I 28 October 2016 I Interim report January – September 2016
FINANCIAL ASSETS AND LIABILITIES BY MEASUREMENT CATEGORY
30.9.2015 M€ Derivative
contracts, under hedge
accounting
Financial assets/liabilities
at fair value through profit and
loss Loans and
receivables
Available for sales financial
assets
Financial liabilities
measured at
amortised cost
Carrying amount
by balance
sheet item
IFRS 7 Fair value hierarchy
level Non-current financial assets Other shares and holdings 0.5 0.5 Non-current receivables 10.3 10.3 Current financial assets Accounts receivable and other receivables 208.8 208.8 Other derivative contracts 0.0 2.4 2.4 2 Cash and cash equivalents 20.7 20.7 Carrying amount 0.0 2.4 239.8 0.5 242.7
Non-current financial liabilities Interest bearing liabilities 100.4 100.4 Electricity derivatives 0.9 0.9 1 Current financial liabilities Interest bearing liabilities 35.1 35.1 Electricity derivatives 0.8 0.8 1 Other derivative contracts 2.6 1.0 3.6 2 Accounts payable and other liabilities 155.3 155.3 Carrying amount 4.3 1.0 290.8 296.1

20 I 28 October 2016 I Interim report January – September 2016
FINANCIAL ASSETS AND LIABILITIES BY MEASUREMENT CATEGORY
31.12.2015 M€ Derivative
contracts, under hedge
accounting
Financial assets/liabilities at fair value through
profit and loss Loans and
receivables
Available for sales financial
assets
Financial liabilities
measured at amortised
cost
Carrying amount by
balance sheet item
IFRS 7 Fair value hierarchy
level Non-current financial assets Other shares and holdings 0.2 0.2 Non-current receivables 20.6 20.6 Current financial assets Accounts receivable and other receivables 178.1 178.1 Other derivative contracts 0.0 1.4 1.4 2 Cash and cash equivalents 49.2 49.2 Carrying amount 0.0 1.4 247.9 0.2 249.5
Non-current financial liabilities Interest bearing liabilities 91.2 91.2 Electricity derivatives 0.9 0.9 1 Current financial liabilities Interest bearing liabilities 48.3 48.3 Electricity derivatives 0.9 0.9 1 Other derivative contracts 2.7 0.5 3.2 2 Accounts payable and other liabilities 92.7 92.7 Carrying amount 4.5 0.5 232.2 237.2
The carrying value of financial assets and liabilities is considered to correspond to their fair value. The Group’s financial instruments are classified according to IFRS 7 fair value hierarchies. Uponor applies the hierarchy as follows: - The fair value of electricity derivatives is measured based on stock exchange prices. (Hierarchy 1) - The fair value of currency forward agreements is measured based on price information from common markets and commonly used
valuation methods. (Hierarchy 2)
21 I 28 October 2016 I Interim report January – September 2016
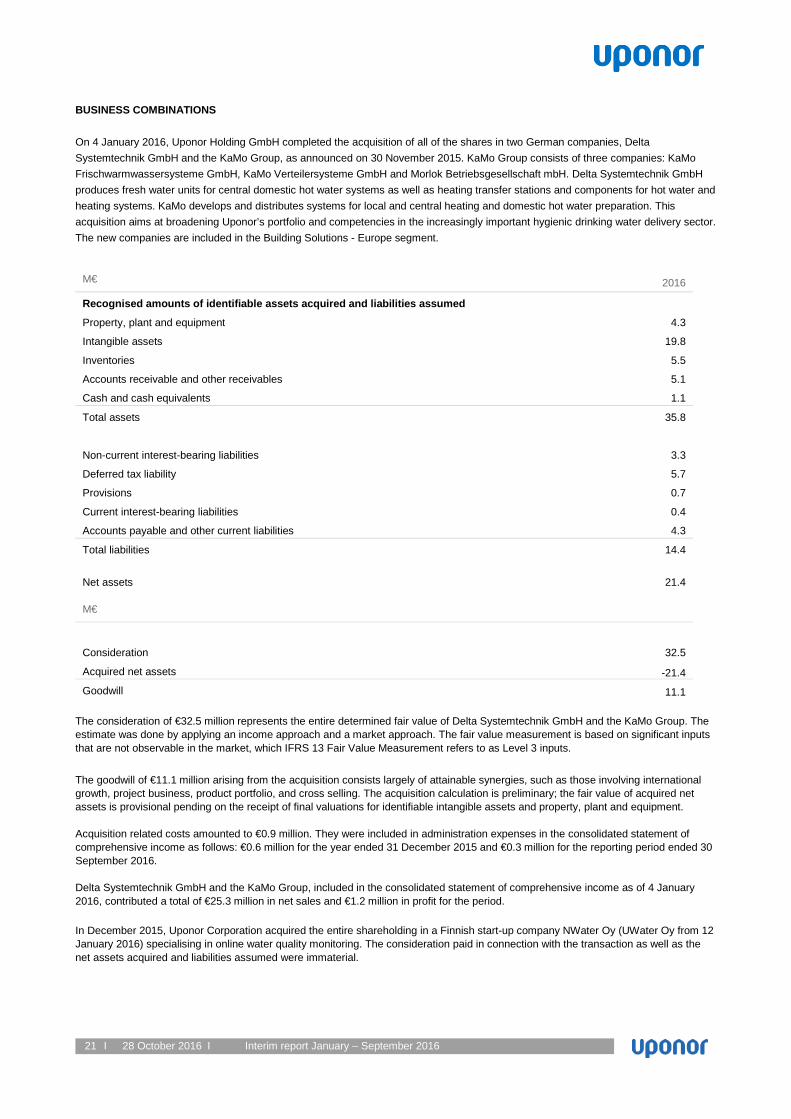
BUSINESS COMBINATIONS On 4 January 2016, Uponor Holding GmbH completed the acquisition of all of the shares in two German companies, Delta Systemtechnik GmbH and the KaMo Group, as announced on 30 November 2015. KaMo Group consists of three companies: KaMo Frischwarmwassersysteme GmbH, KaMo Verteilersysteme GmbH and Morlok Betriebsgesellschaft mbH. Delta Systemtechnik GmbH produces fresh water units for central domestic hot water systems as well as heating transfer stations and components for hot water and heating systems. KaMo develops and distributes systems for local and central heating and domestic hot water preparation. This acquisition aims at broadening Uponor’s portfolio and competencies in the increasingly important hygienic drinking water delivery sector. The new companies are included in the Building Solutions - Europe segment.
M€ 2016
Recognised amounts of identifiable assets acquired and liabilities assumed
Property, plant and equipment 4.3
Intangible assets 19.8
Inventories 5.5
Accounts receivable and other receivables 5.1
Cash and cash equivalents 1.1
Total assets 35.8
Non-current interest-bearing liabilities 3.3
Deferred tax liability 5.7
Provisions 0.7
Current interest-bearing liabilities 0.4
Accounts payable and other current liabilities 4.3
Total liabilities 14.4
Net assets 21.4
M€
Consideration 32.5
Acquired net assets -21.4
Goodwill 11.1 The consideration of €32.5 million represents the entire determined fair value of Delta Systemtechnik GmbH and the KaMo Group. The estimate was done by applying an income approach and a market approach. The fair value measurement is based on significant inputs that are not observable in the market, which IFRS 13 Fair Value Measurement refers to as Level 3 inputs. The goodwill of €11.1 million arising from the acquisition consists largely of attainable synergies, such as those involving international growth, project business, product portfolio, and cross selling. The acquisition calculation is preliminary; the fair value of acquired net assets is provisional pending on the receipt of final valuations for identifiable intangible assets and property, plant and equipment. Acquisition related costs amounted to €0.9 million. They were included in administration expenses in the consolidated statement of comprehensive income as follows: €0.6 million for the year ended 31 December 2015 and €0.3 million for the reporting period ended 30 September 2016. Delta Systemtechnik GmbH and the KaMo Group, included in the consolidated statement of comprehensive income as of 4 January 2016, contributed a total of €25.3 million in net sales and €1.2 million in profit for the period. In December 2015, Uponor Corporation acquired the entire shareholding in a Finnish start-up company NWater Oy (UWater Oy from 12 January 2016) specialising in online water quality monitoring. The consideration paid in connection with the transaction as well as the net assets acquired and liabilities assumed were immaterial.

22 I 28 October 2016 I Interim report January – September 2016
ACQUISITION OF JOINT VENTURE On 13 July 2016, Uponor Corporation and Belkin International, Inc. completed partnership agreement and formed a joint venture company in the United States and in Europe for the development and commercialisation of intelligent water technology. The new joint venture, named Phyn, develops water sensing and conservation technology both for consumers and to the building industry. Uponor invested €13.5 million in exchange of a 37.5% shareholding in the companies. The joint venture company is consolidated into Uponor’s financial accounts using the equity method. DISPOSAL OF SUBSIDIARIES AND BUSINESSES There are no disposal of subsidiaries and businesses in 2016. On 25 February 2015, Uponor Corporation announced that its majority-held subsidiary Uponor Infra Oy had divested its majority shareholding of 65.99% of the shares in Wiik & Hoeglund PLC, a company listed on the stock exchange of Thailand. Uponor Infra Oy made a decision to withdraw from the business in accordance with its strategy to focus on markets where it can command a strong market position and achieve operational synergies. Further, on 30 March 2015, it was announced that Uponor Infra Oy divested, for the same reasons, its fully owned Finnish subsidiary, Extron Engineering Oy, a specialist in the business of designing and manufacturing machinery for the plastic products industry. In December 2015, following the strategic adjustment of its product portfolio, Uponor Infra Oy sold the Omega-Liner® pipeline renovation business. The sales price received from the above listed three transactions totalled to €9.8 million, with a net impact on the result at €1.9 million.
M€ 2015
Book value of disposed assets
Property, plant and equipment 8.0
Other non-current assets 1.5
Inventory 5.1
Accounts receivable and other receivables 5.9
Cash and cash equivalents 2.2
Total assets 22.7
Interest-bearing non-current liabilities 0.4
Other non-current liabilities 0.4
Interest-bearing current liabilities 6.0
Accounts payable and other current liabilities 4.7
Total liabilities 11.5
Net assets 11.2
- attributable to parent company 7.9
Cash received from sales 9.8
Cash and cash equivalents disposed of 2.2
Cash flow effect 7.6
23 I 28 October 2016 I Interim report January – September 2016
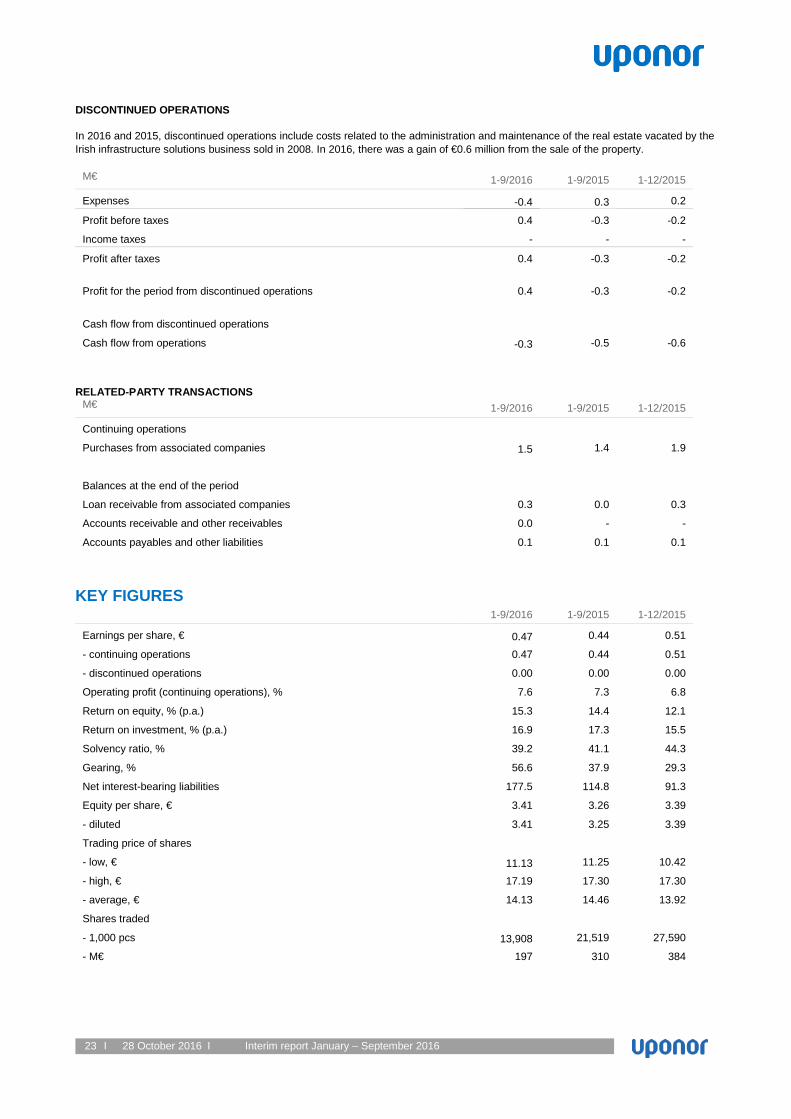
DISCONTINUED OPERATIONS In 2016 and 2015, discontinued operations include costs related to the administration and maintenance of the real estate vacated by the Irish infrastructure solutions business sold in 2008. In 2016, there was a gain of €0.6 million from the sale of the property.
M€ 1-9/2016 1-9/2015 1-12/2015
Expenses -0.4 0.3 0.2
Profit before taxes 0.4 -0.3 -0.2
Income taxes - - -
Profit after taxes 0.4 -0.3 -0.2
Profit for the period from discontinued operations 0.4 -0.3 -0.2
Cash flow from discontinued operations
Cash flow from operations -0.3 -0.5 -0.6
RELATED-PARTY TRANSACTIONS
M€ 1-9/2016 1-9/2015 1-12/2015
Continuing operations
Purchases from associated companies 1.5 1.4 1.9
Balances at the end of the period
Loan receivable from associated companies 0.3 0.0 0.3
Accounts receivable and other receivables 0.0 - -
Accounts payables and other liabilities 0.1 0.1 0.1
KEY FIGURES
1-9/2016 1-9/2015 1-12/2015
Earnings per share, € 0.47 0.44 0.51
- continuing operations 0.47 0.44 0.51
- discontinued operations 0.00 0.00 0.00
Operating profit (continuing operations), % 7.6 7.3 6.8
Return on equity, % (p.a.) 15.3 14.4 12.1
Return on investment, % (p.a.) 16.9 17.3 15.5
Solvency ratio, % 39.2 41.1 44.3
Gearing, % 56.6 37.9 29.3
Net interest-bearing liabilities 177.5 114.8 91.3
Equity per share, € 3.41 3.26 3.39
- diluted 3.41 3.25 3.39
Trading price of shares
- low, € 11.13 11.25 10.42
- high, € 17.19 17.30 17.30
- average, € 14.13 14.46 13.92
Shares traded
- 1,000 pcs 13,908 21,519 27,590
- M€ 197 310 384
24 I 28 October 2016 I Interim report January – September 2016
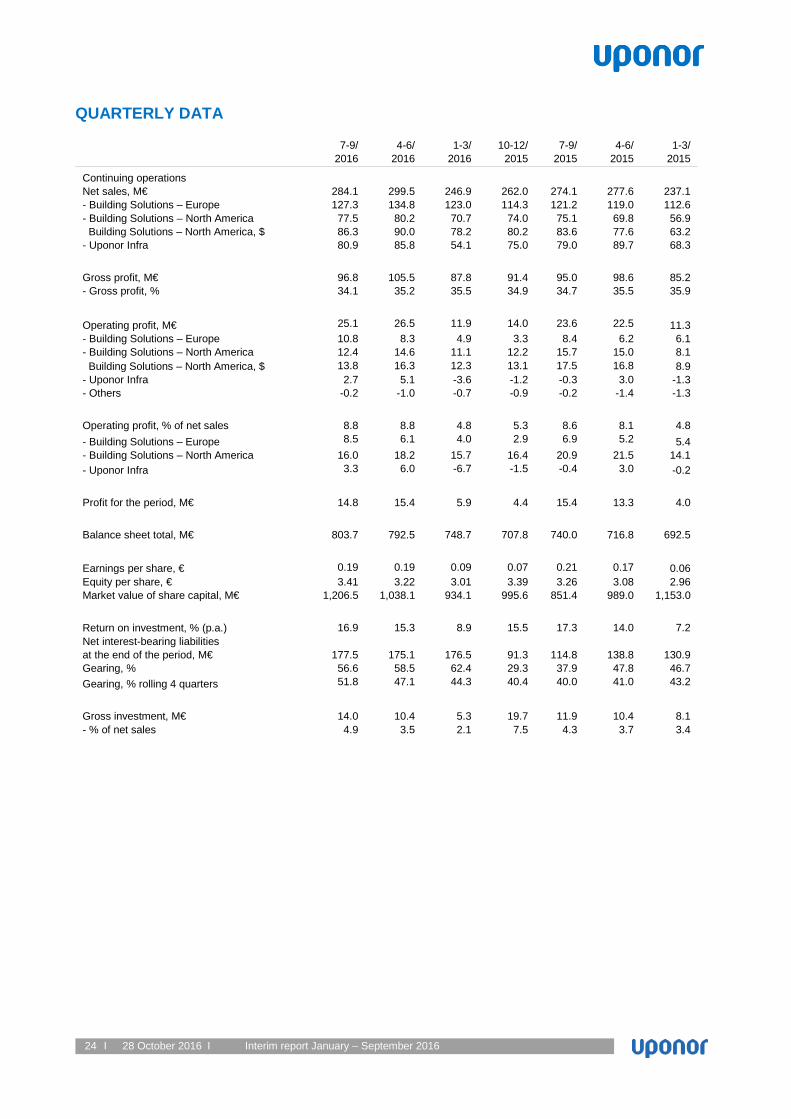
QUARTERLY DATA
7-9/
2016 4-6/
2016 1-3/
2016 10-12/
2015 7-9/
2015 4-6/
2015 1-3/
2015
Continuing operations
Net sales, M€ 284.1 299.5 246.9 262.0 274.1 277.6 237.1 - Building Solutions – Europe 127.3 134.8 123.0 114.3 121.2 119.0 112.6 - Building Solutions – North America 77.5 80.2 70.7 74.0 75.1 69.8 56.9 Building Solutions – North America, $ 86.3 90.0 78.2 80.2 83.6 77.6 63.2 - Uponor Infra 80.9 85.8 54.1 75.0 79.0 89.7 68.3 Gross profit, M€ 96.8 105.5 87.8 91.4 95.0 98.6 85.2 - Gross profit, % 34.1 35.2 35.5 34.9 34.7 35.5 35.9 Operating profit, M€ 25.1 26.5 11.9 14.0 23.6 22.5 11.3 - Building Solutions – Europe 10.8 8.3 4.9 3.3 8.4 6.2 6.1 - Building Solutions – North America 12.4 14.6 11.1 12.2 15.7 15.0 8.1 Building Solutions – North America, $ 13.8 16.3 12.3 13.1 17.5 16.8 8.9 - Uponor Infra 2.7 5.1 -3.6 -1.2 -0.3 3.0 -1.3 - Others -0.2 -1.0 -0.7 -0.9 -0.2 -1.4 -1.3 Operating profit, % of net sales 8.8 8.8 4.8 5.3 8.6 8.1 4.8 - Building Solutions – Europe 8.5 6.1 4.0 2.9 6.9 5.2 5.4 - Building Solutions – North America 16.0 18.2 15.7 16.4 20.9 21.5 14.1 - Uponor Infra 3.3 6.0 -6.7 -1.5 -0.4 3.0 -0.2 Profit for the period, M€ 14.8 15.4 5.9 4.4 15.4 13.3 4.0
Balance sheet total, M€ 803.7 792.5 748.7 707.8 740.0 716.8 692.5
Earnings per share, € 0.19 0.19 0.09 0.07 0.21 0.17 0.06 Equity per share, € 3.41 3.22 3.01 3.39 3.26 3.08 2.96 Market value of share capital, M€ 1,206.5 1,038.1 934.1 995.6 851.4 989.0 1,153.0
Return on investment, % (p.a.) 16.9 15.3 8.9 15.5 17.3 14.0 7.2 Net interest-bearing liabilities at the end of the period, M€
177.5 175.1 176.5 91.3 114.8
138.8 130.9
Gearing, % 56.6 58.5 62.4 29.3 37.9 47.8 46.7 Gearing, % rolling 4 quarters 51.8 47.1 44.3 40.4 40.0 41.0 43.2
Gross investment, M€ 14.0 10.4 5.3 19.7 11.9 10.4 8.1 - % of net sales 4.9 3.5 2.1 7.5 4.3 3.7 3.4

25 I 28 October 2016 I Interim report January – September 2016
ITEMS AFFECTING COMPARABILITY AND RECONCILIATIONS TO IFRS
7-9/ 2016
4-6/ 2016
1-3/ 2016
10-12/ 2015
7-9/ 2015
4-6/ 2015
1-3/ 2015
Items affecting comparability
Restructuring charges -3.9 -4.2 -3.0 -4.4 -1.0 -0.8 - Capital gains and losses on sale of non-current assets - - - 1.9 - - - Total items affecting comparability in operating profit -3.9 -4.2 -3.0 -2.5 -1.0 -0.8 -
Items affecting comparability, total -3.9 -4.2 -3.0 -2.5 -1.0 -0.8 -
Comparable gross profit Gross profit 96.8 105.5 87.8 91.4 95.0 98.6 85.2 Less: Items affecting comparability in gross profit -0.8 -0.8 -0.7 -0.3 -0.1 -0.4 - Comparable gross profit 97.6 106.3 88.5 91.7 95.1 99.0 85.2 % of sales 34.4 35.5 35.8 35.0 34.7 35.6 36.0 Comparable operating profit
Operating profit 25.1 26.5 11.9 14.0 23.6 22.5 11.3 Less: Items affecting comparability in operating profit -3.9 -4.2 -3.0 -2.5 -1.0 -0.8 - Comparable operating profit 29.0 30.7 14.9 16.5 24.6 23.3 11.3 % of sales 10.2 10.2 6.0 6.4 8.9 8.4 4.8 Comparable operating profit by segment
Building Solutions - Europe
Operating profit 10.8 8.3 4.9 3.3 8.4 6.2 6.1 Less: Items affecting comparability in operating profit -0.9 -3.3 -2.6 -1.8 -1.0 -0.8 - Comparable operating profit 11.7 11.6 7.5 5.1 9.4 7.0 6.1 % of sales 9.2 8.5 6.2 4.5 7.7 5.9 5.4 Building Solutions - North America
Operating profit 12.4 14.6 11.1 12.2 15.7 15.0 8.1 Comparable operating profit 12.4 14.6 11.1 12.2 15.7 15.0 8.1 % of sales 16.0 18.2 15.7 16.4 20.9 21.5 14.1 Uponor Infra
Operating profit 2.7 5.1 -3.6 -1.2 -0.3 3.0 -1.3 Less: Items affecting comparability in operating profit -3.2 -0.6 -0.4 -0.7 - - - Comparable operating profit 5.9 5.7 -3.2 -0.5 -0.3 3.0 -1.3 % of sales 7.2 6.7 -6.0 -0.6 -0.4 3.4 -2.0 Others
Operating profit -0.2 -1.0 -0.7 -0.9 -0.2 -1.4 -1.3 Less: Items affecting comparability in operating profit 0.2 -0.3 - - - - - Comparable operating profit -0.4 -0.7 -0.7 -0.9 -0.2 -1.4 -1.3 % of sales na na na na na na na

26 I 28 October 2016 I Interim report January – September 2016
DEFINITIONS OF KEY RATIOS Return on Equity (ROE), %
Profit before taxes – taxes = –––––––––––––––––––––––––––––––––––––––– x 100 Total equity, average Return on Investment (ROI), % Profit before taxes + interest and other financing costs = ––––––––––––––––––––––––––––––––––––-----------–––– x 100 Balance sheet total – non-interest-bearing liabilities, average Solvency, % Total equity = ––––––––––––––––––––––––––––––––––––----- x 100 Balance sheet total – advance payments received Gearing, % Net interest-bearing liabilities = –––––––––––––––––––––––––––––––––--------- x 100 Total equity Net interest-bearing liabilities = Interest-bearing liabilities – cash and cash equivalents excluding restricted cash Earnings per share (EPS) Profit for the period attributable to equity holders of the parent company = –––––––––––––––––––––––––––––––––––––––––––––––––--------------
Average number of shares adjusted for share issue in financial period excluding treasury shares
Equity per share ratio Equity attributable to the owners of the parent company = ––––––––––––––––––––––––––––––––––––––––––––----------– Number of shares adjusted for share issue at end of year Average share price Total value of shares traded (€) = ––––––––––––––––––––––––––– Total number of shares traded Gross profit margin Gross profit = ––––––––––––––––––––––––––– x 100 Net sales Operating profit margin Operating profit = ––––––––––––––––––––––––––– x 100 Net sales Comparable gross profit margin Gross profit – items affecting comparability = ––––––––––––––––––––––––––––––––––––––––––––----------– x 100 Net sales Comparable operating profit margin Operating profit – items affecting comparability = ––––––––––––––––––––––––––––––––––––––––––––----------– x 100 Net sales