interim report: field demonstration of permeable reactive
TRANSCRIPT

United States Air and Radiation EPA 402-C-00-001 Environmental (6608J) Emergency and November 2000 Protection Agency Remedial Response www.epa.gov
Field Demonstration Of Permeable Reactive Barriers To Remove Dissolved Uranium From Groundwater, Fry Canyon, Utah
September 1997 through September 1998
Interim Report
Contaminant plume
Chemical barrier
Trench (filled)
Aquifer
Flow
Disclaimer - For assistance accessing this document or additional information, please contact [email protected].

EPA 402-C-00-001 November 2000
FIELD DEMONSTRATION OF PERMEABLE REACTIVE BARRIERS TO REMOVE DISSOLVED URANIUM FROM GROUNDWATER, FRY CANYON, UTAH
September 1997 through September 1998
Interim Report
Prepared in cooperation with the
U.S. Geological Survey U.S. Bureau of Land Management U.S. Department of Energy
U.S. Environmental Protection Agency Office of Air and Radiation
Washington, DC 2000
i

CONTRIBUTORS
This report was prepared under the supervision of the Fry Canyon Study Team.
PRINCIPAL AUTHORS
David L. Naftz, Ph.D. Stan J. Morrison, Ph.D. U.S. Geological Survey *Environmental Sciences Laboratory
Edward M. Feltcorn Geoffrey W. Freethey U.S. Environmental Protection Agency U.S. Geological Survey
Christopher C. Fuller Michael J. Piana U.S. Geological Survey U.S. Geological Survey
Ronald G. Wilhelm Ryan C. Rowland U.S. Environmental Protection Agency U.S. Geological Survey
James A. Davis, Ph.D. Julie E. Blue** U.S. Geological Survey U.S. Environmental Protection Agency
* Operated by MACTEC-ERS for the U. S. Department of Energy Grand Junction Office ** Present affiliation: Oberlin College, Oberlin, Ohio
DISCLAIMER
The following is intended solely as guidance to Environmental Protection Agency (EPA) and other environmental professionals. This document does not constitute rulemaking by the Agency, and cannot be relied on to create a substantive or procedural right enforceable by any party in litigation with United States. EPA may take action that is at variance with the information, policies, and procedures in this document and may change them at any time without public notice.
Reference herein to any specific trade names, products, process, or services does not convey, and should not be interpreted as conveying, official EPA approval, endorsement, or recommendation.
ii
ACKNOWLEDGEMENTS
The Project Officer of the Fry Canyon Permeable Reactive Barrier Demonstration Project, Ed Feltcorn of EPA's Office of Radiation and Indoor Air's Center for Radiation Site Cleanup, would like to acknowledge the support provided by the following individuals and organizations Without their continued support, this project would not have been possible.
EPA Office of Emergency and Remedial Response, 3/8 Center.
EPA Office of Radiation and Indoor Air, Radiation Protection Division
Mr. Ronald Wilhelm of the Office of Radiation and Indoor Air and Mr. Randy Breeden, at the time a member of EPA’s Office of Emergency and Remedial Response. From 1993 through 1995 they strongly advocated the use of PRBs for inorganic contaminants. Their initial efforts created the basis for development of this project.
EPA Office of Emergency and Remedial Response Project Coordinators: Randy Breeden, Paula Estornell, Dr. Julie Blue and Kelly Madalinski.
Peer reviewers for this report: Dianne Marozas, DOE Albuquerque; Richard Steimle, USEPA, Technology Innovation Office; and Dr. Ralph Ludwig, USEPA, ORD Ada Lab.
US Geological Survey, Utah District Office lead by Dr. Dave Naftz who did everything he could to ensure a successful project. His leadership and tireless efforts at resolving issues motivated the entire project team to excellence.
The Project Officer would also like to note the achievements of the University of Waterloo, Canada, in their work with Permeable Reactive Barriers and thank them for their cooperation.
iii

4 4
TABLE OF CONTENTS
ii CONTRIBUTORS iii ACKNOWLEDGEMENTS v LIST OF TABLES vi LIST OF FIGURES 1.0 INTRODUCTION........................................................................................................................................... 1
1.1. Abstract................................................................................................................................................... 1 1.2. Background............................................................................................................................................. 1 1.3. Purpose and Scope................................................................................................................................ 3 1.4. Project History ........................................................................................................................................ 4 1.5. Technology Description.......................................................................................................................... 4
2.0 SITE CHARACTERIZATION AND REACTIVE MATERIAL SELECTION ................................................ 4 2.1. Site Characterization.............................................................................................................................. 4
2.1.1.Hydrologic Characterization Results............................................................................................4 2.1.2.Water Quality Characterization Results.......................................................................................7
2.2. Reactive Material Selection .................................................................................................................15 2.2.1.Characteristics of Reactive Material ..........................................................................................15
2.2.1.1. Evaluation of Phosphate Material for Use in Permeable Reactive Barrier Demonstration .................................................................................................................15
2.2.1.2. Evaluation of Zero-Valent Iron Material for Use in Permeable Reactive Barrier Demonstration.....................................................................................................16
2.2.1.3. Evaluation of Amorphous Ferric Oxyhydroxide Material for Use in Permeable Reactive Barrier Demonstration ......................................................................................17
2.2.2.Laboratory Evaluation of Phosphate Materials..........................................................................17 2.2.3.Laboratory Evaluation of Zero Valent Iron and Amorphous Ferric Oxyhydroxide Materials...27 2.2.4.Selection of Materials for Demonstration...................................................................................31
232.3. Further Development of Barrier Materials ........................................................................................... 23.........................................................................................PERMEABLE REACTIVE BARRIER DESIGN3.0
4.0 MONITORING NETWORK DESIGN..........................................................................................................34 5.0 BARRIER AND MONITORING NETWORK INSTALLATION .................................................................41 6.0 POST-INSTALLATION SAMPLING AND ANALYSIS .............................................................................46 7.0 YEAR ONE RESULTS OF PERMEABLE REACTIVE BARRIER DEMONSTRATION .........................48
7.1. Volume of Groundwater Treated .........................................................................................................48 7.2. Changes in Uranium Concentration ....................................................................................................51 7.3. Water-Quality Effects of Barrier Materials...........................................................................................57
46.......COST ANALYSIS OF SITE CHARACTERIZATION, PRB DESIGN, AND PRB INSTALLATION8.0 56..................................................................REMAINING QUESTIONS FOR RPMS DURING THE RI/FS9.0
10.0 RECOMMENDATIONS FOR PRB IMPLEMENTATION: LESSONS LEARNED ...................................66
APPENDICES A. Summary of Activities at Other Sites Using Permeable Reactive Barriers to Remove Uranium .....68 B. Summary of Deep Emplacement Methods for Permeable Reactive Barriers ...................................72 C. Site Evaluation and Selection Process 57................................................................................................ D. Health and Safety Issues Associated with Installation of Permeable Reactive Barriers ..................78 E. Sample Collection, Analysis, Quality Assurance, and Field Measurement Calibration ....................79 F. Glossary of Terms ................................................................................................................................84 G. List of References.................................................................................................................................86
iv

LIST OF TABLES
Table Title Page
2.1 Physical properties, trace-element concentration, and measured discharge at Fry Creek surface-water sites, Fry Canyon, Utah …………………………. 14
2.2 Products tested during the laboratory investigation…………………………... 16 2.3 Physical characteristics of phosphate rock and bone meal materials
evaluated………………………………………………………………………….. 19 2.4 Physical properties of bone-char phosphate pellet formulations CP3 and
CP5………………………………………………………………………………… 20 2.5 Summary of column results for uranium breakthrough and uptake by
different phosphate materials for 12 milligrams per liter dissolved uranium in pH 7 artificial groundwater……………………………………………………. 25
2.6 Hydraulic conductivity values measured by constant head method reported in feet per day…………………………………………………………………….. 30
6.1 Sampling period, chemical constituents, and number of samples taken during the first year of permeable reactive barrier operation at Fry Canyon, Utah………………………………………………………………………………… 47
7.1 Percentage of input uranium concentration removed after traveling approximately 1.5-feet into each of the permeable reactive barriers during September 1997 through September 1998, Fry Canyon,Utah……………… 55
8.1 Actual cost and duration of project planning through installation of three permeable reactive barriers at the Fry Canyon site, Utah…………………… 64
A.1 Other permeable reactive barrier field projects……………………………….. 69 D.1 Permeable reactive barrier chemicals used at the Fry Canyon site and the
associated toxicity characteristics………………………………………………. 78 E.1 Uranium concentration and pH, specific conductance, and oxidation-
reduction potential value changes during pumping of well ZVIFS1 during September 1998, Fry Canyon, Utah……………………………………………. 79
E.2 Chemical analysis of selected major-, minor-, and trace-element constituents from blank samples processed during pre-installation and year 1 barrier monitoring activities, Fry Canyon, Utah, September 1996 to September 1998………………………………………………………………….. 81
E.3 Chemical analysis of selected major-, minor-, and trace-element constituents from duplicate samples collected during pre-installation characterization and year 1 barrier monitoring activities, Fry Canyon, Utah, September 1996 to September 1998…………………………………………... 82
v

LIST OF FIGURES
Figure Title Page
1.1 Schematic diagram of permeable reactive barrier ………………………...…. 2 1.2 Location of the Fry Canyon demonstration site in southeastern Utah……… 3 2.1 Generalized profile of geologic units exposed in the Fry Canyon area…….. 5 2.2 Potentiometric surface of the colluvial aquifer during October 1996, Fry
Canyon, Utah……………………………………………………………………… 6 2.3 Conceptualization of ground-water movement in the colluvial aquifer at the
Fry Canyon study site……………………………………………………………. 7 2.4 Pre-installation ground- and surface-water sampling sites and
potentiometric surface of the colluvial aquifer during October 1996, Fry Canyon, Utah……………………………………………………………………… 8
2.5 Pie charts comparing the pre-installation major-ion and uranium concentration in milliequivalents per liter from 7 groundwater and 2 surface-water sites, Fry Canyon, Utah…………………………………………. 9
2.6 Pre-installation trace-element concentrations measured in groundwater samples collected during December 1996, February 1997, and April 1997.. 10
2.7 Comparison of uranium concentration in filtered and unfiltered water samples collected during site characterization, December 1996, Fry Canyon, Utah……………………………………………………………………… 11
2.8 Uranium concentrations (unfiltered) during a 1-hour pumping cycle at well FC3, September 1996……………………………………………………………. 11
2.9 Total uranium concentrations in subsurface sediment samples collected during September 1996, Fry Canyon,Utah……………………………………. 12
2.10 Uranium desorption results using samples collected from the colluvial aquifer at Fry Canyon during September 1996……………………………….. 13
2.11 Electron micrograph of bone-char phosphate pellets (CP5) illustrating morphology and porosity of the material……………………………………….. 21
2.12 Batch uranium uptake on various phosphate materials at pH 7 in Fry Canyon artificial groundwater…………………………………………………… 23
2.13 Breakthrough of uranium in bone-char column plotted as the ratio of column effluent dissolved uranium to influent dissolved uranium versus number of column pore volumes passed………………………………………. 24
2.14 Release of uranium from bone char column plotted as the ratio of column effluent dissolved uranium to initial influent dissolved uranium versus number of column pore volumes passed………………………………………. 26
2.15 Uranium concentrations in 3-day batch tests on a variety of reactive materials…………………………………………………………………………… 28
2.16 Uranium concentrations in effluents from column experiments using amorphous ferric oxyhydroxide/sand (0.2 weight percent iron as amorphous ferric oxyhydroxide) and zero valent iron foam pellets/sand (55 weight percent zero valent iron)………………………………………………… 29
2.17 Testing hydraulic conductivity of amorphous ferric oxyhydroxide /gravel mixture……………………………………………………………………………... 30
vi
3.1 Schematic diagram showing the funnel and gate design used for the installation of PRBs at Fry Canyon, Utah……………………………………… 33
3.2 Three-dimensional views of the sacrificial frame design used for installation of PRBs at Fry Canyon, Utah……………………………………… 34
4.1 Schematic diagram showing monitoring well placement and sample site identification for the bone-char PRB……………………………………………. 35
4.2 Schematic diagram showing monitoring well placement and sample site identification for the zero-valent iron PRB……………………………………... 36
4.3 Schematic diagram showing monitoring well placement and sample site identification for the amorphous ferric oxyhydroxide PRB…………………… 37
4.4 Two-inch monitoring well, Fry Canyon, Utah………………………………….. 38 4.5 Pressure transducer deployed during PRB demonstration, Fry Canyon,
Utah………………………………………………………………………………… 39 4.6 Schematic diagram of the automatic data recording system within and
adjacent to the permeable reactive barriers, Fry Canyon, Utah…………….. 40 4.7 Automated data logging equipment used during the Fry Canyon barrier
demonstration project……………………………………………………………. 41 5.1 Trench box used to protect workers during installation of the PRBs at Fry
Canyon, Utah…………………………………………………………………….. 43 5.2 Placement of AFO barrier material into the gate structure of the permeable
reactive barrier, Fry Canyon, Utah…………………………………………….. 44 5.3 Location and dimensions of permeable reactive barriers after construction,
Fry Canyon, Utah…………………………………………………………………. 46 7.1 Configuration and altitude of the potentiometric surface of the colluvial
aquifer at Fry Canyon, Utah prior to the permeable reactive walls being installed in (a) July 1997, and (b) January 1997………………………………. 49
7.2 Configuration and altitude of the potentiometric surface in the colluvial aquifer at Fry Canyon, Utah, December 1998, and the approximate area of aquifer influenced by the permeable reactive barriers……………………….. 51
7.3 Changes in dissolved uranium concentrations in the bone char phosphate permeable reactive barrier from September 1997 through September 1998, Fry Canyon, Utah…………………………………………………………. 52
7.4 Changes in dissolved uranium concentrations in the zero valent iron permeable reactive barrier from September 1997 through September 1998, Fry Canyon, Utah…………………………………………………………. 53
7.5 Changes in dissolved uranium concentrations in the amorphous ferric oxyhydroxide permeable reactive barrier from September 1997 through September 1998, Fry Canyon, Utah……………………………………………. 54
7.6 Variation in pH and percent uranium removal from September 1997 through Septeber 1998 in two monitoring points completed in the amorphous ferric oxyhydroxide barrier, Fry Canyon, Utah…………………... 56
7.7 Comparison of uranium concentration in filtered and unfiltered water samples collected after installation of permeable reactive barriers, October 1997, Fry Canyon, Utah…………………………………………………………. 57
vii

7.8 Changes in water temperature within the bone char phosphate, zero valent iron, and amorphous iron oxyhydroxide permeable reactive barriers from September 1997 through September 1998, Fry Canyon, Utah……………… 58
7.9 Changes in pH values within the bone char phosphate, zero valent iron and amorphous iron oxyhydroxide permeable reactive barriers and background well FC3 from September 1997 through September 1998, Fry Canyon, Utah……………………………………………………………..……….. 59
7.10 Changes in dissolved oxygen concentration from within the bone char phosphate, zero valent iron, and amorphous iron oxyhydroxide permeable reactive barriers from September 1997 through September 1998, Fry Canyon, Utah……………………………………………………………………… 60
7.11 Changes in oxidation reduction potential from within the bone char phosphate, zero valent iron, and amorphous iron oxyhydroxide permeable reactive barriers from September 1997 through September 1998, Fry Canyon, Utah……………………………………………………………………… 60
7.12 Changes in ferrous iron concentration in water samples from upgradient, within-barrier, and downgradient wells in the zero-valent iron permeable reactive barrier from September 1997 through September 1998, Fry Canyon, Utah……………………………………………………………………… 61
7.13 Changes in ferrous iron concentration in water samples from upgradient, within-barrier, and downgradient wells in the amorphous ferric oxyhydroxide permeable reactive barrier from September 1997 through September 1998, Fry Canyon, Utah……………………………………………. 62
7.14 Changes in phosphate concentration in water samples from upgradient, within-barrier, and downgradient wells in the bone char permeable reactive barrier from September 1997 through September 1998, Fry Canyon, Utah........................................................................................................... 63
C.1 Location and uranium concentration in water samples from abandoned mine sites considered for field demonstration of permeable reactive barriers…………………………………………………………………………….. 76
viii

1.0 INTRODUCTION
1.1 Abstract The Fry Canyon site in southeastern Utah was selected in 1996 as a long-term field demonstration site to assess the performance of selected permeable reactive barriers for the removal of uranium (U) from groundwater. Permeable reactive barriers (PRBs) are permeable walls that are installed across the flow path of a contaminant plume. The wall is designed to be at least as permeable as the surrounding aquifer material. The PRBs contain a zone of reactive material that is designed to act as a passive in-situ treatment zone for specific contaminants as groundwater flows through it.
The use of PRBs for remediating organic-contaminated groundwater is fairly well documented. This project demonstrates one of the first uses of PRBs for remediating uranium contaminated groundwater. The U concentrations measured in groundwater at the Fry Canyon site prior to PRB installation were as high as 16,300 micrograms per liter (µg/L) with a median concentration of 840 µg/L.
A series of laboratory experiments were conducted on three classes of potential PRB materials (phosphate, zero valent iron, and ferric iron) to determine uranium removal efficiencies and hydrologic properties. A PRB material from each class was selected for field demonstration. The selected materials had suitable hydraulic conductivity, high U removal efficiency, and high compaction strengths.
A funnel and gate design was used with wing walls on each end of the structure to channel the groundwater into the PRBs. Each gate structure was 3 feet (ft) thick and 7 ft wide. Depths of barrier materials varied from 3.2 to 3.7 ft. Sixteen monitoring wells were located along two parallel flow paths in each PRB to evaluate short-term changes in water quality.
During the first year of operation (September 1997 through September 1998), the PRBs removed most of the incoming U. The zero-valent iron (ZVI) PRB has consistently lowered the input U concentration by more than 99.9 percent after the contaminated groundwater had traveled 1.5 ft into the PRB. The percentage of U removed in the bone-char phosphate (PO4) and amorphous ferric oxyhydroxide (AFO) PRBs exceeded 70 percent for most measurements made during the first year of operation. The U concentrations in monitoring wells downgradient of the PRBs are at or near background concentrations. This project has demonstrated that PRBs are an efficient and financially viable means of remediating uranium contaminated groundwater. Because mechanisms similar to those which remove uranium in PRBs are also responsible for the removal of other inorganic contaminants, the results of this project have wide applicability.
1.2 Background Potable groundwater supplies worldwide are contaminated or threatened by advancing plumes containing radionuclides and metals. Surface drainage from abandoned and inactive mines has percolated into underlying aquifers and contaminated groundwater with uranium (U), radium (Ra), molybdenum (Mo), arsenic (As), selenium (Se), chromium (Cr), and vanadium (V), as well as other radionuclides and metals.
The problem of the U migration from inactive and abandoned mines and tailings piles is not limited to U ores. Because of the enrichment of U in ores of other metals and phosphate
1

deposits, high U concentrations have been found in mine drainage from hardrock base- and precious-metal mines, as well as industrial mineral mines. In the case of metal mines, U concentrations on the order of several thousand µg/L have been found, generally with higher U concentrations in more acidic drainages. In addition to uranium, concentrations of associated metals have also been found at levels exceeding drinking-water standards. In addition to mining and milling operations (at Department of Energy (DOE) and Department of Defense (DOD) facilities and elsewhere), industrial activities such as machining, plating, and manufacturing have resulted in groundwater contamination. Also, some waste repositories are currently leaking contaminants into the underlying groundwater. Repository liners and caps designed to prevent infiltration of precipitation are failing due to a variety of perturbations, including differential settling and bio-intrusion. Therefore, viable approaches to dealing with such problems may have widespread applicability.
Currently, the most widely used method of groundwater remediation is the combination of extraction, ex-situ treatment, and discharge of the treated water known as pump and treat. However, pump-and-treat methods are costly and often ineffective in meeting long-term protection standards (Travis and Doty, 1990; Gillham and Burris, 1992; National Research Council, 1994). Permeable reactive barriers (PRBs) offer a low cost alternative to these methods. PRBs are permanent, semi-permanent, or replaceable units that are installed across the flow path of a contaminant plume (Feltcorn and Breeden, 1997). The PRBs contain a zone of reactive material that acts as passive in-situ treatment zones that degrade or immobilize contaminants, such as radionuclides, as groundwater flows through them (fig. 1.1).
Contaminant plume
Chemical barrier
Trench (filled)
Aquifer
Flow
Figure 1.1. Schematic diagram of permeable reactive barrier.
The impetus for the development of innovative treatment technologies is based on federal law and policy. Under the Superfund Amendments and Reauthorization Act of 1986 (SARA), USEPA is required to select remedial actions involving treatment that "permanently and significantly reduces the volume, toxicity, or mobility of the hazardous substances, pollutants, and contaminants" [Comprehensive Environmental Response, Compensation, and Liability Act (CERCLA), Section 121(b)]. Furthermore, �EPA expects to consider using innovative technology
2

iii
when such technology offers the potential for comparable or superior treatment performance or implementability, fewer or lesser adverse impacts than other available approaches, or lower costs for similar levels of performance than demonstrated technologies� [National Oil and Hazardous Substances Pollution Contingency Plan (NCP), 40 CFR Part 300.430 (a) (1) (ii) (E)]. This field demonstration project develops and tests an innovative use of an existing treatment technology. The results provide valuable information to decision makers regarding the use of this technology at existing Superfund sites.
1.3 Purpose and Scope The overall objective of this project is to demonstrate the use of PRBs to control the migration of radionuclides and other metals in groundwater. Three PRBs were installed in September 1997 at Fry Canyon (fig. 1.2). The purpose of this report is to summarize the experimental work leading to the design of the Fry Canyon experimental installation of three PRBs and the first year of treatability study results. This report summarizes preliminary laboratory work and first year field results. Based on these results, Chapter 10 provides a summary of recommendations for PRB implementation at sites contaminated with radionuclide and trace-metal contamination in groundwater. This report details information on the Fry Canyon site characterization, reactive material selection, PRB design and construction, operation and maintenance, and technology performance. This report is intended for use by Remedial Project Managers (RPMs), EPA regional technical support staff, contractors, stakeholders, technology vendors, and others tasked with remediation sites contaminated with radionuclides.
114° 113° 112°
0 20 40 60 KILOMETERS
0 20 40 60 MILES
Figure 1.2. Location of the Fry Canyon demonstration site in southeastern Utah.
Installing monitoring wells at the Fry Canyon demonstration site.
UTAH
42°
41° 110° 109°
40°
39°
38°
37°
111° Great Salt Lake
Rver
Rver
R v e r
UtahUtahLakeLake
Lak e P owell
Utah Lak e
Salt Lake CitySalt Lake CitySalt Lake City
RiverRiverRiverR iv e r JuanJuanJuan San
SanSan
Color
ado
Color
ado
Color
a do
Color
ado
River
River
River
River
3
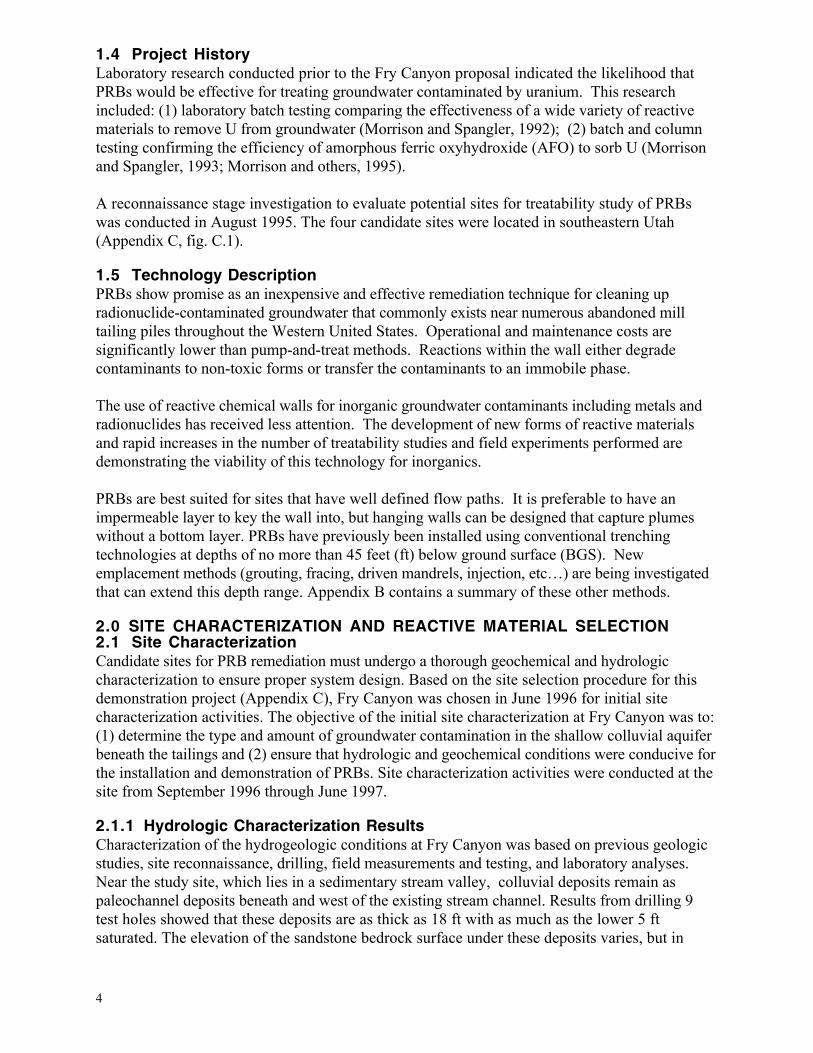
1.4 Project History Laboratory research conducted prior to the Fry Canyon proposal indicated the likelihood that PRBs would be effective for treating groundwater contaminated by uranium. This research included: (1) laboratory batch testing comparing the effectiveness of a wide variety of reactive materials to remove U from groundwater (Morrison and Spangler, 1992); (2) batch and column testing confirming the efficiency of amorphous ferric oxyhydroxide (AFO) to sorb U (Morrison and Spangler, 1993; Morrison and others, 1995).
A reconnaissance stage investigation to evaluate potential sites for treatability study of PRBs was conducted in August 1995. The four candidate sites were located in southeastern Utah (Appendix C, fig. C.1).
1.5 Technology Description PRBs show promise as an inexpensive and effective remediation technique for cleaning up radionuclide-contaminated groundwater that commonly exists near numerous abandoned mill tailing piles throughout the Western United States. Operational and maintenance costs are significantly lower than pump-and-treat methods. Reactions within the wall either degrade contaminants to non-toxic forms or transfer the contaminants to an immobile phase.
The use of reactive chemical walls for inorganic groundwater contaminants including metals and radionuclides has received less attention. The development of new forms of reactive materials and rapid increases in the number of treatability studies and field experiments performed are demonstrating the viability of this technology for inorganics.
PRBs are best suited for sites that have well defined flow paths. It is preferable to have an impermeable layer to key the wall into, but hanging walls can be designed that capture plumes without a bottom layer. PRBs have previously been installed using conventional trenching technologies at depths of no more than 45 feet (ft) below ground surface (BGS). New emplacement methods (grouting, fracing, driven mandrels, injection, etc�) are being investigated that can extend this depth range. Appendix B contains a summary of these other methods.
2.0 SITE CHARACTERIZATION AND REACTIVE MATERIAL SELECTION 2.1 Site Characterization Candidate sites for PRB remediation must undergo a thorough geochemical and hydrologic characterization to ensure proper system design. Based on the site selection procedure for this demonstration project (Appendix C), Fry Canyon was chosen in June 1996 for initial site characterization activities. The objective of the initial site characterization at Fry Canyon was to: (1) determine the type and amount of groundwater contamination in the shallow colluvial aquifer beneath the tailings and (2) ensure that hydrologic and geochemical conditions were conducive for the installation and demonstration of PRBs. Site characterization activities were conducted at the site from September 1996 through June 1997.
2.1.1 Hydrologic Characterization Results Characterization of the hydrogeologic conditions at Fry Canyon was based on previous geologic studies, site reconnaissance, drilling, field measurements and testing, and laboratory analyses. Near the study site, which lies in a sedimentary stream valley, colluvial deposits remain as paleochannel deposits beneath and west of the existing stream channel. Results from drilling 9 test holes showed that these deposits are as thick as 18 ft with as much as the lower 5 ft saturated. The elevation of the sandstone bedrock surface under these deposits varies, but in
4
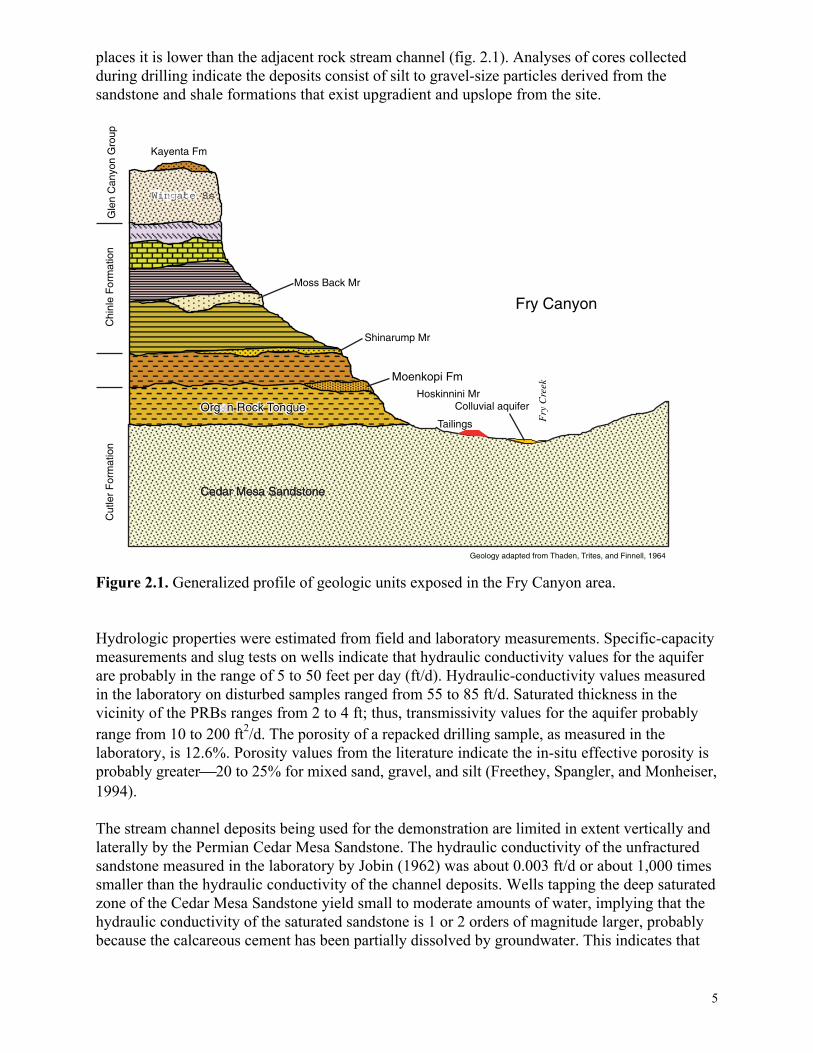
places it is lower than the adjacent rock stream channel (fig. 2.1). Analyses of cores collected during drilling indicate the deposits consist of silt to gravel-size particles derived from the sandstone and shale formations that exist upgradient and upslope from the site.
Kayenta Fm
Geology adapted from Thaden, Trites, and Finnell, 1964
Chi
nle
For
mat
ion
Cut
ler
For
mat
ion
Gle
n C
anyo
n G
roup
Colluvial aquifer
Fry
Cre
ek
Tailings
Organ Rock Tongue
Wingate Ss
Cedar Mesa SandstoneCedar Mesa Sandstone
Moss Back Mr
Fry Canyon
Shinarump Mr
Moenkopi Fm Hoskinnini Mr
Figure 2.1. Generalized profile of geologic units exposed in the Fry Canyon area.
Hydrologic properties were estimated from field and laboratory measurements. Specific-capacity measurements and slug tests on wells indicate that hydraulic conductivity values for the aquifer are probably in the range of 5 to 50 feet per day (ft/d). Hydraulic-conductivity values measured in the laboratory on disturbed samples ranged from 55 to 85 ft/d. Saturated thickness in the vicinity of the PRBs ranges from 2 to 4 ft; thus, transmissivity values for the aquifer probably range from 10 to 200 ft2/d. The porosity of a repacked drilling sample, as measured in the laboratory, is 12.6%. Porosity values from the literature indicate the in-situ effective porosity is probably greater20 to 25% for mixed sand, gravel, and silt (Freethey, Spangler, and Monheiser, 1994).
The stream channel deposits being used for the demonstration are limited in extent vertically and laterally by the Permian Cedar Mesa Sandstone. The hydraulic conductivity of the unfractured sandstone measured in the laboratory by Jobin (1962) was about 0.003 ft/d or about 1,000 times smaller than the hydraulic conductivity of the channel deposits. Wells tapping the deep saturated zone of the Cedar Mesa Sandstone yield small to moderate amounts of water, implying that the hydraulic conductivity of the saturated sandstone is 1 or 2 orders of magnitude larger, probably because the calcareous cement has been partially dissolved by groundwater. This indicates that
5

the contact between the sandstone and the colluvial deposits is probably an impediment to flow in the shallow groundwater system. The lateral edge of the aquifer is its depositional limit where it contacts the Cedar Mesa Sandstone. The existence of Fry Springs indicates that the sandstone more readily transmits groundwater through bedding-plane fractures, and it is thus possible that some groundwater could move between the sandstone and the channel deposits.
Water-level elevations in 6 wells and the elevations of Fry Creek adjacent to the aquifer provided data to construct an initial potentiometric contour map of the study site (fig. 2.2). The contour map shows that the aquifer is recharged by subsurface inflow from Fry Creek upstream of the site, by precipitation directly on the site, and by runoff from the sandstone upslope from the site. Additional recharge could be coming from lateral subsurface inflow at the contact between the sandstone and the channel deposits. Groundwater discharges from the aquifer by seeping back into Fry Creek, by evaporation where the saturated sediments are near land surface, by riparian vegetation (Tamarisk) transpiration and possibly downward leakage into the sandstone. Discharge measurements in Fry Creek in November 1997, indicate that about 10 to 15 acre-feet per year (ac-ft/yr) of groundwater seep into the stream along this 300-ft reach. Figure 2.3 illustrates how water moves into and out of this shallow aquifer system.
Potentiometric contours October 1996
200 FEET 100 0
0 50 METERS
5,355.45
5,355.58
5,355.38
5,356.01
5,355.95
5,356.40 5,356.22
5,356.79
5,358.05
5,357
5,357
5,356
5,356
5,359.56
5,358
5,358
5,358
Explanation
Potentiometric contour—Shows altitude at which water level would have stood in tightly cased wells, October 1996. Interval is 0.2 foot
Control point—Number is altitude of water level, in feet
Fry Creek
Fry Creek channel
Figure 2.2. Potentiometric surface of the colluvial aquifer during October 1996, Fry Canyon, Utah.
6

tream gain
Fry Creek Potentiometric contours
Runof
Stream
f loss
S
N Well
Precipitation
Tailings Piles
Figure 2.3. Conceptualization of ground-water movement in the colluvial aquifer at the Fry Canyon study site.
2.1.2 Water Quality Characterization Results Pre-installation ground- and surface-water quality were determined to establish baseline values that could be compared to post-installation water-quality and geochemical data. The pre-installation data were also used during design of the PRBs. Water quality and geochemical data were collected from 7 wells and 2 surface-water sites located on Fry Creek (fig. 2.4). Samples were collected during September 1996, December 1996, and April 1997 to determine seasonal variability prior to installation of the PRBs. A description of sample processing, analytical methods, and quality assurance results are presented and discussed in Appendix E.
7

FRYCRK3 (located 350 feet downstream from N
5,358
5,356
5,357 Fry Creek
Upgrader tailings 70 feet
EXPLANATION
Ground-water site and designation.
Surface-water site and designation
FC1
5,356
FRYCRK2
symbol)
FC8
FC5
FC4 FRYCRK3
FC2
FC3
FC7
FC1 (located 1,200 feet southest from symbol)
Potentiometric contour—Shows altitude at which water level would have stood in tightly cased wells in he colluvial aquifer. Contourinterval 0.2 feet. Datum is sea level.
Figure 2.4. Pre-installation ground- and surface-water sampling sites and potentiometric surface of the colluvial aquifer during October 1996, Fry Canyon, Utah.
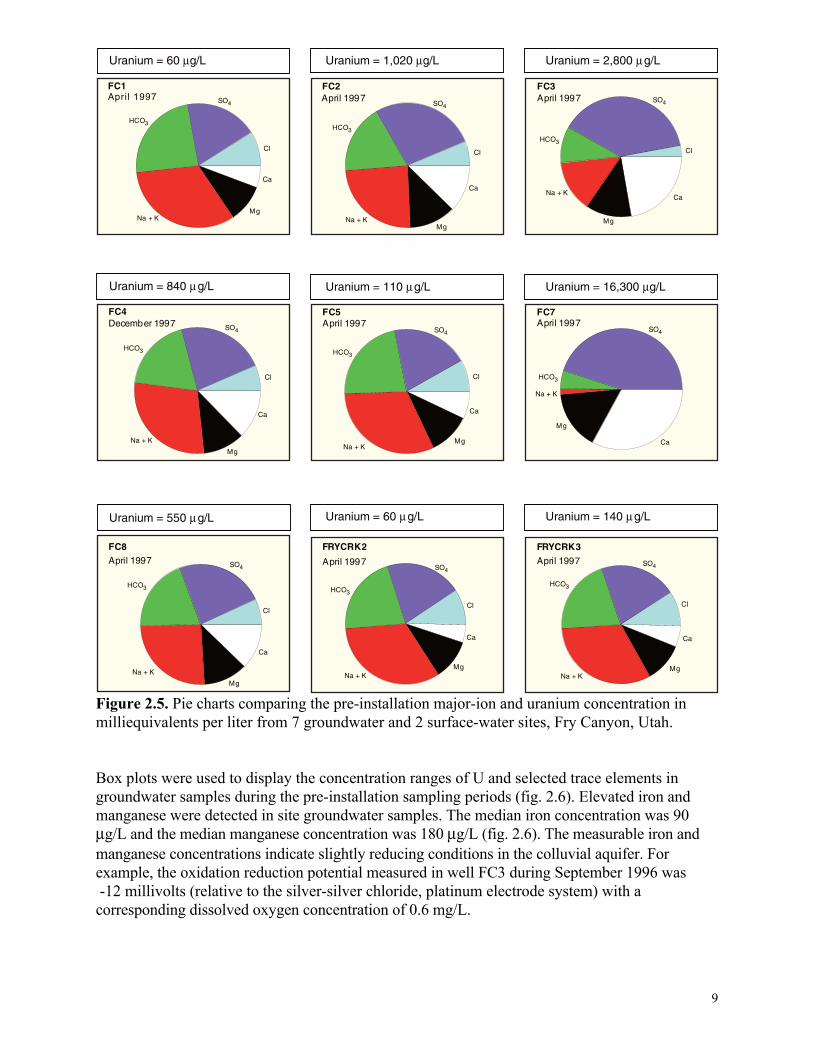
Pie charts were used to compare the major-ion chemistry, in milliequivalents per liter (meq/L), between the sample sites (fig. 2.5). The background well (FC1, U concentration = 60 µg/L) and the surface-water sites (FRYCRK2 and FRYCRK3, U concentration = 60 and 140 µg/L) have similar major-ion chemistry. The dominant cation is sodium. Bicarbonate and sulfate are the dominant anions (fig. 2.5). The similarity between the major ion chemistry at the background and surface-water sites verifies the strong surface-water/groundwater interaction in the colluvial aquifer at the site. Non-background wells in the colluvial aquifer that contain U concentrations of less than 600 micrograms per liter (µg/L) have major-ion chemistry similar to the background and surface-water sites (fig. 2.5). As the U concentration increases above 800 milligrams per liter (mg/L), the proportion of calcium and sulfate increases and the proportion of bicarbonate and sodium decreases. Water from wells FC3 and FC7 contained the largest U concentrations measured during the pre-installation characterization and are calcium sulfate water types.
8
Uranium = 60 µg/L Uranium = 1,020 µg/L Uranium = 2,800 µg/L
Uranium = 840 µg/L Uranium = 110 µg/L Uranium = 16,300 µg/L
FC4 December 1997 SO4
HCO3
Cl
Ca
Na + K
Mg
FC5 April 1997
SO4
HCO3
Cl
Ca
Mg Na + K
FC7 April 1997
SO4
HCO3
Na + K
Mg
Ca
Uranium = 550 µg/L Uranium = 60 µg/L Uranium = 140 µg/L
FC8 April 1997 SO4
HCO3
Cl
Ca
Na + K
Mg
FRYCRK2
April 1997 SO4
HCO3
Cl
Ca
Mg Na + K
FRYCRK3
April 1997 SO4
HCO3
Cl
Ca
Mg Na + K
FC2 April 1997
Na + K
Cl
Ca
Mg
SO4
HCO3
FC3 April 1997
Na + K
Cl
Ca
Mg
SO4
HCO3
FC1 April 1997
Na + K
Cl
Ca
Mg
SO4
HCO3
Figure 2.5. Pie charts comparing the pre-installation major-ion and uranium concentration in milliequivalents per liter from 7 groundwater and 2 surface-water sites, Fry Canyon, Utah.
Box plots were used to display the concentration ranges of U and selected trace elements in groundwater samples during the pre-installation sampling periods (fig. 2.6). Elevated iron and manganese were detected in site groundwater samples. The median iron concentration was 90 µg/L and the median manganese concentration was 180 µg/L (fig. 2.6). The measurable iron and manganese concentrations indicate slightly reducing conditions in the colluvial aquifer. For example, the oxidation reduction potential measured in well FC3 during September 1996 was -12 millivolts (relative to the silver-silver chloride, platinum electrode system) with a corresponding dissolved oxygen concentration of 0.6 mg/L.
9

Al Cu Fe Li Mn
Si Sr Zn U
CO
NC
EN
TR
AT
ION
, IN
MIC
RO
GR
AM
S P
ER
LIT
ER
10,000
1,000
100
10
1
DT = 50
DT = 20
DT = 10
DT = 10
DT = 4
DT = 50
DT = Lower analytical reporting limit
EXPLANATION
Maximum 99th precentile 95th precentile 75th precentile
Median
25th precentile 5th precentile 1st precentile Minimum
CHEMICAL CONSTITUENT
Figure 2.6. Pre-installation trace-element concentrations measured in groundwater samples collected during December 1996, February 1997, and April 1997.
The median copper concentration was below the analytical reporting limit of 4 µg/L and the median zinc concentration was at the reporting limit of 10 µg/L. The U concentrations were elevated at the site, ranging from 60 to 16,300 µg/L with a median concentration of 840 µg/L.
The U concentrations were determined in filtered, 0.45 micrometer (µm) and unfiltered water samples collected during December 1996 to document concentration differences. Because drinking water supplies are not typically filtered, it is important to document that sample filtration is not biasing the U concentration data. It is also important to document the filtered and unfiltered U concentration prior to PRB emplacement to determine if PRBs change the U distribution between filtered and unfiltered fractions.
To prevent clogging of analytical instruments the unfiltered samples were acidified with nitric acid to a pH of less than 2.0 units. After a 24-hour (hr) period, the acidified water sample was filtered and analyzed for U concentration. It is probable that this procedure will mobilize the U associated with particulates in the sample prior to the filtration step.
Comparison of the filtered (0.45 µm) and unfiltered samples (fig. 2.7) indicates no difference in the U concentration between the filtered and unfiltered samples. The slight differences that are observed are all within plus or minus 10%, which is the analytical uncertainty of the analytical method.
10

2 3 C1 C2 C3 C4 C5 C7 C8 K KF F F F F F F R RC CY Y
FR FR
10,000
1,000
100
Filtered (0.45 micrometers) Unfiltered
IN M
ICR
OG
RA
MS
PE
R L
ITE
R
UR
AN
IUM
CO
NC
EN
TRA
TIO
N,
SAMPLE SITE
Figure 2.7. Comparison of uranium concentration in filtered and unfiltered water samples collected during site characterization, December 1996, Fry Canyon, Utah.
Short-term fluctuations in U concentration in groundwater were measured during September 1996 to document the existence of a stable contaminant source. Well FC3 was pumped for about a 1-hour (hr) sampling period while unfiltered water samples were collected at one-gallon intervals. Analysis of these samples for U concentration indicated a stable U concentration, consistently above 3,000 µg/L (fig. 2.8).
1 2 3 4 5 3,100
3,200
3,300
3,400
3,500
3,600
3,700
UR
AN
IUM
CO
NC
EN
TATI
ON
,IN
MIC
RO
GR
AM
S P
ER
LIT
ER
VOLUME PUMPED, IN GALLONS
Figure 2.8. Uranium concentrations (unfiltered) during a 1-hour pumping cycle at well FC3, September 1996.
The measured pH of the groundwater at Fry Canyon was considered an important attribute in PRB design because changes in pH can affect numerous geochemical reactions. For example, under certain geochemical conditions, increases in pH can cause desorption of U from
11

12
contaminated sediments or precipitation of carbonate mineral phases. The pH values in 20 groundwater samples were near neutral during the pre-installation monitoring period. The pH values ranged from 6.9 to 7.7 and the median value was 7.3 units.
The U concentrations in sediment samples from the Fry Canyon site were determined prior to barrier installation to evaluate the potential for re-release of U from sediments downgradient of the PRBs. The PRBs were installed within the contaminant plume at this site for several reasons including efficiency of the installation process at this particular site. This project was not aimed at remediating the site but at assessing the effectiveness of PRBs in removing U. Obviously, at a remedial site it would be preferable to locate the PRBs downgradient of any contaminant plume. At this site, however, U desorbing from the aquifer material downgradient of the PRBs and upgradient of the monitoring wells had to be accounted for. Total U in subsurface samples of saturated colluvial material ranged from 2.95 parts per million (ppm) at well FC1 (background site) to 21.2 ppm at well FC3 (fig. 2.9). Total U concentrations were higher in the unsaturated colluvium samples than in the saturated samples collected from FC1 (6.6 ppm) and FC5 (59 ppm), indicating that rainwater has percolated through the tailings on the surface and concentrated significant quantities of U within the unsaturated colluvium.
Figure 2.9. Total uranium concentrations in subsurface sediment samples collected during September 1996, Fry Canyon, Utah. Concentration expressed in parts per million. Site FC1 is located offsite, approximately 0.2 miles to the southeast.
Desorption experiments indicate that sediments from the contaminated part of the colluvial aquifer at the Fry Canyon site contain a large amount of U that can be readily desorbed (fig. 2.10). Using sample FC3 as an example, 2.8 ppm out of the 21.2 ppm of the total U is readily desorbed. Making the following assumptions: (1) porosity equals 40%; (2) density of the solid
5,358
5,356
5,357
Upgrader tailings
15.5
21.2
10.3
17.9 [59.3]
2.95 [6.60]
FC2
FC3
FC4
FC8
FC1
EXPLANATION
2.95 [6.60]
FC1
5,356
70 feet
Fry Creek
Ground-water site and designation—Number indicates uranium concentration in sediment sample collected from saturated zone. Number in brackets indicates uranium concentration in sediment sample collected from unsaturated zone
Potentiometric contour—Shows altitude at which water level would have stood in tightly cased wells in the colluvial aquifer. Contour interval 0.2 feet. Datum is sea level
N

phase equals approximately 2.7 grams per cubic centimeter (g/cm3); and (3) density of groundwater equals 1.00 g/cm3; there would be about 4,000 grams (g) of sediment per liter of water resulting in 11.3 milligrams (mg) of desorbable U compared with the measured U concentration of 3.8 mg per liter of groundwater collected from well FC3. The desorption results indicate that water exiting the PRBs will initially desorb significant amounts of U from the contaminated sediments. This would not occur in a remediation application because the PRB would likely be placed in non-contaminated sediments downgradient of the contaminant source term.
FC1
FC2
FC3
FC4
FC5
WE
LL
NU
MB
ER
Potential uranium concentration from sediment desorption
Uranium concentration in ground water
0 2 4 6 8 10 12
URANIUM CONCENTRATION, IN PARTS PER MILLION
Figure 2.10. Uranium desorption results using samples collected from the colluvial aquifer at Fry Canyon during September 1996.
Two surface-water sampling sites were established on Fry Creek (fig. 2.4) to define pre-installation water quality and quantity on Fry Creek. Site FRYCRK2 was located upstream of the potential site for PRB installation. Site FRYCRK3 was located approximately 350 ft downstream of the upgrader tailings. The pH of the water samples from Fry Creek range from 8.4 to 8.6 units (table 2.1), which is more than 1 pH unit higher than the median pH of the shallow groundwater at the site. Concentrations of most trace elements in water samples from Fry Creek are less than the analytical reporting limit. The U concentrations in Fry Creek were significantly lower than in the groundwater samples and ranged from 60 to 140 µg/L during the pre-installation monitoring phase. Although Fry Creek is perennial throughout the study area, the discharge was very low, ranging from 0.025 to 0.043 cubic feet per second (cfs).
13

Table 2.1. Physical properties, trace-element concentration, and measured discharge at Fry Creeksurface-water sites, Fry Canyon, Utah.
[pH, in units; µS/cm, microsiemens per centimeter at 25 degrees Celsius; mg/L, milligrams per liter; µg/L,micrograms per liter; <, less than reported value; cfs, cubic feet per second; Al, aluminum; Cu, copper; Fe, iron; Li, lithium; Mn, manganese; P, phosphorus; Si, silicon; Zn, zinc; U, uranium]
Surface-water site Date Time
pH,field,
in units
Specificconduc-tance, in µ S/cm
Al, in
µg/L
Cu,in
µg/L
Fe,in
µg/L
Li,in
µg/L
Mn,in
µg/L
P,in
µg/L
Si,in
µg/L
Sr,in
µg/L
U,in
µg/L
Zn,in
µg/L Discharge, in cfs
FRYCRK2 12/18/96 1520 8.6 2,440 <50 <4 <20 2.1 20 <0.1 8.5 1.8 90 <10 0 .036
FRYCRK3 12/18/96 1605 8.4 2,110 <50 <4 <20 1.8 20 <0.1 6.9 1.5 140 <10 0 .043
FRYCRK2 04/09/97 1330 8.6 1,850 <50 <4 <20 1.5 <10 <0.1 6.2 1.4 60 <10 0.025
FRYCRK3 04/09/97 1245 8.6 1,865 <50 <4 <20 1.5 <10 <0.1 5.9 1.4 140 15 0.040
14

2.2 Reactive Material Selection Prior to work on the Fry Canyon Project, numerous materials had been tested in laboratory experiments for their ability to remove U and other inorganic contaminants from groundwater. Some of the results of these investigations are presented in Spangler and Morrison (1991), Blowes and Ptacek (1992), Morrison and Spangler (1992), Morrison and Spangler (1993), Kaplan et al. (1994), Morrison et al. (1995), Bostick et al. (1996), and Morrison et al. (1996). Based on these studies, three groups of reactive materials were selected for consideration: (1) phosphate, (2) zero-valent iron (ZVI), and (3) ferric iron (AFO). These materials are believed to remove U by the following mechanisms: (1) phosphate - precipitation of an insoluble uranyl phosphate phase, (2) ZVI - reduction of U to +4 oxidation state and subsequent precipitation, (3) AFO - by adsorption to the iron oxyhydroxide surface. Additional laboratory investigations were conducted to select a specific reactive material from each of these three groups to be used at Fry Canyon. Factors considered in selecting the materials included: (1) availability; (2) cost; (3) more permeable than surrounding aquifer material; (4) structural strength (resistance to compactive crushing when placed in the ground); (5) extent, rate, and duration of U removal; (6) mobility (i.e. the tendency for the material to move with the groundwater; e.g. the tendency for AFO to form mobile colloids); (7) potential for re-release of uranium; and (8) possible detrimental effects on groundwater quality such as pH change or release of iron or phosphate.
2.2.1 Characteristics of Reactive Material 2.2.1.1 Evaluation of Phosphate Material for Use in Permeable Reactive Barrier
Demonstration Hydroxyapatite and other apatite minerals have been found effective in immobilizing lead and other metals through the formation of metal phosphates that are insoluble over a range of chemical conditions (Ma and others, 1994a, b; Zhang and others, 1997). Recently, additions of hydroxyapatite to U contaminated sediments were shown to decrease U solubility (Arey and others, 1999). The hypothesis for the use of natural apatites to remove dissolved U from groundwater is that they provide a source of phosphate with which aqueous U(VI) should react to form insoluble uranyl phosphates, such as hydrogen, calcium, magnesium, potassium or sodium autunite (e.g. [Ca(UO2)2(PO4)2•10H2O]) (Sowder et al, 1996; Sandino and Bruno, 1992; Arey and other, 1999). The effectiveness of removal of aqueous U by commercially available natural apatite materials (phosphate rock, bone meal, and bone meal charcoal) was determined in laboratory batch uptake and column experiments. The results of the laboratory evaluation were used for choosing specific phosphate material for the field demonstration. Other criteria for choice of material for use in PRBs include the extent of reversibility of U removal, permeability of the reactive material, release of solutes detrimental to water quality.
Batch uptake experiments with synthetic, reagent grade hydroxyapatite indicated that 15 mg/L of U(VI) was completely removed by 6.7 gram per liter (g/L) of solid. Because the cost of this material was prohibitive for use in field applications, lower cost, commercially available natural apatite materials were evaluated. Phosphate rock samples were obtained from mining companies in Florida, North Carolina, and Utah. The mined rock had been separated from accessory minerals and crushed to fine-sand or silt grain size prior to receipt. The phosphate bearing minerals in phosphate rock are fluoroapatite and carbonated fluoroapatite. Fertilizer-grade bone meal and bone charcoal also were obtained for testing because the inorganic component in bone is primarily hydroxyapatite.
15

The results for both the batch and column experiments described below indicated that bone-meal phosphate materials were much more effective for U removal from groundwater. However, use of these materials in field-scale demonstration would require dilution with an inert coarse material to obtain adequate barrier permeability. Instead, a pelletized bone charcoal (2-mm diameter) was also evaluated for use in the reactive barrier. Pelletized bone charcoal was produced by firing fertilize-grade bone meal mixed with aluminum and phosphate binders at 1100° C in the absence of air. Several formulations of bone-char pellets were evaluated which included pellets fired in air to remove carbon and pellets with an iron binder. Cercona of America manufactured all the formulations of bone-char pellets evaluated. The cost of the Cercona of American bone-char pellets was about $65 per cubic foot (table 2.2).
2.2.1.2 Evaluation of Zero Valent Iron Material for Use in Permeable Reactive Barrier Demonstration
ZVI is a scrap product available principally from the automotive industry. Several companies broker the scrap ZVI and sieve it to customers� specifications. Usually, the brokers also heat treat the ZVI by roasting it in an oven at temperatures of about 1,200 degrees C. Heating removes cutting oils that may have been present. ZVI products tested in this investigation are listed in Table 2.2.
Table 2.2. Products tested during the laboratory investigation. Products 2, 12, and 15 were selected for the Fry Canyon Demonstration project. Bulk prices may be less. [ZVI, zero valent iron; AFO, amorphous ferric oxyhydroxide; vol, volume; --, information not available]
Vendor Product Name
Sieve S ize
Cost per cubic foot
Description
1 Cercona Cast iron -8 +50 $30 ZVI filings 2 Cercona Foam Pellets -3 +50 $40 Foamed aluminosilicate-bound pellets 3 Cercona Foam Aggregate -3 +50 $35 Foamed aluminosilicate aggregate 4 Cercona MV Pellets -- -- Magnetite/ZVI (mixed valent) pellets 5 Cercona MV Foam Block -- -- Magnetite/ZVI (mixed valent) foam block 6 Cercona ZVI/Zeolite -- -- ZVI + 25% zeolite in pellets 7 Cercona ZVI/Magnetite -- -- ZVI + 20% Fe3O4 in pellets 8 Connelly GPM CC-987 -18 +40 $30 ZVI filings 9 Connelly GPM CC-1004 -8 +50 $30 ZVI filings 10 Connelly GPM CC-1010 -18 +60 $30 ZVI filings 11 Master Builder GX027 -8 +50 $30 ZVI filings 12 Cercona Bone char pellets -3 +20 $65 Charred bone meal with aluminophosphate binder 15 Noah Ind. AFO slurry -5 +18 $40 AFO slurry mixed with gravel (1:2 vol/vol)
Products 1, 8, 9, 10, and 11 are ZVI filings that have been sieved and heat treated by the brokers. The other products have been custom processed by Cercona. To produce product 2 (Foam Pellets), Cercona pelletizes fine-grained ZVI with an aluminosilicate binder. A foaming agent (aluminum powder which produces hydrogen gas) is added during the pelletizing process. The pellets are then fired which increases their strength. The process results in low-density, high strength, porous pellets with greater than 90% ZVI. The manufacturing of product 3 (Foam Aggregate) is similar to the Foam Pellets except that the foamed aluminosilicate bonded ZVI is not rolled into pellets and is not fired. This product is less costly than the Foam Pellets but does not have as high structural strength and is more likely to be crushed when buried. The aluminosilicate binder can be used to produce other shapes such as Foam Blocks (product 5).
16

Products 4, 5, 6, and 7 were manufactured using the aluminosilicate binder but used a variety of raw materials.
The sieve size that has been used most often in PRBs is �8 +50. That is, the material passes through an 8-mesh sieve (2 mm) but does not pass through a 50-mesh sieve (0.3 mm). The cost of the raw material screened to �8 +50 is about $350 per ton. Equivalent weights of Cercona customized products are more expensive. However, because their density is much less, the cost per unit volume is similar to unprocessed ZVI filings. The cost of ZVI foam pellets is about $40 per cubic foot which is only slightly higher than the $30 per cubic foot cost of unprocessed ZVI filings (Morrison and others, 1998).
2.2.1.3 Evaluation of Amorphous Ferric Oxyhydroxide Material for Use in Permeable Reactive Barrier Demonstration
AFO is prepared by rapid hydrolysis of a ferric salt solution. Ferric chloride (FeCl3) is the least expensive form of ferric salt. Hydrolysis is accomplished by adding a base such as sodium hydroxide (NaOH) to a solution of ferric chloride. The ferric chloride solution is acidic and the hydrolysis reaction is exothermic. The temperature of the solution increases as NaOH is added. A temperature increase to about 50oC causes substantial amounts of goethite (FeOOH) to form. Goethite is more crystalline than AFO and less effective in stabilizing uranium.
AFO is not available commercially in a form that can be used in a PRB. The raw materials (ferric chloride and sodium hydroxide) can be purchased commercially at a cost of about $625 per ton of AFO [as Fe(OH)3]. Material costs could be reduced by using a locally available base such as limestone in lieu of sodium hydroxide. For a large job it may be cost-effective to mix the ferric chloride and base at the site. AFO is also available as a food-grade slurry at a cost of about $23,000 per ton of AFO. Although a lower grade of AFO would be acceptable for use in PRBs, no vendors produce and market a lower grade. The slurry has to be mixed with sand or gravel to use in a PRB. At the Fry Canyon demonstration site, food-grade AFO slurry (2% Fe) was mixed with pea gravel. The cost of this mixture was about $40 per cubic foot.
2.2.2 Laboratory Evaluation of Phosphate Materials Physical characterization. Phosphate materials were characterized for release of phosphate as a function of time in batch experiments identical to U uptake experiments except without the addition of dissolved uranium. Grain-size distribution of phosphate materials was determined by dry sieving if not provided by the vendor. Specific surface areas of phosphate materials were determined by single-point nitrogen BET measurement. Bone-char pellet solid density was determined by water displacement. Internal porosity of bone-char pellets was determined by weight loss during drying of water-saturated pellets. The permeability of bone-char pellet formulation chosen for the PRB demonstration was determined from the flow rate of water through packed columns as a function of hydraulic head using a modified Marriot bottle apparatus. Permeability, expressed as hydraulic conductivity (K ft/day), was calculated from the dependence of flow rate on hydraulic head using Darcy�s law and corrected for conductivity of the apparatus.
Laboratory batch uptake experiments. Batch uptake experiments provide a test of the relative efficiency of each material for U removal under similar solution conditions. In addition, the time dependence of the removal process can be evaluated in the absence of transport limitations. Uptake of U was measured as a function of time and total U concentration. The phosphate materials were used as received. Solid concentrations of 10 and 100 grams solid per liter of
17

artificial groundwater (AGW) were used for fine-grain and coarse-grain phosphate materials, respectively. Batch U(VI) uptake experiments were conducted in pH 7 AGW of similar major ion composition to Fry Canyon groundwater (alkalinity 4.8 meq/L, ionic strength 0.04 molar (M)). In this groundwater, dissolved U(VI) speciation is dominated by uranyl carbonate species. The solid was equilibrated with the AGW in either 50- or 250-mL centrifuge bottles prior to addition of dissolved uranium. Dissolved U (U(VI)) stock solutions were prepared from reagent uranyl nitrate and added to batch experiments to yield total U concentrations of 2.4 to 48 mg/L. Sample pH was measured after addition of U and adjusted to pH 7 with dilute acid or base as needed. Samples were then equilibrated from 1 to 96 hrs. The pH was measured and samples centrifuged at 16,000 Gravitational Units (G) for 10 minutes. The supernatant was sampled for dissolved uranium, cations and phosphorous (P) analyses. Initial experiments used a 233U tracer added to the U(VI) stock solution and U concentration was determined by liquid scintillation counting (LSC) of the 233U alpha decay. Dissolved U was determined in subsequent experiments by kinetic phosphorescence analysis (KPA). LSC had a precision of ±2% and 5 microgram per
liter detection limit for 233U labeled 2.4 mg/L initial total U. The extent of U uptake was determined by the change in dissolved U concentration after equilibration with the phosphate solid divided by the solid concentration.
Column experiments. Column experiments were used to determine the volume of uranium-contaminated groundwater that can be passed prior to U(VI) breakthrough. In addition, column tests provide a means to determine the total capacity of phosphate materials for U removal under concentrations and flow-rates expected in the field application.
Glass columns of 1-centimeter (cm) inside diameter fitted with 20-µm end-cap screens were used for bone meal and phosphate rock experiments. Bone-char pellets were packed dry into 2.5-cm diameter columns. Column outlets were fitted with 0.45-mm syringe filters. Initial tests of columns packed with bone meal failed because of clogging either from bacterial growth or loss of integrity. The small grain size of some phosphate materials resulted in too low a column permeability for experimental tests. Because of the small grain size and/or clogging, both the phosphate rock and bone meal were diluted ten-fold by weight with coarse sand (20 to 30 mesh) to achieve adequate permeability. The sand had negligible U uptake in a batch experiment. Mixtures of phosphate solid and sand were prepared by weight, wetted with AGW, and packed into the column in ten to fifteen increments. Packed columns were saturated with AGW by slow upward flow. Column test with bone charcoal was not feasible due to mobility of this very fine-grained (3 to 15 µm diameter) material out of the column.
The larger particle size of the bone-char pellets enabled packing into column without dilution with sand. Packed columns were flushed with carbon dioxide (CO2). Deionized water was then passed to dissolve the CO2. This method was effective in eliminating gas pockets.
Column pore-volume was calculated from the weight of the packing material and total column volume. The internal porosity was assumed negligible for the phosphate rock, bone meal and Ottawa sand. Internal porosity of bone-char pellets (see below) was included in calculation of column pore volume.
Artificial groundwater with 12 mg U/L was passed through the columns at 10 mL/hour using gravity feed and upward flow. The AGW feed reservoir was continuously equilibrated with a 2% CO2 in air to maintain constant pH of 7±.1 pH units. Volume and flow rate of AGW passed was
18

Table 2.3. Physical characteristics of phosphate rock and bone meal materials evaluated. Grain size expressed as percentages by weight of diameter in microns (µm).
[<, less than; m2/g, square meters per gram; mg P/L, milligrams phosphorous per liter; µm, microns;%, percent]
Specif ic surface
area Phosphate
concentration
Material I D Source (m2/g) Grain-size (mg P/L)#
Phosphate Rock
SF SF Phosphates, LTD Vernal, Utah mine
4.2 75% 125 to 1000 µm 25% <125 µm
0.9
Phosphate Rock
PCS PCS Phosphates Raleigh, North Carolina
14.4 95% 125 to 1000 µm 5% <125 µm
14
Phosphate Rock
CF CF Industries Plant City, Florida
12.2 51% 125 to 1000 µm 47% <125 µm
0.8
Bone meal, cooked
B1 Fertilizer company Dale Alley Company St Joseph, Missouri
6.6 55% >500 µm 45% <500 µm
1.0
Bone meal, steamed
B2 Fertilizer company Dale Alley Company St Joseph, Missouri
0.3 100% < 63 µm 17
Bone Charcoal BK EM Scientific 64 3 –15 µm 5.3
determined from the mass of each effluent sample. Column-effluent dissolved U was measured by either LSC or KPA. Cation and dissolved P in column effluents were measured by inductively coupled plasma optical emission spectrometry (ICP/OES). Effluent pH was measured periodically using a flow-cell electrode. Total U uptake per gram of phosphate material was calculated from the difference between total U input and outflow, divided by mass of phosphate material in the column. The influent was changed to U-free artificial groundwater after U-breakthrough to test the reversibility of U uptake.
Physical and chemical characteristics. Grain size and N2-BET surface area of the various phosphate materials tested are given in Table 2.3 along with abbreviation for each material. The grain size was used in determining the solid concentration used in initial batch experiments. A solid concentration of 10 g/L was used for the fine-grained materials and 100 g/L for the coarser materials. Surface area for the B-2 bone meal was very low in comparison to the other materials perhaps because of its large particle size. XRD patterns of bone charcoal (BK1) and bone char pellets (CP3) are dominated by hydroxyapatite peaks.
# Phosphate concentration in batch experiment after 24-hour equilibration with artificial ground water in the absence of uranium.
Bone-char pellets are 80% by weight or greater 2-4 mm diameter with larger particles comprising most of the remainder (table 2.4). The internal volume or porosity of the pellets was 0.6 to 0.8 cm3 per gram of pellets. Scanning electron-microscope (SEM) images illustrate the highly porous structure of the pellets (fig. 2.11) which likely account for the high surface area of this material
19

(table 2.4) compared to expected surface area of spheres of the size range of these pellets. Pores range from a few µm in diameter to upwards of 100 µm. SEM images also indicate presence of a fine-grained material of 0.5 and 5 µm in diameter. Only Ca and P were detected in these fine-grained particles using energy dispersive X-ray analysis. These elements were also detected on pellet surface in areas devoid of these fine-grained particles. Smaller amounts of aluminum from the binder were also detected.
Table 2.4. Physical properties of bone-char phosphate pellet formulations CP3 and CP5. CP5 used in PRB field demonstration.
[%, percent; mm, millimeters; ft/day, feet per day; m2/g, square meters per gram; cm3/g, cubic centimeters per gram; mg P/L, milligrams phosphorous per liter; cm/sec, centimeters per second]
Property C P - 3 C P - 5 UNITS
Grain-size % >4 mm 7.5 13.8 percent
% 2-4 mm 65.3 42.9 percent
% 1-2 mm 23.7 39.4 percent
% <1 mm 3.5 3.8 percent
Hydraulic Conductivity 0.85 0.55 cm/sec
Hydraulic Conductivity 2400 1560 ft/day Specific Surface Area 33 44 m2/g Inter-particle Porosity 20 19 percent
Intra-particle Volume 0.83 0.59 cm3/g pellets
Intra-particle Porosity 55 51 percent
Phosphate Concentration # 0.9 7.8 mg P/L
# Phosphate concentration in batch experiment after 24-hour equilibration with artificial ground water in the absence of uranium.
20

Figure 2.11. Electron micrograph of bone-char phosphate pellets (CP5) illustrating morphology and porosity of the material.
The effective porosity determined from 3H breakthrough agreed within 5% of the calculated column pore volume when the internal volume of the pellets was included. This comparison indicates that there is rapid exchange of groundwater between the inter-particle porosity and the
21

bone-char internal porosity. The measured hydraulic conductivity of the CP3 and CP5 bone-char pellet formulations greatly exceeded estimates of aquifer hydraulic conductivity (table 2.4).
Dissolved phosphate ([PO4]) released into AGW from apatite solids was measured in batch experiments in the absence of dissolved uranium. After 24-hr reaction period, the bone meals and bone charcoal had greater [PO4] concentrations than phosphate rock with the exception of the PCS phosphate rock (table 2.4). The CP3 bone-char pellets phosphate release was about a factor of ten lower than the CP5 formulation of pellets (table 2.4).
Results of batch and column U uptake experiments. The U uptake reached steady state within 24 hrs for all solids tested. A 48-hr equilibration time was used to compare uptake among the different phosphate materials. On a per mass basis, the bone meal and bone charcoal removed 1.5 to 2 orders of magnitude more U than the crushed phosphate rock (fig. 2.12). The U uptake by bone-char pellets (CP3 and CP5) was about a factor ten lower than the bone meal and bone charcoal. The bone-char pellets with an iron binder had similar U uptake as the CP3 and CP5 pellets but caused the pH to increase to 9.4 or higher. The bone meal pellets fired in air had about 40% lower U uptake compared to pellets fired in the absence of air (CP3 and 5). The uptake of U in batch experiments was independent of the amount of [PO4] released from the solid prior to addition of uranium.
22

LO
G U
RA
NIU
M U
PTA
KE
,M
ILL
IGR
AM
S P
ER
GR
AM
SO
LID
Bone Meal B1
Bone Meal B2
Bone-Black Charcoal BK
Bone-char Pellets CP3
Bone-char Pellets CP5
Phosphate Rock SF
Phosphate Rock PCS
Phosphate Rock CF
-0.5
0.5
1.5
-1.5
-1.0
0.0
1.0
-3 -2 -1 0 1 2
LOG DISSOLVED URANIUM, MILLIGRAMS PER LITER
Bone-char Pellets CP3
-1
0
1
LO
G U
RA
NIU
M U
PTA
KE
, MIL
LIG
RA
MS
PE
R S
QU
AR
E M
ET
ER
OF
SO
LID
Phosphate Rock SF
Phosphate RockPCS
Phosphate Rock CF
Bonemeal B1
Bone meal B2
Bone Charcoal BK
Bone-char Pellets CP5
-3
-2
-3 -2 -1 0 1 2
LOG DISSOLVED URANIUM, MILLIGRAMS PER LITER
Figure 2.12. Batch uranium (U) uptake on various phosphate materials at pH 7 in Fry Canyon artificial groundwater. The U uptake (log milligrams (mg) U per gram (g) phosphate solid) versus equilibrium dissolved U concentration (log dissolved U in mg/L).
The absolute reactivity of solid phases for removal of solutes is best compared on a site density basis if the reaction process occurs at the solid surface, instead of on a per mass basis. The N2-BET surface area was used as an indicator of surface site density by normalizing U uptake to a
23

per surface area basis (mg U/m2). Normalizing uptake per unit area resulted in much smaller differences among all the materials except the bone meals, which had significantly greater U uptake per m2 (fig. 2.12). It is unclear why the fertilizer-grade bone meals had greater U uptake per m2. With the exception of the bone meal data, the smaller range in U uptake per m2 is consistent with a removal process occurring on the surface of the apatite solids. However, for evaluation of potential PRB materials uptake per mass is a better indicator since the size (thickness) of the PRB limits the mass of reactive material that can be used in the barrier.
In column tests at 12 mg/L dissolved U influent, the phosphate rock materials reached 50% breakthrough rapidly (within 7 to 18 pore volumes). Maximum uptake of U ranged from 0.16 to 0.4 mg U per gram of phosphate rock. In contrast, 216 pore volumes were required to reach 50% breakthrough with bone meal. A maximum U uptake of 7.7-mg U per gram of bone meal B1 was observed. The column with B2 bone meal diluted with sand was terminated due to clogging after 155 pore volumes. No significant U breakthrough was measured to this point. Clogging was likely due to bacterial growth.
In a column packed with the CP3 bone-char phosphate pellets (undiluted), 50% breakthrough occurred after 100 pore volumes (fig. 2.13). Complete breakthrough (100%) occurred at 190 pore volumes of 12 mg U/L in AGW. A maximum uptake of 1.4-mg U per gram pellets was observed. The column test with bone char pellets with iron binder clogged within ten pore volumes due to oxidation and cementing of pellets in the upgradient end of the column. The bone meal pellets fired in air (CP2) had complete U breakthrough within 20 pore volumes. Table 2.5 summarizes the breakthrough and maximum uptake for the different phosphate materials tested.
0.2
0.1
0.0
C/C
(R
AT
IO O
F E
FF
LU
EN
T
o
TO IN
FL
UE
NT
UR
AN
IUM
CO
NC
EN
TR
AT
ION
) 1.0
0.9
0.8
0.7
0.6
0.5
0.4
0.3
mg U/g solid C/Co
2.0
1.8
1.6
1.4
1.2
1.0
0.8
0.6
0.4
0.2
0.0
UR
AN
IUM
CO
NC
EN
TR
AT
ION
ON
SO
LID
, M
ILIIG
RA
MS
PE
R G
RA
M S
OL
ID
0 50 100 150 200
COLUMN PORE VOLUMES
Figure 2.13. Breakthrough of uranium in bone-char column plotted as the ratio of column effluent dissolved uranium to influent dissolved uranium versus number of column pore volumes passed. The cumulative uptake of uranium (mg uranium/g solid) versus column pore volumes is also calculated and assumes uranium uptake is uniform by the entire mass of solid within the column.
24

Table 2.5. Summary of column results for uranium breakthrough and uptake by different phosphate materials for 12 milligrams per liter dissolved uranium in pH 7 artificial groundwater. All phosphate materials were diluted ten-fold with sand except bone-char pellets.
Material Pore volumes to Uranium uptake at 50% breakthrough 100% breakthrough
mg U per gram solid Phosphate Rock SF 7 0.16 PCS 11 0.22 CF 18 0.41 Bone meal B1 216 7.7
B2 * 155 4.6 Bone-char pellets@
CP3 100 1.4 CP5# 250 0.7
* column terminated at 20% breakthrough due to clogging@ bone-char pellets packed undiluted # 2.4 mg/L dissolved uranium influent
There was little change in the pH of groundwater passing through any of the columns packed with any of the phosphate materials tested except the bone char pellets with ZVI binder (CP1) which had an effluent pH of 9 or higher. Little change in major ion concentrations was observed in column effluents.
Phosphate release from the CP3 bone-char pellet column was initially 3.5 mg P/L and decreased to about 0.7 mg/L after 37 pore volumes. Phosphate concentrations remained relatively constant at 0.68 ± 0.11 mg P/L throughout the uptake to 100% U breakthrough and subsequently during the U-release test using U-free AGW. Similar levels of [PO4] release were observed in the first 100 pore volumes of U-free AGW passed through a column of CP3 pellets. These results suggest that U removal is not dependent on release of phosphate to solution, that is U removal is not occurring by precipitation directly from groundwater, but instead is removed by some process occurring at the solid surface. In addition, the release of P from the PRB would be sustained at levels that might be detrimental to aquatic systems downgradient if no subsequent processes removed P from groundwater. At Fry Canyon, removal of [PO4] by sorption to iron coatings on aquifer sediments is expected to remove most [PO4] prior to discharge into Fry Creek.
Characterization of potential for release of U from barrier materials using column experiments. Release of U from phosphate materials was initiated after 100% breakthrough by passing U-free artificial groundwater through the column. Greater than 65% of the U uptake was released from phosphate rock columns within 20 to 30 pore volumes of U-free AGW passed. In contrast, a slower release of U was observed from bone meal columns with less than 30% of total U uptake released after 350 pore volumes. An initial release of about 40% of the total U uptake (1.4 mg U/g) from the CP3 bone-char pellet column occurred over the first 75 pore volumes of elution (fig. 2.14). At that point the effluent U concentration had decreased to 2.4 mg U/L. A
25

slower release of U continued with 1,000 pore volumes required to reach U effluent concentration equal to 1% (0.12 mg/L) of the initial influent concentration. At this point, 80% release of the U from the solid had occurred. The concentrations of U in column effluents in release experiments were in excess of the proposed drinking limit of 20 µg/L. The extent of release measured indicates that in the field, U may be released to groundwater after complete breakthrough if uranium-free groundwater subsequently entered the barrier. However, about half of the U release would occur over a long period of time.
0.0
mg U/g solid
C/Co
2.0 1.0
C/C
(R
AT
IO O
F E
FF
LU
EN
T
o
TO IN
FL
UE
NT
UR
AN
IUM
CO
NC
EN
TR
AT
ION
)
UR
AN
IUM
CO
NC
EN
TR
AT
ION
ON
SO
LID
, M
ILIIG
RA
MS
PE
R G
RA
M S
OL
ID
1.8 0.9
1.6 0.8
1.4
0.6
0.7
1.2
0.5 1.0
0.4 0.8
0.3 0.6
0.2 0.4
0.1 0.2
0.0 150 400 650 900 1,150
U inflow off COLUMN PORE VOLUMES
Figure 2.14. Release of uranium from bone char column plotted as the ratio of column effluent dissolved uranium to initial influent dissolved uranium versus number of column pore volumes passed.
Possible U removal processes. The removal of dissolved U is postulated to occur by formation of a uranyl phosphate phase, in part because of the low solubilities of uranyl phosphates such as various forms of autunite (Ca, Mg, K, Na, or H uranyl phosphate). However, because there are many uranyl phosphate phases and the solubility constants for some of these phases are not well defined (Grenthe and others, 1992), calculation of the degree of saturation for these phases can not be used to determine the precipitation of a specific phase. Instead, spectroscopic and X-ray diffraction techniques were used to characterize the process of U uptake. In addition, it is unclear whether U removal occurs by precipitation directly from solution or by reaction at the apatite surface. Knowledge of the process of U uptake by phosphate materials is needed for modeling U transport in the PRB.
Extended X-ray absorption fine-structure spectroscopy (EXAFS) was used to characterize the process(es) of U uptake by apatite on a molecular scale. The U-edge EXAFS spectra are characteristic of the local bonding environment of uranium. The spectra are used for phase identification by comparing with spectra of phases of known structure. In addition, the distance and coordination number of nearest and next-nearest neighboring atoms to U can be derived from
26

sample spectra for comparison to distance and coordination of likely bonding environments. Synchrotron-source X-ray diffraction (XRD) also was used to identify the presence of crystalline uranyl phases in the reacted apatite materials. This technique provides significantly greater angular resolution and sensitivity than standard laboratory XRD instruments.
The U-LIII X-ray absorption edge positions of reacted bone meal, bone charcoal, and bone-char pellets indicate that U remains in the +6 oxidation state instead of being reduced. The U-edge EXAFS of U reacted with bone-char pellets, bone charcoal, and bone meal at total U concentrations to 5,500 ppm indicate a different bonding environment than observed for uranyl phosphates autunite [Ca(UO2)2(PO4)2•10H2O], meta-ankoleite [K2(UO2)2(PO4)2•6H2O], saleeite [Mg(UO2)2(PO4)2•10H2O] or for schoepite [UO2(OH)2•2H2O] and several uranyl carbonate mineral specimens. However, the EXAFS spectra of hydroxyapatite with U uptake of greater than 7,000 ppm were similar to autunite.
Synchrotron-source XRD patterns of these samples also did not indicate presence of any known uranyl phosphate phase. Crystalline U(VI)-phosphate solids, autunite and chernikovite [(H3O)2(UO2)2(PO4)2•6H2O] were present only in XRD patterns of reagent-grade hydroxyapatite with U uptake concentrations of greater than 7,000 ppm. Detection limits of about 350 ppm and 2,000 ppm U, were determined for autunite and chernikovite, respectively. No evidence for these crystalline precipitates were observed in any of the samples prepared from bone-char materials, which had U(VI) solid concentrations ranging from 800 to 5,500 ppm. These results, in combination with EXAFS measurements, suggest that the predominant U(VI)-removal process is complexation by phosphate in the apatite surface (e.g. adsorption) at uptake levels of column experiments or expected in the field demonstration.
2.2.3 Laboratory Evaluation of Zero Valent Iron and Amorphous Ferric Oxyhydroxide Materials
Issues addressed in the laboratory investigations include (Spangler, 1997): 1) development of a suitable form of AFO for use in a PRB, 2) efficiency of U removal by ZVI and AFO from Fry Canyon groundwater, 3) hydraulic conductivity, and 4) mobility of the reactive materials in groundwater. Four types of experiments were performed: (1) tests to determine suitable mixtures of AFO slurry and gravel, (2) batch tests of contaminant uptake, (3) column tests of contaminant uptake, and (4) hydraulic conductivity measurements. Batch and column experiments used groundwater (FRGW) from well FR3 at the Fry Canyon site. FRGW had the following composition: Ca 270 mg/L, Na 286 mg/L, Mg 84 mg/L, Mn 0.292 mg/L, K 5.12 mg/L, Fe 0.0104 mg/L, Sr 1.75 mg/L, Cl 108 mg/L, PO4 <0.086 mg/L, SO4 987 mg/L, U 2.09 mg/L, alkalinity 411.0 mg/L as CaCO3, and pH 7.2 to 7.6.
Laboratory batch uptake experiments. Batch tests were performed by agitating the reactive material with 35 mL of FRGW in an end-over-end rotator. After agitation for 3 days, the mixtures were centrifuged to remove particles with greater than 2 µm diameters. The U concentrations were measured on the decanted fluids.
Three-day batch tests were conducted on a variety of ZVI-based materials and two AFO mixtures. The results indicated that with the exception of 3 materials (Cercona ZVI/zeolite, Cercona mixed valent pellets, and Cercona mixed valent foam block), all reactive materials had potential for significant U removal (fig. 2.15).
27

ixed
Val
enc
Mas
ter B
ona
Foam
Cerc
ona
McreC
Cerc
ona
Mc
Cer
cona
reC
0
200
400
600
800
1,000
1,200
1,400
1,600
1,800
2,000
F I N
A L
DI S
S O
L V
E D
UR
A N
I UM
CO
NC
E N
T R
A T I O
N,
IN P
A R
T S
PE
R B
I LL
IO N
ixed
Val
ence
Pel
lets
uild
ers
GX0
27
ona
Foam
ed F
e Pe
llets
1.10
8 gm
AF
O
e Fo
am B
lock
Zeo
lite
ggre
ate
6/50
Poro
us F
e (2
0%
Conn
ely
CC-9
87
Con
nelly
CC-
1010
Con
nelly
CC-
1004
ed F
e A
ggre
gate
0.22
15 g
m A
FO
4
Fe3
O )
Cer
cona
Cas
t Fe
Filin
gs
-
Peer
less
Iron
AC
erco
na Ir
on 2
5%
Figure 2.15. Uranium concentrations in 3-day batch tests on a variety of reactive materials. Experiments with amorphous ferric oxyhydroxide contained the indicated amount amorphous ferric oxyhydroxide with 35 milliliters of Fry Canyon groundwater. All other experiments contained 0.5 g of reactive material and 35 milliliters of Fry Canyon groundwater. Initial uranium concentration was 2,090 µg/L.
Selection of materials for additional investigation in column experiments was based on: (1) results presented in Figure 2.15, (2) data from published literature, (3) cost, (4) hydraulic conductivity, and (5) the objectives of the Fry Canyon project. Two materials were selected: AFO-coated gravel and ZVI foam pellets. The ZVI foam pellets have excellent structural strength, high hydraulic conductivity, and removed significant amounts of U from solution. AFO was capable of removing a significant amount of U from solution. Because it is very fine grained and would have low hydraulic conductivity in a PRB, it had to be mixed with gravel to achieve a suitable hydraulic conductivity. AFO slurry-to-gravel ratios were determined by mixing various proportions in a 3-gallon bowl and observing the consistency of the mixture. The maximum amount of AFO slurry that could be used without the mixture becoming too �soupy� was about 2 weight% Fe as AFO.
Column experiments. Column tests were conducted in 10-cm inside diameter (ID) by 26.5 cm long Plexiglas columns. The ZVI foam pellets were mixed with sand in an attempt to achieve greater hydraulic conductivity. The column contained 2,152.9 g of Cercona ZVI pellets and 1,775.7 g of sand. The AFO/sand column contained 7.70 g of AFO and 3,048 g of sand. (This column contained only about 0.2 weight% Fe as AFO. Tests performed later showed that a mixture containing up to 2 weight% Fe as AFO with gravel was suitably permeable.) FRGW was pumped through the columns from bottom to top at a rate of 0.5 mL/min for the first 5 days. A pump rate of 0.5 mL/min produced a linear flow rate of 1.5 ft/day, which is approximately the groundwater flow rate in the colluvial aquifer at the Fry Canyon site. After 5
28
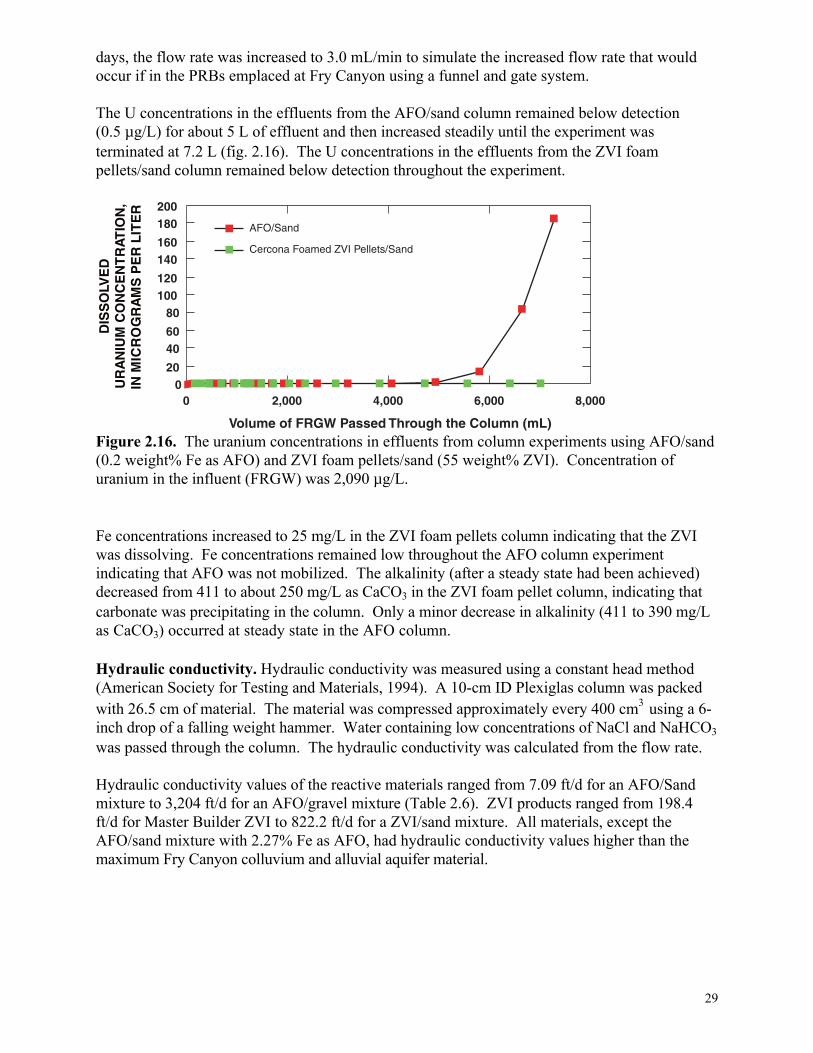
DIS
SO
LVE
DU
RA
NIU
M C
ON
CE
NT
RA
TIO
N,
IN M
ICR
OG
RA
MS
PE
R L
ITE
R
0 20
40 60
80 100 120
140 160
180 200
AFO/Sand
Cercona Foamed ZVI Pellets/Sand
days, the flow rate was increased to 3.0 mL/min to simulate the increased flow rate that would occur if in the PRBs emplaced at Fry Canyon using a funnel and gate system.
The U concentrations in the effluents from the AFO/sand column remained below detection (0.5 µg/L) for about 5 L of effluent and then increased steadily until the experiment was terminated at 7.2 L (fig. 2.16). The U concentrations in the effluents from the ZVI foam pellets/sand column remained below detection throughout the experiment.
0 2,000 4,000 6,000 8,000
Volume of FRGW Passed Through the Column (mL) Figure 2.16. The uranium concentrations in effluents from column experiments using AFO/sand (0.2 weight% Fe as AFO) and ZVI foam pellets/sand (55 weight% ZVI). Concentration of uranium in the influent (FRGW) was 2,090 µg/L.
Fe concentrations increased to 25 mg/L in the ZVI foam pellets column indicating that the ZVI was dissolving. Fe concentrations remained low throughout the AFO column experiment indicating that AFO was not mobilized. The alkalinity (after a steady state had been achieved) decreased from 411 to about 250 mg/L as CaCO3 in the ZVI foam pellet column, indicating that carbonate was precipitating in the column. Only a minor decrease in alkalinity (411 to 390 mg/L as CaCO3) occurred at steady state in the AFO column.
Hydraulic conductivity. Hydraulic conductivity was measured using a constant head method (American Society for Testing and Materials, 1994). A 10-cm ID Plexiglas column was packed with 26.5 cm of material. The material was compressed approximately every 400 cm3 using a 6-inch drop of a falling weight hammer. Water containing low concentrations of NaCl and NaHCO3
was passed through the column. The hydraulic conductivity was calculated from the flow rate.
Hydraulic conductivity values of the reactive materials ranged from 7.09 ft/d for an AFO/Sand mixture to 3,204 ft/d for an AFO/gravel mixture (Table 2.6). ZVI products ranged from 198.4 ft/d for Master Builder ZVI to 822.2 ft/d for a ZVI/sand mixture. All materials, except the AFO/sand mixture with 2.27% Fe as AFO, had hydraulic conductivity values higher than the maximum Fry Canyon colluvium and alluvial aquifer material.
29

Table 2.6. Hydraulic conductivity values measured by constant head method reported in feet per day.
[AFO, amorphous ferric oxyhydroxide; Fe, iron; %, percent; ZVI, zero valent iron]
Material Hydraulic Conductivity Sand 1,417.5 AFO/Sand (0.40% Fe as AFO) 680.4 AFO/Sand (2.27% Fe as AFO) 7.088 AFO/Sand (0.25% Fe as AFO) 241.0 ZVI/Sand (42% Fe) 822.2 ZVI (Master Builder –8 +50) 198.5 to 283.5 ZVI Foam Pellets/Sand (55% Fe) 396.9 to 822.2 Gravel (3/8 inch) 4,167 AFO/Gravel (0.4% Fe as AFO) 3,204 Fry Canyon Colluvium 56.7 to 85.0 Fry Canyon Alluvial Aquifer 39.69 to 65.20
Hydraulic conductivity of AFO/gravel mixture with 2 weight Fe% (as AFO) was determined in a Plexiglas tank (fig. 2.17). Hydraulic conductivity was calculated from the head difference across the tank produced by a given flow rate. The head difference was too small to measure even for the maximum pump rate, thus the hydraulic conductivity is greater than 2,835 ft/d. The hydraulic conductivity measured in the tank experiment was significantly higher than that measured for an AFO/gravel mixture by the constant head column method. The difference may result from the different flow orientations in the two tests. The column test measures vertical hydraulic conductivity whereas the tank test measures horizontal conductivity. Horizontal flow is more analogous to field conditions.
Figure 2.17. Testing hydraulic conductivity of amorphous ferric oxyhydroxide/gravel mixture.
30

Possible U removal processes. Release of U back to solution was not evaluated during this study for ZVI or AFO materials. The following discussion of potential re-release of U is based on theoretical considerations. U(VI) adsorbed to the outer surfaces of AFO particles will eventually desorb and reenter the groundwater. If the upgradient groundwater becomes clean (such as could occur if the contaminant source is removed), the U concentration front will continue to migrate through the reactive medium until it reaches the downgradient edge. Once the front is at that position, U will be released to the environment at concentrations controlled by the chemistry of the incoming groundwater. If incoming clean groundwater has the same pH and major-ion chemistry, then the concentration of U in the outflow will be the same as it was in the contaminated groundwater.
If the PRB containing ZVI were to become depleted in Fe or if the reactive surfaces became coated with mineral precipitates, oxidized groundwater could re-mobilize the U minerals. Uraninite has not yet been identified in any studies of U uptake by ZVI although the redox state of the groundwater chemistry is conducive to its formation. Uraninite dissolution has been observed to occur rapidly when laboratory experiments become oxic; however, no quantitative studies are known (Rai, 1999). Laboratory experiments conducted by Abdelouas and others (2000) indicate that reoxidation of uraninite is significantly reduced if the uraninite is precipitated together with mackinawite. This detailed mineralogical information is currently (1999) not available. If the rate of uranium-bearing mineral(s) dissolution is high, then PRBs containing ZVI will need to be removed or sealed off to prevent future remobilization of U into groundwater.
2.2.4 Selection of Materials for Demonstration Phosphate. Both the batch and column uptake tests indicate that the bone meal and bone charcoal apatites would be more effective on a per gram basis in removing dissolved U from Fry Canyon groundwater than phosphate rock in PRB application. However, the potential clogging of the PRB constructed from fertilizer-grade bone meal diminishes its effectiveness since dilution on the order of 10-fold or higher with coarse grain non-reactive materials would be required to maintain permeability. Because of its small particle size, the bone charcoal powder also suffers from the need to dilute with coarse material and may be transported out of the PRB. The large hydraulic conductivity of the pelletized bone-char phosphate allows its use in a PRB without dilution with coarse-grained non-reactive material. The 5 to 10-fold lower U uptake capacity of bone-char pellets compared to the fertilizer grade bone meal and bone charcoal powder is offset by the large hydraulic conductivity of the pellets. Based on these results, the CP3 pellets were chosen as the best phosphate material for the PRB. The U uptake in batch experiments and hydraulic conductivity of the formulation produced for the PRB (CP5) was measured prior to PRB construction. Column experiments with the CP5 pellets were conducted after barrier emplacement and will be more fully described in a subsequent report.
Zero valent iron and amorphous ferric oxyhydroxide. Based on the laboratory test results, cost, and availability, one AFO-based material and one ZVI-based material were selected for use in the Fry Canyon PRB: AFO mixed with 3/8 inch gravel (2% Fe), and Cercona ZVI foam pellets. By selecting both AFO and ZVI, the efficiency of 2 different chemical mechanisms could be compared. The selected materials had suitable hydraulic conductivity, high U removal efficiency, and high compaction strengths.
31

2.3 Further Development of Barrier Materials The Fry Canyon Demonstration project is the one of the first to consider the treatment of groundwater contaminated by metals or radionuclides in a PRB. At the time of the installation at Fry Canyon (September 1997), PRB technology was not well developed. The most suitable reactive materials were selected for the demonstration, however, it was believed that better materials would likely be developed in the future. As an example, although AFO was shown to be an effective adsorbent in laboratory studies, its fine grain size prohibits concentrations greater than about 2 weight% to be used in a PRB.
A project, funded by the DOE and undertaken in collaboration with the EPA project manager for the Fry Canyon Demonstration project, conducted a laboratory investigation to evaluate improved reactive materials (Morrison and others, 1998). Five categories of reactive materials were investigated: (1) ZVI-based materials, (2) phosphate-based materials, (3) AFO-based materials, (4) peat and humic acid based materials, and (5) materials containing mixtures. During this study, a relatively inexpensive form of ZVI (dubbed HSA or �high surface area� metal) was located and tested in addition to the forms of ZVI typically used in PRBs. HSA has metal uptake characteristics comparable to other forms of ZVI. Another result of this study was a new process to coat materials with AFO. The process was used to coat grains with up to 6% by weight of AFO. While this is a significant improvement, it is still probably not sufficient for most PRB applications. Cost comparisons indicated that ZVI-based compounds were more efficient than the other forms of reactive materials. Disadvantages of ZVI-based compounds are the potential for releasing Fe and Mn (a contaminant present in ZVI) to the groundwater, and the potential for clogging of the barrier or passivation of the reactive surfaces due to mineral precipitation.
3.0 PERMEABLE REACTIVE BARRIER DESIGN Results from the laboratory testing of the reactive barrier materials indicated that each of the three materials could successfully remove U during the field demonstration. In order to accommodate all three reactive materials, three PRBs were designed for installation and concurrent "side by side" operation at the site. A funnel and gate design was chosen, consisting of three "permeable windows" where each of the PRBs would be placed, separated by "no-flow walls" and wing walls on each end to channel the groundwater flow into the PRBs (fig. 3.1). Each PRB and no-flow boundary was keyed into the bedrock (Cedar Mesa Sandstone) underlying the colluvial aquifer. Heavy equipment consisting of a trac-mounted backhoe and a bulldozer were chosen to install the PRBs. This design and installation technique was chosen for the following reasons: (1) ameanable for multiple PRBs placed side by side; (2) low construction cost; (3) shallow groundwater system; and (4) transferability to other remote, abandoned mine sites with contaminated groundwater.
32
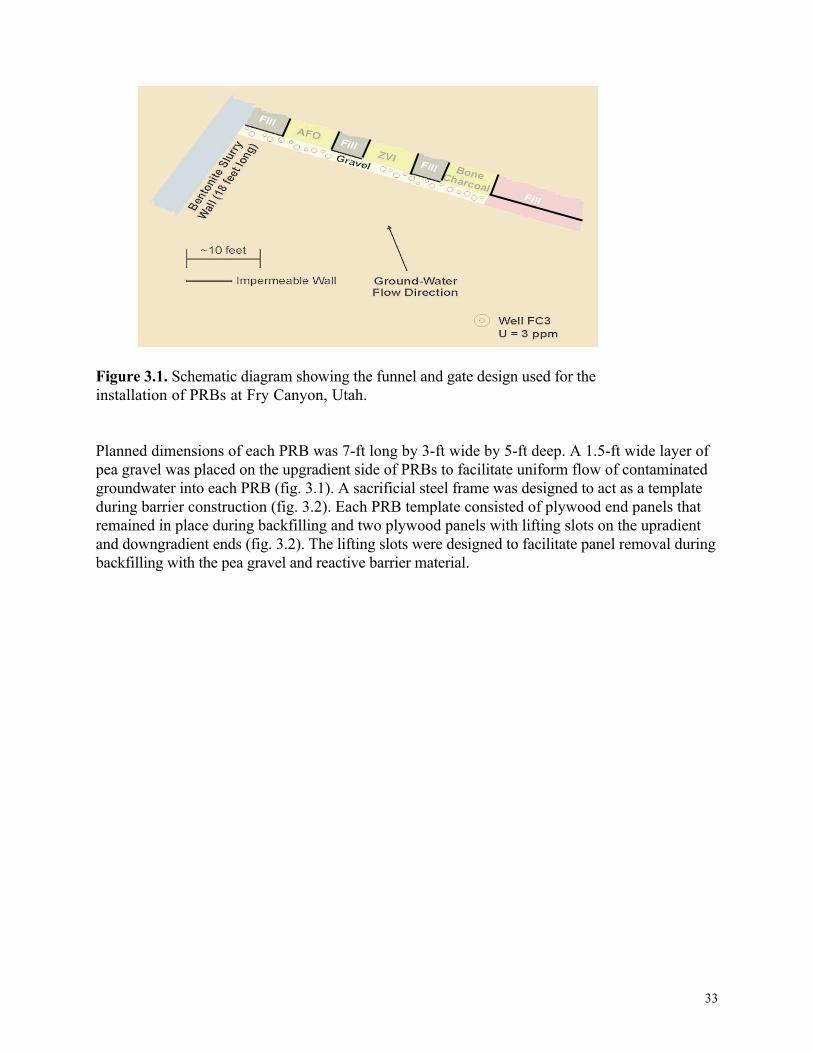
Figure 3.1. Schematic diagram showing the funnel and gate design used for the installation of PRBs at Fry Canyon, Utah.
Planned dimensions of each PRB was 7-ft long by 3-ft wide by 5-ft deep. A 1.5-ft wide layer of pea gravel was placed on the upgradient side of PRBs to facilitate uniform flow of contaminated groundwater into each PRB (fig. 3.1). A sacrificial steel frame was designed to act as a template during barrier construction (fig. 3.2). Each PRB template consisted of plywood end panels that remained in place during backfilling and two plywood panels with lifting slots on the upradient and downgradient ends (fig. 3.2). The lifting slots were designed to facilitate panel removal during backfilling with the pea gravel and reactive barrier material.
33

TRENCH AXIS
REACTIVE MATERIAL FILL
PLYWOOD END PANELS TO REMAIN IN PLACE PLYWOOD PANELS WITH LIFTING SLOTS
(BOTH ENDS) (REMOVED DURING INSTALLATION)
DETAIL A
DETAIL C MATERIAL LIST
3/4'' CDX PLYWOOD 2 4' x 8' SHEET
2 2'-10" x 5'-0" SHEET
2 1'-6" x 5'-0" SHEET
CEMENT-BENTONITE FILL
DETAIL B
PEA GRAVEL FILL
3D VIEW NO SCALE
1/4'' x 3/4" BOLT W/ NUT AND LOCK WASHERS (TYP.)
DETAIL A DETAIL B DETAIL C NO SCALE NO SCALE NO SCALE
Figure 3.2. Three-dimensional views of the sacrificial frame design used for installation of PRBs at Fry Canyon, Utah.
Numerous factors should be considered when designing the thickness of a PRB and include ground water velocity, rate of contaminant removal by the reactive material, contaminant removal capacity of the barrier material, estimated mass of the contaminant in the ground-water plume, and physical constraints of the trenching equipment. In an actual remediation project, these factors and possibly others would be used to determine the thickness of the PRB. Addressing all of these design criteria was not practical for the field demonstration of PRBs conducted during this study. The three-foot thickness of each PRB at the Fry Canyon site was based on the following criteria: (1) large enough thickness to sample and map gradients in dissolved chemical constituents across the PRB; (2) sufficient residence time for ground water to chemically interact with the PRB material during changing hydrologic conditions; and (3) physical limitations of the trac hoe and trench box used during PRB construction. Results from the PRB demonstration project at Fry Canyon can be used to estimate proper PRB thickness during future applications of PRBs for removing uranium from groundwater.
4.0 MONITORING NETWORK DESIGN Because the objective of this project is to determine if PRBs present a feasible and long-term groundwater technology, an extensive monitoring network was required and designed. Monitoring networks used in future applications of PRB technology at sites contaminated by trace-elements and radionuclides will require less monitoring wells and equipment compared to the Fry Canyon demonstration project site. However, the monitoring network design and equipment used at the
34

Fry Canyon site will still have direct application to future PRBs installed for remediation purposes. A description of each monitoring component and subsequent use of the data is presented in the following sections.
A large number of monitoring/sampling points were installed in each of the PRBs to gain a full understanding of the potential geochemical reactions and changes in water-quality and groundwater flow that occurs as groundwater is passively treated. Each PRB contains 16, 1/4-inch schedule 40 PVC wells located along two parallel flow paths in each PRB (figs. 4.1, 4.2, and 4.3). The 0.5 ft spacing of the 1/4-inch monitoring wells is required to evaluate short-term changes in water quality within the PRBs. A 1/4-inch well casing was selected to minimize the effects of pumping to adjacent wells during PRB sampling activities. Multi-level 1/4-inch wells were installed at three sites along each of the two flow paths (figs. 4.1, 4.2, and 4.3). The purpose of the multi-level wells is to provide sampling ports to monitor changes in water-quality with depth in the reactive material contained in each PRB. A hose adapter was attached to each of the 1/4-inch wells to facilitate sampling with a peristaltic pump.
Plan View Not to scale
1.75 ft 3.5 ft 1.75 ft
3 ft
1.5 ft
PO4R1S-1 PO4R1-2
PO4R1-3
PO4R1S-4 PO4R1-5
PO4R1-6
PO4R1S-7 PO4R1-8
Pea gravel
PO4R2S-1 PO4R2-2
PO4R2-3
PO4R2S-4 PO4R2-5
PO4R2-6
PO4R2S-7 PO4R2-8
PO4T1 PO4T2
PO4T3
PO4FS1
DG3 DG4
Barrier material
FLOW-SENSOR PORT
TRANSDUCER AND MINIMONITOR PORT
TRANSDUCER PORT TRANSDUCER PORT
TRANSDUCER PORT TRANSDUCER PORT
EXPLANATION 1/4-inch well, two sampling depths 1/4-inch well, one sampling depth
2-inch monitoring well
Figure 4.1. Schematic diagram showing monitoring well placement and sample site identification for the bone-char PRB.
35

Plan View Not to scale
2.0 ft 3.0 ft 2.0 ft
ZVIR1S-7 ZVIR2S-7 ZVIR2-8 ZVIR1-8 Barrier material
ZVIR1-6 ZVIR2-6
FLOW-SENSOR PORT ZVIR1S-4 ZVIR2S-4
3 ft ZVIR1-5 ZVIFS1 ZVIR2-5
ZVIR1-3 ZVIR2-3
TRANSDUCER AND MINIMONITOR PORT
ZVIR1S-1 ZVIR2S-1 ZVIT3
ZVIR1-2 ZVIR2-2
TRANSDUCER PORT TRANSDUCER PORT 1.5 ft ZVIT1 Pea gravel ZVIT2
EXPLANATION 1/4-inch well, two sampling depths 1/4-inch well, one sampling depth
2-inch monitoring well
Figure 4.2. Schematic diagram showing monitoring well placement and sample site identification for the zero-valent iron PRB.
36

Plan View Not to scale
2.3 ft 2.4 ft 2.3 ft
TRANSDUCER PORT
DG1 DG2
AFOR1S-7 AFOR2S-7 AFOR1-8 AFOR2-8
Barrier material
AFOR1-6 AFOR2-6
FLOW-SENSOR PORT AFOR1S-4 AFOR2S-4
3 ft AFOR1-5 AFOFS1 AFOR2-5
AFOR1-3 AFOR2-3
TRANSDUCER AND MINIMONITOR PORT
AFOR1S-1 AFOR2S-1 AFOT3
AFOR1-2 AFOR2-2
TRANSDUCER PORT TRANSDUCER PORT 1.5 ft AFOT1 Pea gravel AFOT2
EXPLANATION
1/4-inch well, two sampling depths 1/4-inch well, one sampling depth
2-inch monitoring well
Figure 4.3. Schematic diagram showing monitoring well placement and sample site identification for the amorphous ferric oxyhydroxide PRB.
Each PRB was designed to contain 6, 2-inch inside diameter PVC monitoring wells for measuring water-levels upgradient, within, and downgradient of the PRBs. The water-level data will be used to construct potentiometric surface maps of the PRBs, monitor potential plugging tendencies as the barriers age, and construct a groundwater flow model of the PRBs. Each of the 2-inch wells also contains a sampling port consisting of dedicated flexible tubing to collect water samples using a peristaltic pump (fig. 4.4).
37

Figure 4.4. Two-inch monitoring well, Fry Canyon, Utah.
Short-term trends in groundwater levels, selected water-quality constituents, and flow directions and velocities in each PRB are needed to better evaluate barrier performance. For example, hourly pH data can be used to determine if PRB aging may result in pH changes that may decrease U removal efficiency. The 2-inch wells are used as access points for the deployment of pressure transducers, water-quality minimonitors, and flow sensors. The Waterlog H-310, 15-psi pressure transducers are used to measure hourly water levels and temperature in four wells within each PRB (fig. 4.5). Each PRB also contains a Yellow Springs Instrument 600XL water quality minimonitor (figs. 4.1, 4.2, and 4.3) that measures hourly values of pH, specific conductance, water temperature, dissolved oxygen, and oxidation reduction potential. A 2-inch well in each PRB (figs. 4.1, 4.2, and 4.3) is used as an access point to measure flow direction and velocity with a K-V Associates Model 40 portable groundwater flow meter.
38
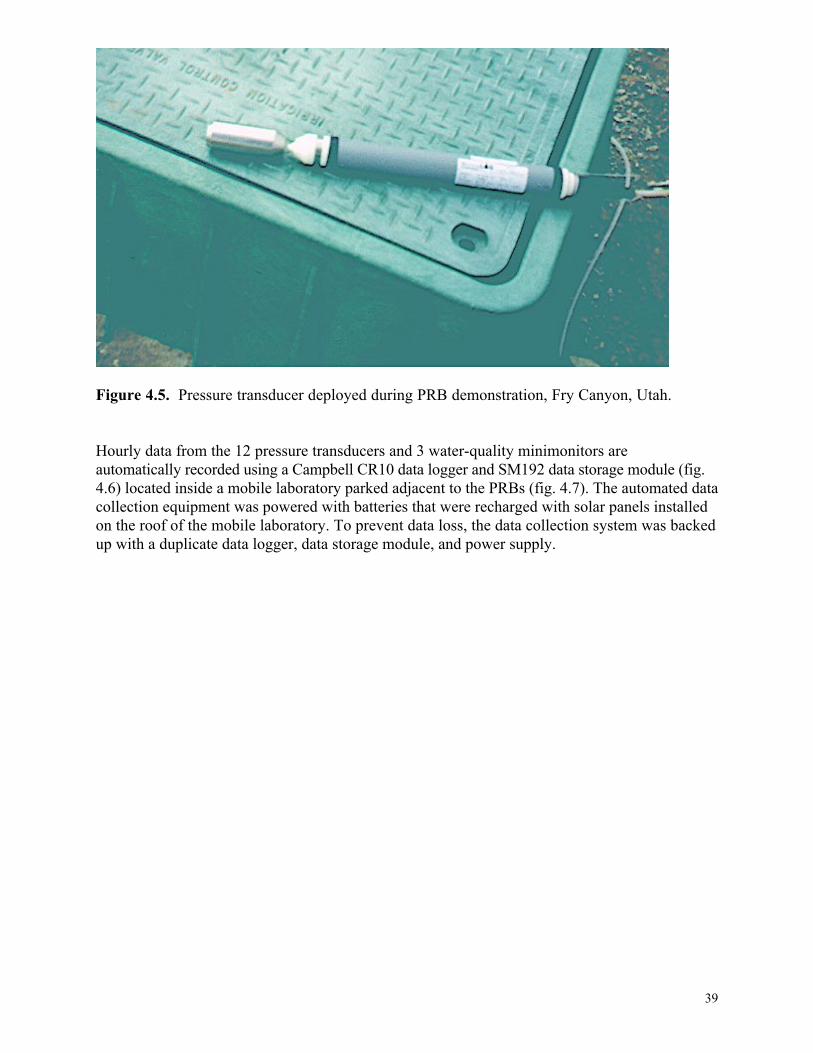
Figure 4.5. Pressure transducer deployed during PRB demonstration, Fry Canyon, Utah.
Hourly data from the 12 pressure transducers and 3 water-quality minimonitors are automatically recorded using a Campbell CR10 data logger and SM192 data storage module (fig. 4.6) located inside a mobile laboratory parked adjacent to the PRBs (fig. 4.7). The automated data collection equipment was powered with batteries that were recharged with solar panels installed on the roof of the mobile laboratory. To prevent data loss, the data collection system was backed up with a duplicate data logger, data storage module, and power supply.
39

Solar panels mounted on roof
Mobile laboratory
Junction box
Data logger #1 and power supply
Data logger #2 and power supply
Amorphous ferric oxide permeable reactive barrier (4 transducters and 1 minimonitor)
Zero-valent iron permeable reactive barrier
(4 transducters and 1 minimonitor)
Bone-char permeable reactive barrier (4 transducters and 1 minimonitor)
Figure 4.6. Schematic diagram of the automatic data recording system within and adjacent to the permeable reactive barriers, Fry Canyon, Utah.
40

Figure 4.7. Automated data logging equipment used during the Fry Canyon barrier demonstration project.
The 12 pressure transducers and 3 water quality minimonitors were serviced every 1 to 1.5 months. During service visits, the measured water level was compared to the water level recorded by each transducer. If the transducer water level was +/- 0.03 ft different than the measured water level, the y offset was adjusted until the transducer water level matched the actual value. Water quality sensors in each of the three minimonitors were cleaned and recalibrated with the appropriate standards during service visits.
5.0 BARRIER AND MONITORING NETWORK INSTALLATION Prior to PRB installation, a health and safety plan (HASP) was developed to address the issues associated with trench construction and installation of the chemical material to form the PRBs (Appendix D). A copy of this HASP can be obtained by contacting the USGS District Chief located in Salt Lake City, Utah.
The design for the Fry Canyon test site included 3 permeable reactive gates separated by impermeable sections of cement-bentonite. The design also included short sections of cement-bentonite walls at the ends to help funnel groundwater into the reactive gates. Previous water level data indicated that groundwater flowed subparallel to Fry Creek and the gates were placed perpendicular to the flow. The angled spur of impermeable wall on the east end was intended to capture additional contaminated groundwater that would otherwise flow into Fry Creek.
41
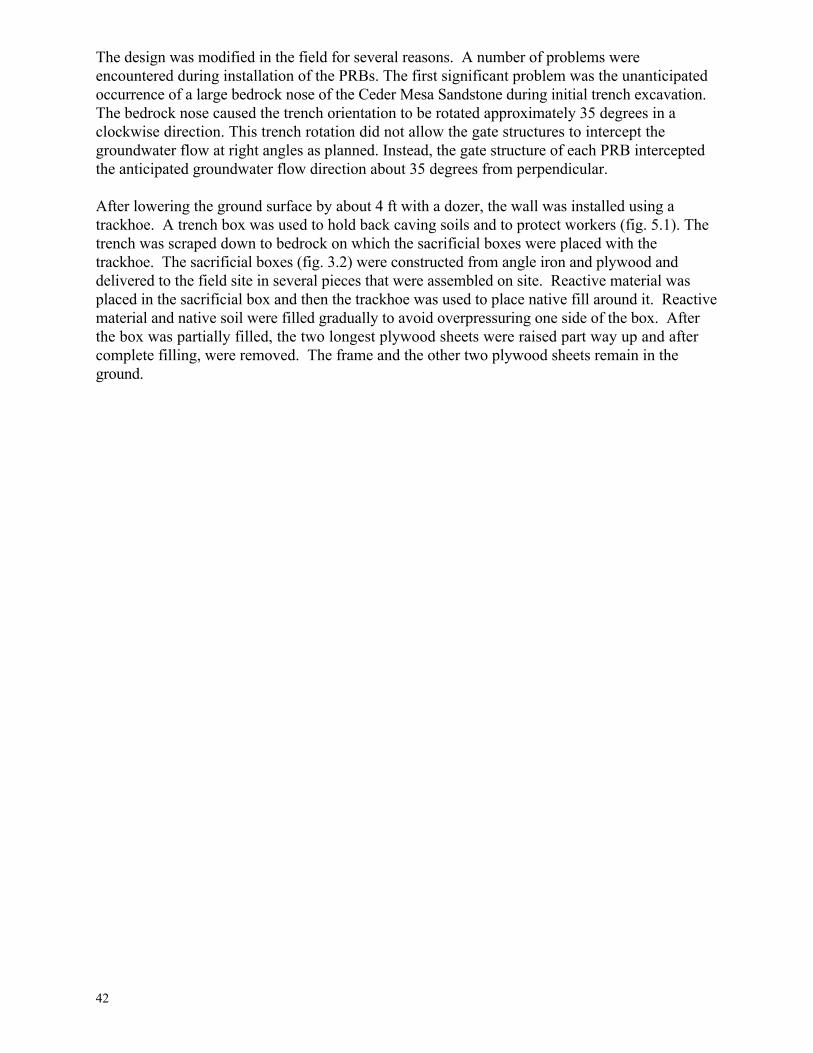
The design was modified in the field for several reasons. A number of problems were encountered during installation of the PRBs. The first significant problem was the unanticipated occurrence of a large bedrock nose of the Ceder Mesa Sandstone during initial trench excavation. The bedrock nose caused the trench orientation to be rotated approximately 35 degrees in a clockwise direction. This trench rotation did not allow the gate structures to intercept the groundwater flow at right angles as planned. Instead, the gate structure of each PRB intercepted the anticipated groundwater flow direction about 35 degrees from perpendicular.
After lowering the ground surface by about 4 ft with a dozer, the wall was installed using a trackhoe. A trench box was used to hold back caving soils and to protect workers (fig. 5.1). The trench was scraped down to bedrock on which the sacrificial boxes were placed with the trackhoe. The sacrificial boxes (fig. 3.2) were constructed from angle iron and plywood and delivered to the field site in several pieces that were assembled on site. Reactive material was placed in the sacrificial box and then the trackhoe was used to place native fill around it. Reactive material and native soil were filled gradually to avoid overpressuring one side of the box. After the box was partially filled, the two longest plywood sheets were raised part way up and after complete filling, were removed. The frame and the other two plywood sheets remain in the ground.
42

Figure 5.1. Trench box used to protect workers during installation of the PRBs at Fry Canyon, Utah.
The second problem was encountered during the construction of the no-flow barrier or "wing wall," designed to funnel contaminated groundwater to the gate structures that contained permeable reactive material. Bentonite slurry was dumped into the wing wall trench from an adjacent cement mixing truck. The slurry could not be contained in the wing wall area while the gate structures were constructed. The bentonite slurry was removed and the wing wall was constructed with plywood and plastic sheeting. The bentonite was reused later on the west end of the wall (fig. 3.1) after placing sufficient native soil to prevent any chance of the slurry invading the AFO reactive gate. Bentonite was grouted into the junctions using a half-round of 8-inch PVC pipe to hold it in place. Associated problems with the bentonite slurry included the use of cement trucks at remote sites with limited water. If the bentonite slurry is not dumped from the cement truck within 4 hrs, the slurry begins to congeal and must be removed from the cement mixer using a specialized and costly procedure. The congealing can be delayed by adding water to the mixture; however, limited water supplies at the Fry Canyon site did not allow for
43

this option. Another problem with the bentonite slurry is the potential for leakage to other areas of the trench prior to backfilling. For example, a small amount of slurry leakage to the gate areas could prevent or reduce groundwater flow, thereby decreasing PRB treatment efficiency.
The assurance of a consistent seal between the underlying bedrock and the no-flow barriers was problematic because the bedrock surface was not flat. The presence of groundwater in the trench made it difficult to visually inspect the seal between the no-flow barrier and the underlying bedrock.
Bone char and foamed ZVI pellets were delivered to the site in 8-cubic-foot cloth bags. The bags were lifted with the trackhoe forks and suspended over the trench while the bottom was cut open allowing the materials to flow into the sacrificial box. The ZVI foam pellets and bone char pellets were used as received without mixing with sand or gravel . AFO was delivered as a slurry in 55-gallon drum. The slurry contained 13% AFO [as Fe(OH)3]. The slurry was stirred by hand in the drums and then mixed with gravel (3/8 inch) in a cement mixer at a proportion of 1 part slurry to 2 parts gravel (by volume). The mixture was placed in the trackhoe scoop and then dumped into the sacrificial box (fig. 5.2).
Figure 5.2. Placement of AFO barrier material into the gate structure of the permeable reactive barrier, Fry Canyon, Utah.
44

Monitoring wells were placed using a template secured to the top of the sacrificial box. For the first gate, the sacrificial box was placed in the trench and then the monitoring wells were placed. This proved to be cumbersome while working in the trench. For the other 2 gates, the monitor wells were placed in the sacrificial box first and then the entire unit was lowered into the trench.
After construction of the PRB, the ground surface was brought back up to grade with the dozer. Care was taken not to damage the monitoring wells. The monitoring devices were wired to data collectors in a mobile trailor. Plastic pump boxes were installed to protect the well heads. The slope was stabilized with straw mats and drainage upslope was slightly modified to prevent flash floods from eroding the project area.
The final "as built" dimensions of each PRB are shown in Figure 5.3. Depths of barrier materials were less than the designed depth of 5 ft because of materials settling after removal of the trench box (fig. 5.1). This resulted in the water table approximately 1.9 ft above the top of the PO4 PRB. The saturated zone above the PRB was backfilled with native colluvium that is less permeable than the reactive materials. In a remediation application, the highest projected elevation of the water table must always be below the top of the barrier material to ensure that all groundwater is treated. This was not a stringent requirement in this demonstration project because monitoring wells were located within each PRB to document U removal efficiencies. The "as built" volume of reactive material in each PRB were calculated from the field survey data as: (1) PO4 = 67.2 ft3; (2) ZVI = 77.7 ft3; and (3) AFO = 67.2 ft3. Discrepancies between as-built volume and delivered volumes are due to reactive material spreading into the void left as the trench box was removed.
45

Win
g W
all
EXPLANATION
Amorphous ferric hydroxide
Zero-valent iron
Bone char phosphate
A
A'
B
B'
C
C'
Wing Wall Pea gravel
Native fill and tailings
Water table measured January, 1999
A A' Line of reactive wall cross-section
VERTICAL EXAGGERATION
Amorphous ferric hydroxide cross-section Zero-valent iron cross-section Bone char phosphate cross-section
1.5 ft. 3.0 feet
7.1 feet
3.2 feet
2.4 feet
A A' 1.5 ft. 3.0 feet
7.1 feet
3.7 feet 4.0 feet
B B' 1.5 ft. 3.0 feet
7.1 feet
3.2 feet 5.1 feet
C C'
Figure 5.3. Location and dimensions of permeable reactive barriers after construction, Fry Canyon, Utah.
After backfilling of the PRBs was completed, each of the wells was pumped to remove the fine particulates introduced during the barrier construction activities. The 2-inch diameter wells were developed with a Brainard Killman ball and piston hand pump and the 1/4-inch diameter wells were developed with a peristaltic pump. The 2-inch diameter wells completed in the pea gravel had very few fine particulates and the water cleared up after approximately 2 casing volumes were removed. Wells completed in the undisturbed colluvial aquifer downgradient of the PRBs typically required more than 2 casing volumes to adequately remove the fine particulates introduced during well installation. With the exception of the AFO barrier, both the 1/4-inch and 2-inch diameter wells completed in the barrier material required pumping less than 2 casing volumes to adequately remove the majority of the fine particulates. Wells completed in the AFO barrier material contained significant quantities of ferric oxide particles that did not adsorb to the surface of the pea gravel during barrier installation. Wells within the AFO barrier still contain significant iron particulates 12-months after pumping the wells periodically for water samples.
6.0 POST-INSTALLATION SAMPLING AND ANALYSIS Monitoring of the three PRBs was designed to meet technology demonstration, quality assurance/quality control, and state compliance goals. During the first year of PRB operation, groundwater was sampled 7 times (Sep 97, Oct 97, Nov 97, Jan 98, Apr 98, Jun 98, and Sep 98). Table 6.1 list the number of water samples and the chemical constituents that were analyzed during each of the time periods. More than 370 water samples were collected and analyzed in the first year of PRB operational and monitoring activities.
46

Table 6.1. Sampling period, chemical constituents, and number of samples taken during the first year of permeable reactive barrier operation at Fry Canyon, Utah.
Sampling period Chemical constituents
analyzed Number of samples taken September 1997 pH, specific conductance, total
alkalinity, temperature, iron, phosphate, uranium
47
October 1997 pH, specific conductance, total alkalinity, temperature, iron, phosphate, uranium aluminum, calcium, copper, iron, potassium, lithium, magnesium, manganese, phosphorus, sodium, silicon, strontium, zinc, sulfate, chloride
58
November 1997 pH, specific conductance, total alkalinity, temperature, iron, phosphate, uranium
47
January 1998 pH, specific conductance, total alkalinity, temperature, iron, phosphate, uranium aluminum, calcium, copper, iron, potassium, lithium, magnesium, manganese, phosphorus, sodium, silicon, strontium, zinc, sulfate, chloride
58
April 1998 pH, specific conductance, total alkalinity, temperature, iron, phosphate, uranium
47
June 1998 pH, specific conductance, total alkalinity, temperature, iron, phosphate, uranium aluminum, calcium, copper, iron, potassium, lithium, magnesium, manganese, phosphorus, sodium, silicon, strontium, zinc, sulfate, chloride
58
September 1998 pH, specific conductance, total alkalinity, temperature, iron, phosphate, uranium
*58
*Additional samples in September 1998 reflect additional 2-inch diameter monitoring wells that were installed during August 1998
Downgradient wells (DG1, DG2, DG3, DG4, FC2, and DP4) were monitored to ensure that groundwater was not further degraded after installation of the PRBs. Iron and pH were monitored in downgradient wells because iron corrosion reactions within the ZVI PRB could cause increases in pH and iron concentrations in the treated groundwater. The U was monitored in downgradient wells because of the potential for increased pH values causing desorption of U from the previously contaminated colluvial sediments. The U concentrations from the downgradient wells were not used to evaluate PRB performance because these wells are completed in U contaminated
47

colluvium. Phosphate was monitored in downgradient wells to address the possibility of phosphate transport downgradient from the PO4 PRB.
A description of sample processing, analytical methods, and quality assurance results are presented and discussed in Appendix E.
7.0 YEAR ONE RESULTS OF PERMEABLE REACTIVE BARRIER DEMONSTRATION
7.1 Volume of Groundwater Treated On the basis of hydrologic and physical properties of the aquifer and the hydraulic gradient derived from potentiometric contour maps (fig. 7.1) prior to wall installation, the average linear velocity of groundwater in the aquifer ranges seasonally from 0.2 to 2.5 ft/d. The velocity changes in response to changes in the amount of recharge occurring (hydraulic gradient) and as a result of the lateral variability in hydraulic conductivity and effective porosity of the sediments. Average linear velocity during the summer when phreatophytes are using groundwater is about 70% of winter velocities.
48

Phreatophytes
5,359.56
5,358
Fry Creek
Fry Creek channel
Fry Creek
Fry Creek channel
Phreatophytes
5,355.45
5,355.58
5,355.37
5,355.59
5,355.81
5,355.95
5,356.20
5,356.40
5,356.29 5,356.27 5,356.78
5,357.18
5,357.40
5,358.36
5,355.58
5,355.71
5,355.86
5,355.45
5,356.26
5,356.58
5,356.70
5,356.72
5,355.95
5,356.83
5,356.79
5,357.84
5,358.29
5,358.36
5,35
8
5,357
5,356
5,357
5,358
5,356
5,35
8
5,357
5,356
5,357
5,358
5,356
200 FEET 100 0
0 50 METERS
200 FEET 100 0
0 50 METERS
5,359.56
5,358
Explanation
Evaporation basins and tailings
Potentiometric contour—Shows altitude at which water level would have stood in tightly cased wells, July 1997. Interval is 0.2 foot
Control point—Number is altitude of water level, in feet
Potentiometric contours July 1997 (low)
Explanation
Evaporation basins and tailings
Potentiometric contour—Shows altitude at which water level would have stood in tightly cased wells, January 1997. Interval is 0.2 foot
Control point—Number is altitude of water level, in feet
Potentiometric contours January 1997 (high)
Figure 7.1. Configuration and altitude of the potentiometric surface of the colluvial aquifer at Fry Canyon, Utah prior to the permeable reactive walls being installed in (a) July 1997, and (b) January 1997.
The flow system was altered after PRB construction was completed. Hydraulic gradients were increased because the bentonite and plywood wing walls concentrate more groundwater from a wider area of the aquifer than was common in the natural state. Based on the change in hydraulic gradient, the average hydraulic conductivity, and porosity of the aquifer between wells FC-4 and FC-3, average-linear velocity in the aquifer between the two wells upgradient of the walls
49

increased from about 0.75 ft/d before wall installation to about 1.25 ft/d after wall installation. When groundwater moves into the influence of the reactive-wall construction zone the hydraulic gradient becomes nearly flat because the hydraulic conductivity of the pea-gravel buffer zone and the wall materials is nearly 10 times larger than in the aquifer. However, average linear velocity of groundwater probably remains about the same as in the aquifer because as the large hydraulic conductivity values of the PRBs tend to increase velocity, the lower hydraulic gradient tends to decrease velocity, thus having the opposite effect.
The estimated capture zone during December 1998 for the installed PRBs is shown in Figure 7.2. Even though this zone includes only about 14,500 ft2, it represents the terminus of a drainage area nearly 5 times that size. The quantity of water that enters and exits this capture zone was estimated to be no greater than 90 ft3/d (about 10% of the precipitation falling on the drainage area annually). Thus, the amount of groundwater being treated would be no greater 90 ft3/d or approximately 33,000 ft3 during the first year of operation.
50

Fry Creek
Fry Creek channel
Road
Explanation
Evaporation basins and tailings
Approximate capture zone for the chemical reactive walls in
5,355.45 5,355.58
5,354.67
5,355.09
5,355.53
5,355.95
5,356.56 5,356
5,357
5,358
5,356.38
5,356.38
5,356.81
5,356.73 5,356.47
5,356.79
5,357.94
5,358.25
5,359.36
5,359.56
200 FEET 100 0
0 50 METERS
5,358
5,357
5,356
December 1998
5,358 Potentiometric contour—Shows altitude at which water level would have stood in tightly cased wells, December 1998. Interval is 0.2 feet
5,359.56 Control point—Number is altitude of water level, in feet
Figure 7.2. Configuration and altitude of the potentiometric surface in the colluvial aquifer at Fry Canyon, Utah, December 1998, and the approximate area of aquifer influenced by the permeable reactive barriers.
The amount of water passing through each individual PRB is some portion of the total, and is dependent on the orientation of each wall to the direction of groundwater flow and the hydrologic properties of each wall. Computer simulations coupled with tracer tests have been initiated and may be used to refine the estimates of treated water and the mass of U removed during the life of the project.
7.2 Changes in Uranium Concentration As of September 1998, 1 year of uranium-concentration data had been collected since operation of the PRBs began in September 1997. The input U concentrations are significantly different for
51

each PRB, ranging from less than 1,000 µg/L in the PO4 PRB to more than 20,000 µg/L in the AFO PRB (figs 7.3, 7.4, and 7.5). The input U concentrations to each of the PRBs also vary seasonally by approximately 3,000 in the PO4 PRB to greater than 9,000 µg/L in the AFO PRB.
PO4 BARRIER--ROW 1
0
1,000
2,000
3,000
4,000
5,000
0
1,000
2,000
3,000
4,000
5,000 PO4 BARRIER--ROW 2
UR
AN
IUM
CO
NC
EN
TR
AT
ION
, IN
MIC
RO
GR
AM
S P
ER
LIT
ER
SEPTEMBER 1997
OCTOBER 1997
NOVEMBER 1997
JANUARY 1998
APRIL 1998
JUNE 1998
SEPTEMBER 1998
SEPTEMBER 1997
OCTOBER 1997
NOVEMBER 1997
JANUARY 1998
APRIL 1998
JUNE 1998
SEPTEMBER 1998
-1.0 -0.5 0.0 0.5 1.0 1.5 2.0 2.5 3.0
CROSS SECTION DISTANCE FROM GRAVEL/ BARRIER MATERIAL INTERFACE, IN FEET
Figure 7.3. Changes in dissolved uranium concentrations in the bone char phosphate permeable reactive barrier from September 1997 through September 1998, Fry Canyon, Utah.
52

UR
AN
IUM
CO
NC
EN
TR
AT
ION
, IN
MIC
RO
GR
AM
S P
ER
LIT
ER
ZVI BARRIER--ROW 1 15,000
10,000
5,000
0
SEPTEMBER 1997 OCTOBER 1997 NOVEMBER 1997 JANUARY 1998 APRIL 1998 JUNE 1998 SEPTEMBER 1998
ZVI BARRIER--ROW 2 6,000
5,000
4,000
3,000
2,000
1,000
0
SEPTEMBER 1997
OCTOBER 1997
NOVEMBER 1997
JANUARY 1998
APRIL 1998
JUNE 1998
SEPTEMBER 1998
-1.0 -0.5 0.0 0.5 1.0 1.5 2.0 2.5 3.0
CROSS SECTION DISTANCE FROM GRAVEL/ BARRIER MATERIAL INTERFACE, IN FEET
Figure 7.4. Changes in dissolved uranium concentrations in the zero valent iron permeable reactive barrier from September 1997 through September 1998, Fry Canyon, Utah.
53
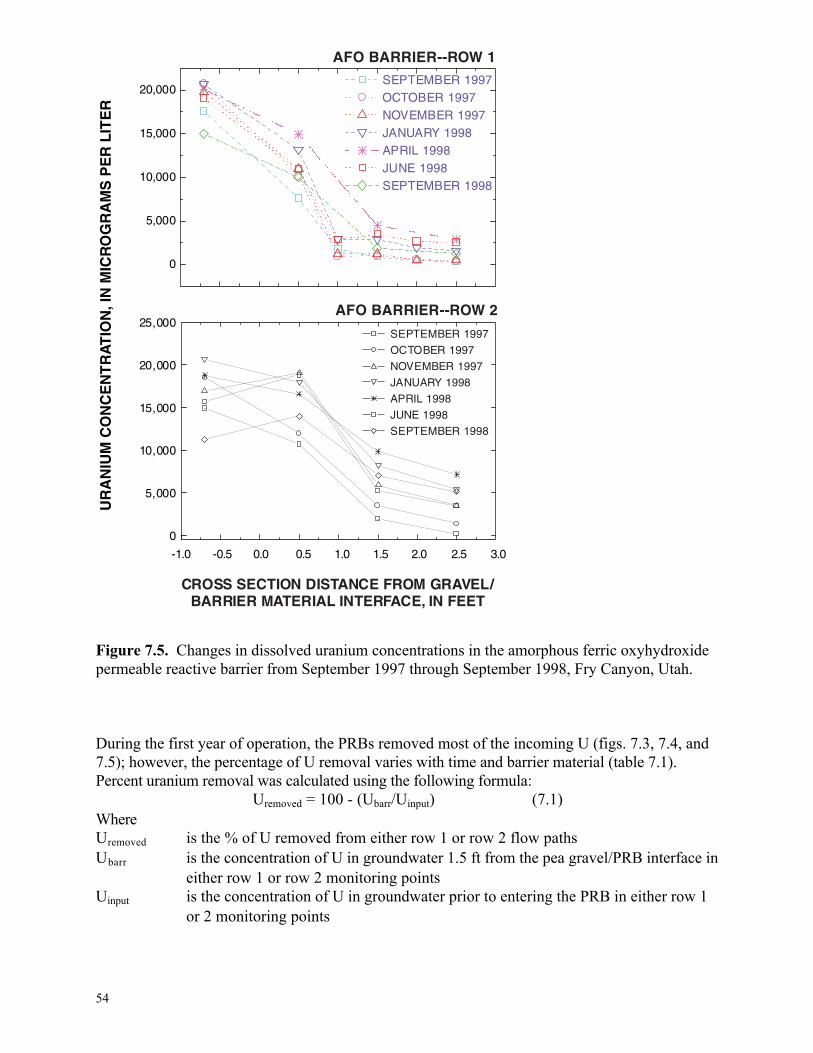
AFO BARRIER--ROW 1
20,000 E
R
AM
S P
ER
LIT 15,000
10,000
R 5,000
GO
IN M
ICR
0
,IO
NT
RA
UR
AN
IUM
CO
NC
EN
T
SEPTEMBER 1997 OCTOBER 1997 NOVEMBER 1997 JANUARY 1998 APRIL 1998 JUNE 1998 SEPTEMBER 1998
AFO BARRIER--ROW 2 25,000
20,000
15,000
10,000
5,000
0
CROSS SECTION DISTANCE FROM GRAVEL/ BARRIER MATERIAL INTERFACE, IN FEET
Figure 7.5. Changes in dissolved uranium concentrations in the amorphous ferric oxyhydroxide permeable reactive barrier from September 1997 through September 1998, Fry Canyon, Utah.
SEPTEMBER 1997
OCTOBER 1997
NOVEMBER 1997
JANUARY 1998
APRIL 1998
JUNE 1998
SEPTEMBER 1998
-1.0 -0.5 0.0 0.5 1.0 1.5 2.0 2.5 3.0
During the first year of operation, the PRBs removed most of the incoming U (figs. 7.3, 7.4, and 7.5); however, the percentage of U removal varies with time and barrier material (table 7.1). Percent uranium removal was calculated using the following formula:
Uremoved = 100 - (Ubarr/Uinput) (7.1) Where Uremoved is the % of U removed from either row 1 or row 2 flow paths Ubarr is the concentration of U in groundwater 1.5 ft from the pea gravel/PRB interface in
either row 1 or row 2 monitoring points Uinput is the concentration of U in groundwater prior to entering the PRB in either row 1
or 2 monitoring points
54

Table 7.1. Percentage of input U concentration removed after traveling approximately 1.5-feet into each of the permeable reactive barriers during September 1997 through September 1998, Fry Canyon, Utah.
Date
PO4 barrier, row 1
PO4 barrier, row 2
ZVI barrier, row 1
ZVI barrier, row 2
AFO barrier, row 1
AFO barrier, row 2
SEP 1997 99.7 94.4 > 99.9 > 99.9 95.3 87.4 OCT 1997 94.8 71.9 > 99.9 > 99.9 94.9 81.4 NOV 1997 89.4 71.6 > 99.9 > 99.9 93.6 65.1
JAN 1998 79.2 61.8 > 99.9 > 99.9 85.9 60.1
APR 1998 96.7 77.4 > 99.9 > 99.9 77.8 47.5
JUN 1998 98.3 88.6 > 99.9 > 99.9 81.9 66.7
SEP 1998 > 99.9 92.0 > 99.9 > 99.9 87.4 37.4
The ZVI PRB has consistently lowered the input U concentration by more than 99.9% after the contaminated groundwater had traveled 1.5 ft into the PRB. This trend is true for both row 1 and row 2 monitoring points (table 7.1). Figure 7.4 indicates that the majority of U is removed from the groundwater after traveling 0.5- to 1.0-ft into the ZVI PRB. During the first year of operation, there is no indication that U removal efficiencies in the ZVI PRB have decreased.
The percentage of U removed in the PO4 PRB is less than the ZVI PRB (table 7.1). The U removal efficiency consistently decreased through January 1998 to below 70% U removal in row 2 monitoring points. After January 1998, the percentage of U removal has consistently increased on both sides of the PO4 PRB. The observed increase in U removal may be due to a transition to more chemically reducing conditions over time in the PO4PRB. This transition to more reducing conditions is indicated by a consistent increase of dissolved iron in the PO4 PRB. For example, in well PO4R1-2, in the PO4 PRB, the dissolved iron concentration increased from 60 µg/L in October 1997 to 1,090 µg/L in January 1998 and 4,240 µg/L in June 1998. The mechanism causing the transition to reducing conditions in the PO4 PRB is unknown at this time.
Results from row 1 monitoring points in the AFO PRB indicate that more than 90% of the input U concentration was removed through November 1997 (table 7.1). From January 1998 through September 1998 the U removal percentage monitored by row 1 wells was reduced to less than 90%. The U removal in the other half of the AFO PRB sampled by the row 2 monitoring points was significantly less (table 7.1) and was never higher than 88%.
Variation in the % of U removal in the AFO PRB appears to be related to large pH changes in selected row 1 monitoring points (fig. 7.6). For example, the pH in wells AFOR1-5 and AFOR1-
55

7.4
7.6
7.8
8.0
8.2
8.4
8.6
Percent U removal
pH value
76
78
80
82
84
86
88
90
92
94
96 WELL AFOR1-5
7.4
7.6
7.8
8.0
8.2
8.4
8.6 WELL AFOR1-8
Percent U removal
pH value
84
86
88
90
92
94
96
98
pH
, IN
UN
ITS
UR
AN
IUM
RE
MO
VAL
, IN P
ER
CE
NT
8 varied from about 7.5 to greater than 8.5 pH units (fig. 7.6). The mechanism causing this change in pH is unknown; however, the U removal by the AFO barrier appears to be inversely related to the increases in pH. Elevated pH values during the November 1997 and February and April 1998 monitoring periods resulted in decreasing percentages of U removal. Decreases in pH during the June and September 1998 monitoring periods resulted in an increased amount of U removal (fig. 7.6).
7/21/97 10/29/97 2/6/98 5/17/98 8/25/98
SAMPLE DATE
Figure 7.6. Variation in pH and percent uranium removal from September 1997 through September 1998 in two monitoring points completed in the amorphous ferric oxyhydroxide barrier, Fry Canyon, Utah.
The U concentrations were determined in filtered (0.45 µm) and unfiltered water samples collected in October 1997 after installation of the PRBs. The purpose of this was to determine if unfiltered U concentrations were higher relative to pre-installation data. It is also important to document if PRB installation has increased the relative amount of unfiltered U concentration above that expected by analytical variation. For example, an increase in unfiltered U
56

concentration relative to filtered U concentration may indicate that U is associated with colloids and subject to migration from the PRB to the downgradient aquifer.
Similar to the pre-installation samples (fig. 2.7), comparison of the filtered and unfiltered samples indicates no increase (above that expected by analytical variation) in unfiltered relative to filtered U concentrations for most samples (fig. 7.7). The majority of samples taken from within the AFO PRB have significantly higher unfiltered relative to filtered U concentrations (fig. 7.7). The AFO material was in a slurry that was mixed with pea gravel during PRB installation. After AFO PRB installation, it is likely the residual AFO slurry that did not attach to the pea gravel adsorbed U resulting in an elevated U concentration in the unfiltered samples. The unfiltered U concentration in the non-barrier wells was not elevated relative to the filtered concentration indicating that the particulate U was not transported more than a few ft beyond the barrier.
UN
FIL
TER
ED U
RA
NIU
M C
ON
CEN
TRAT
ION
, IN
MIC
RO
GR
AM
S P
ER
LIT
ER
100,000
10,000
1,000
100
10
1
0.1
Line of
equal c
oncentr
ation
Error bar +/- 10 percent
Bone char samples Zero valent iron samples Amorphous ferric oxyhydroxide samples Non-barrier samples
0.1 1 10 100 1,000 10,000 100,000
FILTERED URANIUM CONCENTRATION, IN MICROGRAMS PER LITER
Figure 7.7. Comparison of uranium concentration in filtered and unfiltered water samples collected after installation of permeable reactive barriers, October 1997, Fry Canyon, Utah.
Additional geochemical and hydrological factors that affect U removal efficiencies and processes in each of the PRBs are currently (1999) being evaluated. These factors include but are not limited to changes in the amount and velocity of water flowing through the PRBs, type and quantities of minerals forming within the PRBs, and small-scale groundwater flow paths through the PRBs.
7.3 Water-Quality Effects of Barrier Materials A major concern of using PRBs for long-term remediation of contaminated groundwater is changes in the chemical quality of water caused by the reactive material. For example, high iron or manganese concentrations from iron filing barriers could have negative impacts to downgradient
57

water quality (Grand Junction Office, 1998). Selected data from the water quality minimonitor in each PRB were plotted during the first year of operation to determine changes in water quality as a result of barrier aging.
Water temperature followed a seasonal cycle in each PRB (fig. 7.8). The minimum water temperature occurred in late February and the maximum occurs in early- to mid-September. An annual temperature difference of approximately 10 degrees Celsius was observed during the first year of PRB operation. Each of the 3 PRBs reacted similarly to the changes in seasonal temperature. The effects of these temperature changes PRB performance are unknown.
20
18
16
14
12
10
8
7/11/97 9/29/97 12/18/97 3/8/98 5/27/98 8/15/98 11/3/98
PO4 BARRIER
ZVI BARRIER AFO BARRIER
WA
TE
R T
EM
PE
RA
TU
RE
, IN
D
EG
RE
ES
CE
LS
IUS
DATE
Figure 7.8. Changes in water temperature within the bone char phosphate, zero valent iron, and amorphous iron oxyhydroxide permeable reactive barriers from September 1997 through September 1998, Fry Canyon, Utah.
The pH values in water samples from the PO4 PRB are similar to pre-installation pH values; however, water samples from the ZVI and AFO PRBs contain higher pH values relative to samples from the upgradient well, FC3 (fig. 7.9). The elevated pH in the ZVI PRB is probably the result of iron corrosion in either aerobic or anaerobic conditions as shown in equations 7.2 and 7.3,
2Fe0 + O2 + 2H2O <—> 2Fe2+ + 4OH- (7.2)
Fe0 + 2H2O <—> Fe2+ + H2 + 2OH- (7.3)
where: Fe0 is metallic iron, O2 is dissolved oxygen, H2O is water,
OH- is hydroxide ion, H2 is hydrogen, and
Fe2+ is ferrous iron.
58

Both reactions can result in an increase in pH. Upgradient wells contain measurable dissolved oxygen concentrations implying that reaction 7.2 probably occurs until all the oxygen is consumed. Dissolved oxygen in the groundwater within the ZVI PRB is entirely consumed after traveling 0.5 ft thus allowing reaction 7.3 to occur. Gas generation is occurring in the center part of the ZVI barrier and it is likely hydrogen gas; however, this has not been confirmed analytically.
10.0 EXPLANATION
9.5 PO BARRIER
4
ZVI BARRIER
AFO BARRIER 9.0 WELL FC3
NIT
S
8.5
pH, I
N U 8.0
7.5
7.0
6.5
6.0 7/11/97 9/29/97 12/18/97 3/8/98 5/27/98 8/15/98 11/3/98
DATE
Figure 7.9. Changes in pH values within the bone char phosphate, zero valent iron, and amorphous iron oxyhydroxide permeable reactive barriers and background well FC3 from September 1997 through September 1998, Fry Canyon, Utah.
The dissolved oxygen concentration and oxidation-reduction potential in water samples from each PRB are distinctly different (figs. 7.10 and 7.11). The dissolved oxygen concentrations in the ZVI PRB were below the lower reporting limit of 0.10 mg/L during the first 7 months of barrier operation and increased to slightly above the lower reporting limit since mid-March 1998. These data support the consumption of dissolved oxygen by iron oxidation as shown in equation 7.2. In addition, the lack of dissolved oxygen during the first 7 months of barrier operation also support the presence of anaerobic corrosion (equation 7.3) and the generation of hydrogen. This slight increase in dissolved oxygen concentrations after mid-March 1998 could indicate a decrease in the efficiency of oxygen consumption by the barrier material. Sivavec and others (1997) postulate that anaerobic corrosion (equation 7.3) may lead to the formation of iron hydroxide precipitates that may coat the iron surface and affect its redox properties. The oxidation reduction potential values in the ZVI PRB have been less than -370 millivolts during the first year of operation; however, there was a slight upward trend during the first 6-months of barrier operation (fig. 7.11).
59

0.0
0.5
1.0
1.5
2.0
2.5
3.0
3.5
4.0
LOWER REPORTING LIMIT
PO4 BARRIER
ZVI BARRIER AFO BARRIER
DIS
SO
LVE
D O
XY
GE
N, I
NM
ILL
IGR
AM
S P
ER
LIT
ER
7/11/97 9/29/97 12/18/97 3/8/98 5/27/98 8/15/98 11/3/98
DATE
Figure 7.10. Changes in dissolved oxygen concentration from within the bone char phosphate, zero valent iron, and amorphous iron oxyhydroxide permeable reactive barriers from September 1997 through September 1998, Fry Canyon, Utah.
-600
-400
-200
0
200
400
PO4 BARRIER
ZVI BARRIER AFO BARRIER
OX
IDA
TIO
N R
ED
UC
TIO
N P
OT
EN
TIA
L,
IN M
ILL
IVO
LTS
7/11/97 9/29/97 12/18/97 3/8/98 5/27/98 8/15/98 11/3/98
DATE
Figure 7.11. Changes in oxidation reduction potential from within the bone char phosphate, zero valent iron, and amorphous iron oxyhydroxide permeable reactive barriers from September 1997 through September 1998, Fry Canyon, Utah.
Dissolved oxygen concentrations in the PO4 and AFO PRBs were similar to the concentrations measured in pre-installation groundwater samples (fig. 7.10). No oxygen consuming reactions are expected to occur in either the PO4 or AFO PRBs. Monthly variations in the dissolved oxygen concentrations are probably a function of interaction between surface-water and groundwater at
60

ZV
2
ZV
5
ZV
8
ZV
2
ZV
5
ZV
8 1 1- 1- 1- 2- 2- 2-S1 3 2A2
IR IR IRR R RT F TIT 2 4I I I I II G GPZV ZV ZV ZV D D D
the site. During rainfall events, the groundwater gradient in the PRBs can reverse causing water from the ZVI barrier to enter the gravel pack and enter the PO4 or AFO barriers for short time periods.
Oxidation reduction potential values in the PO4 and AFO barriers are generally positive (7.11) and reflect the measurable dissolved oxygen in these barriers (fig. 7.10). The mechanism causing the consistent decrease in oxidation reduction values in the PO4 PRB since March 1998 is not known; however, this decrease has consistently increased the U removal efficiencies in the PO4 PRB.
Ferrous iron concentrations during the first year of ZVI and AFO PRB operation were summarized for upgradient, within-barrier, and downgradient monitoring wells (figs. 7.12 and 7.13). Excessive amounts of iron in groundwater are considered undesirable because it can form red oxyhydroxide precipitates that stain laundry and plumbing fixtures. Ferrous iron concentrations in the upgradient ZVI wells were less than 3 mg/L during the first year of barrier operation (fig. 7.12). Numerous wells within the ZVI PRB contained ferrous iron concentrations that exceeded the upper reporting limit of 12 mg/L. Well DP4, a downgradient monitoring well, contained ferrous iron concentrations consistently higher than 5 mg/L. These concentrations are larger than the ferrous iron concentrations in groundwater that entered the ZVI PRB during the first year of operation.
EXPLANATION
Upper reporting limit of field determination
16
14
FE
RR
OU
S IR
ON
CO
NC
EN
TRA
TIO
N, I
N
MIL
LIG
RA
MS
PE
R L
ITE
R
SEP 97 OCT 97 NOV 97 JAN 98 APR 98 JUN 98 SEP 98
12
10
8
6
4
2
0
UP
GR
AD
IEN
T
WE
LLS
DO
WN
-G
RA
DIE
NT
W
ELL
S
WELLS WITHIN THE ZVI PRB
MONITORING WELLS
Figure 7.12. Changes in ferrous iron concentration in water samples from upgradient, within-barrier, and downgradient wells in the zero-valent iron permeable reactive barrier from September 1997 through September 1998, Fry Canyon, Utah. Samples with a ferrous iron concentration above the upper reporting limit were assigned a value of 0.3 times the upper reporting limit of 12 mg/L.
61

-2
-5
-8
-2
-5
-8
1 1 1 1 S 2 2 21 2 3 R R R R R RFT T TO 1 2 O O O O O O O O O G GFF F F F F F F F F D DA A A A A A A A A A
1
Lower reporting limit for field determination
0.1
EXPLANATION SEP 97 OCT 97 NOV 97 JAN 98 APR 98 JUN 98 SEP 98
FE
RR
OU
S I
RO
N C
ON
CEN
TRAT
ION
,IN
M
ILL
IGR
AM
S P
ER
LIT
ER
0.01
UPG
RA
DIE
NT
W
ELL
S
DO
WN
-G
RA
DIE
NT
W
ELL
S W ELLS WITHIN THE AFO PRB
MONITORING WELLS
Figure 7.13. Changes in ferrous iron concentration in water samples from upgradient, within-barrier, and downgradient wells in the amorphous ferric oxyhydroxide permeable reactive barrier from September 1997 through September 1998, Fry Canyon, Utah. Samples with a ferrous iron concentration below the lower reporting limit were assigned a value of 0.7 times the lower reporting limit of 0.15 mg/L.
Wells within the ZVI PRB generally showed an increase in ferrous iron concentrations during the first 3 to 7 months of barrier operation. (fig. 7.12). The June and September 1998 ferrous iron samples indicated a reduction in ferrous iron concentrations for wells within the PRB and the downgradient well DP4. This trend is in agreement with the increase in dissolved oxygen concentration noted previously for wells within the ZVI PRB. The trends observed in ferrous iron concentration supports the dissolution of ZVI and possible formation of iron hydroxide precipitates that may be coating the metallic iron surface and affecting its redox properties. To date (September 1998), this has not produced a measurable reduction in the U uptake efficiency of the ZVI PRB. The year 1 data indicate that monitoring of ferrous iron concentrations in conjunction with dissolved oxygen concentrations and oxidation-reduction potential values may be used as early warning signals to detect coating of the reactive material in ZVI PRBs by iron hydroxides.
Ferrous iron concentrations in the upgradient AFO PRB wells were less than 1 mg/L and most samples were below the lower reporting limit of 0.15 mg/L during the first year of barrier operation (fig. 7.13). Monitoring points within and downgradient of the AFO PRB also contained low concentrations of ferrous iron and did not exceed 1 mg/L. The low concentrations of ferrous iron within and downgradient of the AFO PRB are consistent with the measurable
62

-2
-5
-8
-2
-5
-8
1 S1 2 1 1 1 2 2 2 3 R R R R R RT T F T 3 4 4 4 44 4 4 4 4 4 43 G GO O O OO O O O O OC D DP P P P P P P P P PF
dissolved oxygen concentrations and positive oxidation-reduction potentials measured within this barrier.
Phosphate concentrations in samples from well FC3, upgradient of the PO4 PRB were lower than the lower reporting limit of 0.2 mg/L during the first year of barrier operation (fig. 7.14). Monitoring points in the gravel pack in front of the P04 PRB contained elevated phosphate concentrations that periodically exceeded 10 mg/L. The elevated phosphate concentration in the upgradient wells probably resulted from the low ground-water gradient in the barrier allowing water to move from the PO4 PRB into the pea gravel during selected time periods. The persistence of high phosphate concentrations in the pea gravel is probably the result of the limited amount of metal oxides expected to be contained in the pea gravel. Metal oxides, especially iron and manganese oxy-hydroxides usually limit phosphate concentrations to significantly less than 1 mg/L (Hem, 1989). Water samples collected from within the PO4 PRB contained elevated phosphate concentrations as high as 81 mg/L (fig. 7.14). Downgradient monitoring points contained low phosphate concentrations that were less than 0.2 mg/L during the first year of PRB operation. These low phosphate concentrations are probably due to the large amounts of naturally occurring iron oxyhydroxides in the colluvial sediments downgradient from the PO4 PRB.
EX PLANATION
SEP 97 OCT 97 NOV 97 JAN 98 APR 98 JUN 98 SEP 98
PH
OS
PH
AT
E C
ON
CE
NT
RA
TIO
N, I
N
MIL
LIG
RA
MS
PE
R L
ITE
R A
S P
O4
10
1
0.1
0.01
UP
GR
AD
IEN
T
WE
LLS
DO
WN
-G
RA
DIE
NT
W
ELL
S WELLS WITHIN THE PO 4 PRB
MONITORING WELLS
Figure 7.14. Changes in phosphate concentration in water samples from upgradient, within-barrier, and downgradient wells in the bone char permeable reactive barrier from September 1997 through September 1998, Fry Canyon, Utah. Samples with a phosphate concentration below the lower reporting limits were assigned a value of 0.7 times the two lower reporting limits of 0.05 and 0.2 mg/L.
63

Table 8.1. Actual cost and duration of project planning through installation of three permeable reactive barriers at the Fry Canyon site, Utah. Cost figures include indirect costs incurred by the U.S. Department of Energy and U.S. Geological Survey. Indirect cost rates will probably be higher for private organizations.
Project phase and approximate duration
Tasks Cost, in U.S. dollars
Phase I March 1, 1996 to March 15, 1997
1. 2. 3. 4. 5. 6. 7.
Project planning Site selection Laboratory testing of reactive materials Selection of reactive materials Regulatory permitting Site Health and Safety Plan for site characterization Site characterization $280,000
Phase II 1. Design of permeable reactive barrier structures March 16, 1997 to 2. Design of monitoring network August 15, 1997 3.
4. 5.
Logistical planning Analysis and awarding of subcontracts Development of Health and Safety Plan for construction phase $148,000
Phase III 1. Purchasing and shipment of material, supplies, and August 20 to equipment September 4, 1997 2.
3. 4.
Excavation of trench Installation of monitoring network Placement of reactive material and backfilling/recontouring operations $246,000
TOTAL $674,000
8.0 COST ANALYSIS OF SITE CHARACTERIZATION, PRB DESIGN, AND PRB INSTALLATION Actual costs of the demonstration project activities are summarized (table 8.1) to document the potential costs that could be associated with a full-scale PRB deployment at another site. Cost figures are provided for the following three project phases:
• site selection, characterization, and PRB material testing • PRB design • PRB installation
Phase I activities include site selection and site characterization, as well as laboratory testing and development of potential reactive materials for placement in the PRBs. The cost of Phase I tasks at Fry Canyon was $280,000 and took place over a 1-year period. The time period and cost of Phase I activities could be reduced significantly in a remediation application for the following reasons: (1) the site will already be selected; (2) existing information on type and performance of reactive material will decrease the laboratory testing time and subsequent cost; (3) site characterization activities will likely be complete.
64

Phase II tasks include design of the PRBs and associated monitoring networks. The cost of Phase II tasks was $148,000 and occurred within a 5-month interval. In an actual remediation deployment, the cost and timeframe of these activities could be significantly reduced for the following reasons: (1) the demonstration of three PRBs in one structure involved additional design considerations and costs; (2) the costs needed to design a monitoring network for three PRBs was much more extensive than designing a monitoring network for a single PRB in a remediation application that would probably have less stringent monitoring needs; and (3) permitting issues for the demonstration project delayed the actual start date by about 2.5 months.
Phase III tasks included installation of three PRBs and the associated monitoring network. The cost of Phase III tasks was $246,000 and involved approximately 16 days of effort. A detailed breakdown of the installation cost is listed in table 8.1. The time frame and cost of Phase III activities could be higher or lower during the installation of a single PRB for groundwater remediation. PRB installation at the Fry Canyon demonstration site may be more cost effective than at other sites due to the following factors: (1) less than 15 ft to groundwater; (2) average saturated thickness less than 5 ft; (3) tailings and overburden removed during trench excavation did not require special handling; and (4) only 21 linear ft of PRB was emplaced.
PRB installation at the Fry Canyon demonstration site may be less cost effective than at other sites due to the following factors: (1) only small quantities of reactive materials were purchased, negating any bulk discounts that may have been available; (2) a large number of monitoring points were required to meet the objectives of a demonstration project using three PRBs; (3) twelve transducers, three water-quality minimonitors, and two automated data loggers were required to monitor PRB performance; and (4) the demonstration site is in a relatively remote site causing increased shipping costs and travel costs for construction, scientific, and management personnel.
9.0 REMAINING QUESTIONS FOR RPMs DURING THE RI/FS This study has addressed a number of issues associated with the use of PRBs for the removal of U from groundwater; however, important questions that a site RPM might have about using this technology for ground water remediation remain unanswered. Some of these questions can be addressed by continued work at the Fry Canyon site. Questions are listed below:
1. Is the long-term performance of PRBs for removal of inorganic contaminants, including uranium, cost effective compared to other contaminant removal technologies currently available?
2. What methods can be used to determine if PRBs will be an effective remediation technology at a particular site for the removal of inorganic contaminants? Specific issues that need to be addressed include: (1) correlation of laboratory column and batch tests to actual field performance of PRBs; (2) specific inorganic contaminants that can be removed from groundwater by PRBs; and (3) type of ground water systems amenable for PRB deployment.
3. How long will a PRB remove inorganic contaminants to concentrations at or below the clean-up goals for a particular site? Specific issues that need to be addressed include: (1) effective lifetime of the PRB; (2) important geochemical processes negatively affecting PRB performance (clogging, passivation, dissolution of barrier material, and re-mobilization of contaminants); and (3) understanding the geochemical and hydrologic processes that may
65

reduce long-term contaminant removal efficiencies of PRBs. For example: 1. The surface of the ZVI barrier material may become coated by either carbonate or iron hydroxide mineral phases.; 2. Chemical precipitation or microbial growth may reduce PRB permeability.; 3. The mechanism(s) of contaminant removal by the reactive material will influence the potential for re-release of contaminant. For example, a removal reaction resulting in the uranium being precipitated in a mineral structure may potentially be more resistant to re-release than an adsorption removal process.
4. Can PRBs remain in place or will removal and proper disposal of barrier material become necessary for inorganic contaminants to remain unavailable to the post-remediation groundwater?
5. What are the regulatory issues associated with long-term disposal of material from PRBs? 6. What are the positive and negative effects of microbes on PRB performance? 7. What are the potential detrimental effects of the barrier material itself to downgradient water
quality? 8. How will the quantity and major ion chemical composition of groundwater flowing through a
PRB affect expected PRB longevity and inorganic contaminant removal efficiency?
10.0 RECOMMENDATIONS FOR PRB IMPLEMENTATION: LESSONS LEARNED
Based on the installation of the three PRBs at the Fry Canyon demonstration site, a number of improvements and issues should be considered during future, full-scale installations of PRB for site remediation. The following list of considerations is not exhaustive, rather it reflects project-specific observations based on experiences at Fry Canyon:
1. The uneven surface of the underlying confining unit made it difficult to ensure that each PRB gate structure or no-flow barrier was in direct contact with the underlying confining unit. If either structure was placed on small lenses of the residual colluvial aquifer, this may have provided a pathway for contaminated groundwater to bypass the reactive material.
A possible solution to prevent this would be the use of a more powerful track hoe that would be able to excavate into the underlying confining unit. This equipment would allow for a smooth surface and a gradient could be established that would drain the groundwater away during excavation, allowing the observation of the underlying confining unit. In addition, the use of pumps with a capacity exceeding the groundwater inflow will allow for visual inspections of the seal between the PRB and the confining layer.
2. The use of pre-mixed bentonite slurry for construction of the no-flow barriers was problematic. It was difficult to control the movement of slurry from the wing wall to the gate structure of each PRB. It is critical to know exactly where the bentonite slurry is. If the slurry flows into a gate structure it could impact the flow and treatment of contaminated groundwater in the finished PRB. In a worst case scenario, the gate structure of the PRB could be sealed off, preventing the treatment of contaminated groundwater.
A possible solution would be the use of non-hydrated bentonite chips for the construction of PRB wing walls and associated no-flow barriers. After placement, the chips would hydrate with the natural groundwater, ensuring correct placement during PRB construction. In addition, the use of bentonite chips would not require the added expense of cement mixers for slurry transport.
66

3. The placement of monitoring wells within the wing walls and other no-flow areas between PRB gate structures is important to ensure proper operation. Including these wells in the routine monitoring network can provide critical water-level and water-quality data useful in assessing PRB operation. For example, water levels measured in wing wall monitoring wells would be expected to respond more slowly to naturally occurring water-level increases observed within the PRB gate structures.
4. A large bedrock nose was encountered during PRB installation that resulted in a re-orientation of the PRBs. This re-orientation resulted in the entry of groundwater at an oblique angle into the PRB gate structures, rather than the perpendicular angle that was anticipated.
In order to prevent this problem in future PRB installations, a more detailed view of the bedrock topography is needed during site characterization activities. Additional data on bedrock topography could be obtained by increased drilling density during pre-installation characterization activities or possibly by subsurface geophysical methods such as seismic or ground penetrating radar techniques.
5. During the pre-installation characterization, it is important to determine the amount of readily desorbable U contained in the contaminated aquifer sediments. In a remediation scenario where the source term is either removed or stabilized in place, the total mass of readily desorbed U will eventually pass through the PRB. Quantification of this mass is needed to properly design the contaminant removal capacity of the PRB prior to emplacement.
6. Numerous hydrologic and water-quality characteristics should be considered prior to the selection of an appropriate point of compliance (POC) well when installing a PRB for ground-water remediation. When a PRB is placed within the contaminant plume, the POC well should probably be placed within the PRB. If the POC well is placed downgradient of the PRB it is likely that contaminant free water exiting the PRB could become re-contaminated with readily desorbable contaminants from the aquifer sediments.
For some PRB materials, such as ZVI, the placement of a POC well within the PRB could be problematic. For example, the high iron concentrations and high pH values of water within the Fry Canyon ZVI PRB may not meet water-quality compliance standards. However, if the POC wells were placed downgradient of the ZVI PRB, the high iron concentration and high pH values would be significantly reduced. In many situations the location of POC wells may have to be parameter specific depending on the barrier material and on-site hydrologic and geochemical conditions.
7. Quantification of groundwater flow during pre-installation characterization and after PRB emplacement is critical. This information is needed for PRB design and to monitor changes in PRB hydraulic conductivity after emplacement. Groundwater models provide adequate information to address barrier design issues during the pre-installation characterization phase. After PRB emplacement, tracer injection methods appear to be best suited for monitoring PRB performance over time. Results to date (1999) at the Fry Canyon site have indicated that in-situ flow sensors are of limited use in monitoring changes in either ground-water flow or direction within PRBs; however, these data are still being evaluated.
67

Appendix A Summary of Activities at Other Sites Using Permeable Reactive Barriers to
Remove Uranium
Currently (1999) there are 45 field projects involving the use of the PRBs to treat contaminated groundwater (Appendix A, table A.1). Including the Fry Canyon demonstration site, 6 of the 44 PRB field projects are treating water containing uranium. A PRB was recently installed at the Rocky Flats DOE facility in Colorado; however, no results are currently (1999) available. The Rocky Flats PRB is mainly intended to treat cVOCs and only trace concentrations of U are present. At Oak Ridge, TN the DOE has installed 2 PRBs to treat uranium; Channel and South Plume. No information is currently (1999) available about the South Plume site.
68

Insert table A.1
Table A.1. Other permeable reactive barrier field projects.
[cVOC, volatile organic carbon; Pb, lead; Zn, zinc; Cu, copper; Cd, cadmium; ft, feet; ZVI, zero-valent iron; ORC, oxygen release compound (magnesium peroxide); F&G, funnel and gate; IO, iron oxide; P, phosphates; GAC, granular activate charcoal; ?, unknown]
No. Country/State/Prov Site Contaminants Install Date Status Depth Reactant Type Designation
1 Alabama Maxwell AFB cVOC ? Installing now? 75 ft ZVI Frac/Jet Commercial
2 British Columbia Vancouver Pb, Zn, Cu, Cd 3/97 Operating 24 ft Compost Trench Pilot
3 California Chico TCE 1995 Pilot Complete 100 ft Microbes Injection Pilot
4 California Alameda cVOC 12/96 Operating ? ZVI F&G Pilot
5 California Ft. Bragg cVOC ? Operating ? GAC Cannister Commercial
6 California Moffat Field cVOC 4/96 Pilot operating 20 ft? ZVI F&G Pilot
7 California Mountain View cVOC 9/95 Full Scale 20 ft ZVI Trench Commercial
8 California Newbury Park cVOC ? Pilot operating 87 ft ZVI foam Fracing Pilot
9 California Sunnyvale cVOC 1/95 Operating 30 ft ZVI F&G Commercial
10 California Valley Wood Cr 1997? Operating? ? Reductant Injection Commercial
11 Colorado Federal Center cVOC 10/96 Operating 25 ft ZVI F&G Commercial
12 Colorado Lowry AFB cVOC ? Operating 25 ft ZVI F&G Pilot
13 Colorado Durango U, Mo, As, Se 10/95 Operating 5 ft ZVI Cannister Pilot
14 Colorado Rocky Flats cVOC, U 9/98 Operating 5 ft ZVI Cannister Commercial
15 Delaware Dover AFB cVOC ? Operating? ? ZVI F&G? Pilot?
16 Florida Cape Canaveral cVOC 10/97 Operating 45 ft ZVI Mandrel Pilot
17 Florida Cape Canaveral cVOC 11/97 Operating 45 ft ZVI Jetting Pilot
18 Florida Cape Kennedy cVOC ? Operating? ? ZVI/Sonic Deep Mixing Pilot
19 Ireland Belfast cVOC 12/95 Operating 40 ft ZVI Cannister Commercial
20 Kansas Coffeyville cVOC 1/96 Operating 28 ft ZVI F&G Commercial
21 Kentucky Paducah cVOC 1995 Operating ? ZVI/+ Mandrel Pilot
22 New Hampshire Summersworth cVOC 1997 Operating ? ZVI F&G Pilot
23 New Jersey Caldwell Trucking cVOC 3/98 Operating ? ZVI Fracing Commercial
24 New Jersey Fairfield cVOC 9/98 Operating 25 ft ZVI/Sand Trench Commercial
69

25
30
35
40
45
____________________________________________________________________________________________________________________
Table A.1. (Continued)
No. Country/State/Prov Site Contaminants Install Date Status Depth Reactant Type Designation
New Jersey Parlin none 1997 No contaminant 15 ft ZVI Jetting demo Demonstration
26 New Mexico Belen BTEX ? Operating ? ORC Socks Commercial
27 New Mexico Sandia Cr/TCE/CCl4 1997 Completed 8 ft ZVI/GAC/+ Jetting Demonstration
28 New York West Valley 90Sr ? ? ? Zeolite ? Commercial
29 New York Sherburne cVOC 12/97 Operating 15 ft ZVI F&G Commercial
North Carolina Elizabeth City cVOC, Cr 6/96 Operating 26 ft ZVI Cont. trencher Commercial
31 Ohio Portsmouth cVOC 1998 Operating ? MnO4 Injection Pilot
32 Ohio Portsmouth cVOC 1996 Operating? piped ZVI/+ Cannisters Pilot
33 Ontario Borden CFB cVOC 1993 Completed 8 ft ZVI/Sand F&G Pilot
34 Ontario Nickel Rim Metals/SO4 8/95 Operating 10 ft Wood chips/+ Trenching Pilot
Oregon Unnamed cVOC 1998 Operating 30 ft ZVI Cont. Trencher Commercial
36 South Carolina SRS-D Area metals/TCE/SO4 ? ? ? ? Environwall Commercial
37 South Carolina SRS-Siphon TCE 7/97 Operating 15 ft ZVI Geosiphon Pilot
38 South Carolina Manning cVOC 1998? Operating 29 ft ZVI Cont Trencher Commercial
39 Tennessess Y12 South Plume U/Tc/PCE/NO3 12/97 ? 25 ft? ? Concrete Vault Commercial
Tennessee Y12 Channel U/Tc/NO3 12/97 Operating 30 ft ZVI Trench Commercial
41 Tennesse WAG5 90Sr 11/94 Operating 12 ft Zeolite Concrete Vault Commercial
42 Utah Fry Canyon U 9/97 Operating 15 ft ZVI/IO/P F&G Pilot
43 Washington Hanford 100D Cr 9/97 Operating 100 ft Dithionite Injection Pilot
44 Washington Hanford 100H Cr 9/95 Operating 100 ft Dithionite Injection Pilot
Wyoming Christensen Ranch U 10/97 Operating 440 ft P/IO Barrier package Pilot
70

Oak Ridge National Laboratory Y-12 Plant, Channel Site, TN. A PRB was installed at the DOE Oak Ridge National Laboratory in December 1997. Eighty tons of ZVI was emplaced in a trench using guar gum to keep the trench open (Gu and others, 1998). An enzyme breaker was added that causes the guar gum to dissipate into the groundwater to minimize permeability loss. The trench penetrates a shallow groundwater aquifer contaminated by uranium, technetium-99, and nitrate. Preliminary results indicate that the PRB is effectively removing all the contaminants. Ferrous iron concentrations in the groundwater were high shortly after emplacement but have since decreased and the pH has increased to greater than 9. The guar gum caused an increase in microbial activity and some problems were encountered by the guar failing to breakdown properly and flow out of the system.
Uranium Mill Tailings Repository Site at Durango, CO. A seep coming from a U mill tailings repository is currently (1999) collected in a gravel trench and then piped to an underground steel tank containing foam blocks of ZVI (Morrison, 1998). This PRB has been operating intermittently since May 1996. The ZVI has consistently reduced uranium, molybdenum, and nitrate to concentrations below water quality standards. Concentrations of U contained in the ZVI were as high as 2% by weight; and concentrations of vanadium as high as 10% by weight. After about 2 years of operation, the tank became clogged and was no longer allowing the passage of water. Gas bubbles were observed during excavation of the tank. The gas composition included hydrogen and methane. The gases were a likely cause of the blockage.
71

Appendix B
Summary of Deep Emplacement Methods for Permeable Reactive Barriers
New techniques are being developed to increase the depth range for emplacement of PRBs. Six new methods have been field tested: (1) vertical hydraulic fracturing, (2) jet grouting, (3) chemical injection, (4) deep soil mixing, (5) driven mandrels, and (6) arrays of non-pumping wells. Following are summaries of recent developments in these deep emplacement technologies. In addition to increasing the emplacement depths, these methods have two other advantages over trench and fill installation: (1) ZVI can be emplaced more efficiently around utility lines, and (2) workers are afforded more protection because less contaminated material is exposed at the surface.
Vertical hydraulic fracturing. Vertical hydraulic fracturing is initiated by driving a spade-shaped tool into a borehole in the desired location. Water is not viscous enough to suspend and carry the ZVI to the fracture zone. To increase the viscosity, guar gum is mixed with the water and ZVI. An enzyme is added to the mixture that is designed to cause the guar to degrade after several days. Pumping the grout (ZVI with water and guar) into the incipient fracture causes the fractures to expand and lengthen. The PRB wall is emplaced by fracturing in a series of adjacent borings.
Vertical hydraulic fracturing has been used at only one site to emplace reactive materials; the Caldwell Trucking facility in New Jersey (Appendix A, table A.1). About 110 tons of ZVI were injected to form two parallel walls about 3 inches thick each (Hocking and others, 1998). The PRB is about 65 ft deep and 150 ft long and is being used to degrade cVOCs in groundwater. This project demonstrated that ZVI could be emplaced into unconsolidated rocks by creating vertical fracture zones. ZVI has also been emplaced as a proponent during hydraulic fracturing of jointed bedrock at the Newbury Park site in California (Marcus and Farrell, 1998). This demonstration project was also aimed at controlling cVOC contamination in groundwater.
Jet grouting. Jet grouting has been used for some time to emplace cement or cement/bentonite impermeable barriers but only recently has been used to emplace PRBs. Grouting is performed by lowering a jetting tool into a borehole. As the tool is withdrawn upwards, grout is pumped through a small orifice at pressures often exceeding 5000 psi. As with hydraulic fracturing, the grout consists of ZVI suspended in a guar gum and water mixture containing an enzymatic breaker. The grout mixes turbulently with the sediments and some of the sediment is brought to the surface through the annulus around the drill pipe. The PRB is formed by successively jetting a line of boreholes. The jetting tool is rotated during extraction to form columns of ZVI with diameters up to 8 ft. Alternatively, �thin diaphragm� configurations with a thickness of about 3 to 6 inches are formed if the tool is not rotated.
Jet grouting has been used to emplace ZVI at three sites (Appendix A, table A.1): (1) Cape Canaveral Air Force Station, Florida, (2) a Du Pont facility at Parlin, New Jersey, and (3) Sandia National Laboratory, New Mexico. At Cape Canaveral, high-pressure water jetting was used to cut a slot in coastal-plain sands contaminated with cVOCs (Marchand and others, 1998). The slot was then expanded and filled by injecting ZVI mixed with guar gum, cross linking compound, enzyme breaker, and water. The resulting PRB was 70 ft in length, about 4 inches thick, and 45 ft deep. This project demonstrated that ZVI could be emplaced using jetting and the resulting PRB would degrade cVOCs. At Parlin, ZVI suspended in water with guar and enyzme breaker
72

was injected under 5000 psi into the upper 15 ft of unsaturated sands and gravels (Landis, 1997). The project demonstrated the viability of the jet grouting method to emplace columns and thin diaphragms of ZVI; however, no contaminant was present. At Sandia, jet grouting was used to emplace grouts in 6-foot diameter, 8-foot deep cylindrical culverts (Dwyer, 1998). Eight types of grout were used, each in a separate installation: (1) ZVI with guar, (2) cement slag, (3) activated carbon, (4) colloidal ZVI, (5) mordenite (zeolite), (6) clinoptilolite (zeolite), (7) ZVI with zeolite and guar, and (8) ZVI with cement slag and guar. Contaminants were not present at the site but chromium (VI), TCE, and CCl4 were introduced after the jetting to determine the effectiveness of the reaction zones. This demonstration indicated that these materials could be emplaced by jet grouting and that the desired reactions were occurring.
Chemical injection. Chemical injection involves the introduction of reactive materials through wells. The materials are dissolved in water and the solution is passed into the formation by exerting a hydrostatic pressure (either via gravity or pumping) at the well head. Injections are made in a line of adjacent wells to form the PRB. Reactants that have been injected include microbes, microbial nutrients, chemical reductants, and oxidants.
Four field projects have been conducted to test chemical injection emplacement methods (Appendix A, table A.1): (1) Chico Municipal Airport, California, (2) DOE Facility at Portsmouth, Ohio, (3) Hanford 100D Area, Washington, and (4) Hanford 100H Area, Washington. At Chico, resting-state microbial cells were injected into a groundwater plume containing TCE (Duba and others, 1996). About 50% of the cells attached to the subsurface sediments, forming a reaction zone. In the reaction zone, TCE was degraded by enzymes present in the microbes. This project demonstrated that resting-state microbes could be emplaced by injection through wells and that once injected they would degrade TCE. At the Portsmouth site, potassium permanganate was injected into the subsurface through wells. Few results are available but apparently the oxidation was able to cause the degradation of TCE in the groundwater. This project demonstrated an alternative to using reductive dechlorination by ZVI for TCE degradation, and that oxidation of the subsurface through injection was possible. At the Hanford 100D and 100H areas, sodium dithionite solution was injected into the subsurface through wells (Fruchter and others, 1998). Dithionite is a reduced sulfur compound that is capable of reducing ferric iron to ferrous iron. The ferric iron is contained in silicates and oxides of the sediment. The ferrous iron formed by the dithionite injection is capable of reducing Cr(VI) to Cr(III) which precipitates out of the groundwater as a hydroxide mineral. The ferrous iron is also capable of degrading TCE by reductive dechlorination and precipitation of U as uraninite. A PRB was formed by multiple injections of dithionite in adjacent wells. This project showed that dithionite could be injected to form a chemically reducing zone capable of remediating groundwater.
Deep soil mixing. Deep soil mixing involves the use of large (up to 12-foot diameter) augers that mix the subsurface soils as they are rotated into it (Shoemaker and others, 1995). To form a PRB, reactive materials are augured into the soil. Deep soil mixing can emplace reactive materials up to 150 ft deep in unconsolidated sediments.
Deep soil mixing has been used to emplace reactive material at only one site: Cape Kennedy Space Center, Florida (Appendix A, table A.1). Details of this demonstration are not available but apparently the project demonstrated that emplacing ZVI using deep soil mixing is feasible.
73

Driven mandrels. A hollow tube (the mandrel) can be driven into the subsurface and filled with reactive material (Shoemaker et al.,1995). When the mandrel is pulled back out, the reactive material remains in the ground. A �shoe� is placed on the lower end of the mandrel to prevent it from filling with sediment during the insertion. The shoe remains in the ground during withdrawal. A mandrel with a rectangular cross section of up to 30 inches by 6 inches can be driven up to 120 ft in unconsolidated sediments. A PRB is formed by repeatedly inserting the mandrel at adjacent locations.
Reactive materials have been emplaced at two sites using a mandrel: (1) Paducah, Kentucky and (2) Cape Canaveral Air Force Station, Florida. At Paducah, a mandrel was used to install ZVI and granular activated carbon in a tight clay-rich formation. Groundwater containing TCE was moved through the reaction zone using electrokinetics and in the reaction zone it was either adsorbed or degraded. This project demonstrated the feasibility of mandrel emplacements to about 25-foot depths. At Cape Canaveral, a mandrel was used to emplace ZVI to a depth of 45 ft (Marchand and others, 1998). A 70-foot long by 4-inch thick zone of ZVI was constructed to degrade cVOCs. This project demonstrated that a large-scale PRB could be installed at a reasonable cost using a mandrel and that the PRB is capable of degrading cVOCs.
Arrays of non-pumping wells. Use of arrays of unpumped wells has been proposed by Wilson and Mackay (1997) as a method to remediate contaminant plumes when the installation of treatment walls is not possible because of technical or financial constraints. This type of deployment technology is useful for treatment of deeper contaminant plumes. Barrier deployment tubes (Naftz and others, 1999) are used to place reactive material into the arrays of non-pumping wells. The combination of barrier deployment tubes with arrays of non-pumping wells allows for the cost-effective retrieval and replacement of reactive material, which would not be possible with other deployment technologies.
Under natural flow conditions, groundwater converges to non-pumping well arrays and the associated barrier deployment tubes in response to the difference in hydraulic conductivity between the well and aquifer. Numerical simulations of ground-water movement through a non-pumping well array indicate that each well intercepts groundwater in a portion of the upgradient aquifer approximately twice the inside diameter of the well (Naftz and others, 1999).
Reactive materials have been emplaced in arrays of non-pumping wells using barrier deployment tubes at two sites: (1) Christensen Ranch In-Situ U Mine, Wyoming and (2) Fry Canyon, Utah (Appendix A, table A.1). Barrier packages containing mixtures of bone-char phosphate and iron oxide were deployed into groundwater at the Christensen Ranch site with a U concentration of 20,000 µg/L to depths exceeding 430 ft below land surface. Initial U removal efficiencies exceeded 99.9% during a 7-month deployment period at the Christensen Ranch site. Both projects are in progress.
74

Appendix C Site Evaluation and Selection Process
During a reconnaissance-phase investigation, four sites were considered for the demonstration of PRBs to remove U from groundwater (Appendix C, fig. C.1). Based on the results of the reconnaissance-phase investigation, three of the four candidate sites had sufficient groundwater for a viable demonstration project. The Tony M Mine U tailings were dry and eliminated from further consideration. The Blue Cap and Firefly-Pygmy mine sites contained steep tailings slopes that made them unsuitable as potential demonstration sites. The steep and potentially unstable tailings slopes would incur high costs for the drilling and installation of monitoring wells. Conducting a long-term demonstration project on steep slopes would result in unnecessary safety issues. In addition, the measured U concentration in a water sample from the Firefly-Pygmy mine site was low (Appendix C, fig. C.1).
75

UTAH
42°
41° 110° 109°
40°
39°
38°
37°
111° Great Salt Lake
River
River
UtahUtahLakeLakeUtah Lak e
Salt Lake CitySalt Lake CitySalt Lake City
RiverRiverRiverRiver JuanJuanJuan San
SanSan
Color
ado
Color
ado
Color
ado
River
River
River
River
Fry Canyon site. Measured uranium concentration in
114° 113° 112°
ground water was 3,160 µg/L.
Lake Powell
0 20 40 60 KILOMETERS
0 20 40 60 MILES
Tony M Mine uranium tailings. No ground water
was present.
Blue Cap mine. Uranium concentration ranged from 575 to 1,040 µg/L in samples of water discharging from the audit and below the tailings.
Firefly-Pygmy Mine. Uranium concentration measured at the base of the tailings was 115 µg/L.
Figure C.1. Location and uranium concentration in water samples from abandoned mine sites considered for field demonstration of permeable reactive barriers.
76

The following characteristics were considered during the reconnaissance-stage investigation: (1) extent and type of groundwater contamination;
(2) depth to contaminated groundwater;
(3) complexity of groundwater flow system;
(4) past, present, and future status of site clean up;
(5) ownership;
(6) topography;
(7) access;
(8) historical and background information;
(9) climate;
(10) transferability;
(11) health and safety issues.
During the reconnaissance-phase investigation the Fry Canyon site appeared to contained numerous favorable characteristics for the long-term field demonstration of PRBs. These favorable characteristics included: (1) groundwater containing U concentrations exceeding 3,000 µg/L; (2) riparian vegetation indicating the presence of shallow groundwater; (3) a No Further Action Planned rating for the site in 1990, thus preventing the potential for clean-up activities at the site during field demonstration; (4) the site is managed by BLM; (5) access roads to the tailings exist; (6) flat surface topography that is conducive to drilling, monitoring, and construction activities; (7) a moderate climate at the site that is conducive to year-round site access and monitoring; (8) the site is typical of other abandoned mine sites in the arid- and semi-arid Western United States.
77
Appendix D
Health and Safety Issues Associated with Installation of Permeable Reactive Barriers
Health and safety issues specifically associated with PRB installation were separated into three distinct activities. Activity 1 consisted of excavating the tailings and colluvium in order to expose the saturated zone of the aquifer system. Activity 2 consisted of excavating in the saturated zone to the confining unit beneath the colluvial aquifer. Activity 3 was filling the trench with the appropriate chemicals for each of the PRBs.
Each of the construction activities had different hazards associated with them. Primary hazards associated with Activity 1 was worker exposure to ionizing radiation, radioactive materials, and silica dust. Trench collapse was the main hazard associated with activity 2. Exposure to PRB chemicals was the primary hazard associated with activity 3. Table D.1 details the toxicity characteristics of the PRB chemicals used at the Fry Canyon demonstration site.
Table D.1. Permeable reactive barrier chemicals used at the Fry Canyon site and the associated toxicity characteristics. [PEL/TLV-TWA, permissible exposure limit/threshold limit value-time weighted average]
Chemical Routes of Target organs Effects of exposure PEL/TLV-TWA exposure
Amorphous ferric Inhalation, skin Eyes, Acute: mild skin and Not available oxide and eye contact, respiratory eye irritation.
ingestion system Chronic: fibrosis and liver cirrhosis if large quantities are inhaled.
Foamed zero- Inhalation, skin Eyes, Acute: bronchitis, eye Not available valent iron and eye contact, respiratory irritation.
ingestion system Chronic: siderosis. Bone char Inhalation, skin Eyes and Acute: irritation of Not available (phosphate) and eye contact, respiratory nasal and respiratory
ingestion system passage, eye irritation. Chronic: none.
Safety procedures were instituted for each of the three construction activities to minimize the associated hazards. During activity 1 (excavation to the saturated zone) the following safety procedures were followed: (1) a qualified Radiological Control Technician monitored radiation hazards and (2) respirable dust levels were monitored by the USGS Health and Safety Officer to minimize exposure to silica dust. During activity 2 (excavation below the saturated zone) a trench box was placed on the bedrock surface within the trench (fig. 5.1) to allow workers to enter the trench prior to backfilling operations. During activity 3 (filling the trench with PRB chemicals) workers were protected from contact with the chemicals by wearing personal protective equipment as deemed appropriate. In addition, all workers practiced as low as reasonably achievable (ALRA) techniques to minimize exposure to the chemical materials during the backfilling operations.
78

Appendix E Sample Collection, Analysis, Quality Assurance, and Field Measurement
Calibration
Sample Collection. During the pre-installation monitoring phase, water was purged from each well until the field parameters (pH, dissolved oxygen, oxidation-reduction potential, specific conductance, and water temperature) stabilized. The shallow water table allowed for the collection of groundwater samples with a peristaltic pump. Stabilization of field parameters usually occurred after four to five gallons of water was removed from the well. At a minimum, this volume represented the removal of greater than 3 casing volumes from the 2-inch diameter monitoring wells.
The volume of water extracted from each well was modified during the PRB monitoring phase because of the close proximity of monitoring points within and adjacent to the PRBs. Less water was purged from the 2-inch wells to minimize the creation of pumping induced gradients within and adjacent to the PRBs during monitoring activities. 1 gallon of water was removed from the 2-inch diameter monitoring wells and 1 liter of water was removed from the 0.25-inch monitoring wells prior to sample collection. With a maximum saturated thickness of five ft in the PO4 barrier (fig. 5.3), the extraction of 1 gallon of water from the 2-inch monitoring wells represents approximately 1.2 casing volumes. Extraction of 1 liter of water from the 0.25-inch monitoring wells represents approximately 20.8 casing volumes.
During September 1998 a total of 4 gallons of water was removed from the 2-inch diameter well ZVIFSI in the ZVI PRB to address changes in water chemistry as a function of pumpage volumes. Water samples were collected and analyzed after every gallon that was pumped (Appendix E, table E.1). Results from the chemical analysis indicate that U concentration and field parameters are stable sometime after 1 gallon and sometime before 2 gallons of water have been removed from the well casing. These results indicate that removal of 1 gallon of water from each 2-inch diameter well completed within and adjacent to the barrier is probably the best compromise to obtain a representative groundwater sample while not imposing pumping induced gradients within the PRBs. The higher hydraulic conductivity of the barrier materials and pea gravel relative to the native aquifer material is the probable reason that smaller purge volumes are needed from the wells completed in the PRB and pea gravel.
Table E.1. Uranium concentration and pH, specific conductance, and oxidation-reduction potential value changes during pumping of well ZVIFS1 during September 1998, Fry Canyon, Utah. [µg/L, milligrams per liter; µS/cm, microsiemens per centimeter; mV, millivolts]
Volume of water removed during pumping of well
ZVIFS1 in gallons
Uranium concentration
in µg/L pH, in units
Specific conductance in µS/cm
Oxidation-reduction
potential in m V
1 < 0.06 8.88 1,760 -272
2 < 0.06 9.05 1,760 -235 3 < 0.06 9.04 1,760 -222
4 < 0.06 9.03 1,770 -222
79
After purging, water samples were filtered on site using a 0.45 µm capsule filter and collected in field-rinsed polyethylene bottles. Samples for analysis of uranium, aluminum, calcium, copper, iron, potassium, lithium, magnesium, manganese, phosphorus, sodium, silicon, strontium, and zinc were acidified on site with ultra-pure concentrated nitric acid to a pH<2. Approximately 100 ml of deionized water was then pumped through the tubing between samples. Each monitoring point contains a dedicated sampling tube to minimize cross contamination. Surface-water samples from Fry Creek were collected in field-rinsed, one-gallon containers and processed according to the procedures used for groundwater samples.
Sample Analysis. A variety of analytical methods were used to determine the concentrations of the chemical constituents that were monitored during the laboratory simulation, pre-installation, and the first year of PRB operation. Water analyses were conducted at the USGS Research Laboratories in Menlo Park, California. Dissolved U was determined by kinetic phosphorescence analysis (KPA). The KPA-11A has a ±3% precision and 0.06 microgram/L detection limit. Samples were diluted 1:10 in 0.1 M HNO3 to minimize potential chloride interference. (Chemchek Instruments, Richland WA). Aluminum, calcium, copper, iron, lithium, magnesium, phosphorus, manganese, sodium, silicon, strontium, and zinc concentrations were determined by ICP/OES using a Thermo Jarrel Ash ICAP 61 (Standard Methods, 1992). Potassium was determined by direct air-acetylene flame atomic absorption spectrometry (AA) using a Perkin Elmer AA 603. Sulfate and chloride concentrations were measured by ion chromotography using a Dionex Chromatograph CHB (Standard Methods, 1992).
Selected chemical and physical constituents in groundwater samples were determined in the field. The pH, specific conductance, and temperature of each water sample was determined in a flow-thru chamber using a Yellow Springs Instrument 600XL minimonitor that was calibrated daily with respect to pH and specific conductance. Total alkalinity (as CaCO3) of filtered (0.45 µm) water samples was determined on site using a HACH digital titrator and 1.6 normal sulfuric acid. Ferrous iron and phosphate (as PO4) were determined on site with a colorimetric method using CHEMetrics self-filling vials and a portable photometer.
Quality Assurance. A series of quality assurance (QA) samples were collected and processed with the routine water-quality samples collected from within and adjacent to the PRBs during September 1997 through September 1998. The QA samples collected during pre-installation and year 1 barrier monitoring activities consisted of process blanks and field duplicates.
Deionized, distilled water of known major-, minor, and trace-element composition from the USGS Water-Quality Service Unit, Ocala, Florida, was used for the process blanks during each sampling trip. The process blanks were used to assess contamination during field processing of water samples. Ten process-blank samples were analyzed (Appendix E, table E.2). Median concentrations for the process blanks were all below the analytical detection limits (Appendix E, table E.2). Uranium concentrations in the process blank samples never exceeded the analytical detection limit of 0.06 µg/L.
80

Table E.2. Chemical analysis of selected major-, minor-, and trace-element constituents from blank samples processed during pre-installation characterization and year 1 barrier monitoring activities, Fry Canyon, Utah, September 1996 to September 1998.
[mg/L, milligrams per liter; <, less than reported value; µg/L, micrograms per liter]
Chemical constituent
Unit Number of samples
Median concentration
Low concentration
High concentration
ßUranium µg/L 10 < 0.06 < 0.06 < 0.06
Aluminum µg/L 6 < 50 < 50 50
Calcium, mg/L 6 < 0.01 < 0.01 0.2
Copper µg/L 6 < 5 < 5 < 5
Iron µg/L 6 < 20 < 20 30
Potassium mg/L 6 < 0.05 < 0.05 < 0.04
Lithium mg/L 6 < 0.04 < 0.04 < 0.04
Magnesium mg/L 6 < 0.04 < 0.04 < 0.04
Manganese µg/L 6 < 10 < 10 < 10
Phosphorus mg/L 6 < 0.1 < 0.1 < 0.1
Sodium mg/L 6 < 30 < 30 < 30
Silicon mg/L 6 < 0.05 < 0.05 0.13
Strontium mg/L 6 < 0.015 < 0.015 < 0.015
Zinc µg/L 5 < 10 < 10 < 10
Sulfate mg/L 6 < 1 < 1 < 1
Chloride mg/L 6 < 0.25 < 0.25 10
A total of 11 field duplicates were analyzed to ensure consistency in the methods used to collect the water samples during pre-installation and year 1 barrier monitoring activities. At least one duplicate sample from a randomly selected well was collected, processed, and submitted for chemical analyses during each sampling trip from September 1996 through September 1998 (Appendix E, table E.3). The majority of field duplicate results are within plus or minus 10% of one another for all constituents. With respect to uranium, the duplicate sample collected during January 1998 was 11.5% higher in U than the routine sample (Appendix E, table E.3). The January 1998 sample was the only duplicate that exceeded the plus or minus 10% margin of error.
81
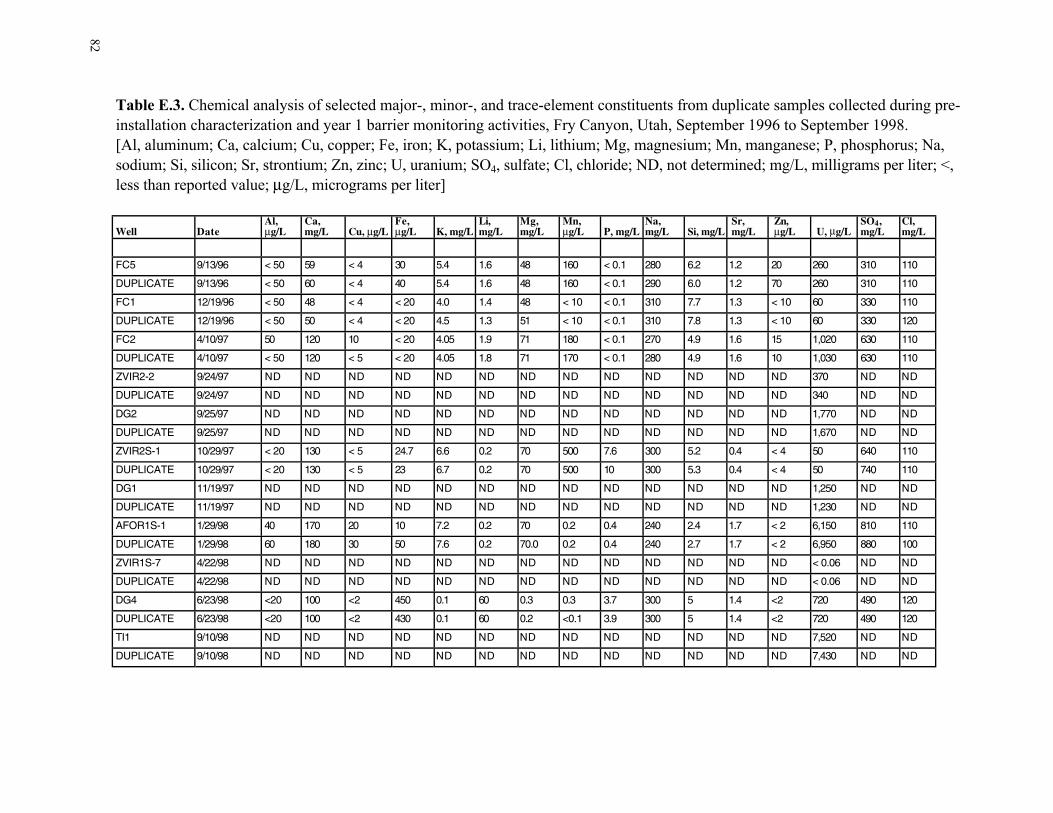
Table E.3. Chemical analysis of selected major-, minor-, and trace-element constituents from duplicate samples collected during pre-installation characterization and year 1 barrier monitoring activities, Fry Canyon, Utah, September 1996 to September 1998. [Al, aluminum; Ca, calcium; Cu, copper; Fe, iron; K, potassium; Li, lithium; Mg, magnesium; Mn, manganese; P, phosphorus; Na, sodium; Si, silicon; Sr, strontium; Zn, zinc; U, uranium; SO4, sulfate; Cl, chloride; ND, not determined; mg/L, milligrams per liter; <, less than reported value; µg/L, micrograms per liter]
Al, Ca, Fe, Li, Mg, Mn, Na, Sr, Zn, SO4, Cl, Well Date µg/L mg/L Cu, µg/L µg/L K, mg/L mg/L mg/L µg/L P, mg/L mg/L Si, mg/L mg/L µg/L U, µg/L mg/L mg/L
FC5 9/13/96 < 50 59 < 4 30 5.4 1.6 48 160 < 0.1 280 6.2 1.2 20 260 310 110
DUPLICATE 9/13/96 < 50 60 < 4 40 5.4 1.6 48 160 < 0.1 290 6.0 1.2 70 260 310 110
FC1 12/19/96 < 50 48 < 4 < 20 4.0 1.4 48 < 10 < 0.1 310 7.7 1.3 < 10 60 330 110
DUPLICATE 12/19/96 < 50 50 < 4 < 20 4.5 1.3 51 < 10 < 0.1 310 7.8 1.3 < 10 60 330 120
FC2 4/10/97 50 120 10 < 20 4.05 1.9 71 180 < 0.1 270 4.9 1.6 15 1,020 630 110
DUPLICATE 4/10/97 < 50 120 < 5 < 20 4.05 1.8 71 170 < 0.1 280 4.9 1.6 10 1,030 630 110
ZVIR2-2 9/24/97 ND ND ND ND ND ND ND ND ND ND ND ND ND 370 ND ND
DUPLICATE 9/24/97 ND ND ND ND ND ND ND ND ND ND ND ND ND 340 ND ND
DG2 9/25/97 ND ND ND ND ND ND ND ND ND ND ND ND ND 1,770 ND ND
DUPLICATE 9/25/97 ND ND ND ND ND ND ND ND ND ND ND ND ND 1,670 ND ND
ZVIR2S-1 10/29/97 < 20 130 < 5 24.7 6.6 0.2 70 500 7.6 300 5.2 0.4 < 4 50 640 110
DUPLICATE 10/29/97 < 20 130 < 5 23 6.7 0.2 70 500 10 300 5.3 0.4 < 4 50 740 110
DG1 11/19/97 ND ND ND ND ND ND ND ND ND ND ND ND ND 1,250 ND ND
DUPLICATE 11/19/97 ND ND ND ND ND ND ND ND ND ND ND ND ND 1,230 ND ND
AFOR1S-1 1/29/98 40 170 20 10 7.2 0.2 70 0.2 0.4 240 2.4 1.7 < 2 6,150 810 110
DUPLICATE 1/29/98 60 180 30 50 7.6 0.2 70.0 0.2 0.4 240 2.7 1.7 < 2 6,950 880 100
ZVIR1S-7 4/22/98 ND ND ND ND ND ND ND ND ND ND ND ND ND < 0.06 ND ND
DUPLICATE 4/22/98 ND ND ND ND ND ND ND ND ND ND ND ND ND < 0.06 ND ND
DG4 6/23/98 <20 100 <2 450 0.1 60 0.3 0.3 3.7 300 5 1.4 <2 720 490 120
DUPLICATE 6/23/98 <20 100 <2 430 0.1 60 0.2 <0.1 3.9 300 5 1.4 <2 720 490 120
TI1 9/10/98 ND ND ND ND ND ND ND ND ND ND ND ND ND 7,520 ND ND
DUPLICATE 9/10/98 ND ND ND ND ND ND ND ND ND ND ND ND ND 7,430 ND ND
82

Field Measurement Calibration. The Yellow Springs Instrument 600XL water-quality minimonitors and Waterlog H-310 pressure transducers were re-calibrated at approximately 5-week intervals during the first year of barrier operation. The specific conductance, dissolved oxygen, oxidation-reduction potential, and pH probes were calibrated on the water-quality minimonitors. Specific conductance was calibrated using two standards with a known specific conductance (0 and 2,500 mS/cm). Calibration of the dissolved oxygen probe was done in an air-saturated chamber using a barometric pressure and temperature corrected value. A Zobell solution relative to the silver-silver chloride/platinum electrode (corrected for temperature) was used to calibrate the oxidation-reduction potential probe. The pH electrode was calibrated using both the pH 7 and 10 standards.
The pressure transducers were calibrated by comparing the measured water level, using a electronic measuring tape, with the water level recorded by the pressure transducer. If the water level recorded by the transducer differed by more than +/- 0.03 feet from the actual water level, the transducer was adjusted until the two measurements agreed.
83

Appendix F Glossary of Terms
Aerobic Presence of oxygen.
Anaerobic Absence of oxygen.
Aquifer An underground geologic formation that is filled with water and which is permeable enough to transmit water to wells and springs.
Confining unit A body of material distinctly less permeable than the aquifer adjacent to it.
Darcy's Law Expressed by an equation that can be used to compute the quantity of water flowing through an aquifer.
Effective porosity The volume of interconnected void spaces through which water or other fluids can travel in a rock or sediment divided by the total volume of the rock or sediment.
Ex-situ The execution of an environmental cleanup by removing the contaminants from the existing location to another matrix.
Groundwater Subsurface water found in the saturated zone below the water table in formations known as aquifers.
Hydraulic conductivity A coefficient of proportionality describing the rate at which water can move through a permeable medium.
Hydraulic gradient The rate of change of pressure head per unit of distance of flow at a given point and in a given direction.
In-situ In place.
Milliequivalents The formula weight, in milligrams, of a dissolved ionic species divided by the electrical charge.
Oxidation The loss of one or more electrons by a substance during a chemical reaction.
Permeable Pertains to the relative ease with which a porous medium can transmit a liquid under a hydraulic or potential gradient.
Permeable reactive barrier Permanent, semi-permanent, or replaceable bodies of chemically reactive material that are installed across the flow path of a contaminant plume.
pH The negative logarithm of the hydrogen ion activity in solution.
Phreatophyte A plant that obtains its main water supply from the saturated zone or through the capillary fringe above the saturated zone.
84

Total porosity Ratio of the volume of void spaces, interconnected and unconnected, in a rock or sediment to the total volume.
Potentiometric surface The level to which water rises in a well. This level, generally called the hydraulic head, is the sum of the elevation head and the pressure head. Elevation head is a result of the elevation of the point in question above a datum, and pressure head is the height of the column of water rises above the point in question.
Pump and treat Contaminant removal process where water is pumped from the aquifer into a treatment cell, treated, and then pumped back into the aquifer.
Recharge The entry of water into the saturated zone.
Redox A chemical process where the loss (oxidation) and gain (reduction) of electrons among reactants affect the charge of the medium and can be expressed as an oxidation reduction potential (ORP).
Reduction The gain of one or more electrons by a substance during a chemical reaction.
Saturated zone Zone of porous medium in which all interconnected voids are filled with water.
Specific conductance An approximation of the salinity in a water sample. The reciprocal of electrical resistivity.
Transmissivity The rate at which water at the prevailing density and viscosity is transmitted through a unit width of the aquifer under a unit hydraulic gradient.
Transpiration The process by which water adsorbed by plants is discharged into the atmosphere from the plant surface.
Water table That surface of a body of unconfined ground-water at which the pressure is equal to that of the atmosphere.
85

Appendix G List of References
Abdelouas, A., Lutze, W., and Nuttall, H.E. 1999. Oxidative dissolution of uraninite precipitated on Navajo sandstone. Journal of Contaminant Hydrology, 36:353-375.
Arey, I.S., Seaman, J.C., and Bertsch, P.M. 1999. Immobilization of uranium in contaminated sediments by hydroxyapatite addition. Environmental Science and Technology. 33:337-342.
American Society for Testing and Materials. 1994. Standard Test Method for Permeability of Granular Soils (Constant Head), D 2434-68 (Reapproved 1974). Reprint form Annual Book of ASTM Standards, Philadelphia, PA.
Blowes, D. W. and Ptacek, C. J. 1992. Geochemical Remediation of Groundwater by Permeable Reactive Walls: Removal of Chromate by Reaction With Iron-Bearing Solids. Proceedings of the Subsurface Restoration Conference, Dallas, Texas, 1992. pp. 214-216.
Bostick, W. D., Jarabek, R. J., Slover, W. A., Fiedor, J. N., Farrell, J., and Helferich, R. 1996. Zero-valent iron and metal oxides for the removal of soluble regulated metals in contaminated groundwater at a DOE site. U. S. Department of Energy Report Number K/TSO-35P, Oak Ridge National Laboratory, Tennessee. 64 pp.
Duba, A. G., Jackson, K. J., Jovanovich, M. C., Knapp, R. B., and Taylor, R. T. 1996. TCE remediation using in-situ resting-state bioaugmentation. Environmental Science and Technology. 30:1982-1989.
Dwyer, B. 1998. Remediation of deep soil and groundwater contamination using jet grouting and innovative materials. In Subsurface Barrier Technologies, Engineering Advancements and Application Considerations for Innovative Barrier Technologies, compilation of papers from the International Business Communications Conference, Tucson, Arizona, January, 1998.
Fruchter, J. S., Cole, C. R., Williams, M. D., Vermeul, V. R., Szecsody, J. E., and Evans, J. C. 1998. Recent progress on in-situ redox manipulation barriers for chromate and trichloroethylene. In RTDF Permeable Reactive Barriers Action Team Meeting Presentation Materials, Beaverton, Oregon, April 1998. pp. 117-130.
Freethey, G.W., Spangler, L.E., and Monheiser, W.J. 1994. Determination of hydrologic properties needed to calculate average linear velocity and travel time of groundwater in the principal aquifer underlying the southeastern part of Salt Lake Valley, Utah. U.S. Geological Survey Water-Resources Investigations Report 92-4085. 30 p.
Gillham, R.W., and Burris, D.R.. 1992. Recent developments in permeable in situ treatment walls for remediation of contaminated groundwater. Proceedings, Subsurface Restoration Conference, June 21-24, Dallas, Texas.
Grand Junction Office. 1998. Results of field treatability studies of the Monticello, Utah, PeRT wall. U. S. Department of Energy, Grand Junction Office Report GJO-98-69-TAR, 32 p.
86

Grenthe, I., Fuger, J., Konings, R.J.M., Lemire, R.J., Muller, A.B., Nguyen-Trung, C., and Wanner, H. 1992. Chemical thermodynamics of uranium. North-Holland, Amsterdam, 715 p.
Gu, B., Watson, D., Bogle, M. A., and Liang, L. 1998. Treatment of radionuclides and inorganic contaminants in groundwater by permeable reactive barriers. Remediation Technology Development Forum Permeable reactive Barriers Action Team Meeting Presentation Materials, Oak Ridge, Tennessee, pp. 182-204.
Hocking, G., Wells, S. L., and Ospina, R. I. 1998. Performance of the iron reactive permeable barrier at Calwell Superfund site. In Remediation Technology Development Forum Permeable Reactive Barriers Action Team Meeting Presentation Materials, Oak Ridge, Tennessee, November 1998, pp. 229-242.
Jobin, D.A. 1962. Relation of the transmissive character of the sedimentary rocks of the Colorado Plateau to the distribution of uranium deposits. U.S. Geological Survey Bulletin 1124, 151 p.
Kaplan, D. I., Cantrell, K. J., and Wietsma, T.W. 1994. Formation of a barrier to groundwater contaminants by the injection of zero-valent iron colloids: Suspension properties. 33rd Hanford Symposium on Health and the Environment; In-Situ Remediation: Scientific Basis for Current and Future Technologies (eds. G. W. Gee and N. R. Wing), Battelle Press, Columbus, Ohio, p. 821-837.
Landis, R.. 1997. Potential use of jetting to emplace PRBs. In Summary of the Remediation Technologies Development Forum Permeable Reactive Barriers Action Team Meeting, Virginia Beach, Virginia, September, 1997, p. 11-12.
Ma, Q.Y., Logan, T.J., Traina, S.J., and Ryan, J.A. 1994. The effects of NO3-, Cl-, SO4
2- and
CO32- on Pb2+ immobilization by hydroxyapatite. Environmental Science and Technology.
28:408-418.
Marchand, E. G., Shirley, P. A., McNelis, K. A., Fiorillo, T. L. 1998. New installation techniques in side-by-side demonstrations at Cape Canaveral Air Station. In RTDF Permeable Reactive Barriers Action Team Meeting Presentation Materials, Beaverton, Oregon, April 1998, p. 21-28.
Marcus, D. L. and Farrell, J. 1998. Reactant sand-fracking pilot test results. In Remediation Technology Development Forum Permeable Reactive Barriers Action Team Meeting Presentation Materials, Beaverton, Oregon, April 1998, p. 29-36.
Morrison, S. J. and Spangler, R. R. 1992. Extraction of uranium and molybdenum from aqueous solutions: A survey of industrial materials for use in chemical barriers for uranium mill tailings remediation. Environmental Science and Technology. 26:1922-1931.
Morrison, S. J., and Spangler, R. R. 1993. Chemical barriers for controlling groundwater contamination. Environmental Progress. 12:175-181.
87

Morrison, S. J. 1998. Status of the UMTRA Durango permeable reactive treatment walls. In Remediation Technology Development Forum Permeable Reactive Barriers Action Team Meeting Presentation Materials, Oak Ridge, Tennessee, November 1998, p. 205-216.
Morrison, S. J., Helferich, R., Thomson, B., and Emilia, D. 1998. Improvements to reactive materials for use in permeable reactive barriers to remediate groundwater contaminated by metals and radionuclides. U. S. Department of Energy report prepared for MSE Technologies, Inc., 49 pp.
Morrison, S. J., Spangler, R. R., and Morris, S. A. 1996. Subsurface injection of dissolved ferric chloride to form a chemical barrier: Laboratory investigations. Groundwater. 34:75-83.
Morrison, S. J., Spangler, R. R., and Tripathi, V. S. 1995. Adsorption of uranium (VI) on amorphous ferric oxyhydroxide at high concentrations of dissolved carbon (IV) and sulfur(VI). Journal of Contaminant Hydrology. 17:333-346.
Morrison, S.J., and Spangler, R.R. 1992. Chemical barriers for controlling groundwater contamination. Environmental Progress. 12:175-181.
Naftz, D.L., Davis, J.A., Fuller, C.C., Morrison, S.J., Freethey, G.W., Feltcorn, E.M., Wilhelm, R.G., Piana, M.J., Joye, J., and Rowland, R.C. 1999. Field demonstration of permeable reactive barriers to control radionuclide and trace-element contamination in ground water from abandoned mine lands. U.S. Geological Survey Toxic Substances Hydrology Program--Proceedings of the Technical Meeting, Charleston, South Carolina, March 8-12, 1999 (eds. D.W. Morganwalp and H.T. Buxton): U.S. Geological Survey Water-Resources Investigations Report 99-4018A, p. 281-288.
National Research Council. 1994. Alternatives for ground water cleanup. National Academy Press, Washington, D.C., 315 p.
Rai, D. 1999. Personal communication.
Feltcorn, E., and Breeden, R., 1997. Reactive barriers for uranium removal. U.S. Environmental Protection Agency Ground Water Currents. Issue No. 26:1-2.
Sandino, A., and Bruno, J. 1992. The solubility of (UO2)3(PO4)2•4H2O(s) and the formation of U(VI) phosphate complexes: Their influence in uranium speciation in natural waters. Geochimica et Cosmochimica acta. 56:4135-4145.
Shoemaker, S. H., Greiner, J. F., and Gillham, R. W., 1995. Permeable reactive barriers. In R. R. Rumer and J. K. Mitchell (eds.), Assessment of Barrier Containment Technologies, a product of the International Containment Technology Workshop, Baltimore, Maryland, August, 1995, p. 310-348.
Sivavec, T.M., Mackenzie, P.D., Horney, D.P., and Baghel, S.S., 1997. Redox-active media for permeable reactive barriers: International Contaminant Technology Conference Proceedings, February 9-12, 1997, St. Petersburg, Florida, p. 753-759.
88

Sowder, A.G., Clark, S.B., and Fjeld, R.A. 1996. The effect of silica and phosphate on thetransformation of schoepite to becquerelite and other uranyl phases. Radiochimica Acta. 74:45-49.
Spangler, R. R. and Morrison, S. J. 1991. Laboratory-scale tests of a chemical barrier for use at uranium mill tailings disposal sites. ER�91 Conference Proceedings, Pasco, Washington, U. S. Department of Energy, 1991, p. 739-744.
Spangler, R. R. 1997. Laboratory investigation of FeO and amorphous ferric oxyhydroxide as permeable barrier materials at Fry Canyon. Department of Energy Grand Junction Office Internal Report, 9 pp.
Standard Methods. 1992. Standard methods for the examination of water and wastewater, 18th
Edition. Greenberg, A.E., Clesceri, L.S., and Eaton, A.D., Editors.
Thaden, R.E., Trites, A.F. Jr., and Finnell, T.L. 1964. Geology and ore deposits of the White Canyon area, San Juan and Garfield Counties, Utah. U.S. Geological Survey Bulletin 1125, 166 p.
Travis, C.C., and Doty, C.B. 1990. Can contaminated aquifers at Superfund sites be remediated?. Environmental Science and Technology. 24:1464-1466.
Wilson, R.D., and Mackay, D.M. 1997. Arrays of unpumped wells: An alternative to permeable walls for in situ treatment. International Contaminant Technology Conference Proceedings, February 9-12, 1997, St. Petersburg, Flor., p. 888-894.
Zhang, P, Ryan, J.A., Bryndzia, L.T. 1997. Pyromorphite formation from goethite adsorbed lead. Environmental Science and Technology. 31:2673-2678.
89