interferometry discuss group & python tutorial adam leroy & scott schnee (nrao) february 28,...
TRANSCRIPT
Interferometry Discuss Group & Python Tutorial
Adam Leroy & Scott Schnee (NRAO)February 28, 2014
What to Expect
• A series of discussions about interferometry and practical Python usage
• Audience of beginners, with “experts” leading the discussion topics– If you are an expert, please volunteer to lead a
discussion• For Python and CASA portions of IDG, please
bring your laptop and install CASA– http://casa.nrao.edu/
Example Interferometry Topics
• Fourier transforms and the importance of “uv coverage”
• What happens between waves hitting antennas and writing a raw data file
• Hands-on data reduction using CASA• Methods of imaging and deconvolution• Please send us requests!– [email protected] and [email protected]
Logistics
• Weekly meetings in ER230, Fridays @10:30– Switching between interferometry and Python
• Check the IDG wiki for syllabus– https://safe.nrao.edu/wiki/bin/view/Main/Interfer
ometryDiscussionGroup2014
• http://casaguides.nrao.edu/index.php?title=PythonOverview
• http://casaguides.nrao.edu/index.php?title=ALMA_SIS14

1. An interferometer measures the interference pattern produced by two apertures.
2. The interference pattern is directly related to the source brightness. In particular, for small fields of view the complex visibility, V(u,v), is the 2D Fourier transform of the brightness on the sky, T(x,y)
(van Cittert-Zernike theorem) T(x,y)x
y
uv plane
Fourier space/domain
Image space/domain
image plane
From Sky Brightness to Visibility
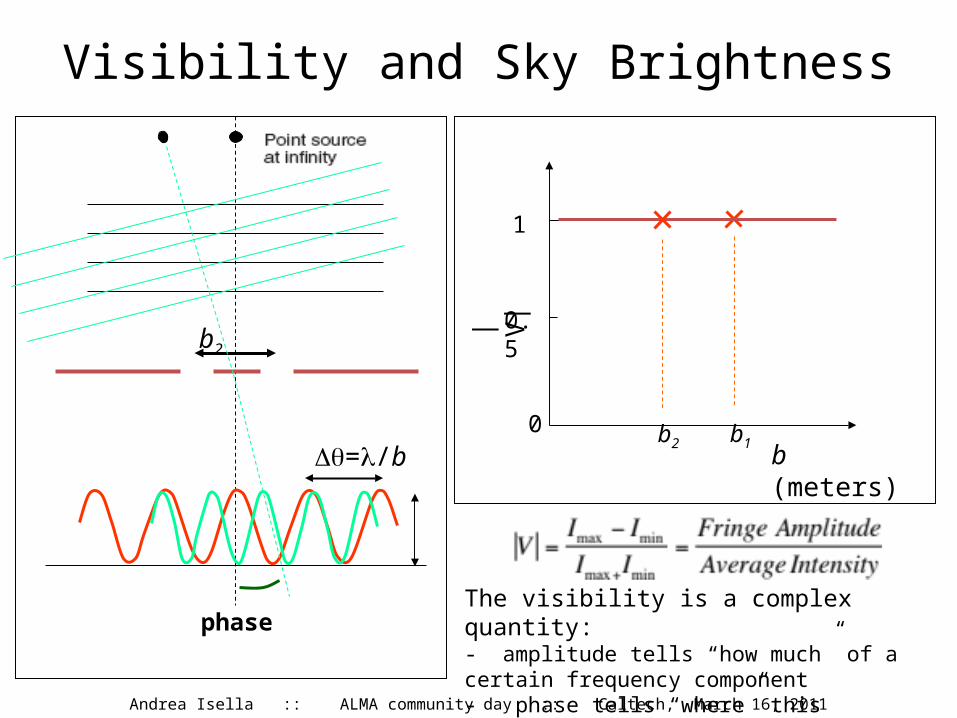
| V|
b (meters)0
0.5
1
b1
=/bb1b2
=/b
b2
phase
Visibility and Sky Brightness
The visibility is a complex quantity:- amplitude tells “how much” of a certain frequency component- phase tells “where” this component is located
Andrea Isella :: ALMA community day :: Caltech, March 16, 2011
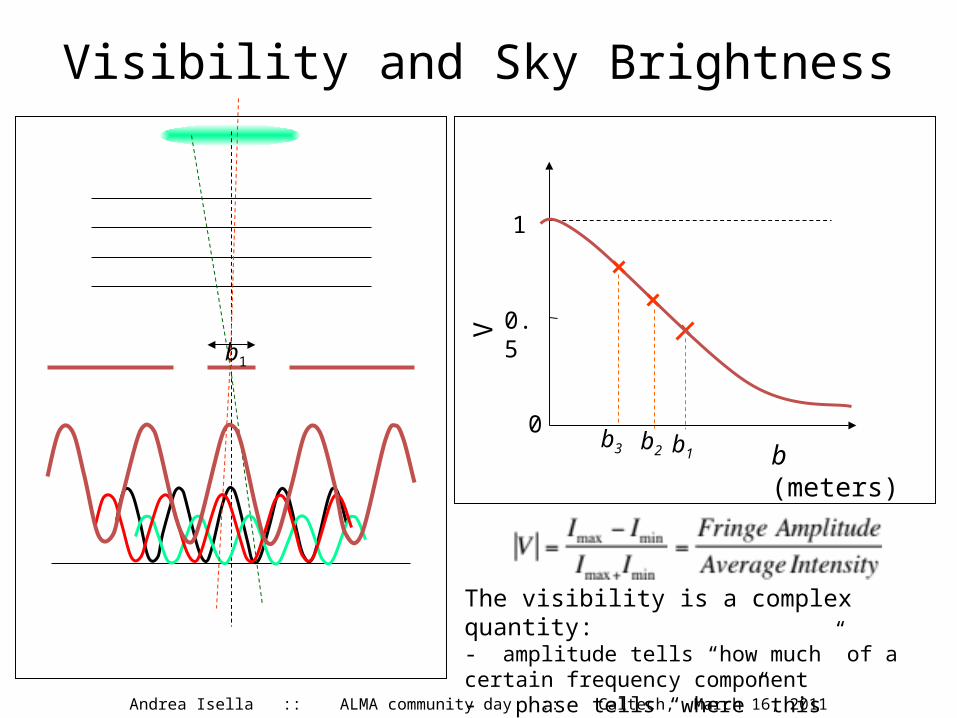
Vb (meters)
0
0.5
1
b1
b1
Visibility and Sky Brightness
b2b3
Andrea Isella :: ALMA community day :: Caltech, March 16, 2011
The visibility is a complex quantity:- amplitude tells “how much” of a certain frequency component- phase tells “where” this component is located

2 Antennas
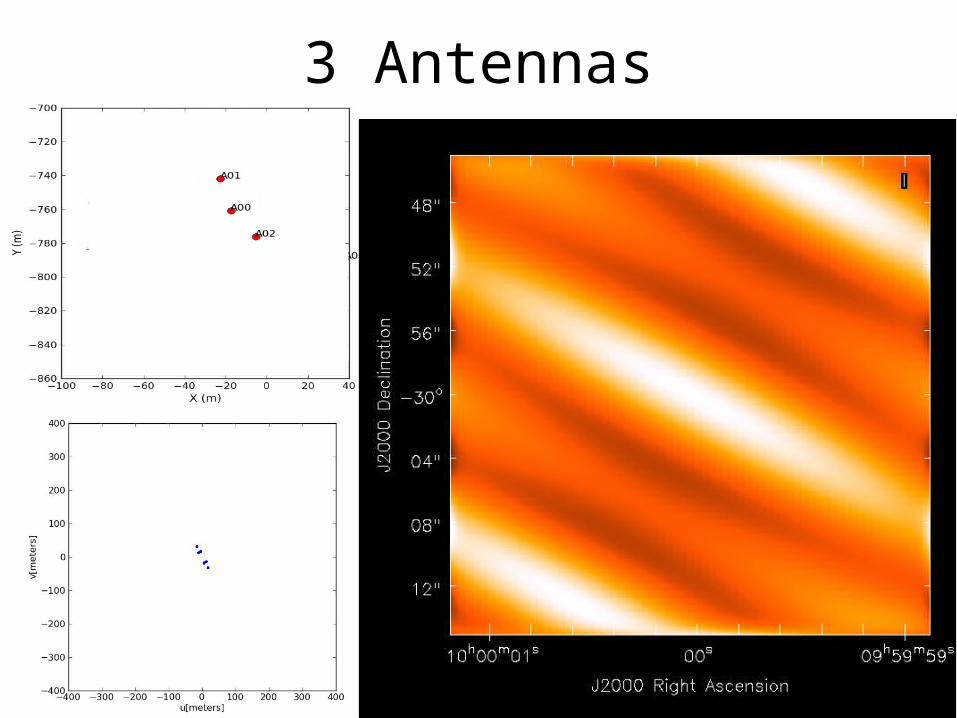
3 Antennas
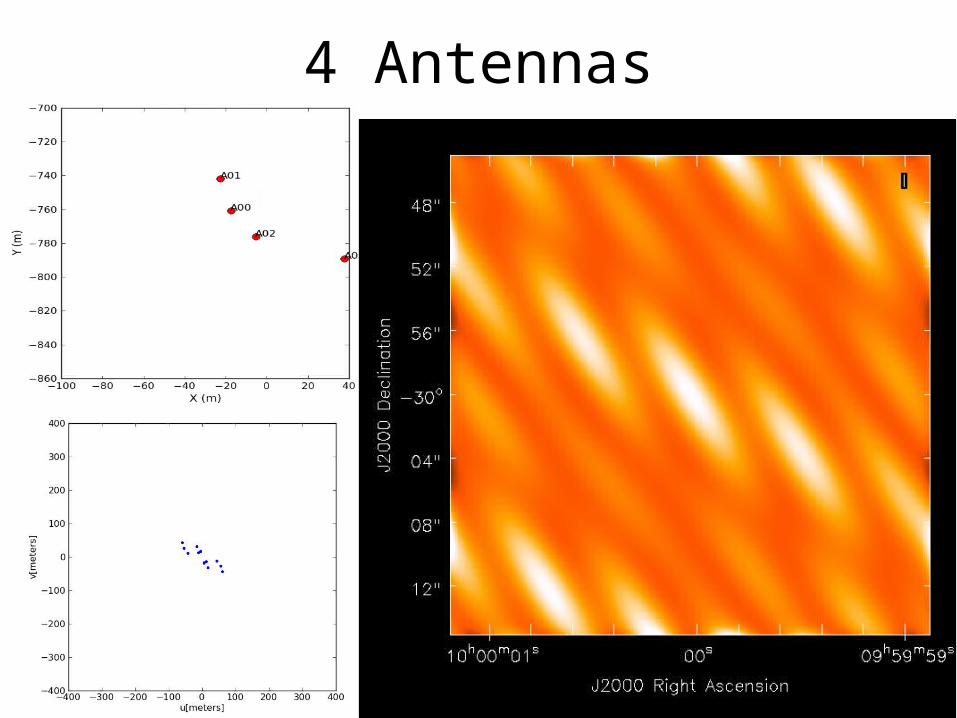
4 Antennas
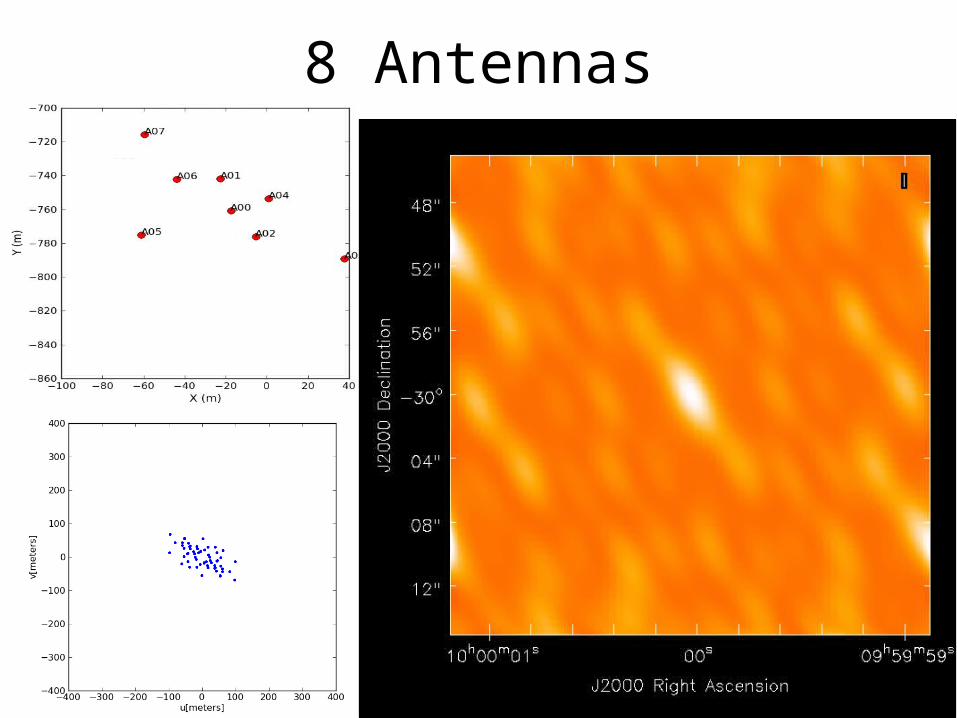
8 Antennas
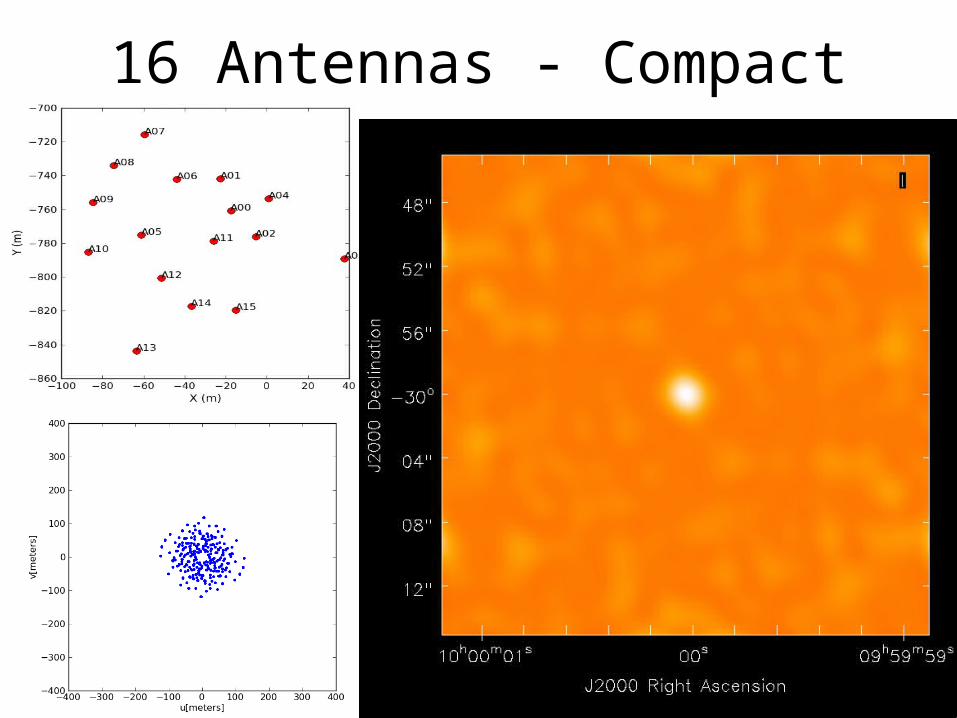
16 Antennas - Compact

16 Antennas - Extended
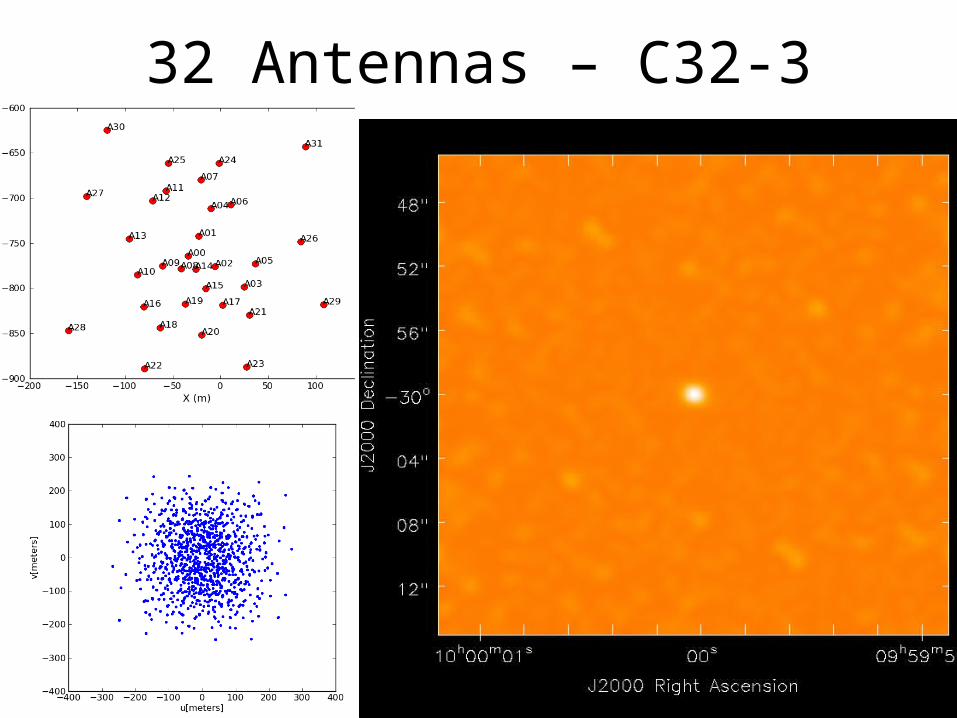
32 Antennas – C32-3
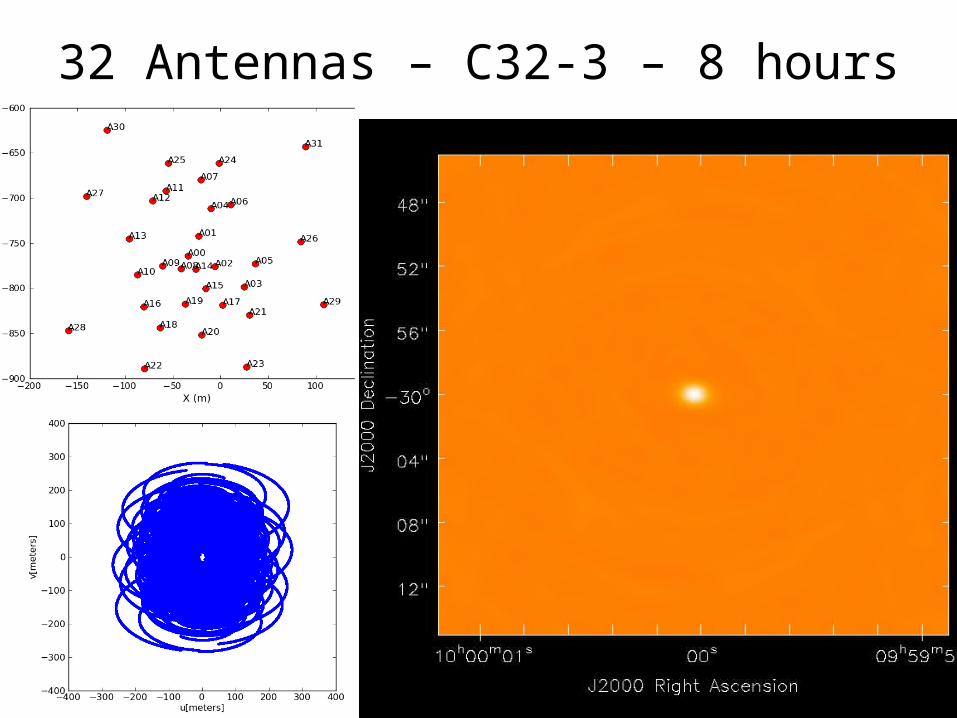
32 Antennas – C32-3 – 8 hours

T(x,y) |V(u,v)|
Gaussian
Function Constant
Gaussian
2D Fourier Transform Pairs
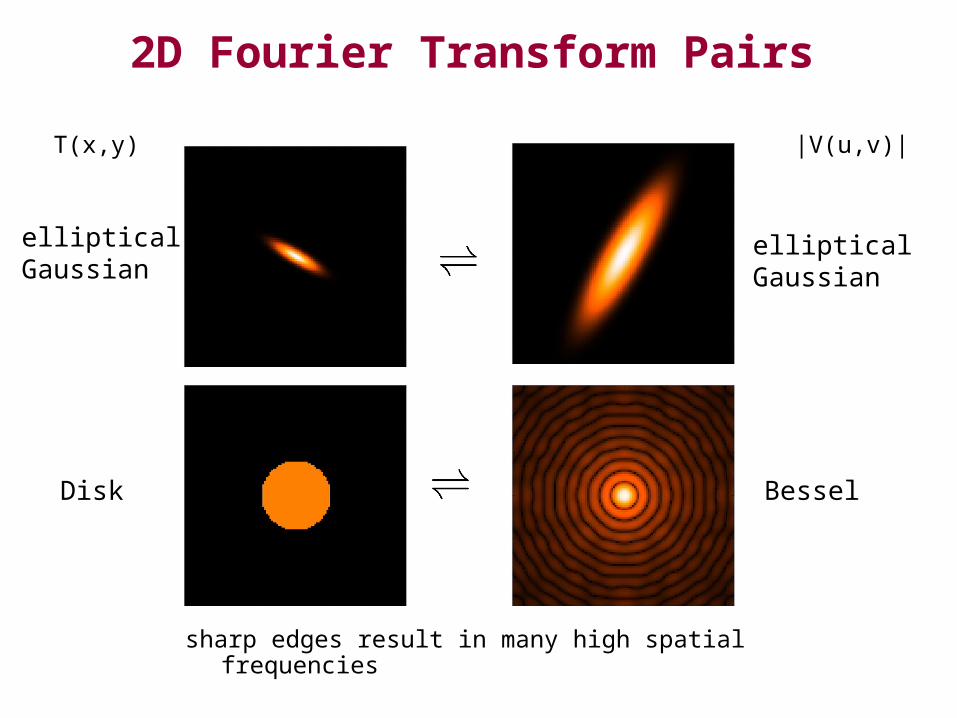
T(x,y) |V(u,v)|
ellipticalGaussian
sharp edges result in many high spatial frequencies
ellipticalGaussian
Disk Bessel
2D Fourier Transform Pairs
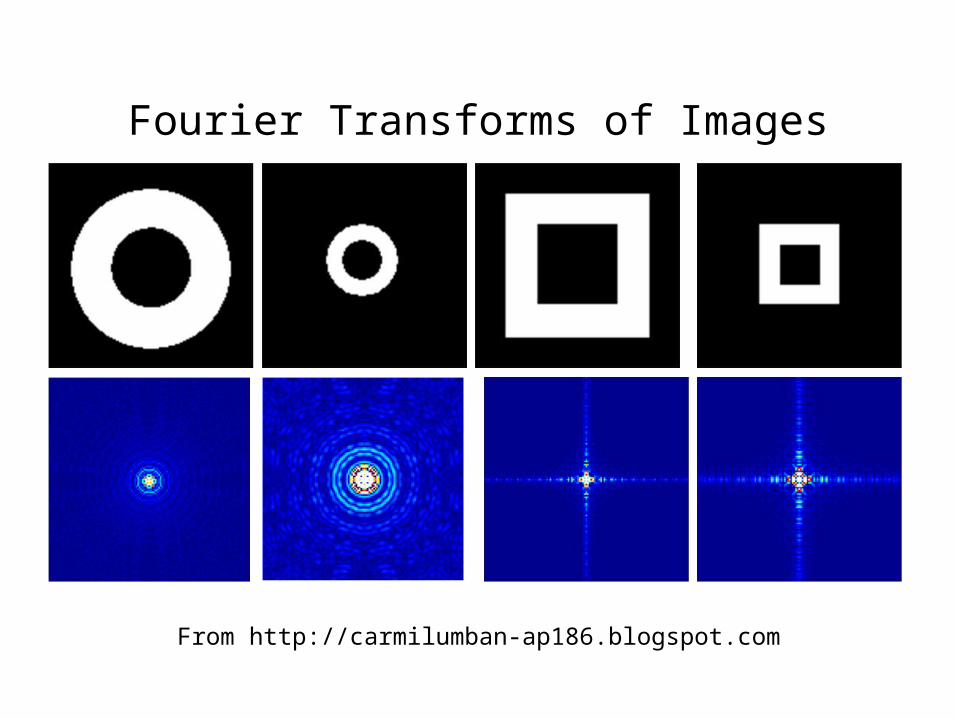
Fourier Transforms of Images
From http://carmilumban-ap186.blogspot.com
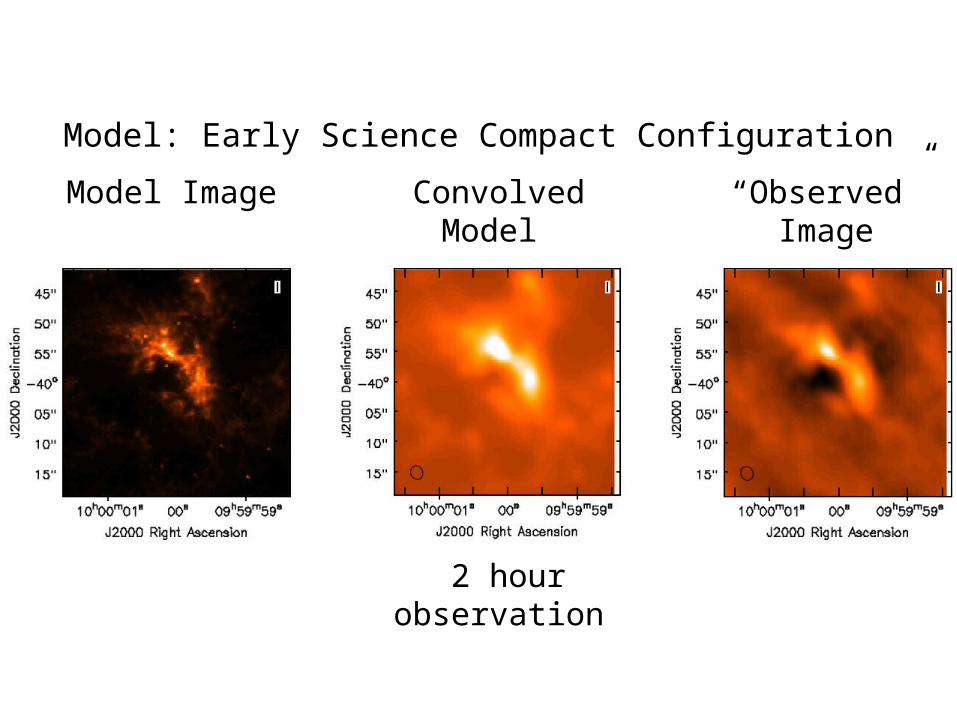
Model Image Convolved Model “Observed” Image
2 hour observation
Model: Early Science Compact Configuration
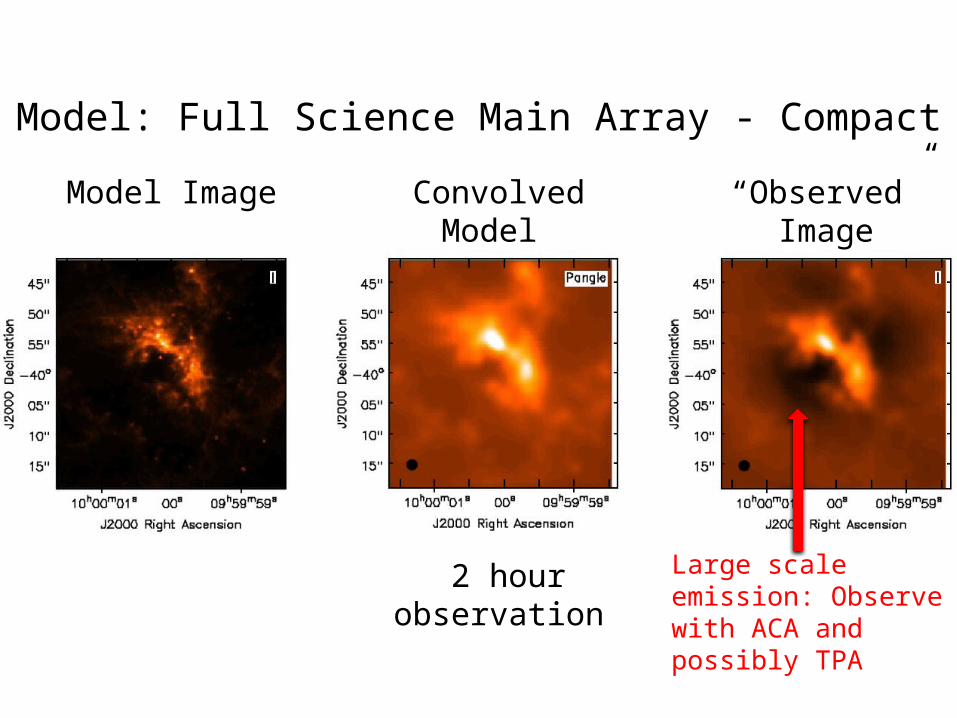
Model: Full Science Main Array - CompactModel Image Convolved Model “Observed” Image
2 hour observation Large scale emission: Observe with ACA and possibly TPA
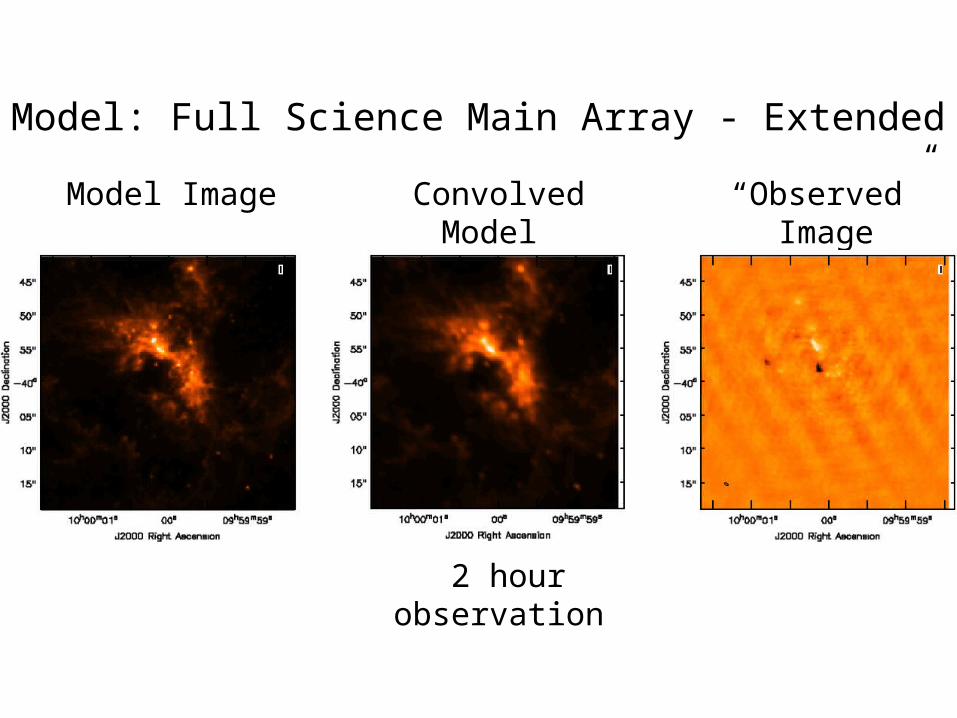
Model: Full Science Main Array - ExtendedModel Image Convolved Model “Observed” Image
2 hour observation
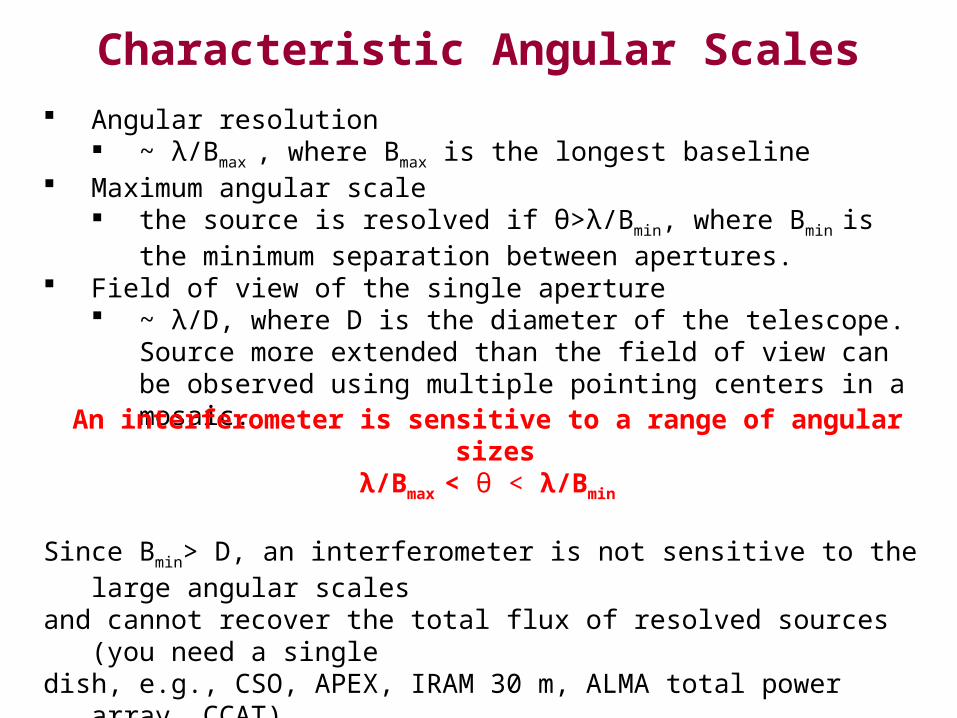
Angular resolution ~ λ/Bmax , where Bmax is the longest baseline
Maximum angular scale the source is resolved if θ>λ/Bmin, where Bmin is the minimum separation
between apertures. Field of view of the single aperture
~ λ/D, where D is the diameter of the telescope. Source more extended than the field of view can be observed using multiple pointing centers in a mosaic.
Characteristic Angular Scales
An interferometer is sensitive to a range of angular sizes λ/Bmax < θ < λ/Bmin
Since Bmin> D, an interferometer is not sensitive to the large angular scalesand cannot recover the total flux of resolved sources (you need a singledish, e.g., CSO, APEX, IRAM 30 m, ALMA total power array, CCAT).