interface engineering of garnet solid...
TRANSCRIPT

Interface Engineering of Garnet Solid Electrolytes
by
Lei Cheng
A dissertation submitted in partial satisfaction of the
requirement for the degree of
Doctor of Philosophy
in
Engineering – Materials Science and Engineering
in the
Graduate Division
of the
University of California, Berkeley
Committee in charge:
Professor Lutgard C. De Jonghe, Co-Chair
Dr. Marca M. Doeff, Co-Chair
Professor Mark D. Asta
Professor Bryan D. McCloskey
Summer 2015

1
Abstract
Interface Engineering of Garnet Solid Electrolytes
By
Lei Cheng
Doctor of Philosophy in Materials Science and Engineering
University of California, Berkeley
Professor Lutgard C. De Jonghe, Co-Chair
Dr. Marca M. Doeff, Co-Chair
Solid lithium ion conductors represent a promising class of materials for next generation
high energy density batteries, with the potential for enabling use of high capacity Li metal anodes
and providing opportunities for novel lithium-free cathode materials. However, highly resistive
interfaces stymie their practical use. This urgent scientific challenge requires mechanistic
understanding of ion transport at interfaces, as well as development of novel processes to achieve
low interfacial resistances.
The goal of this PhD dissertation was to generate fundamental understandings of garnet-
structured Al substituted Li7La3Zr2O12 (LLZO) electrolyte surfaces and interfaces with lithium
metal electrodes. Specifically in this research, the topmost surface microstructure, local chemical
environment, and surface chemistry were carefully studied. The ceramic processing of garnet is
discussed and ways to control the sintering behavior and microstructures were explored and
successfully demonstrated. Factors contributing to high interfacial resistance were systematically
studied. The source of the high interfacial impedance has been traced to the presence of Li2CO3
on pellet surfaces resulting from air exposure after processing. In addition, it was discovered that
surface grain boundaries are surprisingly fast ion transport pathways and surface microstructure is
critically important to lithium ion transport at interfaces. Complex homo- and heterostructured
LLZO solid electrolytes with controllable surface and bulk microstructures were successfully
fabricated, which allowed the comparison and separation of the contribution from the surface and
the bulk. Engineered pellet surfaces allowed us to achieve the lowest interfacial resistance ever
reported for this composition, resulting in significantly improved cycling behavior. Lastly, it was
found that LLZO surfaces can be effectively stabilized under air exposure conditions, preventing
Li2CO3 formation and maintaining low interfacial resistances. This opens new opportunities for
garnet solid electrolyte in practical applications.

i
Acknowledgements
First and foremost, I would like acknowledge my advisor, Prof. Lutgard De Jonghe, for
giving me the opportunity at Berkeley to pursue my research in solid state batteries and being a
great advisor. I wish to express my sincere gratitude for Dr. Marca Doeff, my research supervisor
at Lawrence Berkeley National Laboratory. This dissertation cannot have been realized without
her encouragement and support. In particular, I would like to thank her for giving me the freedom
in doing my research. I would also like to thank Dr. Michael Tucker, as mentor in the early stages
of my graduate career.
Thanks Dr. Guoying Chen, Dr. Thomas Richardson, and Prof. Jordi Cabana for being co-
PIs on the project and their kind guidance and mentorship. Thanks Prof. Mark Asta and Prof. Bryan
McCloskey for reading this for me and for very helpful conversations, encouragement and advice.
I owe much of the completion of this dissertation to numerous collaborations and
discussion with scientists, staff, post-docs and peer graduate students at UC Berkeley, Lawrence
Berkeley National Laboratory and other institutions. In particular, I would like acknowledge Dr.
Richard Russo, Dr. Vassilia Zorba, and Dr. Huaming Hou for LIBS analysis; Dr Apurva Mehta
and Dr. Ryan Davis for hard X-ray spectroscopy and grazing incident techniques; Dr. Ethan
Crumlin and Dr. Zhi Liu for APXPS; Dr. Nobumichi Tamura and Dr. Martin Kunz for micro-
diffraction; Dr. Simon Lux, Dr. Angelique Jarry, Dr. Jason Forster and Dr. Robert Kostecki for
Raman spectroscopy; Mr. Cheng Hao Wu and Prof Miquel Salmeron for XPS; Mr. Yifan Ye, Dr.
Ruimin Qiao, Dr. Wanli Yang and Dr. Jinghua Guo for soft X-ray absorption spectroscopy; Dr.
Wei Chen, Dr. Miao Liu and Dr. Kristin Persson for DFT theory computations.
I have also benefitted a lot from interactions with my awesome lab mates and colleagues
at Berkeley through all these years: Dr. Liying Zhang, Dr. Joong Sun Park, Dr. Feng Lin, Dr.
Mirko Herrmann, Prof. Mona Shirpour, Prof. Wan-Shick Hong, Dr. Tanghong Yi, Dr. Chunjoong
Kim, Dr. Saravanan Kuppan, Dr. Jun Liu, Dr. Bin Hai, Dr. Hannah Ray, Dr. Wen Yuan, Dr. Yiling
Dai, Dr. Hao Bai, Dr. Natascha Krins, Dr. Guojing Zhang, Dr. Nana Zhao, Mrs. Grace Lau, Mr.
Yuyi Li, Mr. James Wu and Mr. Isaac Markus.
I will be forever indebted to my family for their endless support.

ii
Preface
This dissertation comprises a summary based on the following papers, which are referred to in the
text.
1. Effect of Microstructure and Surface Impurity Segregation on the Electrical and
Electrochemical Properties of Dense Al-substituted Li7La3Zr2O12,
L. Cheng, J.S. Park, H. Hou, V. Zorba, G. Chen, T.J. Richardson, J. Cabana and M.
Doeff.
J. Mater. Chem. A 2014, 2, 172
2. The Origin of High Electrolyte Electrode Interfacial Resistance in Lithium Cells
Containing Garnet Type Solid Electrolyte,
L. Cheng, E.J. Crumlin, R. Qiao, W. Chen, H. Hou, S. Lux, V. Zorba, R. Russo, R.
Kostecki, Z. Liu, K. Persson, W. Yang, J. Cabana, T. Richardson, G. Chen and M. Doeff.
Phys. Chem. Chem. Phys. 2014, 16, 18294
3. Effect of Surface Microstructure on Electrochemical Performance of Garnet Solid
Electrolytes,
L. Cheng, W. Chen, M. Kunz, K. Persson, N. Tamura, G. Chen, M. Doeff.
ACS Applied Mater & Interfaces. 2015, 7, 2073
4. Interrelationships among Grain Size, Surface Composition, Air Stability and Interfacial
Resistance of Al-substituted Li7La3Zr2O12 Solid Electrolytes,
L. Cheng, W.H. Wu, A. Jarry, W. Chen, Y. Ye, J. Zhu, R. Kostecki, K. Persson, J. Guo,
M. Salmeron. G. Chen and M. Doeff,
ACS Applied Mater & Interfaces, submitted
Papers not included in this dissertation:
1. Effect of Crystallinity and Impurities on the Electrical Conductivity of Li-La-Zr-O Thin
Films,
J.S. Park, L. Cheng, V.Zorba, A. Mehta, J. Cabana, G. Chen, M. Doeff, J.H. Park, J.W.
Son, W. S. Hong,
Thin Solid Films, 2015, 576, 55
2. Effect of lithium borate addition on the physical and electrochemical properties of the
lithium ion conductor Li3.4Si0.4P0.6O4,
L. Zhang, L. Cheng, J. Cabana, G. Chen, M. Doeff, T. Richardson.
Solid State Ionics, 2013, 231,109
3. Three-Dimensional Elemental Imaging of Solid State Electrolytes Using fs-Laser
Induced Breakdown Spectroscopy (LIBS),
H. Hou, V. Zorba, L. Cheng, G. Chen, T. Richardson, M. Doeff, R. Zheng, R. Russo,
J. Anal. At. Spectrom, submitted

iii
4. Aluminum Migration during Deposition of Li7La3Zr2O12 Thin Films on Aluminum Oxide
Substrates
J. H. Park, W.S. Hong, J.S. Park, L. Cheng, J. Cabana, G. Chen, M. Doeff, Y. Li, T.
Richardson and J.W. Son,
ECS Trans 2013, 53, 1
5. Zero-Strain Perovskite Type Cathode Material AxK1-xFeF3 (A=Li, Na) for Li/Na Ion
Batteries ,
T. Yi, W. Chen, L. Cheng, E. Chan, J. Lee, F. Lin, D. Nordlund, M. Doeff, K. Persson
and J. Cabana,
in preparation
6. Glass-containing composite cathode contact materials for solid oxide fuel cells,
M. Tucker, L. Cheng, L. De Jonghe,
J. Power Sources 2011,196, 8435
7. Selection of cathode contact materials for solid oxide fuel cells,
M. Tucker, L. Cheng, L. De Jonghe
J. Power Sources, 2011, 196, 8313
8. Inorganic binder-containing composite cathode contact material for solid oxide fuel cells,
M. Tucker, L. Cheng, L. De Jonghe.
J. Power Sources, 2013, 224, 174
9. Integrated thermal management strategy and materials for solid oxide fuel cells,
M. Tucker, L. Cheng,
J. Power Sources, 2011, 196, 10074
10. Cathode contact materials for solid oxide fuel cells,
M. Tucker, L. Cheng, L. De Jonghe.
ECS Trans, 2011, 35, 2625
iv
Contents 1. Introduction ................................................................................................................................. 1
1.1 Solid State Batteries and Motivation .................................................................................... 1
1.2 Solid State Lithium Ionic Conductors................................................................................... 2
1.2.1 Perovskite solid ionic conductors .................................................................................. 2
1.2.2 NASICON and LISICON solid ionic conductors .......................................................... 3
1.2.3 Thio-LISICON solid ionic conductors........................................................................... 4
1.2.4 Amorphous inorganic solid ionic conductors ................................................................ 5
1.2.5 Garnet solid ionic conductors ........................................................................................ 5
1.2.6 Design principles of solid ionic conductors and the dilemma ....................................... 7
1.3 Fundamentals of Ionic Interfaces .......................................................................................... 8
1.4 Key Technical Problems of Garnet Solid Electrolyte and Scope of this Work .................. 10
2. Ceramic Processing of Garnet Solid Electrolytes ..................................................................... 14
2.1 Introduction ......................................................................................................................... 14
2.2 Experiments ........................................................................................................................ 15
2.3 Results and Discussion ....................................................................................................... 17
2.4 Conclusion .......................................................................................................................... 28
2.5 References ........................................................................................................................... 29
3. Origin of large interfacial resistance ......................................................................................... 31
3.1 Introduction ......................................................................................................................... 31
3.2 Experiments ........................................................................................................................ 32
3.3 Results and Discussion ....................................................................................................... 33
3.4 Conclusions ......................................................................................................................... 41
3.5 References ........................................................................................................................... 42
4. Surface grain-boundaries of LLZO ........................................................................................... 45
4.1 Introduction ......................................................................................................................... 45
4.2 Experiments ........................................................................................................................ 46
4.3 Results and Discussion ....................................................................................................... 47
4.4 Conclusion .......................................................................................................................... 58
4.5 References ........................................................................................................................... 59
5. Stabilization of LLZO surfaces exposed to air ......................................................................... 63
5.1 Introduction ......................................................................................................................... 63

v
5.2 Experiments ........................................................................................................................ 64
5.3 Computational ..................................................................................................................... 65
5.4 Results and Discussion ....................................................................................................... 65
5.5 Conclusions ......................................................................................................................... 74
5.6 References ........................................................................................................................... 75
6 Conclusions and Future work .................................................................................................... 77
6.1 Conclusions ......................................................................................................................... 78
6.2 Future work ......................................................................................................................... 77
6.2.1 Surface and Interface Engineering ............................................................................... 77
6.2.2 Tuning Chemical Stability ........................................................................................... 77

1
1. Introduction
1.1 Solid State Batteries and Motivation Rechargeable batteries are electrochemical devices that convert chemical energy into
electrical energy reversibly. Solid-state batteries are devices that integrate both solid electrodes
and solid electrolytes. A commercial lithium ion battery uses solid electrodes with electrolytic
solutions, which consist of a lithium salt dissolved in a mixture of organic solvents. Replacing the
electrolytic solution in the lithium ion battery with a solid electrolyte has the following advantages
for all solid-state batteries:
Greater safety because there are no combustible organic liquids
Higher energy density enabled by integration with high voltage, high capacity electrodes
in dense packaging
A wide range of compatible electrode materials including lithium metal as anode and
binary oxide as cathode.
Long cycle life and minimal self-discharge
Wider operating temperature window
Similar to lithium ion batteries, solid-state batteries work by shuttling lithium ion between
two electrodes. Upon discharging, lithium ions are removed from the negative electrode, leaving
lithium vacancies. Lithium carriers migrate from the negative electrode/electrolyte interface
through the bulk of electrolyte and then move across electrolyte/positive electrode interface, where
charge transfer occurs and lithium ions are incorporated into the positive electrode. At the same
time, electrons move through an external circuit and do electrical work. (Figure 1.1) For this
process to work, ionic transport in the solid electrolyte and through the interfaces are of critical
importance for the operation of a solid state battery.
Cathode Electrolyte Li metal
Li+
=
Current direction

2
Figure 1.1. Schematic diagram of a lithium solid-state battery in which lithium ions shuttle
between two electrodes during operation.
Generally, solid state lithium ionic conductors should meet the following requirements for
application in solid state batteries.
High lithium ionic conductivity at operating temperatures; room temperature is preferred
Negligible electronic conductivity
Low grain boundary resistances
Chemical and electrochemical stability against reactions with electrodes, such as Li metal
Low interfacial resistances with both electrode materials
These criteria turn out to be difficult to meet for many available material systems. Many
known materials have either high ionic conductivity or good chemical stability but not both.
Materials of potential use as solid electrolytes will be reviewed in the following section.
1.2 Solid State Lithium Ionic Conductors The solid electrolyte is the critical component in a solid-state battery. It can also be used
with liquid electrolyte in other configurations, such as a flow battery systems. Solid electrolyte can
be loosely categorized into three types: inorganic solid electrolytes, organic solid electrolytes and
organic composite solid electrolytes. The organic and organic composite solid electrolytes
generally consist of a polymer such as poly(ethylene oxide), a lithium salt and, optionally,
plasticizing agents (solvents) and solid fillers, such as ceramic powders. This section focus only
on the discussion of inorganic solid electrolytes.
1.2.1 Perovskite solid ionic conductors
The perovskite lithium lanthanum titanate Li3xLa(2/3)-x1/3-2xTiO3 (LLTO, stands for
vacancies) is one the most conductive solid inorganic electrolytes. Lithium ions conduct by moving
along A-site vacancies through the bottleneck between A sites. (Figure 1.2) Thus, the lithium
concentration is critical to the ionic conductivity. The optimum total lithium and vacancies
concentration been found to be x=0.11, which shows a high bulk ionic conductivity of 10-3 S/cm
at room temperature.1 The cubic structure shows slightly higher lithium ion conductivity than the
tetragonal polymorphs, due to ordering of lithium in the tetragonal structure. 2 However, there are
several key technical problems with this perovskite material. First, the densification of LLTO
requires a high sintering temperature which inevitably leads to lithium loss. 3 Another problem
associated with LLTO is that the grain boundaries block ionic transport. It should also be noted
that poor grain-boundary properties might also relates to lithium content loss. Polycrystalline
LLTO has a total ionic conductivity of 10-5 S/cm at room temperature, two orders of magnitude
lower than the bulk conductivity, due to chemical and structural deviations and impurity formation
at the grain boundaries. 4,5 Another issue is that Ti4+ may be reduced at interfaces with metallic Li,
causing an increase in the electronic conductivity, which is undesirable for solid electrolytes in
lithium metal batteries.

3
Figure 1.2. Idealized crystal structure of LLTO perovskite. The Li and La atoms are
distributed over A-sites, and are indicated by small and large spheres, respectively. The
polyhedra represent TiO6 units.
1.2.2 NASICON and LISICON solid ionic conductors
NASICON (sodium superionic conductors) have the general formula NaA2(BO4)3) (where
A is a metal such as Ti or Zr and B is Si or P. Na can be replaced by Li to form LISICONs for
lithium ion conductivity. NASICONs and LISICONS have covalent [A2(BO4)3]- frameworks,
containing AO6 octahedra and BO4 tetrahedral units, as shown in Figure 1.3.. The framework is
3D connected and has interstitial sites available for ion motion. The size of the framework
correlates to the nature of the A site atom and carrier concentration.6 By substitution of trivalent
cations, such as Al for the Ti4+ site in the octahedral sites, the lithium ion conductivity can be
greatly enhanced.7 . It has been reported that the grain boundary has an activation energy similar
to the grains. The grain and grain boundary resistances are identical, which suggests that the origin
of the grain boundary resistance is purely constriction of grain boundary area. 8 This further
implies that higher total conductivity can be achieved with smaller grain size or even amorphous
phases of LATP. An Al substituted NASICON, Li1+yAlyTi2-y(PO4)3 glass-ceramic has been
commercialized by Ohara Corporation. In addition, Imanishi et al. found that LATP is stable in
contact with aqueous lithium salt solutions. 9 ,10 Using the LATP glass-ceramic membrane to
protect the lithium anode directly enables the water based lithium batteries under development by
PolyPlus Battery Corporation. However, as with LLTO, when this material is in direct contact with
lithium metal, Ti4+ is reduced to Ti3+. Thus an interlayer between the lithium and glass-ceramic
LATP is required to prevent shorting.11 12

4
Figure 1.4. Crystal structure of LISICON Li2.72Ti2(PO4)3. TiO6 octahedra and PO4
tetrahedra units are depicted in pink and gray, respectively, and blue spheres represent Li ions.
1.2.3 Thio-LISICON solid ionic conductors
The Thio-LiSICON system was first discovered by Kanno and coworkers. 13 , 14
Replacement of oxygen by more polarizable sulfide ions in the framework improves the ionic
conductivity due to higher lithium ion mobility. A crystal structure is provided in Figure 1.3. As
an example, a room temperature ionic conductivity of 6.4×10⁻⁴ S/cm is reported for
Li3.4Si0.4P0.6S4 ,14 as compared to two orders lower conductivity (4.0×10⁻⁶S/cm) of its oxygen
counterpart Li3.4Si0.4P0.6O4.15 For this system, Ge as a dopant has also been widely explored. 16 A
record high ionic conductivity of 12 mS/cm at room temperature, even higher than commercially
electrolytic liquid, has been observed in Li10GeP2S12 system. The high conductivity is attributed
to its three-dimensional framework structure, allowing fast ion motion.17 It should be noted here
that, from a processing perspective, sulfide based system are easier to densify as the material is
ductile and high temperature densification is not necessary. In fact, Toyota has successfully
developed a demonstration solid battery system capable of 50C rate charging and discharging
using this solid electrolyte system. 18 However, this material system has to be prepared and
processed in protection atmosphere, e.g. Ar, as sulfides are highly air and moisture sensitive.

5
Figure 1.3. Crystal structure of thio-phosphate. Polyhedra represents PS4 tetrahedral units
and the small and large spheres represent sulfide ions and lithium ions respectively.
1.2.4 Amorphous inorganic solid ionic conductors
LIPON was first reported by Bates et al. 19 It is prepared by sputtering Li3PO4 in a N2
atmosphere. It can be described as a lithium deficient glass with nominal composition of
Li2.88PO3.73N0.14. The ionic conductivity is 3.3×10⁻⁶ S/cm at room temperature and has been used
in thin film solid state battery configurations. Dudney and co-workers has demonstrated a long life
thin film solid state battery with minimum capacity loss after 10000 cycles. 20 Although it is
generally accepted that LIPON is chemically stable with Li metal electrodes, Schwobel et al.
reported chemical instability of LIPON with evaporated lithium, indicating decomposition into
smaller units of Li3P, Li3N, Li2O and Li3PO4. 21 Bubbling has also been observed during cycling
of LIPON, indicating possible gas phase formation electrochemically. 22 Despite of LIPON
instability, other technical difficulty includes fabrication of thin films less than 10 µm thickness
(Area specific resistance less than 30 Ω cm2). Successful demonstration has only be validated using
RF sputtering process.
1.2.5 Garnet solid ionic conductors
Garnet structures have a general chemical formula of A3B2(XO4)3, where A, B and X are
eight, six and four oxygen-coordinated sites. Highly Li-staffed garnet contains more than three
lithium per formula, e.g. Li7La3Zr2O12 and Li5La3Ta2O12. They most commonly crystallize in face
centered cubic structures (space group Ia3d) but tetragonal polymorphs are also known. Weppner
and co-workers were the first to explore garnet lithium ionic conductors.23,24,25,26 The early work
focused on chemical compositions of Li5La3M2O12 (M=Ta, Nb) and doped compositions of
Li6ALa2M2O12 (A=Ca, Sr, Ba). The highest conductivity of these phases is in the range of 10-5
S/cm at room temperature, which is not sufficiently high for battery applications. In 2007, the
cubic garnet Li7La3Zr2O12 (LLZO) was successfully synthesized by Murugan et al., which has
lithium ionic conductivity of about 10-4 S/cm at room temperature.27 LLZO is considered a
promising solid electrolyte as it is highly conductive, yet appears to be stable against reduction by
lithium metal, even when in direct contact with molten or evaporated lithium. Two polymorphs of
LLZO have been described. The cubic phase is reported to have an ionic conductivity two orders

6
of magnitude higher than that of the tetragonal phase. 28 (See Figure 1.5.) High temperature
synthesis (above about 1000C) and the presence of small amounts of Al are generally required to
form the more conductive cubic LLZO phase.4,29,30,31,32 However, there have been several reports
of Al-free cubic LLZO produced at lower temperatures. For example, cubic LLZO has been
produced by sol-gel synthesis at 700C.33, 34 One possibility is that these high temperature cubic
phases reported earlier actually contained Al inadvertently incorporated from crucibles or furnace
linings during calcination. When Al is deliberately added during synthesis, smaller cell parameters
are observed 6, 9 because of the substitution of the smaller Al3+ for Li+ .35, 36 There are, however,
limits to the solubility of Al3+ in this phase. As reported by Rangasamy et al., a LaAlO3 impurity
formed when the Al content in LLZO was high, and La2Zr2O7 coexisted with cubic LLZO when
the Li content was low. 8 Düvel et al. 37 adopted a low-temperature mechanosynthesis method and
reported that for values up to x=0.4 in Li7-3xAlxLa3Zr2O12, the products were pure cubic phase, but
when x > 0.60, impurity phases formed. Based on these observations, there is an optimum
compositional range of about 0.19 x 0.4 for the Al content and the lattice parameter may be
used as an indication of Al incorporation and Li loss during high temperature annealing.
Figure 1.5. Crystal structure of cubic garnet LLZO. ZrO6 octahedra are shown in gray
and LaO8 units in pink. Blue spheres represent lithium ions.
Poor electrode/electrolyte contact, slow charge transfer, and sluggish carrier transport in
the interfacial region all can increase interfacial resistance. Buschmann et al. 38 reported an area
specific interfacial resistance (ASR) of 2800 Ω∙cm2 for cells containing LLZO substituted with 0.9
wt% Al, and an ASR close to 6000 Ω∙cm2 was observed for a Ga-substituted LLZO/Li interface.39
Attempts to decrease interfacial resistance by applying high external pressure to improve physical
contact have been partially successful for some systems: Liang’s group reported low interfacial
resistance (100-200 Ω∙cm2) by directly compacting a LLZO/Li3PS4 composite electrolyte powder
onto soft lithium foil using 300MPa pressure.40 ,41 The decrease in interfacial resistance was
attributable to the large effective contacting area and good physical adhesion. Low interfacial
resistances have also been achieved by pressing lithium foil onto densified Nb and Ta substituted
LLZO using 150MPa pressure.42,43 Another proposed strategy to lower interfacial resistance has
been to tune the chemical composition of LLZO. Early work by Thangadurai and Weppner showed

7
that the garnet-type Li6ALa2Ta2O12 (A=Sr, Ba) had minimal electrolyte-electrode interfacial
resistance in lithium cells.44 However, these phases are less promising than LLZO given their
much lower room temperature conductivities of 10-5 -10-6 S/cm. Buschmann et al. demonstrated
that LLZO co-substituted by optimal amounts of Ta and Al can achieve an order of magnitude
lower interfacial resistance than the Al substituted counterparts.45
1.2.6 Design principles of solid ionic conductors and the dilemma
From the above short review of several lithium ion conductor systems, some general design
principles for solid ionic conductors can be proposed. In an ideally simplified case, the ionic
conductivity is a product of charge carrier concentration, charge carrier mobility, and net charge
of each carrier ion. Thus, factors important for a lithium ionic conductor are as follows:
Concentration of charge carrier, i.e., Li ions.
Structure of the immobile framework.
Polarizability and bonding character of host atoms in the framework
A good lithium ionic conductor, take thio-LISICON as an example, should have a large
concentration of charge carriers. The immobile frame structure of thio-LISICONs provides many
channels for ion motion. The polarizable S is weakly bonded with Li, compared to O in LISICONs,
which allows the lithium ions to disassociate more easily. These requirements, on the other hand,
imply that a compound with high lithium ion mobility might be less chemically stable, given the
mobile lithium and weak chemical bonds. This creates the dilemma in choosing either materials
with high ionic conductivity but low stability, or materials with high stability but low ionic
conductivity. Table 1.1 lists several solid electrolyte and critical issues when employed in solid-
state lithium batteries. The development of LLZO, using large and rigid poly-anion frameworks
with low diffusivity hosts (Zr, La), enables both high lithium ion conductivity and good chemical
stability. However, the interface remained a major problem for the garnet LLZO and other analogs.
Solid electrolyte Conductivity at
25ºC (S/cm)
Critical Issues used in solid state batteries
Li7La3Zr2O12 3×10⁻⁴ High temperature processing required,
Li2CO3 formation under air exposure
Li1.3Al0.3Ti1.7(PO4)3 1.3×10⁻³ Unstable with Li metal due to Ti4+
reduction, de-sintering
Li0.34La0.51TiO2.94 1.4×10⁻³ Unstable with Li metal due to Ti4+
reduction, difficulty in controlling lithium
stoichiometry
Li2.88PO3.73N0.14 3.3×10⁻⁶ Low conductivity at 25ºC, prepared by
sputtering in thin film battery
Li3.4Si0.4P0.6O4 4.3×10⁻⁶ Low conductivity at 25ºC
Li10GeP2S12 1.2×10⁻² Chemical instability with Li and common
oxide cathodes
70Li2S-30P2S5 1.6×10⁻⁴ Electrochemical cycling instability, air and
moisture sensitivity.
Li1.5Al0.5Ge1.5(PO4)3 4.0×10⁻⁴ Chemical instability due to Ge4+ reduction

8
Table 1.1 Conductivity at 25ºC and issues of selected solid-state lithium ion conductors
1.3 Fundamentals of Ionic Interfaces In any electrochemical system, the interfaces between the ionically conductive electrolyte
and mixed conducting electrodes are critically important for good performance. These interfaces,
are analogous to semiconductor junctions. The major difference is that, in addition to electronic
species (electron), the defect chemistry-equilibrium of ionic species should be also considered
across the interface, where redistribution of charge carriers occurs.
To discuss the fundamentals of the ionic interfaces, a dominantly ionic conductor as
electrolyte and a dominantly electronic conductor as electrodes are considered. When the two
materials are put in contact, redistribution of mobiles species will have to occur from the phase of
higher electrochemical potential to the one of lower electrochemical potential. Similar to a P-N
junction, this process will continue until the transport of the mobile charge carriers is cancelled
out by the built up of a space-charge potential. At equilibrium, the ion distribution flux is canceled
out and can be expressed below 46:
−𝐷𝑖
𝜕𝐶𝑖
𝜕𝑥−
𝜎𝑖
𝑧𝑞
𝜕𝜑
𝜕𝑥= 0 (1)
where, Di, σ, z, c, φ and q are the diffusion coefficient, conductivity, net charge number, charge
carrier concentration, potential and elementary charge. The conductivity can be expressed by the
product of the concentration and diffusion coefficient of charge carriers:
𝜎𝑖 =𝐶𝑖𝑞2𝑧𝑖𝐷𝑖
𝑘𝑇 (2)
where, k is the Boltzmann constant. Thus, the space charge potential might be expressed in the
following way:
𝜕𝜑
𝜕𝑥= −
𝑘𝑇
𝑞
𝜕𝑙𝑛𝐶𝑖
𝜕𝑥 (3)
The dependence of the space charge potential is the logarithm of the charge carrier
concentration, which is a result of charge redistribution. A schematic is shown in Figure 1.6
Figure 1.6. (a) chemical energy levels of neutral lithium, electrons and lithium ions with
electrostatic energy of the electrode and electrolyte before contacting; (b) chemical energies of
Electrodes Electrolyte Electrodes Electrolyte(a) (b)

9
neutral lithium, electrons and lithium ions with electrostatic energy after electrode and electrolyte
are brought in contact.
It should be noted that for ionic junctions, the width of the space charge region is orders of
magnitude lower than in the case of semiconductors and liquid electrolytes, due to high charge
carrier concentrations in ionic carriers. Generally, the width of space charge region can be
expressed by the Debye length, LD:
𝐿𝐷2 =
𝜀0𝜀𝑘𝑇
𝐶𝑞2 (4)
where ε and ε0 are the materials dielectric constant and vacuum dielectric constant, respectively.
The electrochemical potential of mobile Li species (𝜇𝑒𝐿𝑖+) at the interface region and in the
bulk of solid electrolyte are defined in equations 5 and 6.
𝜇𝑒𝐿𝑖+(𝑖𝑛𝑡𝑒𝑟𝑓𝑎𝑐𝑒) = 𝜇𝐿𝑖+° + 𝑘𝑇𝑙𝑛𝐶𝐿𝑖+(𝑖𝑛𝑡𝑒𝑟𝑓𝑎𝑐𝑒) + 𝑧𝑞𝜑(𝑖𝑛𝑡𝑒𝑟𝑓𝑎𝑐𝑒) (5)
𝜇𝑒𝐿𝑖+(𝑏𝑢𝑙𝑘) = 𝜇𝐿𝑖+° + 𝑘𝑇𝑙𝑛𝐶𝐿𝑖+(𝑏𝑢𝑙𝑘) + 𝑧𝑞𝜑(𝑏𝑢𝑙𝑘) (6)
The equilibrium of mobile Li at the interface region and in the bulk of the solid electrolyte
can be expressed in this way.
𝜇𝑒𝐿𝑖+(𝑖𝑛𝑡𝑒𝑟𝑓𝑎𝑐𝑒) = 𝜇𝑒𝐿𝑖+(𝑏𝑢𝑙𝑘) (7)
𝑘𝑇𝑙𝑛𝐶𝐿𝑖+(𝑏𝑢𝑙𝑘) + 𝑧𝑞𝜑(𝑏𝑢𝑙𝑘) = 𝑘𝑇𝑙𝑛𝐶𝑒𝐿𝑖+(𝑖𝑛𝑡𝑒𝑟𝑓𝑎𝑐𝑒) + 𝑧𝑞𝜑(𝑖𝑛𝑡𝑒𝑟𝑓𝑎𝑐𝑒) (8)
Thus we have
𝐶𝐿𝑖+(𝑖𝑛𝑡𝑒𝑟𝑓𝑎𝑐𝑒)
𝐶𝐿𝑖+(𝑏𝑢𝑙𝑘)= exp [−
𝑧𝑞(𝜑(𝑖𝑛𝑡𝑒𝑟𝑓𝑎𝑐𝑒) − 𝜑(𝑏𝑢𝑙𝑘))
𝑘𝑇] (9)
As a result of the charge carrier re-distribution in the space charge region of a lithium ion
conductor, a layer relatively deficient in Li ions is created on the electrolyte side and electrons are
depleted on the electrode side. (Equation 9 and Figure 1.7.) In lithium ion conductors, lithium is
deficient at the interface and the potential is positive. Unlike semiconductor P-N junctions, where
the charge separation occurs by sweeping positive holes and negative electrons to both ends of the
junction, charge separation is realized in ionic junctions by moving mass (Li ions in this case)
across the interface and electrons through external circuits. The difficulty of charge transport
across the depleted region gives rise to interfacial resistance.
10
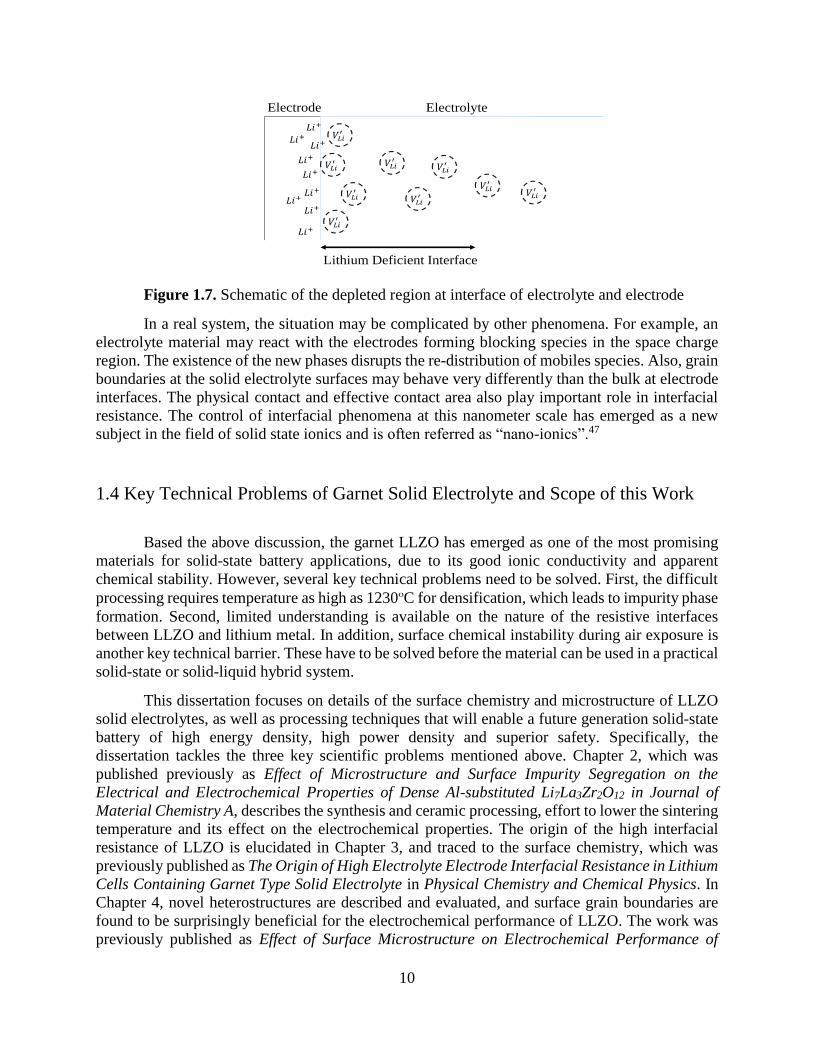
Figure 1.7. Schematic of the depleted region at interface of electrolyte and electrode
In a real system, the situation may be complicated by other phenomena. For example, an
electrolyte material may react with the electrodes forming blocking species in the space charge
region. The existence of the new phases disrupts the re-distribution of mobiles species. Also, grain
boundaries at the solid electrolyte surfaces may behave very differently than the bulk at electrode
interfaces. The physical contact and effective contact area also play important role in interfacial
resistance. The control of interfacial phenomena at this nanometer scale has emerged as a new
subject in the field of solid state ionics and is often referred as “nano-ionics”.47
1.4 Key Technical Problems of Garnet Solid Electrolyte and Scope of this Work
Based the above discussion, the garnet LLZO has emerged as one of the most promising
materials for solid-state battery applications, due to its good ionic conductivity and apparent
chemical stability. However, several key technical problems need to be solved. First, the difficult
processing requires temperature as high as 1230ºC for densification, which leads to impurity phase
formation. Second, limited understanding is available on the nature of the resistive interfaces
between LLZO and lithium metal. In addition, surface chemical instability during air exposure is
another key technical barrier. These have to be solved before the material can be used in a practical
solid-state or solid-liquid hybrid system.
This dissertation focuses on details of the surface chemistry and microstructure of LLZO
solid electrolytes, as well as processing techniques that will enable a future generation solid-state
battery of high energy density, high power density and superior safety. Specifically, the
dissertation tackles the three key scientific problems mentioned above. Chapter 2, which was
published previously as Effect of Microstructure and Surface Impurity Segregation on the
Electrical and Electrochemical Properties of Dense Al-substituted Li7La3Zr2O12 in Journal of
Material Chemistry A, describes the synthesis and ceramic processing, effort to lower the sintering
temperature and its effect on the electrochemical properties. The origin of the high interfacial
resistance of LLZO is elucidated in Chapter 3, and traced to the surface chemistry, which was
previously published as The Origin of High Electrolyte Electrode Interfacial Resistance in Lithium
Cells Containing Garnet Type Solid Electrolyte in Physical Chemistry and Chemical Physics. In
Chapter 4, novel heterostructures are described and evaluated, and surface grain boundaries are
found to be surprisingly beneficial for the electrochemical performance of LLZO. The work was
previously published as Effect of Surface Microstructure on Electrochemical Performance of
Electrode Electrolyte
Lithium Deficient Interface

11
Garnet Solid Electrolytes in ACS Applied Materials and Interfaces. Chapter 5 focuses on
engineering the surface chemical stability by grain size engineering. Various surface sensitive
techniques, including synchrotron X-ray spectroscopies, with probing depth from the topmost 1-2
nm to the 1-2 μm were used and discussed throughout this work. The work has been submitted to
ACS Applied Materials and Interfaces.
1.5 Reference
1. S. Stramare, V. Thangadurai, W. Weppner, Chem. Mater. 2003, 15, 3974.
2. V. Thangadurai, W. Weppner, Ionics, 2006, 12, 81-92.
3. P. Kanuth, Solid State Ionics, 2009, 180, 911-916.
4. F. Aguesse, J. Lopez del Amo, V. Roddatis, A. Aguadero, J. A. Kilner, Adv. Mater. Interface,
2014, 7, 1300143.
5. C. Ma, K. Chen, C. Liang, C. Nan, R. Ishikawa, K. More, M. Chi, Energy. Environ. Sci, 2014,
7, 1638-1642.
6. V. Thanadurai, W. Weppner, Ionics, 2002, 8, 281.
7. H. Aomo, E. Sugimoto, Y. Sadaoka, G. Adachi, J. Electrochem. Soc, 1989, 136, 540.
8. C.R. Mariappan, M.Gellert, C. Yada, F. Rosciano, B. Roling, Electrochem. Comm. 2012, 14,
25-28.
9. N. Imanishi, S. Hasegawa, T. Zhang, A. Hirano, Y. Takeda, O Yamamoto, J. Power Sources,
2008, 185, 1392.
10. S. Hasegawa, N. Imanishi, T. Zhang, J. Xie, A. Hirano, Y. Takeda, O. Yamanoto, J. Power
Sources, 2008, 189, 371.
11. P. Hartmann, T. Leichtweiss, M.R. Busche, M. Schneider, M. Reich, J. Sann, P. Adelhulm J.
Janek, J. Phys. Chem. C, 2013, 117, 21064.
12. M. Y Chu, S. Visco, L.C De Jonghe, U.S. Patent No. 6402795, 2004.
13. R. Kanno, T. Hata, Y. Kawamoto, M. Irie, Solid State Ionics, 200, 130, 97.
14. M. Murayama, R. Kanno, M. Irie, S. Ito, T. Hata, N. Sonoyama, Y kawamoto, J. Solid State.
Chem. 2002, 168, 140.
15. L. Zhang, L. Cheng, J. Cabana, G. Chen, M. M. Doeff, T.J. Richardson, Solid State Ionics,
2013, 231, 109-115.

12
16. T. Kobayashi, T. Inada, N. Sonoyama, A. Yamada, R. Kanno, in: P. Knauth, C. masquelier,
E. Traversa, E. Wachsman (Eds.), Solid State Ionics, Vol. 2004, MRS, Boston, 2005, pp. 333-
345.
17. N. Kamaya, K. Homma, Y. Yamakawa, M. Hirayama, R. Kanno, M. Yonemura, T.
Kamiyama, Y. Kato, S. Hama, K, Kawamoto, A. Mitsui, Nature Mater. 2011, 10, 682-686.
18. D. Yada, D. Brasse, ATZelektronik worldwide, 2014, 9, 10-15.
19. J.B Bates, N.J Dudney, G.R. Gruzalski, R.A.Zuhr, Solid State Ionics, 1991, 53-56, 647.
20. J. Li, C. Ma, M. Chi, C. Liang, N.J. Dudney, Adv. Energy. Mater. 2015, 5, 1401408.
21. A. Schowobel, R. Hausbrand, W. Jaegerm, Solid State Ionics, 2014, In press
22. D. Ruzmetov, V. P Oleshko, P.M Haney, H. J Lezec, K. Karki, K. H. Baloch, A.K. Agrawal,
A. V. Davydov, S. Krylyuk, Y. Liu, J.Y. Huang, M. Tanase, J. Cumings, A.A. Talin, Nano Lett,
2012, 12, 505-511.
23. V. Thangadurai, H. Kaack, W. Weppner, J. Am. Ceram. Soc. 2003, 86, 437.
24. V. Thangadurai. W. Weppner, J. Am. Ceram. Soc. 2005, 88, 411.
25. V. Thangadurai. W. Weppner, Adv. Mater. 20005, 15, 107.
26. V. Thangadurai. W. Weppner, Chem. Mater. 2004, 16, 2998.
27. R. Murugan, V, Thangadurai and W. Weppner. Angew. Chem. 2007, 119, 7925.
28. J. Awaka, N. Kijima, H. Hayakawa and J. Akimoto, J. Solid State Chem., 2009, 182, 2360.
29. C.A Geiger, E. Alekseev, B. Lazic, M. Fish, T. Armbruster, R. Langner, M. Fechtelkord,
N.Kim, T. Pettke and W. Weppner, Inorg. Chem., 2011, 50, 1089.
30. Y. Shimonshi, A. Toda, T. Zhang, A. Hirano, N. Imanishi, O. Yamamoto and Y. Takeda,
Solid State Ionics, 2011, 183 ,48.
31. E. Rangasamy, J. Wolfenstine and J. Sakamoto, Solid State Ionics, 2012, 206, 28.
32. H. Buschmann, J. Dolle, S. Berendts, A. Kuhn, P. Bottke, M. Wilkening, P. Heitjans, A.
Senyshyn, H. Ehrenberg, A. Lotnyk, V. Duppel, L. Kienle and J. Janek, Phys. Chem. Chem.
Phys., 2011, 13, 19378.
33. H. Xie, J.A. Alonso, Y. Li, M.T Fernandez-Diaz and J.B. Goodenough, Chem.Mater., 2011,
23, 3587.
34. I. Kokal, M. Somer, P.H.L Notten and H.T. Hintzen, Solid State Ionics, 2011, 185, 42.
35 H. Buschmann, S. Berendts, B. Mogwits and J. Janek, J. Power Sources, 2012, 206, 236.

13
36. A. A. Hubaud, D. J. Schroeder, B.Key, B. J. Ingram, F. Dogan and J. T. Vaughey, J. Mater
Chem A, 2013, 1, 8813.
37. A. Düvel, A. Kuhn, L. Robben, M. Wilkening and P. Heitjans, J. Phys. Chem. C, 2012, 116,
15192.
38. H. Buschmann, J. Dolle, S. Berendts, A. Kuhn, P. Bottke, M. Wilkening, P. Heitjans, A.
Senyshyn, H. Ehrenberg, A. Lotnyk, V. Duppel, L. Kienle and J. Janek, Phys. Chem. Chem.
Phys., 2011, 13, 19378.
39. H. E. Shinawi and J. Janek, J. Power Sources, 2013, 225, 13.
40. E. Rangasamy, G. Sahu, J. Keum, A. Rondinone, N. Dudney and C. Liang, J. Mater. Chem.
A., 2014, 2, 4111
41. Z. Liu, W. Fu, A. Payzant, X. Yu, Z. Wu, N. Dudney, J. Kiggans, K. Hong, A. Rondinone
and C. Liang, J. Am. Chem. Soc., 2013, 135, 975
42. K. Ishiguro, Y. Nakata, M. Matsui, I Uechi, Y. Takeda, O. Yamamoto and N. Imanishi, J.
Electrochem. Soc.,2013, 160, A1690
43. K. Ishiguruo, H. Nemori, S. Sunahiro, Y. Nakata, R. Sudo, M. Matsui, Y. Takeda,
O.Yamamoto and N. Imanishi, J. Electrochem. Soc., 2014, 161, A668
44. V. Thangadurai and W. Weppner, Adv. Fun. Mat, 2005, 15, 107
45. H. Buschmann, S. Berendts, B. Mogwitz, J. Janek, J. Power Sources, 2012, 206, 236
46. W. Weppner, Ionics, 2001, 7, 404.
47. S. Yamatuchi, Sci.Technol. Adv. Mater, 2007, 8, 503.

14
2. Ceramic Processing of Garnet Solid Electrolytes
2.1 Introduction One important challenge to the development of rechargeable batteries for large format
applications such as electric vehicles is to increase their practical energy density. Successful use
of lithium metal as the negative electrode would enable a very high energy density device,
especially when coupled with a high capacity positive electrode such as air or sulfur.1,2 There are,
however, serious safety concerns due to the extreme reactivity of metallic lithium with most liquid
electrolyte solutions. The use of a solid electrolyte is considered one way to enable a metallic
lithium electrode, provided that the criteria of high conductivity and chemical stability are met.
Among the ceramic electrolytes that have been studied, the garnet Li7La3Zr2O12 (LLZO) is
promising due to its fast ion transport (conductivity>10-4S/cm at room temperature)3 and purported
good chemical stability against metallic lithium.4 Two polymorphs of this material have been
described. The cubic phase is reported to have an ionic conductivity two orders of magnitude
higher than that of the tetragonal phase. 5 High temperature synthesis (above about 1000C) and
the presence of small amounts of Al are generally required to form the more conductive cubic
LLZO phase.6,7,8,9 However, there have been several reports of Al-free cubic LLZO produced at
lower temperatures. For example, cubic LLZO has been produced by sol-gel synthesis at 700C.10,
11 The lattice parameters of these low temperature cubic phases are larger than the values reported
for nominally Al-free cubic phases produced at high temperatures (Table 1). 3,12 One possibility is
that these high temperature cubic phases reported earlier actually contained Al inadvertently
incorporated from crucibles or furnace linings during calcination. When Al is deliberately added
during synthesis, smaller cell parameters are observed 6, 9 because of the substitution of the smaller
Al3+ for Li+ .13, 14 There are, however, limits to the solubility of Al3+ in this phase. As reported by
Rangasamy et al., a LaAlO3 impurity formed when the Al content in LLZO was high, and La2Zr2O7
coexisted with cubic LLZO when the Li content was low. 8 Düvel et al. 15 adopted a low-
temperature mechanosynthesis method and reported that for values up to x=0.4 in Li7-
3xAlxLa3Zr2O12, the products were pure cubic phase, but when x > 0.60, impurity phases formed.
Based on these observations, there is an optimum compositional range of about 0.19 x 0.4 for
the Al content and the lattice parameter may be used as an indication of Al incorporation and Li
loss during high temperature annealing.
Table 2.1. Lattice parameters of cubic LLZO reported in the literature.
Reference Synthesis
method/temperature
Lattice
constant
Al molar
concentration
Li molar
concentration
3 Solid-state/1230°C 12.9682 Å 0* n/a
12 Solid-state/1250°C 12.9827 Å 0* n/a
10 Sol-gel/750°C 13.0035 Å 0 n/a
11 Sol-gel/ 700°C 13.0021 Å 0 n/a
6 Solid-state/1000°C 12.9751 Å 0.19 6.27
9 Solid-state/1230°C 12.9727 Å 0.28 6.05±0.25
*indicates nominal composition

15
Beside material crystal structure, phase purity and microstructure of the LLZO membrane
are also key factors for solid electrolyte applications because of their lower overall resistance and
improved mechanical integrity compared to porous membranes or those containing impurities. A
typical sintering procedure for LLZO called for covering pellets with powder of the same
composition to inhibit lithium loss and then heating to 1230°C for more than 30 h.3,9 The resulting
pellets, however, were still not fully densified.16 This lowers the total conductivity and risks the
penetration of lithium dendrites through the pores during cycling, which may lead to an electrical
short or fracturing of the pellet. Longer sintering times and higher sintering temperature often
result in impurity phases, which can form due to lithium loss at high temperature and Al
incorporation, particularly if alumina crucibles are used. Huang et al. have reported that the cubic
phase decomposes with formation of La2Zr2O7 at 1250°C. 17 LaAlO3 forms when the Al content
is high and La2Zr2O7 when the Li content is low.8 However, phase pure Al-substituted LLZO
pellets, with a relative density of ~97% and a grain size of 5-10 m, can be prepared by hot-
pressing at 1000°C followed by annealing in air to remove residual graphite left by the die.18 Other
substitutions are claimed to improve sintering. For example, Ga and Ta substituted LLZO samples
were reported to densify completely at 1085°C and 1120°C, respectively, without sacrificing the
conductivity. 19,20 The grain size of the densified Ga-substituted LLZO, however, was 10 m. In
polycrystalline ceramics, large grains are desirable because they minimize the grain-boundary
resistance. 21,22 Murugan et al. suggested that the total conductivity is half of the bulk value in
LLZO, confirming the lower conductivity in the grain boundaries of the material. 3 Ideally, dense
materials with large grains are the best candidates for use as solid Li ion conductors.
In this section, we studied the effects of ceramic processing on grain size and impurity
formation during sintering of an Al-substituted LLZO cubic phase. We were able to sinter cubic
LLZO to a relative density of 94% at a considerably lower temperature than previously reported.
Particle size control was found to be critical to the densification process and growth of large grains.
Furthermore, the chemical composition of the powder cover strongly affected the morphology and
impurity formation in the sintered pellets. These properties, in turn, have a significant impact on
the electrochemical properties.
2.2 Experiments For the synthesis of a typical batch of Al-substituted LLZO, 2.6 g of Li2CO3 (CAS# 554-
13-2 Aldrich >99.0%), 5.7 g of La(OH)3 (CAS# 14507-19-8 Alfa 99.95% REO), and 2.5 g of
ZrO2(CAS# 1314-23-4 Aldrich 99%) were combined with 0.2 g of Al2O3 (Alcoa) and mixed in a
zirconia jar for 30 minutes using a Spex Sample Prep 8000M mixer/mill. No excess of lithium
carbonate was used to compensate for losses during the high temperature calcination. The powder
mixture was fired at 1000°C for 12 h in a covered alumina tray in static air to form LLZO. The as-
synthesized powder was ground by hand and sieved so that particles smaller than 75 μm were
produced. Part of the sieved fresh LLZO powder was attrition milled with 2mm diameter ZrO2
media in isopropyl alcohol (IPA) at 450 RPM for 2 h, dried in air and used for compacting pellets.
The rest of the sieved powder was divided into several batches used to cover the pellets during
sintering. For some experiments, a fresh powder bed was used. In others, powder beds were re-
used after having been annealed at 1100°C for either 6 h or 12 h during pellet processing. A
summary of the powder processing is provided in a schematic shown in Figure 2.1.

16
Figure 2.1. Schematic of the LLZO powder processing.
Pellets around 2 mm thick were made by cold uniaxial pressing from attrition milled fresh
powders using a 3/8 inch stainless steel dye without binder. The pressed pellets were placed on
and fully covered by one of the three types of LLZO powders (fresh powder, 6 h annealed and 12
h annealed) in a covered alumina tray, then fired at 1100°C for 6 or 12 h in air. The surfaces of the
sintered pellets were dry-polished using several pieces of polishing paper with grit numbers
progressing from 400-800, removing a 50 m thick layer from each surface. Dry polishing was
employed to avoid contact with water or contamination from liquid polishing media. A single grain
thick film of LLZO was prepared using the same procedure, simply by employing less material,
but was not polished.
The sintering behavior of the LLZO pellets from room temperature up to 1100°C was
studied using a vertical dilatometer (LINSEIS L75). Powders and sintered pellets were
characterized by X-ray powder diffraction (XRD) using a Bruker D2-Phaser with CuKα radiation
(λ = 1.54178 Å). The pure cubic LLZO pattern was simulated using PowderCell 2.4 (W.Kraus and
G. Nolze, Federal Institute for Materials Research and Testing, Rudower Chaussee 5, 12489 Berlin,
Germany) based on structural parameters found in reference [6]. Surface and ion milled cross-
section images of the fresh pellets were obtained by scanning electron microscopy (SEM) using a
JEOL-7500F field emission microscope. Fractured cross sections were first polished and then Ar-
ion milled with a JEOL cross-section polisher system. Bulk composition analyses were performed
using an inductively coupled plasma optical emission spectrometer (ICP-OES, Perkin-Elmer
Optima 5400).
Femtosecond (fs) LIBS was used to analyze the chemical compositions and to image
impurity distributions in the pellets in 2-D. A frequency tripled (343nm) diode-pumped Ytterbium
femtosecond laser (s-pulse, Amplitude Systems) was used as the excitation source, delivering 500
fs pulses at a repetition rate of 5 Hz (pulse energy 160 μJ). The fs-laser beam was focused on the
specimen surface by a UV microscope objective lens. Spatially resolved 2-D chemical imaging
with LIBS was achieved by scanning the sample across 3-axes (x,y,z) with respect to the
femtosecond laser beam using high-precision motorized stages. The integrated emission intensity
of the LIBS emission lines for each of the locations per sample were calculated and subsequently
assigned to xyz space coordinates. Neutral density filters were used to attenuate the fs-laser beam
and control the exact amount of laser energy that reached the sample surface. The plasma optical

17
emission was imaged onto an optical fiber bundle by using a UV fused silica plano-convex lens,
and the fiber was directly connected to the slit entrance of a spectrometer/ICCD camera system
(Acton 2150/Princeton Instruments). The gate of the ICCD camera was triggered by the fs-laser
and the relative delay was controlled by the ICCD. The integrated emission intensity of the LIBS
emission lines for each of the 15x15x50 locations per sample were calculated and subsequently
assigned to xyz space coordinates. These were then used to construct contour maps of each layer
(across the lateral plane) and depth profile contours (50 layers) across each selected plane with a
depth resolution of 700 nm/layer. Home-built data processing algorithms were used for data
management and spatial allocation (Matlab). ICP-OES was used to quantify the atomic ratios of
Li, Zr and Al over La in the bulk material and served as a standard for LIBS for quantification
purposes. Following chemical imaging, the topology of the samples was obtained using white-
light interferometry (Zygo-Multiview 6K).
AC impedance measurements were obtained on dense pellets using a VMP3 multichannel
potentiostat/galvanostat (Bio-Logic Science Instruments). For the experiments with blocking
electrodes, a gold layer was sputtered on both sides of the pellet and Pt meshes and wires were
attached and used as current collectors. For cells with non-blocking electrodes, soft metallic
lithium was first spread on both sides of the dense pellet. Afterwards, the pellet was sandwiched
between lithium foil disks in a Swagelok-type cell. Measurements were made at frequencies from
1MHz to 0.1Hz. Impedances were determined from the intercepts of the relevant capacitive arcs
at the real axes in the Nyquist plots and conductivities calculated using the equation
σ = (1 / Z)(L/ A), where Z is the impedance, L is the pellet thickness, and A is the pellet area.
Typical dimensions of the pellets were around 1.5 mm thick and 8.0 mm in diameter. Activation
energies were determined from the behavior of the conductivity as a function of temperature using
the Arrhenius equation. One cell was cycled at ambient temperature inside an Ar-filled glove box
at a constant current density of 4.6 m for 10 cycles (2 h per cycle).
2.3 Results and Discussion Portions of the fresh powder were annealed at 1100°C for 6 h or 12 h in an alumina crucible
in air during use as a powder bed for pellet fabrication. During this treatment, it remained white in
color except where it was in direct contact with the pellet. Figure 2.2 shows SEM images of the
fresh powder before and after annealing. Similar particle shapes and sizes (10μm) were observed
for all the samples, indicating minimal sintering during the high temperature treatment. The cubic
phase was maintained after annealing, with no impurity reflections found in the XRD patterns
(Figure 2.3), but the peaks became sharper, suggesting improved crystallinity after annealing. The
atomic ratios of Li/La and Al/La (obtained from ICP-OES measurements) and cell parameters as
a function of annealing time are presented in Table 2.2. Theoretical values are provided for
comparison. The Li/La ratio decreased and the Al/La ratio increased with longer annealing time,
suggesting that lithium is lost and aluminum is incorporated from the crucible during high
temperature treatment. The lattice parameter also shrank with increasing Al content, in agreement
with the literature. 6, 9, 10, 11, 20

18
Figure 2.2 SEM images of (a) fresh powder (b) powder annealed for 6h, (c) and powder
annealed for 12 h.
Figure 2.3 XRD patterns of fresh powder (top), powder annealed in Al2O3 crucible at 1100C
for 6h (second from top), powder annealed in Al2O3 crucible at 1100C for 12h (second from
bottom) and simulated cubic LLZO pattern simulated based on reference [6].
Particle size plays a critical role in material sintering. Generally, smaller particles have
greater incentive for sintering due to larger surface area. At the same time smaller particle sizes
10μm
(a)
10μm
(b)
10μm
(c)

19
may reduce the green body density, which leads to poor necking and may make full densification
difficult. There is generally an optimal particle size for good sintering behavior in a given chemical
system. We compared the sintering behavior of small and large particle sizes in the micrometer
range by attrition milling the fresh powder (10 μm) to 1μm (compare Figure 2.2a to Figure 2.4).
No impurities were observed in the XRD pattern of the attrition-milled sample, indicating no other
process occurred besides reduction of the particle size. Dilatometry profiles from 600°C to 1100°C
for two green-body pellets, one made from the unmilled powder and another from the attrition-
milled sample, are shown in Figure 2.5. The pellet pressed from the attrition-milled powder shrank
15% axially, but the pellet from the unmilled powder decreased in size only 6% over this
temperature range.
Figure 2.4. SEM images of attrition milled particles.
Figure 2.5. Dilatometery sintering profiles from 600C to 1100C of pellets made from attrition
milled and unmilled powders.
Pellets pressed from the fresh and attrition milled powders were both covered with the 10
m-sized fresh powder and sintered at 1100°C for 6 or 12 h. The time frame did not have an
appreciable effect on the results, and only pellets processed for 12 h will be discussed from this
point on. There was no significant shrinkage observed in the pellet pressed from the 10 m-sized
powder; it was porous and poorly sintered, and it contained particles ranging from 10 to 25 μm
2μm
(a)

20
across (Figure 2.6a). Both the powder cover and the pellet remained white after the heat treatment.
In contrast, after sintering, the pressed pellet made from the 1 μm-sized LLZO shrank 16%, similar
to the decrease found during the dilatometry experiments. The density of this pellet was 94% of
the theoretical value, and it contained 100 - 200 μm-sized grains of regular geometric shapes
(Figure 2.6b). The color of the pellet and the powder cover directly above and below changed color
to ivory, while the rest of the powder remained white, suggesting a surface chemical reaction.
Figure 2.6c presents a cross-section of a well-sintered pellet after Ar-ion milling. A few small
pores are visible, but they are isolated and closed within each grain. (The irregular appearance of
the top layer is due to the re-deposition of sputtered material during ion milling). Clearly,
modifying the particle size has a big effect on the sintering behavior of LLZO and can be used
effectively to decrease the temperature at which densification occurs. These results show that it
can be lowered more than 100°C than previously reported for conventional methods. 3, 9, 16, 17 By
using these 1 μm particles, we were also able to make free-standing dense films that are only one
grain thick (150-200 m). Figure 6d shows a fractured cross-section of one of these. This is
significant because solid ion-conducting layers in real devices must be very thin to allow
reasonably high currents to pass. This shows that reasonably thin films of cubic LLZO can be
prepared without having to resort to exotic and expensive techniques.
Figure 2.6. (a) Pellet made using unmilled fresh powder, (b) pellet made from the attrition milled
powder, (c) Ar-ion milled cross section of a pellet made from the attrition milled powder, and (d).
Cross-section produced by fracturing a single-grain thick film made from attrition milled powder.
We also observed differences in the morphologies of pellets sintered with powder covers
previously subjected to thermal treatments. For these experiments, pellets compacted from
attrition-milled (1 m average size) fresh powder were all sintered in 10 μm-sized fresh, or
annealed (6 or 12h) powder covers at 1100°C for 12h. As discussed above, the pellets under fresh
powder cover were successfully densified. The one prepared using the powder annealed for 6h was
25μm
(a)
50μm
(b)
100μm
(c)
100um
(d)

21
also well sintered, with a grain size (100-200 μm) similar to that of the pellet sintered in fresh
powder cover (Figure 2.7a). However, there appears to be a phase preferentially segregated at grain
boundaries on the surface, which show a darker contrast than that the bulk of the grains. SEM-
EDS spectral imaging of the two densified pellets are provided in Figures 2.8 a and b. For the
pellet sintered in fresh powder (Figure 8a), the elements were mostly uniformly distributed,
although a few randomly distributed pockets enriched in Al were observed on the surface of grains.
The mapping of the pellet sintered in the powder that was annealed for 6h (Figure 2.8b), however,
revealed that the dark contrast phase at the grain-boundaries is rich in Al but low in La and Zr; this
is probably LiAlO2 (see discussion below).
Figure 2.7. SEM images of the pellets sintered in (a) 6h annealed (b) 12h annealed LLZO
powder covers.
Figure 2.8. EDS spectral imaging of (a) a pellet sintered in fresh power cover (b) a pellet sintered
in 6h annealed power cover.
In contrast to these two samples, the pellet sintered in the powder annealed for 12h is
porous, with a particle size of only 1-2 μm (Figure 2.7b). There was some grain coarsening, but
the majority of the particles experienced minimal growth overall. Since mechanical integrity and
electrochemical properties are generally poor in porous pellets, the electrochemical properties of
this pellet were not studied. Thus, in addition to reducing the reaction with the Al2O3 crucible and
mitigating lithium loss at high temperature, the powder cover can dramatically affect the
morphology of sintered pellets, depending on its thermal history. Given that all three powder
100μm
(a)
20μm
(b)
Al
a
La Zr
Al
b
Zr La

22
covers consisted of cubic LLZO (with slight lattice parameter variations) and had similar particle
sizes (10 μm), this phenomenon must be attributable to the differences in the chemical
compositions, in particular, Li and Al contents.
Figure 2.9 compares the XRD patterns of the pellets sintered at 1100°C using the different
powder covers, before and after polishing. An extra reflection at 32° is observed for pellets sintered
in fresh powder. This is tentatively assigned to Li2Al0.5La0.5O4 (PDF#040-1167). 15 The very weak
reflection peak at 21° is attributed to Li2ZrO3 (PDF# 016-0263). In contrast, Al-rich impurities
LiAlO2 (PDF# 018-0714) and LaAlO3 (PDF# 085-1071) were observed in the pellets sintered in
the powder covers annealed for 6 h or 12 h. In all cases, polishing removed the impurities, leaving
behind cubic LLZO that appears to be phase-pure from the XRD patterns. This result suggests that
Al rich impurity phases tend to form at the pellet surface in the powder covers with low Li content
and high Al content, probably by inter-diffusion. The lattice parameter (Table 2.3) of the pellet
sintered in the fresh powder cover was smaller than that found for the fresh powder itself (Table
2.2) and did not change significantly after polishing. The pellet was ground and dissolved in nitric
acid for ICP-OES analysis, after it was polished to exclude the Li2Al0.5La0.5O4 surface impurity.
The composition was determined to be Li5.27Al0.31La3Zr1.96O11.52 (normalized to La) for the pellet.
The Al content did not change significantly but the Li content decreased compared with the fresh
LLZO powder (Table 2.2). The requirements for charge balance imply that the oxygen content
also decreased, but this was not directly measured. This suggests that the decrease in unit cell
parameter, in this case, may be due to lithium loss, and, possibly, formation of oxygen vacancies,
rather than substitution of Al for Li.
Figure 9. XRD patterns of a pellet sintered in fresh powder (bottom), a pellet sintered in fresh
powder after polishing (second from bottom), a pellet sintered in 6h annealed powder (third from
bottom), a pellet sintered in 6h annealed powder after polishing (second from top) and, a pellet
sintered in 12h annealed powder (top). ◊LiAlO2(PDF# 018-0714); ♦LaAlO3(PDF# 085-1071);
*La2Li0.5Al0.5O4(PDF# 040-1167); ×Li2ZrO3(PDF# 016-0263).

23
*Calculated, based on ratios. Oxygen contents are estimated from charge balance considerations.
Table 2.2. Composition and lattice parameter of powders used in this study.
ICP-OES gives only the overall composition of the powder, so the interpretation of the
results is complicated in the presence of secondary phases that may not be detected by XRD. In
contrast, laser induced breakdown spectroscopy (LIBS) can provide detailed information on the
distribution of the elements by sampling small sample volumes, thus increasing the sensitivity to
small phase fractions, and allows bulk elemental mapping. 23 Elemental atomic ratio maps of major
(Li, La, Zr) and minor element (Al) distribution were obtained using femtosecond LIBS. The
atomic lines of Li I (460.283/460.2889/460.2893 nm), La I (401.539 nm, 494.977 nm), Zr I
(468.780 nm) and Al I (396.152 nm) were used for the analysis. Figure 10 shows depth profiling
(10a, b, c) and 2-D cross-section visualizations (10a-1, a-2, b-1, b-2, c-1 and c-2) of Al, Li, and Zr
contents normalized to La for two LLZO pellets, one sintered with the fresh powder and the other
with the powder annealed for 6 h. The cross-section data represent maps of 1.2 mm x 1.2 mm
dimensions, with 70 μm lateral resolution (spot size is 30 μm) and 700nm/pulse resolution, to a
total depth of 35 μm. The averaged atomic ratios of Li/La, Zr/La and Al/La are plotted as a function
of detection depth (Figure 2.10 a, b, c) for the two pellets. The error bar at each detection depth is
calculated by the standard deviation of all the points at this particular depth. A smaller error bar
indicates a more uniform distribution. In the case of the pellet sintered in the fresh powder, a
constant Al/La atomic ratio of 0.1 was measured from near the surface to 35 m deep, and was
higher only for the first 2 pulses (about 1-2 m) and is the value expected for the reported
composition. In contrast, Al enrichment appeared to occur at greater depths for the pellet sintered
with the powder cover annealed for 6h. The Al/La atomic ratio was highest at the surface (first 5
pulses, ~3-5 m) and gradually decreased with pellet depth. It was only at a depth of 20 μm that
the Al/La atomic ratio approached the expected value of 0.1, as in the pellet sintered in fresh
powder at depths below about 2 m. The results agree well with the XRD data showing that the
Al rich impurities (LiAlO2 and LaAlO3) were located on the surface of this sample.
Annealing Time
0h (fresh) 6h 12h
Li/La 1.94 1.87 1.78
Al/La 0.10 0.11 0.13
Zr/La 0.64 0.65 0.65
Formula* Li5.82Al0.30La3Zr1.93O11.72 Li5.61Al0.33La3Zr1.95O11.70 Li5.34Al0.39La3Zr1.95O11.66
Lattice
parameter
12.984(8) Å 12.981(3) Å 12.965(3) Å

24
Figure 2.10. LIBS depth profiles (a, b, c) and cross-section imaging (a-1, a-2, b-1, b-2, c-1, and c-
2) of Al/La (a, a-1, and a-2), Zr/La (b, b-1, and b-2) and Li/La atomic ratios (c, c-1, and c-2) of
pellets made in fresh powder and the powder annealed for 6h.
Figures 2.10 b and c plot Li/La and Zr/La atomic ratios as a function of depth. The two
pellets both had a consistent Zr/La ratio throughout the material in contrast to the Al/La ratio.
However, much higher intensities of the Li/La ratios were observed in both samples in the first 5
pulses, corresponding to a depth of about 3.5 μm. Both samples are more lithium rich on the top
than expected from the impurities observed in the XRD patterns, which could be removed by
polishing, implying that a very thin layer of Li2CO3 is located on the surfaces of both pellets as
well.
The atomic ratios of Li/La, Zr/La and Al/La were plotted in the form of 2D cross-sections
(Figures 2.10 a-1 a-2, b-1, b-2, c-1, and c-2) to provide more details about the elemental
distribution. The mappings of the Li/La and Zr/La ratios were very similar for the two different
pellets and show the enrichment of Li at the surfaces. Larger differences were observed in the
mapping of Al/La, however. In Figure 10a-2, a heterogeneous Al-rich top layer about 10 μm thick
was clearly visible for the pellet sintered in the powder annealed for 6h. Al/La intensities as high
as 0.7 were observed at several discrete locations on the top surface. Al-rich regions of about ~0.4

25
Al/La ratios branch about 10-15 m deep in the material with lateral distances of 150-200 μm,
corresponding quite well with the interpretation that LiAlO2 is segregated at the grain-boundaries
at the surface, as observed in the SEM-EDS experiment. The LIBS results suggest that the two
pellets had essentially the same chemical compositions in the bulk, but differed on the surface; this
is corroborated by the similarities in the lattice parameters (Table 2.3). The pellet sintered with
fresh powder was generally more uniform than the pellet sintered in the annealed powder cover,
although there was still some enrichment of Li, Zr and Al above 3 m deep. In comparison, the
pellet sintered with the powder cover annealed for 6h had more Al containing impurities, which
were segregated above a depth of about 15 m.
AC-impedance experiments using Au (blocking) electrodes were performed on pellets
sintered in fresh powder and the powder annealed for 6h, before and after they were polished.
Murugan et al. were able to resolve the bulk and grain-boundary conductivity over a frequency
range from 13MHz to 5Hz.3 In our experiment, which was carried out from 1MHz to 0.1Hz, we
observed one partial semi-circle at high frequency and a diffusion spike at low frequency in the
Nyquist plots, and were not able to resolve bulk and grain-boundary conductivity, similar to what
Buschmann et al. reported in the range from 7MHz to 50 mHz.9 Total ionic conductivities vs.
temperature are shown in an Arrhenius plot (Figure 2.11) and are similar to previously reported
values. 3, 8, 9 The LLZO film that is a single grain thick (Figure 2.6d) had the highest total ionic
conductivity of 5.2×10⁻⁴S/cm at 25C, and the activation energy was 0.29 eV. At the same
temperature, the total ionic conductivity and the activation energy of the thick pellet sintered in
fresh powder prior to polishing were 2.3×10⁻⁴S/cm and 0.37 eV, respectively. This strongly implies
that the room temperature ionic conductivity and activation energy of the bulk is higher than it is
in the grain-boundaries, because the concentration of grain boundaries is much lower in the thin
sample than in the thick pellet. The room temperature conductivities vary somewhat with the
conditions used to process the pellets (Table 2.3). For example, the conductivity of the pellet
sintered in fresh powder actually decreased slightly after polishing. The room temperature total
ionic conductivity of the pellet processed in the annealed powder is only half the value of that of
the pellet processed in fresh powder but it increases to 1.9×10⁻⁴ S/cm after the surface layer is
polished away, the same as the value for the pellet sintered in fresh powder and polished. This
indicates that the surface layer has some influence on the total ionic conductivity depending on its
chemical composition.

26
Figure 2.11. Total ionic conductivities of pellets prepared in fresh powders or those annealed
for 6 h, before and after polishing. Also shown is data for the single grain LLZO film similar to
that shown in Figure 2.6d.
The surface impurities also affected the behavior of the interfaces with lithium electrodes.
Figure 2.12(a) and Table 2.3 show that there were large differences in the area specific resistances
of symmetric cells containing samples sandwiched between lithium foils, depending on the pellet
history. In the Nyquist plots derived from the AC experiments at room temperature with zero bias
on these cells, two semi-circles appeared. The first semi-circles were partial, appear in the 1 MHz
to 0.1Hz frequency range, and corresponded to the total conductivities of the pellets measured in
cells with blocking electrodes. The second semi-circles appeared at lower frequency ranges and
can be assigned to the interfacial resistance. 9, 24 Because there are two interfaces, the value derived
from the intercept with the Zre axis is divided in half for Table 3. The interfacial resistance of the
pellet made in fresh powder prior to polishing is nearly four times less than that of the one
processed in the annealed powder. After polishing, however, the two pellets show very similar
values. The higher interfacial resistance observed before polishing the pellet sintered in the
annealed powder is most likely associated with the presence of the LaAlO3 and LiAlO2 surface
impurities. This is not surprising, since these are not expected to be good lithium ion conductors.
Differences in surface roughness of the pellets, which affect the contact with the lithium electrodes,
may also influence the interfacial impedances that are observed and may account for differences
seen between the polished and unpolished pellets.
Figure 2.12. Nyquist plots of symmetrical cells containing thick pellets sandwiched between
lithium electrodes. The plot on the left shows data for pellets processed in fresh or annealed
powders before polishing and the one on the right shows the results after the pellets were polished.
The value of 540 Ohm∙cm2 observed for the unpolished pellet processed in the fresh powder
is among the lowest interfacial impedances ever observed for an LLZO sample. One report gave a
value of 2800 Ohm∙cm2 for a LLZO pellet doped with 0.9 wt% Al in contact with lithium
electrodes,9 and resistances close to 6000 Ohm∙cm2 were seen for Ga-doped LLZO/Li interfaces. 19 The lowest lithium/solid electrolyte interfacial resistance of 530 Ohm∙cm2 was achieved in a full
thin film solid state battery using Nb-substituted LLZO as the electrolyte, LiCoO2 as the cathode,
and metallic lithium as the anode, 25 and is very close to what we observed.

27
To evaluate the cycling stability and DC behavior, symmetrical Li/LLZO/Li cells were
assembled and subjected to galvanostatic charge and discharge (Figure 13), using a thick pellet
processed in fresh powder without polishing. Based on the voltage response to a constant current
of 4.6 μA/cm2 and the geometry of the pellet, a total area specific resistance of 2380 Ohm∙cm2 was
estimated. This value is consistent with the AC impedance measurement, and includes
contributions from the bulk and both interfaces. The good match between the AC and DC results
implies that the majority of current carriers are lithium ions and that the electronic conductivity of
LLZO is negligible under these conditions.
Table 2.3. Summary of physical properties of thick densified pellets in fresh, 6h annealed and
12h annealed powder covers.
Parameter Powder cover
Fresh powder 6h annealed 12h annealed
Sintering densified densified Not densified
Surface impurities La2Li0.5Al0.5O4 LiAlO2, LaAlO3 LiAlO2, Li2ZrO3,
LaAlO3
Lattice parameter of the pellet
(pre-polishing)
12.962(7) Å 12.967(9) Å 12.961(6) Å
Lattice parameter of the pellet
(post-polishing)
12.962(2) Å 12.966(6) Å n/a
Impurity thickness <5μm 15μm n/a
Conductivity(pre-polishing) 2.3×10⁻⁴S/cm 1.1×10⁻⁴S/cm n/a
Conductivity(post-polishing) 1.9×10⁻⁴S/cm 1.9×10⁻⁴S/cm n/a
Interfacial resistance (pre-
polishing)
540 Ohm∙cm2 2000 Ohm∙cm2 n/a
Interfacial resistance (post-
polishing)
700 Ohm∙cm2 625 Ohm∙cm2 n/a
The cycling profile of the symmetrical cell resembled a square wave, as is expected for a
single ion conducting electrolyte. Furthermore, no increase in voltage or other significant change
in the response was seen over 10 cycles, corresponding to 20 hours. This indicates that LLZO is
reasonably stable against lithium metal under these conditions. To establish the good stability of
LLZO definitively, however, more stringent experiments with thinner samples and over longer
periods of time will need to be carried out. Our future work on LLZO will be directed towards
understanding and optimizing the electrochemical behavior of this promising solid Li ion
conductor, with the goal of being able to use it in real devices.

28
Figure 2.13. Galvanostatic cycling of a symmetrical cell with lithium electrodes and LLZO
sintered in fresh powder at current density of 4.6 μA/cm2. The LLZO pellet used for this
experiment was approximately 1.5 mm thick and 8.0 mm in diameter and was processed in fresh
powder without polishing.
2.4 Conclusion By decreasing the particle size, we have successfully sintered cubic Al-substituted LLZO
to a relative density of 94% at 1100 ºC, the lowest temperature reported using conventional ceramic
processing techniques. The microstructure, composition, and distribution of minor impurities in
the pellets are strongly influenced by the thermal history of the powder cover used for processing.
These factors, in turn, impact the total conductivity and interfacial behavior of the pellets in contact
with lithium electrodes. The best results were obtained on samples made from a powder with an
average particle size of 1 m, which were heated for 12 hours in a fresh LLZO powder bed. These
specimens had large grains about 100-200 m across and few pores, all of which were closed.
Using the same processing conditions, it was also possible to fabricate a freestanding thin film
only a single grain thick (~150 m). This sample exhibited the highest total conductivity (5.2×10-
4S/cm at 25C) because fewer grain boundaries were present than in the thicker pellets. AC and
DC experiments are consistent with the interpretation that LLZO is a single ion conductor and that
it has negligible electronic conductivity. Symmetrical cells with lithium electrodes and a thick
LLZO pellet as electrolyte could be cycled without noticeable deterioration in performance over
10 cycles for 20 hours, suggesting good stability of LLZO against lithium.

29
2.5 References
1. G. Girishkumar, B. McCloskey, A.C. Luntz, S. Swanson and W. Wilcke, J. Phys. Chem. Lett.,
2010, 1, 2193.
2. X. Ji, K. T. Lee and L. F. Nazar, Nat. Mater., 2009, 8, 500.
3. R. Murugan, V, Thangadurai and W. Weppner. Angew. Chem. 2007, 119, 7925.
4. M. Kotobuki, K. Kanamura, Y. Sato and T. Yoshida. J. Power Sources, 2011, 196, 7750.
5. J. Awaka, N. Kijima, H. Hayakawa and J. Akimoto, J. Solid State Chem., 2009, 182, 2360.
6. C.A Geiger, E. Alekseev, B. Lazic, M. Fish, T. Armbruster, R. Langner, M. Fechtelkord,
N.Kim, T. Pettke and W. Weppner, Inorg. Chem., 2011, 50, 1089.
7. Y. Shimonshi, A. Toda, T. Zhang, A. Hirano, N. Imanishi, O. Yamamoto and Y. Takeda, Solid
State Ionics, 2011, 183 ,48.
8. E. Rangasamy, J. Wolfenstine and J. Sakamoto, Solid State Ionics, 2012, 206, 28.
9. H. Buschmann, J. Dolle, S. Berendts, A. Kuhn, P. Bottke, M. Wilkening, P. Heitjans, A.
Senyshyn, H. Ehrenberg, A. Lotnyk, V. Duppel, L. Kienle and J. Janek, Phys. Chem. Chem.
Phys., 2011, 13, 19378.
10. H. Xie, J.A. Alonso, Y. Li, M.T Fernandez-Diaz and J.B. Goodenough, Chem.Mater., 2011,
23, 3587.
11. I. Kokal, M. Somer, P.H.L Notten and H.T. Hintzen, Solid State Ionics, 2011, 185, 42.
12. J.Awaka, A. Takashima, K.Kataoka, N.Kijima, Y.Idemoto and J. Akimoto, Chem. Lett.,
2011, 40, 60.
13 H. Buschmann, S. Berendts, B. Mogwits and J. Janek, J. Power Sources, 2012, 206, 236.
14 A. A. Hubaud, D. J. Schroeder, B.Key, B. J. Ingram, F. Dogan and J. T. Vaughey, J. Mater
Chem A, 2013, 1, 8813.
15. A. Düvel, A. Kuhn, L. Robben, M. Wilkening and P. Heitjans, J. Phys. Chem. C, 2012, 116,
15192.
16. Y.Jin and P. J. McGinn, J. Power Sources, 2011, 196, 8683.
17. M. Huang, T. Liu, Y. Deng, H. Geng, Y. Shen and Y. Lin, C. Nan, Solid State Ionics, 2011,
204, 41-45.
18. J. Wolfenstine, J. Sakamoto and J.L. Allen, J. Mater Sci., 2012, 47, 4428.
19. H. E. Shinawi and J. Janek, J. Power Sources, 2013, 225, 13.
20. Y. Li, C. W, H. Xie, J. Cheng and J.B. Goodenough, Electrochem. Commun., 2011, 13 ,
1289.

30
21. P. Knauth, Solid State Ionics, 2009, 180, 911.
22. O. Bohnke, Solid State Ionics, 2008, 179, 9-15
23. V. Zorba, J. Syzdek, X. Mao, R.E. Russo, and R. Kostecki, Appl. Phys. Lett., 2012, 100,
234101.
24. L. Zhang, L. Cheng, J. Cabana, G. Chen, M.M. Doeff and T. J. Richardson, Solid State
Ionics, 2013, 231, 109.
25. S. Ohta, T. Kobayashi, J. Seki and T. Asaoka, J. Power Sources, 2012, 202,332.

31
3. Origin of large interfacial resistance
3.1 Introduction Enabling durable cycling of metal anodes, especially lithium, is a critical step toward
breakthroughs in battery performance that surpass current Li-ion technologies, especially if
coupled with high storage capacity cathode couples such as sulfur or oxygen.1,2,3 However, safety
concerns, due to dendritic growth of lithium during cycling with conventional liquid electrolytes,
present formidable obstacles to development. Solid ceramic electrolytes have been proposed as a
solution to this problem, provided that the criteria of high ionic conductivity and good chemical
stability with metallic lithium can be met. An ionic conductivity of at least 10-3 to 10-4 S/cm is
required to achieve comparable transport properties to liquid electrolytes for practical use.4 Several
materials with high conductivities, such as Li1+xAlxTi2-x(PO4)3 (LATP) 5 and LixLa2/3-
xTiO3(LLTO)6 with bulk ionic conductivities in the range of 10-3 S/cm are, however, unstable
against lithium anodes.7 Other chemically stable materials (LiPON,8 Li3.4Si0.4P0.6O49,10 ) are not
sufficiently conductive at room temperature to be practical in most devices. Other highly
conductive phases such as Li10GeP2S12 (LGPS) 11 that do not contain oxygen have also drawn a
lot of research interest recently, but their instability against reduction by lithium and exposure to
moisture make them difficult to use.12 Given these considerations, highly conductive (4x 10⁻⁴
S/cm) cubic garnet phases based on Li7La3Zr2O12 (LLZO) are presently most promising. 13,14,15,16
However, the application of LLZO in lithium metal batteries is hindered by high interfacial
resistance at the lithium metal anode side. In general, the high interfacial resistance between the
solid ceramic electrolyte and metallic lithium dominates the cell behavior, limiting the device to
low current density cycling.17,18 An area specific resistance (ASR) smaller than 100 Ω∙cm2 is
required for the LLZO/Li interface to ensure that the voltage drops no more than 100mV, using a
current density of 1 mA/cm2.19
Poor electrode/electrolyte contact, slow charge transfer, and sluggish carrier transport in
the interfacial region all can increase interfacial resistance. Buschmann et al. 20 reported an ASR
of 2800 Ω∙cm2 for cells containing LLZO doped with 0.9 wt% Al, and an ASR close to 6000 Ω∙cm2
was observed for a Ga-doped LLZO/Li interface.21 Attempts to decrease interfacial resistance by
applying high external pressure to improve physical contact have been partially successful for
some systems: Liang’s group reported low interfacial resistance (100-200 Ω∙cm2) by directly
compacting either a Li3PS4 solid electrolyte or a LLZO/Li3PS4 composite electrolyte powder onto
soft lithium foil using 300MPa pressure.22,23 The decrease in interfacial resistance was attributable
to the large effective contacting area and good physical adhesion. Low interfacial resistances have
also been achieved by pressing lithium foil onto densified Nb and Ta substituted LLZO using
150MPa pressure.24,25 Another proposed strategy to lower interfacial resistance has been to tune
the chemical composition of LLZO. Early work by Thangadurai and Weppner showed that the
garnet-type Li6ALa2Ta2O12 (A=Sr, Ba) had minimal electrolyte-electrode interfacial resistance in
lithium cells.26 However, these phases are less promising than LLZO given their much lower room
temperature conductivities of 10-6 -10-5 S/cm. Buschmann et al. demonstrated that LLZO co-
substituted by optimal amounts of Ta and Al can achieve an order of magnitude lower interfacial
resistance than the Al substituted counterparts.27 Recently, Cheng et al. reported an ASR of 540
Ω∙cm2 for an Al-substituted LLZO synthesized with a stoichiometric amount of Li2CO3, rather
than an excess.28 This value, which is lower than that found in the earlier reports, suggests that the
Li2CO3 content critically affects the ASR.

32
In this section, we investigated the effect of post-processing conditions on the LLZO pellets
and the relationships between surface properties and electrochemical performance. We report that
the high interfacial resistance primarily originates from LLZO instability in air; a surface insulating
layer is formed upon exposure to the ambient environment. A good LLZO/Li interface with low
resistance can be achieved through a simple polishing procedure, removing one obstacle and
bringing this material a substantial step closer to practical utilization in high energy cells.
3.2 Experiments Al-substituted LLZO powders and pellets were prepared using the same procedures
outlined in reference 1.1 The surfaces of sintered pellets were polished in ambient air or in an Ar
glove box, using several pieces of polishing paper with grit numbers progressing from 320-600 so
that an approximately 50 m thick layer was removed from each surface. Samples polished in air
were stored in the ambient environment for periods of several days to weeks, while those polished
under Ar were stored in the glove box for similar periods of time. Specifically, the LLZO_air
sample used for the LIBS experiment had been aged in air for a period of about two months,
whereas samples used for spectroscopic and electrochemical experiments had been exposed for
several days.
Sintered pellets were characterized by X-ray powder diffraction (XRD) using a Bruker D2-
Phaser with CuKα radiation (λ = 1.54178 Å). The pure cubic LLZO pattern was simulated using
PowderCell 2.4 (W.Kraus and G. Nolze, Federal Institute for Materials Research and Testing,
Rudower Chaussee 5, 12489 Berlin, Germany) and unit cell parameters taken from reference 2.
Images of pellet surface morphologies were obtained by scanning electron microscopy (SEM)
using a JEOL-7500F field emission microscope. Chemical composition analyses were performed
using inductively coupled plasma optical emission spectrometer (ICP-OES). As sintered pellets
were polished and sent to Evans Analytical Group for elemental analyses.
Confocal Raman microscopy was performed using a WITec alpha300 S confocal
microscope coupled to a Raman spectrometer (1800 grooves/mm grating) equipped with a CCD
detector (UHTS-300). A fiber-coupled laser operating at 532 nm was used to stimulate Raman
scattering. The laser power at the sample was approximately 30 mW. Excitation laser light was
focused into the sample with a Nikon E Plan objective lens with 20X magnification and NA = 0.4.
Light from the sample was collected using the same lens and passed through a fluorescence filter
to remove non-scattered and Rayleigh-scattered laser light and then focused on to a pinhole at the
entrance of an optical fiber that leads to the spectrometer. Spectra were collected using a single
five-second integration.
Femtosecond (fs) LIBS was used to image the cross-sectional elemental distributions in a
pellet polished in ambient air (LLZO_air). The experimental setup, data processing and image
reconstruction are described in detail in our previous work in reference 1.1 Briefly, a femtosecond
laser at 343 nm served as an excitation source. The LIBS atomic lines of Li and Zr at 460.3 nm
and 468.8 nm were detected with an optical spectrometer/ICCD system and were subsequently
analyzed. Spatially-resolved 2D cross-sectional imaging was achieved by scanning the sample in
2 axes (lateral and axial) with respect to the femtosecond laser beam, followed by chemical map
reconstruction.
X-ray photoelectron spectroscopy (XPS) was carried out at bending magnet beamline 9.3.2
at the Advanced Light Source (ALS) at Lawrence Berkeley National Laboratory (LBNL). XPS
data of Li 1s, C 1s, O 1s, Zr 3d and La 4d were collected at 640 eV from the top surface of LLZO

33
samples in ultrahigh vacuum with a sampling size 1mm in diameter. Binding energy correction of
spectra was done by calibration to the C 1s photoemission peak of adventitious hydrocarbons at
285 eV. Soft X-ray absorption spectroscopy (XAS) measurements of C and O K-edges were
performed at undulator beamline 8.0.1 at the ALS at LBNL, where the intense photon beam from
a spherical grating monochromator gives an energy resolution better than 0.2 eV. Experiments
were performed at ambient temperature. Data were collected in both surface-sensitive total
electron yield (TEY) and bulk-sensitive total fluorescence yield (TFY) mode. All the spectra have
been normalized to the beam flux measured by the upstream gold mesh. The same sample sets
were used for XPS and XAS measurements. Samples were protected in Ar environment for transfer.
AC impedance measurements were obtained on dense pellets using a VMP3 multichannel
potentiostat/galvanostat (Bio-Logic Science Instruments). For the experiments with blocking
electrodes, a gold layer was sputtered on both sides of the pellet and Pt meshes and wires were
attached and used as current collectors. For cells with non-blocking electrodes, soft metallic
lithium was first spread on both sides of the dense pellet. Afterwards, the pellet was sandwiched
between lithium foil disks in a Swagelok-type cell. Measurements were made at frequencies from
1 MHz to 1 Hz. Impedances were determined from the intercepts of the relevant capacitive arcs at
the real axes in the Nyquist plots and conductivities calculated using the equation σ = (1 / Z)(L/ A),
where Z is the impedance, L is the pellet thickness, and A is the pellet area. Typical dimensions of
the pellets were around 1.1 mm thick and 7.8 mm in diameter. Activation energies were
determined from the behavior of the conductivity as a function of temperature using the Arrhenius
equation. Cells were cycled at ambient temperature inside an Ar-filled glove box at a constant
current density of 46 A/cm2. For the moisture experiment, pellets first polished in the Ar glove
box and assembled into cells with lithium electrodes for AC impedance measurements were
removed from the cell holder, and electrodes were peeled off. Residual lithium adhering to the
surfaces was quickly washed away with de-ionized water in air. The pellet was dried and then
transferred back in Ar glovebox and re-assembled into a cell with lithium electrodes for further
impedance analysis.
3.3 Results and Discussion As-sintered pellets were 92% dense (theoretical density = 5.1 g/cm3), and had grain sizes
between 150-200 μm. Several sintered pellets were polished in an Ar glovebox with oxygen levels
below 0.1 ppm (designated LLZO_Ar) and others in air as a control experiment (designated
LLZO_air). LLZO_Ar was stored in the Ar glovebox while LLZO_air was stored in air. Figure 1
shows the top-view scanning electron microscope (SEM) images of unpolished LLZO, LLZO_air
and LLZO_Ar pellets. The polished surfaces of LLZO_air and LLZO_Ar had similar
morphologies, ruling out an effect of different contact areas on the interface impedance.

34
Figure 3.1. SEM surface morphologies of (a) an as-sintered LLZO pellet (b) a LLZO pellet
polished in Ar glovebox (LLZO_Ar) and (c) a LLZO pellet polished in air (LLZO_air) and
exposed to ambient atmosphere for several days.
Figure 3.2 shows the laser-induced breakdown spectroscopic (LIBS) cross section mapping
of an LLZO_air sample, which had been aged in air for about two months. The atomic ratio of
Li/Zr was mapped out as functions of the lateral distance and vertical depth with resolutions of 38
m and 1 m, respectively. The chemical map shows that a Li-rich region was present on the pellet
surface suggesting an impurity formed due to chemical instability in the ambient environment.
Due to the limitations of the experiment, it was not possible to determine the chemical identity of
this lithium-rich phase or the exact thickness of the layer. However, the observation is in agreement
with the report by Shimonishi et al. of increased grain-boundary resistance after immersion of
LLZO in water at 50 ºC,29 and that of Larraz et al. suggesting that the LLZO cubic structure is
very sensitive to ambient conditions, especially moisture.30 Additionally Jin et al. found that LLZO
reacts with water with possible formation of LiOH.31 (LiOH reacts with CO2 to from Li2CO3 in
air)32 Thus, we speculate that the high Li/Zr intensity layer is composed of LiOH and Li2CO3,
resulting from the chemical instability of LLZO against moisture and from exposure to CO2.
Figure 3.2. 2-D cross-section of the Li/Zr atomic ratio on the LLZO_air pellet, aged in air for
about two months, obtained by LIBS.
X-ray diffraction (XRD) and Raman spectroscopy were then used to obtain further
information about the high lithium intensity layer on the pellet surface (Figure 3.3). No apparent
differences were observed between LLZO_Ar and LLZO_air in the XRD and Raman spectra,
implying that the high Li intensity surface layer was so thin that it was below the sensitivity limits
of these techniques. Thus, surface sensitive techniques with varying probing depths, such as

35
synchrotron X-ray photoelectron spectroscopy (XPS)33 and soft X-ray absorption spectroscopy
(sXAS)34, are necessary to identify the surface chemical species, particularly on samples exposed
to air for short periods of time.
Figure 3.3 (a) XRD patterns of LLZO_Ar (top), LLZO_air (middle) and a simulated cubic LLZO
pattern (bottom) based on reference. 10 (b) Raman spectra of LLZO_Ar (top), LLZO_air (second
from top), unpolished LLZO_fresh pellet (second from bottom), and the as-synthesized powder
(bottom).
XPS was used to compare the surface chemistry of LLZO polished in air and exposed for
several days to ambient atmosphere, and the one polished in Ar.35 The C 1s, La 4d, Zr 3d, Li 1s,
and O 1s spectra collected at 640 eV for the LLZO_air and LLZO_Ar samples (Figure 3.4)
provided concrete evidence of Li2CO3 on the surfaces of the former. Two peaks were identified at
binding energies of 285.0 eV and 290.0 eV in the C 1s spectra of LLZO_air; the first is due to
adventitious carbon, and the one at 290.0 eV is assigned to carbonate based on previously reported
C 1s spectra of Li2CO3..36 In contrast, the carbonate peak was not observed in the LLZO_Ar C 1s
spectra. Other differences included the presence of La 4d and Zr 3d doublets in the spectra of
LLZO_Ar pellets, which were not observed in LLZO_air. They provide evidence that air exposure
led to the formation of a surface carbonate layer on the LLZO-air pellets thick enough to block the
La and Zr photoelectron signals. This analysis was further substantiated by the Li 1s XPS spectra.
The Li 1s peak for LLZO_air shifted to a higher binding energy close to 55.3 eV, similar to the
reported binding energy of Li2CO3. The lower binding energy of 54.5 eV observed for the
LLZO_Ar sample is tentatively attributed to Li in LLZO, with the shift explained by the weaker
Li-O bond in LLZO. Similarly, the LLZO_air O 1s spectra showed a binding energy shift relative
to that of LLZO_Ar, consistent with the oxygen belonging to Li2CO3 on the pellet surfaces. In
general, the inelastic mean free path (IMFP) of electrons in the energy range of 50-600 eV is
between 0.6 - 1.5 nm in inorganic materials.37 The probing depth (taken as 3 times the IMFP) is
between 1.8 - 4.5 nm for these experiments. Since all Zr 3d and La 4d signals were attenuated by
the Li2CO3 layer, the lower bound for the thickness estimation of the Li2CO3-containing layer is
ça 3 nm.

36
Figure 3.4. C 1s, La 4d, Zr 3d and Li 1s XPS data collected from LLZO Ar and LLZO_air pellet
surfaces under ultra-high vacuum.
Soft XAS was then employed to estimate the upper bound of the thickness of the Li2CO3
and to extend the understanding of LLZO surface chemistry on the same samples studied by XPS.
We utilized both surface-sensitive total electron yields (TEY, probing depth< 10nm) and bulk-
sensitive total fluorescence yields (TFY probing depth >100nm) modes to obtain depth-dependent
chemical information. 38 , 39 Figure 4(a) shows the normalized O K-edge TEY spectra of the
LLZO_air, LLZO_Ar pellets, and a Li2CO3 reference. The pure Li2CO3 spectrum (top) exhibited
a peak at 534.1 eV, which was assigned to electron transition from the O-1s to π* (C=O) orbital.
The leading edge in the LLZO_Ar TEY spectrum appeared at a lower photon energy of 533.0 eV,
which is associated with the oxygen of LLZO, and no Li2CO3 signal was detected. The TEY
spectrum of LLZO_air (middle) resembled that of the pure Li2CO3 reference. These observations
confirmed the XPS finding that Li2CO3 was found on the surfaces of the LLZO_air pellets but not
on those of LLZO_Ar. Both the bulk-sensitive TFY spectra of the LLZO_air and the LLZO_Ar
samples showed LLZO peaks at 533.0 eV. An additional O-K absorption feature at 534.1 eV was
observed for the former due to the Li2CO3 on the pellet surface (Figure 4(b) middle and bottom).
The strong LLZO feature at 533.0 eV is a clear indication that the thickness of the Li2CO3 layer
on the LLZO_air pellet is below the ~ 100 nm detection depth of the TFY mode. In addition, the
appearance of a weak peak at 533.0 eV in the LLZO_air TEY spectrum (Figure 3.5(a) middle)
implies that the Li2CO3 thickness is close to or slightly lower than the 10 nm detection depth of
the TEY mode.
Further insight was obtained from the C K-edge XAS spectra. Figure 4(c) and (d) are plots
of the C K-edge XAS spectra collected in TEY and TFY mode, respectively. There are three
absorption features at 285.0 eV, 288.1 eV and 290.1 eV in the spectrum of the Li2CO3 reference
(Figure 4(c) and (d) top). The first two features are assigned to adventitious carbon. The feature at
290.1 eV is attributable to the transition from the C 1s to π* (C=O) orbital of Li2CO3. In both the
TEY and TFY data, the LLZO_air spectra are very similar to the Li2CO3 reference in accordance
with the LIBS, XPS, and O-K XAS results and confirm the presence of Li2CO3 on the pellet surface.
In contrast, the LLZO_Ar sample showed a much weaker C-K absorption intensity at 290.1 eV,
indicating the presence of trace amount of Li2CO3. An additional weak absorption feature
observed at 283.0 eV in both the LLZO_Ar TEY and TFY spectra are possibly the result of
contamination with a carbon-containing impurity during polishing in the Ar glove box.

37
Figure 3.5. (a) and (b) O K-edge XAS spectra of LLZO_Ar, LLZO_air and Li2CO3 reference
collected in TEY and TFY modes; (c) and (d) C K-edge XAS spectra of LLZO_Ar, LLZO_air
and Li2CO3 reference collected in TEY and TFY modes.
To better understand the Li2CO3 formation on the LLZO pellet during air exposure, we
calculated first-principles energies to estimate the Gibbs free reaction energy at standard states for
relevant reactions. 40,41 One unit cell of Li56La24Zr16O96 was considered to save computational cost
(Figure 3.6.) Formation of Li2CO3 is accompanied by loss of Li in LLZO, which is likely to be
associated with concurrent O loss to balance the charge, resulting in Li54La24Zr16O95. The loss of
lithium was supported experimentally by elemental analysis using inductively coupled plasma
atomic emission spectroscopy (ICP-OES). 28 Further loss of lithium and oxygen may result in
decomposition of the LLZO cubic phase to La2Zr2O7, as observed by Huang et al. 42 We assume
that this process is unlikely for samples exposed briefly to air. Gibbs free energies of all the related
chemical species were tabulated in Table 3.1. The Gibbs free energy for the reaction (1) of LLZO
with gas phase H2O to form Li deficient Li54La24Zr16O95 and LiOH was -0.55 eV/fu. LiOH then
absorbs CO2 from the air, forming Li2CO3.43 In addition, we also found an energetic preference
for reaction (2) in which LLZO reacts directly with CO2 without participation from water to form
Li2CO3. The Gibbs free energy for this reaction is -2.00 eV/fu, indicating that LLZO is
thermodynamically unstable against reaction with dry CO2 as well. Thus, there is a thermodynamic
preference for LLZO to form Li2CO3 in the air, consistent with the experimental observations. The
kinetics of these reactions require further experimentation to determine. Time-dependent
spectroscopic investigations are currently underway in our laboratory to obtain these details.

38
Figure 3.6, The 192-atom supercell of LLZO used in first-principles calculations.
Experimental Gibbs free energy 𝜇0,exp
(eV/fu)
Calculated Gibbs free energy
𝜇0,DFT (eV/fu)
Li2CO3 -12.60 -12.55
Li2O -6.20 -5.87
LiOH -5.03 -4.69
Li56La24Zr16O96 - -77.51
Li54La24Zr16O95 - -71.05
H2O (g) -2.37 -
CO2 (g) -4.09 -
Table 3.1 Calculated enthalpies and experimental standard Gibbs free energies9 for the compounds
used in thermodynamic calculations.
𝐿𝑖56𝐿𝑎24𝑍𝑟16𝑂96(𝑠) + 𝐻2𝑂 (𝑔) = 𝐿𝑖54𝐿𝑎24𝑍𝑟16𝑂95(𝑠) + 2𝐿𝑖𝑂𝐻(𝑠) (1)
𝐿𝑖56𝐿𝑎24𝑍𝑟16𝑂96(𝑠) + 𝐶𝑂2(𝑔) = 𝐿𝑖54𝐿𝑎24𝑍𝑟16𝑂95(𝑠) + 𝐿𝑖2𝐶𝑂3(𝑠) (2)
Ionic conductivity measurements using AC impedance with Au blocking electrodes
showed minimal differences between the total conductivities of LLZO_air exposed to ambient
environment for several days and LLZO_Ar pellets (Figure 3.7). This is consistent with the XPS
and XAS observations that the Li2CO3 layer was thin and did not affect the bulk properties. In
contrast, electrochemical impedance spectroscopy (EIS) measurements using non-blocking Li
metal electrodes with LLZO pellets sandwiched in between in a symmetric cell configuration
revealed large differences in the interfacial resistances. Both LLZO_air and LLZO_Ar cells
showed one partial semicircle in the high frequency range and a complete semicircle at lower
frequencies in the Nyquist plots (Figure 3.8). The semi-circles at high frequencies are attributable
to the total resistance of the LLZO pellets by comparison to the data obtained in cells with blocking
electrodes, and the low frequency semi-circles can be assigned to the interfacial resistance.9, 28 An
(RpelletQpellet)(RinterfaceQinterface) equivalent circuit (see inset of Figure. 3.8) was used to fit the EIS
data, where Q represents a constant phase element (CPE). Total resistances and capacitances of
the pellets and interfaces were determined from the fit and were tabulated in Table 1. Area specific

39
resistances (ASR) of the interfaces were estimated by normalization to the pellet areas (0.45 cm2).
The interfacial resistance for the cell made with LLZO_air was 960 Ω∙cm2. This value is similar
to that of freshly sintered, unpolished LLZO pellets previously reported by us.28 Note that the
variation in interfacial resistance is probably attributable to the fact that the surface roughnesses
of the polished LLZO_air and unpolished sintered pellet differ. The interfacial resistance of
LLZO_Ar was 109 Ω∙cm2, almost an order of magnitude lower than that of LLZO_air. This
strongly suggests that the thin Li2CO3 layers on the pellet surfaces of the latter are responsible for
the high interfacial resistance.
Figure 3.7. Total ionic conductivities of pellets polished in ambient air (LLZO_air) and in Ar
(LLZO_Ar), measured in cells with ion-blocking Au electrodes.
Figure 3.8. Nyquist plots of symmetrical cells containing pellets sandwiched between lithium
electrodes. (Figure inset: (RpelletQpellet)(RinterfaceQinterface) equivalent circuit).
To further confirm that the high interfacial impedance could be traced to the reaction of
LLZO surfaces with moisture and CO2, impedance experiments were performed on a cell
containing an LLZO_Ar sample exposed to air and water after the initial measurements in Figure
3.9 were obtained (see experimental section). The interfacial resistance increased greatly in
magnitude after exposure.

40
Figure 3.9. Nyquist plots of Li/LLZO_Ar/Li cells before and after exposure of the LLZO to air
and water.
The temperature dependence of the reciprocal ASR followed a classical Arrhenius
behavior with an activation energy of 0.33 eV, as shown in Figure 3.10(a), indicating a stable
electrolyte-electrode interface upon heating.9 This value was close to the activation energy of the
LLZO pellet total ionic conductivity as observed by other groups.17, 27 EIS measurements on
symmetric lithium cells with LLZO_Ar samples using biases of 0mV, 50mV, 100mV, 200mV and
500mV and 25mV perturbations revealed that the interfacial resistance has no bias dependence
(Figure 3.10.), indicating that charge transfer was not the limiting step for interfacial resistance.
Figure 3.10. a. Reciprocal area specific resistance as a function of temperature b. Nyquist plots of
Li/LLZO_Ar/Li cells at varying DC biases.
The Li/LLZO/Li symmetric cells were galvanostatically cycled. The behavior was also
greatly improved when LLZO_Ar was used as electrolyte, compared to those with LLZO_air
(Figure 3.11). An LLZO_air cell cycled at a current density of 46 A/cm2 showed large and
• Re-exposed Polished

41
increasing overpotentials, above 100 mV. In contrast, LLZO_Ar was stable at of 35 mV when
applied the same current density. The DC resistance calculated for both cells agreed well with the
EIS measurements, and confirmed that the high ASR observed in the cell with the LLZO_air
sample was a major contributor to the high observed overpotential. The difference in ASRs for the
two cells also affected the cycling behavior; the cell containing LLZO_Ar cycled stably for the ten
hours of the test, whereas the one with LLZO_air shorted in less than one hour. Thus, the quality
of the electrode electrolyte interface is also a critical factor in determining cell lifetime.
Figure 3.11. Galvanostatic cycling of symmetrical cells with lithium electrodes and LLZO at
current density of 46 μA/cm2 .
3.4 Conclusions We showed both experimentally and theoretically that Li2CO3 forms as a result of LLZO
exposure to air. A combination of surface sensitive characterization techniques allowed an
estimate to be made for the Li2CO3 layer thickness of between 3-100 nm thick for samples exposed
to air for several days, but probably closer to about 10 nm. Exposure to air and the resulting
formation of Li2CO3 are the origins of the large interfacial resistances observed in LLZO
symmetric cells with lithium metal electrodes. The surface Li2CO3 can be easily removed by
polishing pellets under an Ar atmosphere. When applied to the samples used in this study, this
procedure resulted in the lowest interfacial impedance for Al substituted LLZO cells reported to
date, and resulted in much more stable galvanostatic cycling than with the unprocessed material.
While the chemical instability of LLZO towards moisture and air complicates the processing of
the material into thin films needed for electrochemical cells, these results show that high interfacial
impedances are not intrinsic to the system, but can be avoided with simple precautions.

42
3.5 References
1. G. Girishkumar, B. McCloskey, A.C. Luntz, S. Swanson and W. Wilcke, J. Phys. Chem. Lett.,
2010, 1, 2193.
2. X. Ji, K. T. Lee and L. F. Nazar, Nat. Mater., 2009, 8, 500.
3. K. Gallagher, S. Goebel, T. Greszler, M. Mathias, W. Oelerich, D. Eroglu and V. Srinvasan,
Energy Environ. Sci., 2014, 7, 1555
4. K. Takada, Acta Materialia, 2013, 61, 759
5. J. Aono,E. Sugimoto, Y. Sadaoka, N. Imanaka, G and Adachi, Solid State Ionics, 1991, 47,
257
6. A. Belous, G. Novitskaya, S. Polyaneskaya, Y. Gornikov, Izv. Akad. Nauk SSSR, 1987, 23,
470
7. P. Knauth, Solid State Ionics, 2009, 180, 911
8. J. Bates, N. Dudney, G. Gruzalski, R. Zuhr, A. Choundhury, F. Luck and J. Robertson, Solid
State Ionics, 1992, 53, 647
9. Y. Hu, D. Raistrick and R. Huggins, J. Electrochem. Soc., 1977, 124, 1240
10. L. Zhang, L. Cheng, J. Cabana, G. Chen, M.M. Doeff and T. J. Richardson, Solid State
Ionics, 2013, 231, 109
11. N. Kamaya, K. Homma, Y. Yamakawa, M. Hirayama, R. Kanno and M. Yonemura, Nat.
Mater., 2011, 10, 628
12. S. Ong, Y. Mo, W. Richards, L. Miara, H. S. Lee and G. Ceder, Energy Environ. Sci., 2013,
6, 148
13. R. Murugan, V, Thangadurai and W. Weppner. Angew. Chem. 2007, 119, 7925.
14. M. Kotobuki, K. Kanamura, Y. Sato and T. Yoshida. J. Power Sources, 2011, 196, 7750
15. J. Park, L. Cheng, V. Zorba, A. Mehta, J. Cabana, G. Chen, M. Doeff, T. Richardson, J. Park,
J. Son and W. Hong, submitted.
16. C. A. Geiger, E. Alekseev, B. Lazic, M. Fish, T. Armbruster, R. Langner, M. Fechtelkord, N.
Kim, T. Pettke and W. Weppner, Inorg. Chem., 2011, 50, 1089.
17. S. Ohta, T. Kobayashi, J. Seki and T. Asaoka, J. Power Sources, 2012, 202,332.
18. S.Ohta, S. Komagata, J. Seki, T. Saeki, S. Morishita and T. Asaoka, J. Power Sources, 2013,
238,53
19. J. Christensen, P. Albertus, R. Sanchez-Carrera, T. Lohmann, B. Kozinsky, R. Liedtke, J.
Ahmed and A. Kojic, J. Electrochem. Soc, 2012, 159, R1

43
20. H. Buschmann, J. Dolle, S. Berendts, A. Kuhn, P. Bottke, M. Wilkening, P. Heitjans, A.
Senyshyn, H. Ehrenberg, A. Lotnyk, V. Duppel, L. Kienle and J. Janek, Phys. Chem. Chem.
Phys., 2011, 13, 19378.
21. H. E. Shinawi and J. Janek, J. Power Sources, 2013, 225, 13.
22. E. Rangasamy, G. Sahu, J. Keum, A. Rondinone, N. Dudney and C. Liang, J. Mater. Chem.
A., 2014, 2, 4111
23. Z. Liu, W. Fu, A. Payzant, X. Yu, Z. Wu, N. Dudney, J. Kiggans, K. Hong, A. Rondinone
and C. Liang, J. Am. Chem. Soc., 2013, 135, 975
24. K. Ishiguro, Y. Nakata, M. Matsui, I Uechi, Y. Takeda, O. Yamamoto and N. Imanishi, J.
Electrochem. Soc.,2013, 160, A1690
25. K. Ishiguruo, H. Nemori, S. Sunahiro, Y. Nakata, R. Sudo, M. Matsui, Y. Takeda,
O.Yamamoto and N. Imanishi, J. Electrochem. Soc., 2014, 161, A668
26. V. Thangadurai and W. Weppner, Adv. Fun. Mat, 2005, 15, 107
27. H. Buschmann, S. Berendts, B. Mogwitz, J. Janek, J. Power Sources, 2012, 206, 236
28. L. Cheng, J.S. Park, H. Hou, V. Zorba, G.Chen, T.Richardson, J.Cabana, R.Russo, M.Doeff,
J.Mater.Chem.A, 2014, 2, 172
29. Y. Shimonishi, A. Toda, T. Zhang, A. Hirano, N. Imanishi, O. Yamamoto and Y. Takeda,
Solid State Ionics, 2011, 183, 48
30. G. Larraz. A. Orera, M.L. Sanjuan, J.Mater.Chem.A, 2013,1,11419
31. Y.Jin and P. McGinn, J. Power Sources, 2013, 239,326
32. D. Williams and R. Miller, Ind. Eng. Chem. Fundam.,1970, 9, 457
33. M. Grass, P. Karlsson, F. Aksoy, M. Lundqvist, B. Wannberg, B. Mun, Z. Hussain and
Z.Liu, Rev. Sci. Instrum., 2010, 81, 053106
34. W. Yang, X. Liu, R. Qiao, P. Olalde-Velasco, J. Spear, L. Roseguo, J. Pepper, Y. Chuang, J.
Denlinger and Z. Hussain, J. Electron. Spectrosc. Relat. Phenom., 2013, 190, 64
35. Y. Lu, E. Crumlin, G. Veith, J. Harding, E. Mutoro, L. Baggetto, N. Dudney, Z.Liu and Y.
Shao-Horn, Sci. Rep, 2012, 2, 715
36. K. P.C Yao, D. Kwabi, R. Quinlan, A. Mansour, A. Grimaud, Y. Lee, Y. Lu and Y. Horn, J.
Electrochem. Soc., 2013, 160, A82436
37. S. Tanuma, C. Powell and D. Penn, Surf. Interface Anal., 1991, 17, 927
38. R. Qiao, Y. Chuang, S. Yan, W. Yang, Plos One, 2012, 7, 11.
39. R. Qiao, I. Lucas, A. Karim, J. Syzdek, X. Liu, W. Chen, K. Persson, R. Kostecki and W.
Yang, Adv. Mater. Interfaces, 2014, 1, 1300115

44
40. A. Jain, S. P. Ong, G. Hautier, W. Chen, W. D. Richards, S. Dacek, S. Cholia, D. Gunter, D.
Skinner and G. Ceder, APL Materials, 2013, 1, 011002
41. K. A. Persson, B. Waldwick, P. Lazic and G. Ceder, Phys. Rev. B, 2012, 85.
42. M. Huang, T. Liu, Y. Deng, G. Geng, Y.Shen, Y.Lin and C. Nan, Solid State Ionics, 2011,
203, 41
43. D. Boryta and A. Mass, Ind. Eng. Chem., Process Des. Devel.,1971, 10, 489

45
4. Surface grain-boundaries of LLZO
4.1 Introduction Enabling cycling of lithium metal anodes is a critical step towards achieving breakthroughs
in next generation rechargeable batteries, such as Li-air and Li-sulfur systems. 1 The use of a solid
ceramic electrolyte on the anode has recently been proposed to mitigate the deleterious effects of
lithium dendrite growth and mossy deposition associated with repeated plating and stripping of
the lithium anode when conventional liquid or polymer electrolytes are used. A practical solid
electrolyte must have high ionic conductivity, good chemical stability against metallic lithium, low
interfacial resistance, and long cycling in order to realize high performance devices.5 Despite
superionic conductivities close to or even higher than conventional liquid electrolytic solutions,
the practical application of Li1+xAlxTi2-x(PO4)3 (LATP)6,7 and Li10GeP2S12 (LGPS)8 is hindered by
their instability against reduction by lithium metal.9,10 In contrast, highly conductive garnet
oxides11,12 and thio-phosphates exhibit better stability against reduction by lithium metal.13,14 Yet,
high interfacial resistances, 15–17 severe over potential build-up during cycling, 14,18 and short cycle
life19,20 remain unsolved problems for their application in practical devices.
The above-mentioned problems are associated with sluggish ion transport in the interfacial
regions,21 inhomogeneity in potential-current distributions22 and detrimental current focusing
during operation.23 These ionic transport properties are intimately related to the microstructures
and chemical compositions of polycrystalline ceramics electrolytes. Al substituted Li7La3Zr2O12
(LLZO), for example, is densified through a sintering process involving high temperatures and
lengthy heating times, with both lithium and alumina contents sensitive to processing
conditions.15,17 Attempts to modify the microstructure by either changing synthetic routes or
processing conditions inevitably lead to variations in composition of the resulting densified
ceramic. This accounts for the wide distribution of chemical compositions and microstructures
reported in the literature for LLZO samples. 15,17,24–32 Despite the progress in microstructure
engineering of solid state electrolytes, the knowledge of the relationships among microstructure,
interfacial resistance, and cycling performance is very limited. The complexity involved in
differentiating the roles of the interfaces and the bulk, as well as decoupling microstructure effects
from those of chemical composition present formidable challenges in understanding the
electrochemical behavior of solid electrolytes based on LLZO.
Herein we report a study that correlates electrolyte microstructure with interfacial and
electrical cycling properties, using dense Al-substituted LLZO as a model system. Our approach
was three-fold: first, we developed a ceramic processing technique to prepare dense LLZO solid
electrolyte with complex yet controllable microstructures, including both homo- and hetero-
structures, using the same sintering conditions; second, we demonstrated that the Li/LLZO
interfacial resistance is strongly correlated with the interface microstructure and grain boundaries,
and very low interfacial resistance can be achieved; and lastly, we differentiated the contributions
from surface and bulk in symmetrical lithium cell measurements and revealed that the cycle life
of LLZO is strongly impacted by the microstructure of the Li/LLZO interface, particularly, the
grain boundaries. Grain and grain boundary orientation mapping by high-resolution synchrotron
X-ray Laue micro-diffraction experiments indicated that grain-boundaries play a critical role in
the performance of solid electrolyte. Our work unveiled the correlation of key interfacial properties
with solid electrolyte surface microstructure, providing insights to the optimization of
polycrystalline ceramic electrolytes for durable high-rate, high-energy devices with lithium anodes.

46
4.2 Experiments LLZO powder was synthesized via a solid state reaction as reported in reference 17. The
as-synthesized fresh powder was ground by hand and sieved to below 75 μm to obtain particles 10
μm across. To prepare the 1 μm sized LLZO particles, some of the 10 μm LLZO powder was
attrition milled at 450 RPM for 2 hr with 2 mm diameter ZrO2 media in isopropyl alcohol (IPA).
IPA was removed by drying the samples in air under a heat lamp. Particle size analysis was carried
out using a Beckman Coulter LS 200 Particle Characterization system.
The attrition-milled powder was mixed with 10 μm LLZO powder at varying ratios of 50,
70, 90, and 100 wt. %. Pellets were made by cold uniaxial pressing the powders using a 3/8 inch
stainless steel dye without binder. LLZO bar were made by pressing fine powder into bar shape
and sintered at 1100°C for 12 h in air. The dimension of the bar is 16mm×3mm×2mm. LLZO
heterostructures were made by pressing the powders layer by layer using the same process. The
pressed green bodies were placed on a LLZO powder bed, fully covered by fresh LLZO powder
in a covered alumina tray, and then fired at 1100°C for 12 h in air. Sintered pellets were stored in
an Ar-filled glovebox. The surfaces of the sintered pellets were dry-polished using several pieces
of polishing paper with grit numbers progressing from 240-600 in an Ar glove box to avoid contact
with air, water and contamination from liquid polishing media. Special care was taken in polishing
so that the surface layers were not fully removed in the heterostructured LLZO pellets. The
densities were estimated from the weights and dimensions of the sintered LLZO circular disks.
Powder samples and sintered pellets were characterized by X-ray powder diffraction (XRD) using
a Bruker D2-Phaser with CuKα radiation (λ = 1.54178 Å). The pure cubic LLZO pattern was
simulated using PowderCell 2.4 (W. Kraus and G. Nolze, Federal Institute for Materials Research
and Testing, Rudower Chaussee 5, 12489 Berlin, Germany) with unit cell parameters taken from
the literature33. Surface and fractured cross-section images of the fresh pellets were obtained by
scanning electron microscopy (SEM) using a JEOL-7500F field emission microscope or a
HITACHI TM-1000 tabletop microscope, using secondary electron imaging (SEI) mode.
AC impedance measurements were performed on dense pellets using a VMP3 multichannel
potentiostat/galvanostat (Bio-Logic Science Instruments). For the experiments with blocking
electrodes, a gold layer was sputtered on both sides of the pellet and Pt meshes and wires were
attached as current collectors. For cells with non-blocking electrodes, soft metallic lithium was
first spread on both sides of the dense pellet to ensure good contact. Afterwards, the pellet was
sandwiched between two lithium foil disks in a Swagelok-type cell. The pressure was maintained
in the Swagelok cells with springs having spring constants of 13.3N/cm, so that the maximum load
was 17N, corresponding to a pressure of 370 kPa. The estimated pressure on the Li/LLZO/Li cell
was 200 kPa, considering the spring displacement. Samples were assembled in the same Swagelok
cells with controlled displacement so that similar pressures were used for each.
Measurements were made at frequencies from 1MHz to 1Hz. The conductivities were
calculated using the equation σ = (1 / Z)(L/ A), where Z is the impedance, L is the pellet thickness,
and A is the pellet area. An (RpelletQpellet)(RinterfaceQinterface) equivalent circuit (see inset in Figure 4b)
was used to fit the EIS data of cells with non-blocking electrodes, where Q is the constant phase
element (CPE). Typical dimensions of the pellets were ~1.0 mm thick and 7.8 mm in diameter,
with the heterostructured LLZO slightly thicker at ~2 mm. Cells with non-blocking electrodes
were cycled at ambient temperature inside an Ar-filled glove box at a constant current density of
46 A/cm2 for 20 cycles (2h per cycle) or varying current densities for 4 cycles (1 hr per cycle).

47
The current density started at 46 A/cm2 and was stepped in increments of 22 A/cm2 until cell
shorting occurred. A rest period of ~30 minutes was used between each current step.
The Laue X-ray microdiffraction experiments were conducted at Beamline 12.3.2 of the
Advanced Light Source (ALS) at Lawrence Berkeley National Laboratory. A polychromatic X-
ray beam (5 – 22 keV) was focused to ~ 1 x 1 μm2 by a pair of Kirkpatrick-Baez mirrors. The
sample was mounted on a high resolution x-y scan stage and tilted 45º relative to the incident X-
ray beam. Laue diffraction images were recorded in reflection mode with a two-dimensional
Pilatus-1M detector mounted at 90º to the incoming X-ray, approximately 140 mm from the probe
spot. Exposure time at each position was 1 s. The sharp reflections indicate a relatively low
dislocation density within the probed diffraction volume (~1×1×40 μm3). The detector has a pixel
size of 0.17 mm. Peak positions were determined by fitting of a 2d Gaussian function with a
precision of about 0.1 pixels, providing an angular resolution of ~ 0.01°. Calibrations for distance,
center channel position, and tilt of detector were performed based on a Laue pattern from a strain-
free synthetic quartz crystal exhibiting similar penetration characteristics as LLZO. This takes into
account absorption and extinction effects. For the LLZO_LG pellet, a 2-D scan of 67×67 points
was performed with a step size of 15 μm, and for the LLZO_SG pellet, a scan of 167×167 points
was performed with a step size of 6 μm. Thus, similar amount of data points per grain were
collected for both the small and large-grained samples. The X-ray scan diffraction data was then
processed by XMAS software. 34
4.3 Results and Discussion Figure 4.1 shows a schematic of the processing routes we developed to fabricate densified
LLZO pellets with a variety of complex microstructures. To achieve densification of LLZO pellets
with different microstructures under the same thermal conditions, the key is to control the particle
size distribution in the packed green body by using a bimodal distribution, i.e.; mixing large
particles with smaller ones. As reported in our previous work, densification of the pellet green
body made entirely of smaller particles of 1-2 μm is associated with tremendous grain growth.17
Sintered pellets typically exhibited grain sizes of 100-200 μm (100 times growth) and 92%
theoretical density, suggesting that a liquid sintering process might be actively involved.25 Figure
4.2a and b shows SEM images of the surface morphologies and fractured cross-sections of sintered
pellets made from different weight ratios of small and large particles. Introducing a small amount
of larger particles with an average diameter of 10 μm into the small particles ( 1 μm diameter) in
the green body effectively suppressed the grain growth, resulting in dense pellets with a much
decreased grain size of about 20-40 μm across. A systematic study of the densification of the
packed green bodies consisting of bimodal distributions of particles with different ratios of 10 μm-
sized particles (10, 30 and 50 wt. %) was carried out. In all cases, the large grain growth seen when
only fine powders were used was suppressed. When the 10 m size particle content was 10 wt.%,
the green body was reasonably well sintered (Fig. 2c) with a relative density of 90%, close to the
92% found for pellets made exclusively from fine particles. The pellet exhibited a distribution of
grain sizes, with large ones about 20-40 m across surrounded by pockets of smaller ones less than
10 m in size. Fractured cross-section images of the pellets made from 10 wt % 10 m particles
are provided in Figure 2d. In comparison, densification was inhibited when larger amounts of the
10 m particles were used in the bimodal mixture. Specifically, the surface of the pellet made with
30 wt. % large particles in the mixture exhibited a distribution of small grains 4-5 m across along
with larger grains about 30 m in size (Fig. 2b). The pellet had an estimated relative density of

48
80%. Increasing the content of the 10 m particles in the green body resulted in poorer
densification (Table 4.1) of the sintered pellets. For the 50 wt. % mixture, the pellet was not fully
sintered; the open porosity is clearly visible in Fig. 2f and the grain size is between 10 and 20 m.
Because of their high relative densities, only pellets made from 90 wt. % fine powder (90% density)
with grain sizes averaging 20-40 m across (designated as LLZO_SG) and pellets made from 100%
fine powder (92% density) with grain sizes about 100-200 m across (designated as LLZO_LG),
were subjected to further study. In both cases, only closed and isolated pores were observed within
the pellets. Inductively coupled plasma optical emission spectroscopy (ICP-OES) indicated that
the overall chemical compositions of the two samples were similar: the chemical compositions are
Li5.98Al0.33La3Zr1.95O11.89 and Li5.92Al0.36La3Zr1.96O11.92 for LLZO_SG and LLZO_LG, respectively.
(Oxygen content was estimated from charge neutrality considerations). This is not surprising since
LLZO_SG and LLZO_LG pellets were both subjected to the same thermal treatment of sintering
at 1100 ºC for 12 h. The lattice parameters derived from the XRD patterns (Figure 4.3) were also
similar at 12.964(6) Å for LLZO_SG and 12.963(7) Å for LLZO_LG, further confirming
comparable overall chemical compositions. Chemical compositions by ICP-OES and lattice
parameters are provided in Tables 4.2 and 4.3.17,35
Figure 4.1. Schematic of ceramic processes for fabrication of LLZO pellets with large grains,
small grains and complex heterostructures with alternating large and small grain layer LLZO
electrolytes.
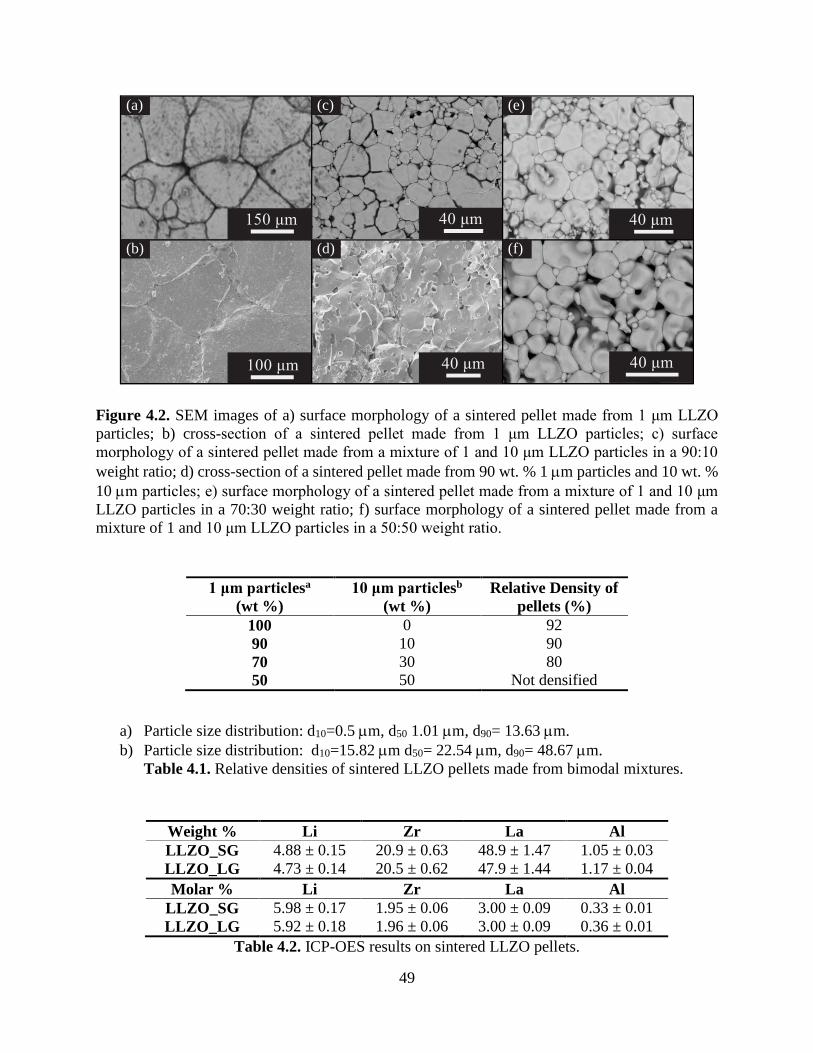
49
Figure 4.2. SEM images of a) surface morphology of a sintered pellet made from 1 μm LLZO
particles; b) cross-section of a sintered pellet made from 1 μm LLZO particles; c) surface
morphology of a sintered pellet made from a mixture of 1 and 10 μm LLZO particles in a 90:10
weight ratio; d) cross-section of a sintered pellet made from 90 wt. % 1 m particles and 10 wt. %
10 m particles; e) surface morphology of a sintered pellet made from a mixture of 1 and 10 μm
LLZO particles in a 70:30 weight ratio; f) surface morphology of a sintered pellet made from a
mixture of 1 and 10 μm LLZO particles in a 50:50 weight ratio.
1 μm particlesa
(wt %)
10 μm particlesb
(wt %)
Relative Density of
pellets (%)
100 0 92
90 10 90
70 30 80
50 50 Not densified
a) Particle size distribution: d10=0.5 m, d50 1.01 m, d90= 13.63 m.
b) Particle size distribution: d10=15.82 m d50= 22.54 m, d90= 48.67 m.
Table 4.1. Relative densities of sintered LLZO pellets made from bimodal mixtures.
Weight % Li Zr La Al
LLZO_SG 4.88 ± 0.15 20.9 ± 0.63 48.9 ± 1.47 1.05 ± 0.03
LLZO_LG 4.73 ± 0.14 20.5 ± 0.62 47.9 ± 1.44 1.17 ± 0.04
Molar % Li Zr La Al
LLZO_SG 5.98 ± 0.17 1.95 ± 0.06 3.00 ± 0.09 0.33 ± 0.01
LLZO_LG 5.92 ± 0.18 1.96 ± 0.06 3.00 ± 0.09 0.36 ± 0.01
Table 4.2. ICP-OES results on sintered LLZO pellets.
40 μm40 μm
40 μm100 μm 40 μm
(a)
(b)
(c)
(d)
(e)
(f)
150 μm

50
* Oxygen content estimated from charge balance considerations.
Table 4.3. Physical characteristics of sintered LLZO pellets.
Figure 4.3. XRD patterns of LLZO_SG pellet (top), LLZO_LG pellet (middle) and simulated
pattern of cubic LLZO based on reference 33.
By exploiting the uniquely different densified microstructures of LLZO_LG and
LLZO_SG samples, it was possible to fabricate LLZO solid electrolytes with complex
heterostructures. This was carried out by pressing and co-sintering three alternating layers of green
bodies composed of either the 90/10 bimodal distribution of 1 and 10 μm particles, or entirely
consisting of 1 μm particles. Figure 4.3 shows cross-section SEM images (colored for illustrative
purposes) of the pellets with an approximately 1 mm thick inner layer of small grains sandwiched
between 300 m thick surface layers of larger grains (designated LLZO_LG/SG/LG, Fig. 4.3a)
and an approximately 1 mm thick inner layer with large grains sandwiched between 200-300 m
10 20 30 40 50 60 70
calculated LLZO
LLZO-LG
Inte
nsity (
a.u
.)
2 ()
LLZO-SG
Pellet Color Lattice parameter Chemical composition*
LLZO_SG ivory 12.964(6) Å Li5.98Al0.33La3Zr1.95O11.89*
LLZO_LG ivory 12.963(7) Å Li5.92Al0.36La3Zr1.96O11.92*

51
thick surface layers with small grains (designated LLZO_SG/LG/SG, Fig. 4.4b). SEM images of
polished cross-sections at the layer junctions of LLZO_LG/SG/LG and LLZO_SG/LG/SG are
shown in Figure 4.4c and 4.4d, respectively. In the LLZO_LG/SG/LG pellet, large grains of about
200 μm are visible on the bottom and smaller grains of 20-40 μm on top. Larger grains of ~400
μm were also observed on the surface layer of the LLZO_LG/SG/LG sample. The enhanced grain
growth might be associated with the induced stress/strain of mismatched sintering of the
alternating layers. In the LLZO_SG/LG/SG sample, large grains of 100 μm can be easily observed,
tightly bonded with the layer composed of 20-40 μm-sized grains. The densities of the
LLZO_LG/SG/LG and SG/LG/SG heterostructures were 89% and 90%, respectively.
Figure 4.4. SEM cross-section images of: a) LLZO_LG/SG/LG heterostructure; b)
LLZO_SG/LG/SG heterostructure, c) magnified junction region of LG/SG/LG heterostructure; d
magnified junction region of SG/LG/SG heterostructure. (Heterostructures were colored for
illustrative purposes in Figures 4.4 a and b).
Total ionic conductivities of both LLZO_LG and LLZO_SG pellets are plotted vs
temperature in Figure 4.5a. The total ionic conductivity at room temperature and activation energy
of LLZO_SG were measured to be 2.5×10⁻⁴S/cm and 0.34 eV, slightly higher than the 2.0×10-
4S/cm and 0.32 eV found for LLZO_LG (summarized in Table 4.4). This observation agrees well
with the fact that higher activation energies have been measured for grain boundaries than in the
bulk for several lithium ion conductors, since LLZO_SG has a higher concentration of grain
boundaries than LLZO_LG. 15,17,36 Indeed, Tenhaeff et al. 37 have resolved the different
contributions of ionic conduction in bulk and grain boundary in a hot pressed LLZO solid
electrolyte. They reported that bulk resistance dominates at temperatures higher than -10 ºC,
suggesting that the grain boundary network conducts better than grains at temperatures above this
point. It has also been observed that the ionic conductivity of nano-crystalline LLZO is enhanced,
due to the very small grain sizes and larger concentration of grain boundaries.24

52
Figure 4.5. a) Arrhenius plot of total ionic conductivity; b) Nyquist plot of Li/LLZO/Li
symmetrical cells; c. galvanostatic cycling of Li/ LLZO /Li symmetrical cells, stepping the current
density from 46 μA∙cm−2 to 156 μA∙cm−2, with a step size of 22 μA∙cm−2.
Pellet Total Conductivity
(S/cm)
Activation Energy
(eV)
ASR
(Ω∙cm2)
LLZO_SG 2.5×10⁻⁴ 0.34 37
LLZO_LG 2.0×10⁻⁴ 0.32 130
SG/LG/SG n/a n/a 51
LG/SG/LG n/a n/a 227
Table 4.4. Total ionic conductivity at 25ºC, activation energy and interfacial area specific
resistances (ASRs) of LLZO pellets as a function of microstructure.
In the case of the LLZO_SG samples, the ionic conductivity at room temperature was only
moderately improved compared to LLZO_LG. However, the LLZO/Li interfacial transport was
much better. For the measurement of the interfacial resistances, LLZO_SG and LLZO_LG pellets
were polished in the same way to minimize the difference of surface roughness and sandwiched
between lithium electrodes. Figure 4.6 shows SEM images of the surface morphologies of
LLZO_LG and LLZO_SG pellets after polishing. Both of the cells containing LLZO_LG and
LLZO_SG showed one partial semicircle in the high frequency range and a complete semicircle
at lower frequencies in the Nyquist plots (Figure 4.5b). The semi-circles at high frequencies can
be assigned to the total resistance of the LLZO pellets based on comparison to the data obtained
on cells with blocking electrodes, and the low frequency semi-circles are attributable to the
resistances of the Li/LLZO interfaces. 15,38 The interface area specific resistance (ASR) for
Li/LLZO_SG was only 37 Ω∙cm2, one-third the value of LLZO_LG (130 Ω∙cm2). 13,14,19–21,39
Nyquist fitting results are provided in Table 4.5. Furthermore, this indicates that high interfacial
resistances are not intrinsic to Li/LLZO cells but are strongly correlated with the grain size and
can be reduced by engineering of the microstructure and grain boundaries.

53
Figure 4.6. SEM images of the surface morphologies of a) a polished LLZO_SG pellet and b) a
polished LLZO_LG pellet.
Sample Rpellet () Qpellet (10-12 F) Rinterface () Qinterface (10-6 F) χ2
LLZO_SG 1665 65.18 168 0.15 1.682×10⁻³
LLZO_LG 2100 89.62 566 1.99 5.569×10⁻³
Table 4.5. Fitting resistance and capacitances of LLZO_SG and LG pellets and interfaces in
Li/LLZO/Li, using (RpelletQpellet)(RinterfaceQinterface) equivalent circuit.
In addition to decreasing the interfacial resistance, the proper microstructure also positively
impacts the cycling behavior. A comparison of cycling performances using DC stepped current
cycling of symmetrical lithium cells containing LLZO_SG and LLZO_LG pellets is shown in
Figure 4.5c. The cell containing LLZO_SG performed much better in all aspects: critical current
density, over-potential, and cycling life-time. The potential of the Li/LLZO_SG/Li symmetrical
cell remains constant at ~0.04V at current densities of 46 μA∙cm−2 and increased linearly at
higher current densities. The potential agrees with the value predicted by AC impedance
experiments, indicating that the primary charge carriers are lithium ions. The voltage profile during
each step is flat for all current densities up to 134 μA∙cm−2; typical of the behavior of single ion
conductors. Above this value, the cell exhibited voltage instability and short circuited, consistent
with the formation of Li dendrites. 19 Thus, the critical current density for the cell containing the
LLZO_SG pellet was 134 μA∙cm−2. In comparison, the cell containing the LLZO_LG pellet
showed an unstable potential even at the lowest current density tested (46 μA∙cm−2). This is
probably a consequence of an over-potential increase due to significantly slower interfacial ionic
transport in LLZO_LG than LLZO_SG. The phenomenon is more severe at higher current densities.
An over-potential as high as ~0.08 V rapidly accumulated for this cell when the current density
was raised to 90 μA∙cm−2 and the cell shorted during the 2 h period at this current density. Thus
the critical current density was only 90 μA∙cm−2 compared to 134 μA∙cm−2 for the cell containing
LLZO_SG.
We speculated that the lower resistance at the interface between Li and LLZO associated
with the surface microstructure of LLZO_SG accounted for the improved electrochemical
properties. However, based solely on the experiments presented in Figure 4.5, we could not rule
out bulk effects. For this reason, we prepared the two different types of heterostructures described
earlier,which had thin surface regions with different microstructures from those in the thicker

54
interior. The role of the surface microstructure could then be compared by measuring symmetrical
cells containing the two different heterostructures; the one with the large grains on the outside
(LG/SG/LG) and the one with small grains outside (SG/LG/SG). The interfacial ASRs of the
symmetrical cells containing the heterostructured pellets are given in Table 4.4. While the ASR
for the cell containing LLZO_SG/LG/SG is 51 Ω∙cm2, slightly higher than the 37 Ω∙cm2 measured
for from LLZO_SG, the value increased to 227 Ω∙cm2 for LLZO_LG/SG/LG, which is higher than
that found in the LLZO_LG. This higher value may be related to the presence of the very large
grains 400 μm across at the surfaces of the LLZO_LG/SG/LG pellet. The study confirms that the
interfacial resistance between Li and LLZO is lower when the surface of the LLZO has a finer
microstructure and more grain boundaries. The cycling performances of cells containing
LLZO_SG, LLZO_LG, LLZO_LG/SG/LG and LLZO_SG/LG/SG solid electrolytes at a constant
current density of 46 μA∙cm−2 are shown in Figure 4.7. The cells containing LLZO_SG and
LLZO_SG/LG/SG behaved similarly: at 46 μA∙cm−2, both cycled stably with potentials of
0.03V and 0.04V, respectively, for more than 72 h with no signs of voltage instability or
short-circuiting. Cells with LLZO_LG and LLZO_LG/SG/LG exhibited poor performance at the
same current density: the cells exhibited voltage instability, fast over-potential build-up, and short-
circuited within 20 h and 15 h, respectively. The data for the cells containing LLZO_LG and
LLZO_LG/SG/LG suggest that the severe build-up of over potential during DC cycling is related
to slow ionic transport in the interface regions at the surface layers, which are composed of large
grains. 21 The short cycle lives of the cells containing LLZO with large grains at the surfaces may
be explained by detrimental current focusing due to inhomogeneous current distributions, which
causes rapid initiation of lithium dendrites at interfaces, a phenomenon extensively studied in
sodium beta alumina in the 1970-1980s. 40–44
Figure 4.7. Galvanostatic cycling of symmetrical cells at constant current densities of 46
μA∙cm−2 of a) Li/ LLZO_SG/Li; b) Li/ LLZO_LG/Li; c) Li/LLZO_SG_LG_SG/Li and d)
Li/LLZO_LG_SG_LG/Li.
At LLZO/Li interfaces, the DC ionic current flow is inhomogeneous because of differences
between the resistivities of the surface grains and grain boundaries. The lithium ion current
redistributes in such a way that low resistivity paths are favored and can lead to dendrite formation.
Lithium transport is known for its dependence on crystal facet orientation, which may further
impact current distribution in polycrystalline electrolytes. For example, Kim et al. observed that
the ionic conductivity varied with crystal orientation in epitaxial garnet type electrolyte films.45 A

55
wide distribution of intergranular/grain-boundary resistivities could also play an active role, as
highly conductive boundaries are favored for lithium ion transport over more resistive boundaries
and bulk grains. Thus, information pertaining to grain orientations and grain boundary mis-
orientations is critical in determining their contribution to the observed electrochemical behavior.
To this end, X-ray Laue micro-diffraction was used to probe the grain orientation and grain
boundary mis-orientation distribution in the top layer of surface grains in the LLZO_SG and
LLZO_LG solid electrolyte samples over a relatively large area (1 mm2). 46 The technique uses
white beam energy between 6 and 22 keV with a maximum X-ray penetration depth of 15 μm. The
surface grain sensitivity is assured by the indexing algorithm which ranks the measured reflections
according to their intensities, thus preferring surface grains over sub-surface grains whose
reflection intensities are reduced by absorption of the surface grains. A representative Laue
diffraction pattern for LLZO is shown in Figure 4.8. Histograms of the grain orientations of the
LLZO_LG and LLZO_SG samples are presented in Figure 4.9, and grain orientation maps
(1mm×1mm area) are displayed in Figure 4.9b and c, respectively. Neither the histogram nor the
grain orientation map reveals notable differences in LLZO_LG and LLZO_SG. For both samples,
the grain orientation is largely random. The mean grain orientation angle between the (100)
direction and sample normal is 31.90° with a standard deviation of 12.19° for LLZO_LG and 31.48°
with a standard deviation of 11.09° for LLZO_SG. The similar grain orientation distributions in
the two cases, therefore, do not contribute to the observed difference in the electrochemical
performance.
Figure 4.8. Laue diffraction pattern of LLZO_LG solid electrolyte.

56
Figure 4.9. a. Histograms of angles between grain orientation (100) direction and sample plane
normal for LLZO_LG (top) and LLZO_SG (bottom). b. Grain orientation mapping of LLZO_LG;
c. Grain orientation mapping of LLZO_SG.
Figure 4.10. a) Histograms of misorientation angles for LLZO_LG (top) and LLZO_SG (bottom);
b) and c) misorientation angle mapping of LLZO_LG and LLZO_SG.
It has been reported that low angle grain boundaries are preferred ion transport pathways
over high angle ones since the latter are energetically unstable, leading to radical local structure
and composition deviations as observed in lithium lanthanum titanate (LLTO) and LATP. 47,48 The
distribution of grain boundaries was analyzed by determining mis-orientation angles between
neighboring grains. The mean mis-orientation angle of LLZO_SG is 37.83° with a standard
deviation of 14.70° while it is 39.40° with a standard deviation of 13.60° for LLZO_LG (Figure
4.10). The similar values suggest that the improved electrochemical properties in LLZO_SG
compared to LLZO_LG are not attributable to differences in grain boundary distributions. It should,
however, be noted that glassy or crystalline secondary phases can form in energetically
unfavorable boundaries with typical thicknesses in the range of 2-100 nm, 31,49 beyond the
resolution of the 1 μm X-ray beam of the XRD experiment. These phases are generally Al rich
segregates that are less conductive. 17,31,50 It should also be noted here that upon sintering of
LLZO_SG and LG, the formation and distribution of these Al containing segregates may vary and
add in extra complexity in determining the current distribution. For example, the blocking
segregates may more uniformly distribute inside LLZO_SG compared to LLZO_LG sample. For
this regard, high resolution transmission electron microscopy is required for detailed observation
of the local structure and chemistry of grain boundary impurities, which needs special precautions,
such as fast scan rates and diffused irradiation area, to avoid electron beam damage in these
materials with highly mobile lithium ions. 47,51
Because both the grain orientation and grain boundary mis-orientation do not show notable
differences in our study, the improved interfacial resistance and cycling performance observed in
cells containing LLZO_SG can be attributed to a larger area fraction of low resistivity grain
200 μm
200 μm
(a) (b)
(c)
0 10 20 30 40 50 600.10
0.08
0.06
0.04
0.02
0.00
0.02
0.04
0.06
0.08
0.100 10 20 30 40 50 60
Num
be
r fr
action
Misorientation angle (degree)
Num
be
r fr
action

57
boundaries at the LLZO surfaces compared to LLZO_LG. The total surface grain boundary area
fraction is 32.2% for LLZO_SG and 16.5% for LLZO_LG, as estimated from SEM images (Figure
S4 ESI). The larger area of grain boundaries with low resistivity in LLZO_SG effectively dissipate
the ionic current densities and improve the ion transport when interfaced with lithium metal
electrodes. Further confirmation of conductive grain boundaries were observed in a shorted
LLZO_LG sample under an optical microscope. Figure 4.12 shows a cycled and shorted LLZO
bar. Lithium metal electrodes were placed on both end of the bar. Before cycling, the bar was
uniformly ivory color in appearance. After short-circuiting, a black color developed from one side
to the other. This is similar to what Sudo et al. had observed, 19 and they attributed the black
features as lithium dendrites. A magnified optical image reveals that the black features mainly
accumulate at grain boundaries. This suggests that during cycling of LLZO bar, lithium dendrites
primarily formed at grain boundaries as a result of focused current density there, further
confirmation of conductive grain boundaries.
Figure 4.11. SEM images of the surfaces of (a) LLZO_SG pellet and (b) LLZO_LG pellet. The
grain boundaries are visualized in (c) and (d) by converting gray-scale images to RGB color scales,
where grains are shown in blue and grain boundaries are in red and green. The fraction of grains
(vs. grain boundaries) is estimated as the total counts of blue pixels divided by the number of
image pixels.
150 μm 150 μm
150 μm150 μm
(a) (b)
(c) (d)

58
Figure 4.12. Optical images of a shorted LLZO bar. The inset is the image of the entire bar after
cycling and short-circuiting. (Lithium metal electrodes were placed on both ends of the bar and
then were peeled off for the imaging).
4.4 Conclusion We directly correlated the microstructures of solid ceramic electrolytes with interfacial
resistances and cycling performances in symmetrical cells containing them, using Al substituted
LLZO as a model system. We demonstrated a simple processing route for fabrication of complex
LLZO heterostructures with controlled compositions and microstructures. A very low interfacial
resistance of 37 Ω∙cm2 and greatly improved cycling performance were achieved for cells
containing samples with grain sizes about 20-40 m across compared to those with larger grains.
Our electrochemical results suggested that the type of microstructure at the solid electrolyte surface,
which interfaces with the lithium metal electrodes, is crucial to the transport properties and the
cycling life of the solid electrolyte. This was confirmed by using complex heterostructures, in
which the surfaces of the dense samples had differing microstructures than the bulk. High-
resolution synchrotron X-ray Laue micro diffraction was also used to probe and map the
distributions of grain orientation and mis-orientations of neighboring grains. No significant
differences were observed between samples with small grains and those with large grains. Thus,
we conclude that the better performance observed for small-grained samples can be attributed to
the larger relative amount of surface layer grain boundaries, rather than grain orientation and grain
boundary misorientation effects. The electrochemical properties, especially interfacial resistances
and electrical cycling performance of dense LLZO solid electrolytes in lithium cells are strongly
influenced by the microstructures and grain boundaries at the interfaces. These insights indicate
that LLZO solid electrolytes should have small grains and multiple grain boundaries to ensure the
successful development of durable high-energy lithium metal batteries containing them. Further
work will be directed towards understanding the enhanced ionic transport at the grain boundaries,
particularly their chemical and structural natures.
1 mm

59
4.5 References
1. G. Girishkumar, B. McCloskey, A. C. Luntz, S. Swanson, and W. Wilcke, J. Phys. Chem.
Lett., 2010, 1, 2193–2203.
2. X. Ji, K. T. Lee, and L. F. Nazar, Nat. Mater., 2009, 8, 500–6.
3. K. G. Gallagher, S. Goebel, T. Greszler, M. Mathias, W. Oelerich, D. Eroglu, and V.
Srinivasan, Energy Environ. Sci., 2014, 7, 1555.
4. W. Xu, J. Wang, F. Ding, X. Chen, E. Nasybulin, Y. Zhang, and J.-G. Zhang, Energy Environ.
Sci., 2014, 7, 513.
5. K. Takada, Acta Mater., 2013, 61, 759–770.
6. H. Aono, J. Electrochem. Soc., 1990, 137, 1023–1027.
7. P. Knauth, Solid State Ionics, 2009, 180, 911–916.
8. N. Kamaya, K. Homma, Y. Yamakawa, M. Hirayama, R. Kanno, M. Yonemura, T.
Kamiyama, Y. Kato, S. Hama, K. Kawamoto, and A. Mitsui, Nat. Mater., 2011, 10, 682–6.
9. P. Hartmann, T. Leichtweiss, M. R. Busche, M. Schneider, M. Reich, J. Sann, P. Adelhelm,
and J. Janek, J. Phys. Chem. C, 2013, 117, 21064–21074.
10. S. P. Ong, Y. Mo, W. D. Richards, L. Miara, H. S. Lee, and G. Ceder, Energy Environ. Sci.,
2013, 6, 148–156.
11. R. Murugan, V. Thangadurai, and W. Weppner, Angew. Chem. Int. Ed. Engl., 2007, 46,
7778–81.
12. V. Thangadurai, S. Narayanan, and D. Pinzaru, Chem. Soc. Rev., 2014, 43, 4714–27.
13. E. Rangasamy, G. Sahu, J. Keum, A. Rondinone, N. Dudney, and C. Liang, J. Mater. Chem.
A, 2014, 2, 4111–4116.
14. Z. Liu, W. Fu, E. A. Payzant, X. Yu, Z. Wu, N. J. Dudney, J. Kiggans, K. Hong, A. J.
Rondinone, and C. Liang, J. Am. Chem. Soc., 2013, 135, 975–978.
15. H. Buschmann, J. Dölle, S. Berendts, A. Kuhn, P. Bottke, M. Wilkening, P. Heitjans, A.
Senyshyn, H. Ehrenberg, A. Lotnyk, V. Duppel, L. Kienle, and J. Janek, Phys. Chem. Chem.
Phys., 2011, 13, 19378–92.

60
16. S. Ohta, S. Komagata, J. Seki, T. Saeki, S. Morishita, and T. Asaoka, J. Power Sources,
2013, 238, 53–56.
17. L. Cheng, J. S. Park, H. Hou, V. Zorba, G. Chen, T. Richardson, J. Cabana, R. Russo, and M.
Doeff, J. Mater. Chem. A, 2014, 2, 172–181.
18. M. Kotobuki, H. Munakata, K. Kanamura, Y. Sato, and T. Yoshida, J. Electrochem. Soc.,
2010, 157, A1076.
19. R. Sudo, Y. Nakata, K. Ishiguro, M. Matsui, A. Hirano, Y. Takeda, O. Yamamoto, and N.
Imanishi, Solid State Ionics, 2014, 262, 151–154.
20. K. Ishiguro, Y. Nakata, M. Matsui, I. Uechi, Y. Takeda, O. Yamamoto, and N. Imanishi, J.
Electrochem. Soc., 2013, 160, A1690–A1693.
21. L. Cheng, E. J. Crumlin, W. Chen, R. Qiao, H. Hou, S. Franz Lux, V. Zorba, R. Russo, R.
Kostecki, Z. Liu, K. Persson, W. Yang, J. Cabana, T. Richardson, G. Chen, and M. Doeff, Phys.
Chem. Chem. Phys., 2014, 16, 18294–18300.
22. S. J. Harris and P. Lu, J. Phys. Chem. C, 2013, 117, 6481–6492.
23. H. L. Tuller and M. Balkanski, Eds., Science and Technology of Fast Ion Conductors,
Springer US, Boston, MA, 1990, vol. 199.
24. J. Sakamoto, E. Rangasamy, H. Kim, Y. Kim, and J. Wolfenstine, Nanotechnology, 2013, 24,
424005.
25. Y. Jin and P. J. McGinn, J. Power Sources, 2013, 239, 326–331.
26. H. Buschmann, S. Berendts, B. Mogwitz, and J. Janek, J. Power Sources, 2012, 206, 236–
244.
27. M. Huang, T. Liu, Y. Deng, H. Geng, Y. Shen, Y. Lin, and C.-W. Nan, Solid State Ionics,
2011, 204-205, 41–45.
28. D. Rettenwander, C. A. Geiger, M. Tribus, P. Tropper, and G. Amthauer, Inorg. Chem.,
2014, 53, 6264–9.
29. E. Rangasamy, J. Wolfenstine, and J. Sakamoto, Solid State Ionics, 2012, 206, 28–32.
30. R. Murugan, V. Thangadurai, and W. Weppner, Appl. Phys. A, 2008, 91, 615–620.
31. Y. Li, Z. Wang, C. Li, Y. Cao, and X. Guo, J. Power Sources, 2014, 248, 642–646.
32. D. Rettenwander, P. Blaha, R. Laskowski, K. Schwarz, P. Bottke, M. Wilkening, C. A.
Geiger, and G. Amthauer, Chem. Mater., 2014, 26, 2617–2623.

61
33. C. A. Geiger, E. Alekseev, B. Lazic, M. Fisch, T. Armbruster, R. Langner, M. Fechtelkord,
N. Kim, T. Pettke, and W. Weppner, Inorg. Chem., 2011, 50, 1089–97.
34. N. Tamura, in Strain and Dislocation Gradients from Diffraction, eds. R. Barabash; and G.
Ice, Imperial College Press, 2014, pp. 125–155.
35. R. Djenadic, M. Botros, C. Benel, O. Clemens, S. Indris, A. Choudhary, T. Bergfeldt, and H.
Hahn, Solid State Ionics, 2014, 263, 49–56.
36. C. R. Mariappan, M. Gellert, C. Yada, F. Rosciano, and B. Roling, Electrochem. commun.,
2012, 14, 25–28.
37. W. E. Tenhaeff, E. Rangasamy, Y. Wang, A. P. Sokolov, J. Wolfenstine, J. Sakamoto, and N.
J. Dudney, ChemElectroChem, 2013, 1, 375–378.
38. L. Zhang, L. Cheng, J. Cabana, G. Chen, M. M. Doeff, and T. J. Richardson, Solid State
Ionics, 2013, 231, 109–115.
39. H. Buschmann, J. Dolle, S. Berendts, A. Kuhn, P. Bottke, M. Wilkening, P. Heitjans, A.
Senyshyn, H. Ehrenberg, A. Lotnyk, V. Duppel, L. Kienle, and J. Janek, Phys. Chem. Chem.
Phys., 2011, 13, 19378–19392.
40. R. D. Armstrong, T. Dickinson, and J. Turner, Electrochim. Acta, 1974, 19, 187–192.
41. L. C. De Jonghe, J. Mater. Sci., 1979, 14, 33–48.
42. R. Ansell, J. Mater. Sci., 1986, 21, 365–379.
43. A. C. Buechele, L. C. De Jonghe, and D. Hitchcock, J. Electrochem. Soc., 1983, 130, 1042–
1049.
44. L. A. Feldman and L. C. Jonghe, J. Mater. Sci., 1982, 17, 517–524.
45. S. Kim, M. Hirayama, S. Taminato, and R. Kanno, Dalton Trans., 2013, 42, 13112–7.
46. M. Kunz, N. Tamura, K. Chen, A. A. MacDowell, R. S. Celestre, M. M. Church, S. Fakra, E.
E. Domning, J. M. Glossinger, J. L. Kirschman, G. Y. Morrison, D. W. Plate, B. V Smith, T.
Warwick, V. V Yashchuk, H. A. Padmore, and E. Ustundag, Rev. Sci. Instrum., 2009, 80,
035108.
47. C. Ma, K. Chen, C. Liang, C.-W. Nan, R. Ishikawa, K. More, and M. Chi, Energy Environ.
Sci., 2014, 7, 1638.
48. M. Gellert, K. I. Gries, C. Yada, F. Rosciano, K. Volz, and B. Roling, J. Phys. Chem. C,
2012, 116, 22675–22678.

62
49. F. Aguesse, J. M. López del Amo, V. Roddatis, A. Aguadero, and J. A. Kilner, Adv. Mater.
Interfaces, 2014, 1, 1300143.
50. Y. Ren, H. Deng, R. Chen, Y. Shen, Y. Lin, and C.-W. Nan, J. Eur. Ceram. Soc., 2015, 35,
561–572.
51. F. Lin, I. M. Markus, M. M. Doeff, and H. L. Xin, Sci. Rep., 2014, 4, 5694.

63
5. Stabilization of LLZO surfaces exposed to air
5.1 Introduction One of the advantages of all solid-state rechargeable lithium batteries over conventional
Li-ion configurations is the superior safety due to reduced risk of electrolytic solution leakage and
the non-flammability of inorganic solid electrolytes. Moreover, the use of highly efficient solid
packaging achieved by novel architectures both at the cell and stack levels results in less dead
space, translating to improved energy density.1 The critical scientific challenge in the development
of all solid-state batteries centers on the solid electrolyte material, which must have high ionic
conductivity, good chemical stability, and compatibility with electrode materials so that interfacial
resistances are low. The selection of solid electrolyte candidate materials is quite limited by these
stringent requirements. For example, highly conductive Li1+xAlxTi2-x(PO4)3 (LATP)2,3 and
Li10GeP2S12 (LGPS)4 are hindered by instability against reduction by lithium metal,5,6 and
chemically stable phases such as LIPON7 and Li4SiO4-Li3PO4 8,9 are handicapped by low inherent
ionic conductivity. In contrast, the highly conductive cubic phase Li7La3Zr2O12 (LLZO) emerges
as a suitable candidate due to its chemical stability with respect to reduction versus lithium, and
high ionic conductivity.10,11,12 However, high resistances at Li/LLZO interfaces currently impede
further development of this material, necessitating a more detailed understanding of the origin of
resistive interfaces.
One partially successful approach to decrease interfacial resistance is to apply external
pressure as high as 300 MPa to improve the physical contacts between solid electrolyte and the
lithium metal electrode.13 However, such a high pressure is not practical in practical devices.
Another proposed strategy is to develop an ionically conductive coating to enhance the interfacial
transport properties. This has met with some success in other solid electrolyte systems,14 but has
not been reported for garnet solid electrolytes because of the lack of a candidate material that can
integrate high ionic conductivity with superior chemical stability. Recently, Cheng et al. showed
that the large resistance at Li/LLZO interfaces is not inherent to the material but originates from a
thin layer of Li2CO3 that forms on LLZO surfaces due to exposure to ambient air: a layer 10-100
nm thick can increase the interfacial resistance by an order of magnitude.15 A polishing process in
a protected environment, e.g. Ar, can effectively remove the surface Li2CO3, which results in
greatly improved interfacial properties. However, polishing in a protected environment is not
practical or cost-effective for mass production. Thus, efforts to lower the interfacial resistance
should be directed towards effective suppression of Li2CO3 formation upon brief air exposures
that may occur during processing.
Herein, we reveal the interrelationships between grain-size, surface composition, surface
air-stability and interfacial resistance of LLZO solid electrolytes. Specifically, we report that the
chemical tolerance of LLZO pellets towards exposure to ambient air can be tuned through ceramic
engineering, so that the formation of surface Li2CO3 is effectively suppressed and low interfacial
resistance is maintained even after samples are exposed to air. This obviates the need for polishing
and simplifies the processing of LLZO materials into forms appropriate for use in electrochemical
devices, bringing garnet solid electrolytes a step closer to practical application in solid-state
batteries.

64
5.2 Experiments LLZO pristine powder was prepared from Li2CO3, Al2O3, ZrO2 and La(OH)3 using a solid-
state reaction as reported in our previous work.16 The as-prepared fresh powder was ground and
then attrition milled at 450 RPM for 2 h with 2 mm diameter ZrO2 media in isopropyl alcohol
(IPA). The attrition-milled powder was mixed with fresh powder to make small-grained samples
or used as-is for the large-grained samples. Pellets were made by cold uniaxial pressing using a
3/8 inch stainless dye without binder. Dense large- and small-grained LLZO pellets were prepared
following procedures reported in reference 22. Typical dimensions of the pellets were around 1.1
mm thick and 7.8 mm in diameter. Pellets designated P_LLZO_S and P_LLZO_L were polished
using 400 and 600 grit number polishing paper in an Ar glove box with O2 and moisture level both
at 0.1 ppm. After the polishing procedure, some of the pellets were transferred out of glove box to
expose them to air for different periods of time. ICP-OES measurements of P_LLZO_L and
P_LLZO_S were carried out at Evans Analytical Group. Surface images of the LLZO pellets were
obtained by scanning electron microscopy (SEM) using a JEOL-7500F field emission microscope
or a HITACHI TM-1000 tabletop microscope, using secondary electron imaging (SEI) mode.
AC impedance measurements were obtained on the dense pellets using a VMP3
multichannel potentiostat/galvanostat (Bio-Logic Science Instruments) equipped with frequency
response analyzers. Soft metallic lithium was first spread on both sides of the dense pellet.
Afterwards, the pellet was assembled in a Swagelok-type cell between lithium foil disks on both
sides. Physical contacts were maintained by compression of the spring at controlled displacement
in the Swagelok cell with an estimated pressure of 200 kPa, derived from considering the spring
displacement and spring constant. Samples were assembled in the same Swagelok cell with
controlled displacement so that similar pressures were used for each. Impedance data were
collected at frequencies from 1 MHz to 1 Hz.
O K-edge soft X-ray absorption spectroscopy (sXAS) experiments were performed at
undulator beamline 8.0.1 at the Advanced Light Source, Lawrence Berkeley National Laboratory.
The intense photon beam from a spherical grating monochromator gives an energy resolution
better than 0.2 eV. Spectra were collected using both surface-sensitive total electron yield (TEY)
and bulk-sensitive total fluorescence yield (TFY) at ambient temperature. All the spectra have
been normalized to the beam flux measured by the upstream gold mesh.
Raman spectra of the pellets were recorded on a "Labram" Raman confocal microscope
system (ISA Groupe Horiba) in the confocal backscattering configuration with a 488 nm Argon
ion laser (Coherent Inc. Innova 70), a plan olympus 10x magnification, a 0.25 numerical aperture
objective lense and a 22 focal length. The beam intensity was adjusted to 0.1 mW for a beam
diameter of 2 µm.
XPS studies of the polished LLZO pellets were performed using a PHI 5400 XPS system
equipped with an Al X-ray source (incident photon energy of 1486.7 eV). XPS samples were
sealed in a sample transfer tool under Ar environment. The aperture size was set to 1.1 mm in
diameter. The binding energy of the obtained XPS spectra was calibrated with respect to the C 1s
peak of adventitious carbon at 284.8 eV. XPS spectra were quantitatively analyzed by

65
deconvoluting Voigt-type line-shapes, preceded by subtracting Shirley-type background (for Zr
3d spectra) and linear background (for Al 2p and Li 1s spectra).
5.3 Computational First-principles total energy calculations were carried out using density functional theory
and the projector augmented-wave (PAW) approach as implemented in the Vienna ab initio
simulation package (VASP).17.18,19 The generalized gradient approximation (GGA) of Perdew-
Burke-Ernzerhof (PBE) was used to approximate the electronic change and correlation.20 The
structures for the original LLZO and Al-substituted LLZO were taken from the Inorganic Crystal
Structure Database (ICSD) (Collection code: 422259 and 185539) The Li and Al atoms were
ordered in a supercell using the Python Materials Genomics (pymatgen) code with experimental
site occupancies reported from ICSD. All configurations were enumerated so that 2 Li atoms and
1 O atom were removed from the starting LLZO structure. The lowest electrostatic energy
configuration was chosen for the LLZO structure after reaction (denoted as Li54La24Zr16O55).
These structures were fully relaxed to converge the final energy within 5 meV per formula unit.
The plane wave energy cutoff was 520 eV and the Brillouin-zone was sampled at the Γ-point.
The total energies for Li2O, Li2CO3 and LiOH were taken from the Materials Project. These
calculations were performed using a compatible set of parameters with the calculations in the
current study. The calculated formation enthalpies for all compounds were referenced using a
thermodynamic framework that corrects the DFT errors in gases and aqueous states. We used the
experimental Gibbs free energies for the gas phase H2O and CO2 in following thermodynamic
calculations.
5.4 Results and Discussion We have previously reported details of the fabrication of small- and large-grained dense
Al-substituted LLZO pellets.22 Figure 5.1 shows the scanning electron microscopy (SEM) images
of the surface morphologies of as-sintered samples with different grain sizes, as well as those aged
for six months in an ambient air environment. It is clear that the surfaces changed after the extended
period of air exposure. Both small- and large-grained LLZO pellets show evidence of reaction
layers, which obscured the grain and grain boundary features, preventing clear imaging. The
phenomenon of surface morphology change is very similar to what Yin et al. observed: a reaction
layer forms on garnet electrolyte after one week of air exposure.23

66
Figure 5.1. SEM surface morphologies of a) as-sintered large-grained LLZO, b) large-grained
LLZO after 6 month aging in ambient air, c) as-sintered small-grained LLZO, and d) small-grained
LLZO after 6 months aging in ambient air.
To evaluate the impact of air exposure on the interfacial resistances, small- and large-
grained LLZO pellets were both carefully polished in an Ar atmosphere to minimize variations in
surface roughness. These samples are designated P_LLZO_S and P_LLZO_L for small- and large-
grained pellets, respectively. Some of the polished pellets were transferred out of the glovebox and
stored in air for either 24 h or 6 months. These air-exposed small- and large-grained LLZO pellets
are designated E_LLZO_S24h, E_LLZO_L24h and E_LLZO_S6m, E_LLZO_L6m (Table 5.1).
The resistances of LLZO/Li interfaces were determined by AC-impedance. Measurements were
carried out on symmetrical cells containing pristine LLZO samples and those exposed to air for 24
h and 6 months, sandwiched between non-blocking lithium electrodes. The Nyquist plots,
equivalent circuits, and results of the fittings are provided in Figure 5.2 and Table 5.2. A partial
semicircle in the high frequency range and a complete semicircle in the lower frequency range
were observed in Nyquist plots for both the pristine samples and the air-exposed samples. The area
specific interfacial resistances (ASRs) were then determined using the low frequency semicircle,
following the procedures described in references 9,15, and 16. The ASRs determined for cells
containing the pristine and air-exposed samples are also plotted in Figure 5.2c for comparison.
This shows that there was a nearly one order of magnitude increase in the ASR, from 103 Ω cm2
to 880 Ω cm2 for the large-grained sample after 24 hours of exposure to air. In contrast, the increase
for the small-grained sample was much slighter; 64 Ω cm2 measured for 24h exposure sample
E_LLZO_S24h compared to 38 Ω cm2 of un-exposed pristine sample. The impedance data for
symmetrical cells containing 6-month exposure samples of E_LLZO_L6m and E_LLZO_S6m are
provided in Figure 5.3. These Nyquist plots are similar to those previously reported for cells
containing exposed samples, 24, 25 and show a considerable increase in the total impedance
compared to the pristine samples and those exposed to air for 24 h. Nevertheless, small-grained
50 μm
40 μm
(a)
(b)
(c)
(d)
100 μm
100 μm
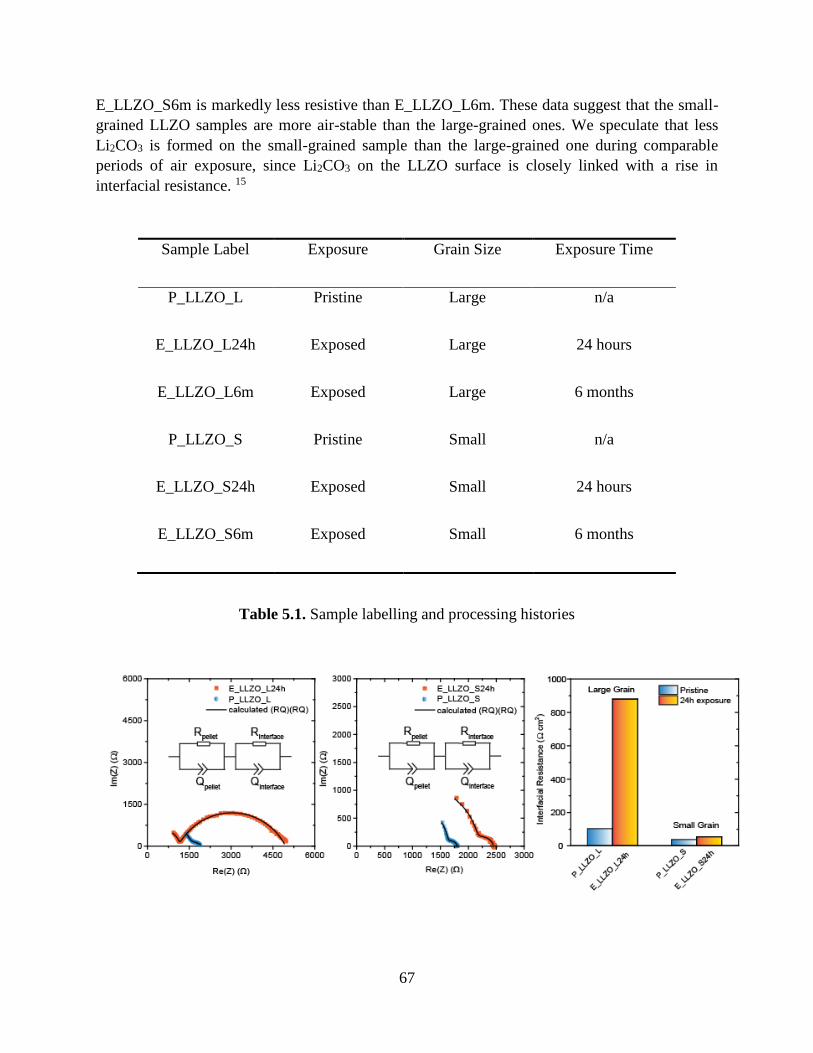
67
E_LLZO_S6m is markedly less resistive than E_LLZO_L6m. These data suggest that the small-
grained LLZO samples are more air-stable than the large-grained ones. We speculate that less
Li2CO3 is formed on the small-grained sample than the large-grained one during comparable
periods of air exposure, since Li2CO3 on the LLZO surface is closely linked with a rise in
interfacial resistance. 15
Sample Label Exposure Grain Size Exposure Time
P_LLZO_L Pristine Large n/a
E_LLZO_L24h Exposed Large 24 hours
E_LLZO_L6m Exposed Large 6 months
P_LLZO_S Pristine Small n/a
E_LLZO_S24h Exposed Small 24 hours
E_LLZO_S6m Exposed Small 6 months
Table 5.1. Sample labelling and processing histories

68
Figure 5.2. Nyquist plots of impedance data of Li/LLZO/Li cells containing a) P_LLZO_L and
E_LLZO_L24h and b) P_LLZO_S and E_LLZO_S24h; c) Area specific interfacial resistances
(ASRs) of pristine LLZO samples and those exposed to air for 24 h.
Sample Rpellet () Qpellet (10-12 F) Rinterface () Qinterface (10-6 F) χ2 Interfacial
Resistance
( cm2)
P_LLZO_S 1635 65.15 164 0.16 1.674×10⁻³ 38
E_LLZO_S24h 2174 83.80 278 0.13 2.238×10⁻³ 64
P_LLZO_L 1495 141.30 446 1.9 0.519×10⁻³ 103
E_LLZO_L24h 1114 111.60 3835 0.85 7.623×10⁻³ 880
Table 5.2. EIS fitting of Li/LLZO/Li symmetrical cells.
0 1x10⁶
2x10⁶
3x10⁶
0
1x10⁶
2x10⁶
3x10⁶
E_LLZO_L6m
E_LLZO_S6m
Im(Z
) (
)
Re(Z) ()

69
Figure 5.3. Nyquist plots of Li/LLZO/Li symmetrical cells containing E_LLZO_L6m and
E_LLZO_S6m.
To investigate details of the Li2CO3 formation and how microstructure affects it, several
techniques were used to probe various sample depths. To qualitatively estimate the Li2CO3 content
formed on both E_LLZO_S24h and E_LLZO_L24h surfaces after a short period of air exposure,
soft X-ray absorption spectroscopy (sXAS) was employed. The spot size of the X-ray is
approximately 1.5 mm for these experiments. In surface sensitive total electron yield mode (TEY),
approximately a 10 nm depth near the surface is measured for this experimental setup and sample
type, whereas in total fluorescence yield mode (TFY) ~100 nm is probed. Figure 3 shows the
normalized O K-edge spectra of the unexposed LLZO reference (P_LLZO_L, pristine LLZO),
Li2CO3 reference, E_LLZO_L24h (large grained sample after 24h air exposure) and
E_LLZO_S24h (small grained sample after 24h air exposure), collected in both TEY and TFY
modes. The Li2CO3 reference has a major absorption peak at 534 eV, which is assigned to the O
1s to π* (C=O) transition.26 The leading edge of the LLZO reference is located at a lower energy
of 533 eV. In the surface sensitive TEY mode, the E_LLZO_L24h spectrum resembles that of the
Li2CO3 reference, suggesting that the sample was completely covered by Li2CO3 to a depth of
several nanometers. The spectrum of the E_LLZO_S24h sample is slightly different: although a
strong peak due to Li2CO3 is also observed, the broad shoulder peak at 533 eV is still evident,
indicating less complete coverage of the surface with Li2CO3 than in the case of the large-grained
sample. The TFY mode, which probes more deeply, was also used to compare the samples. Both
show clear absorption features of LLZO and Li2CO3 at 533 eV and 534 eV respectively, suggesting
that the coverage of Li2CO3 is less than 100 nm deep in both cases. A very intense LLZO peak is
observed in the spectrum of the exposed E_LLZO_S24h sample, which also has a relatively weak
Li2CO3 feature, while in the spectrum of E_LLZO_L24h, the two peaks have similar intensities.
Extra details can be extracted from the peak de-convolution in the expanded region of the TFY O
K-edge spectra, shown in Figure 5.4 (c). The Li2CO3 to LLZO peak area ratio in the spectrum of
E-LLZO_S24h is 0.96 while that for the LLZO_LG spectrum is 1.33, a higher value. Thus, the
TFY O K-edge spectra confirm that the E_LLZO_S24h (small grained sample after 24 h air
exposure) surface is covered with less Li2CO3 than the E_LLZO_L24h (large grained sample after
24 h air exposure) one. This, in turn, confirmed lower air reactivity for the small-grained sample
compared to the large-grained one, in good agreement with impedance data.

70
Figure 5.4. (a) and (b) Normalized O K-edge XAS spectra of P_LLZO_L reference (bottom), air-
exposed E_LLZO_S24h (second from bottom), E_LLZO_L24h (second from top) and Li2CO3
reference (top) collected in TEY and TFY modes; (c) expanded region of the O K-edge spectra of
E_LLZO_L24h and E_LLZO_S24h samples with fitted LLZO and Li2CO3 peaks.
In the case of the samples exposed to air for six months, sXAS experiments are not likely
to be informative, as the thickness of the Li2CO3 layer may exceed the maximum probing depth.
Laser induced breakdown spectroscopy (LIBS) 15,17 experiments have previously shown that the
Li2CO3 layer is ~1m deep on LLZO pellet surfaces after several months exposure time. Raman
spectroscopy, on the other hand, is particularly suitable for probing these species at this length
scale. Moreover, as the Raman scattering intensity is directly proportional to the number of
molecules, the peak intensity ratio related to different species can be used for quantitative analysis. 27 Figure 5.5 shows typical Raman spectra of the E_LLZO_S6m (small grained sample aftere 6
month air exposure) and E_LLZO_L6m (large grained sample after 6 month air exposure) pellets
and Li2CO3 reference.28 LLZO spectra are in agreement with the literature and previous reports, 29
with the strongest peak at 640 cm-1 assigned to vibrational stretching modes of ZrO6 octahedral
units and the peak at ~1100 cm-1 assigned to Li2CO3. 29,30,31
. Raman spectra were collected at 15
different locations on each sample and normalized to the LLZO peak at 640 cm-1. The averaged
relative peak area ratios of Li2CO3 to LLZO are presented in Table 5.3. A 9.3% 2.4% peak
intensity ratio was determined for the 6-month-exposure E_LLZO_L6m and a value about two
times lower (4.9% 1.2%) for E_LLZO_S6m. This clearly confirms that less Li2CO3 is formed
on the E_LLZO_S6m surface compared to the E_LLZO_L6m surface after 6 months of air
exposure.

71
Figure 5.5. Typical Raman spectra of E_LLZO_S6m (bottom), E_LLZO_L6m (middle) and
Li2CO3 reference (top). LLZO Spectra were normalized to the peak at 640 cm-1.
Table 5.3. Average Raman peak ratios of Li2CO3 to LLZO peaks. * The value is calculated by
averaging values of 15 different points on each sample. Maximum and minimum are 14.5% and
6.5% for E_LLZO_L6m, 5.2% and 3.4% for E_LLZO_S6m respectively.
Evidence from the sXAS and Raman spectroscopy experiments together confirmed that the
amount of Li2CO3 formed during air exposure differs depending on the grain size of the LLZO
samples. This suggests that there may be differences in the surface chemistry of the two types of
samples, presuming that the formation of Li2CO3 can only be initiated on clean dense LLZO
surfaces when a carbon source (CO2) is present and in contact. We used surface-sensitive XPS to
study the surface compositions of pristine P_LLZO_L and P_LLZO_S samples to obtain more
information. The X-ray beam size for these experiments is about 1.1 × 1.1 mm in area, similar to
the beam footprint of sXAS. The probing depth of the XPS is estimated to be 2-3 nm considering
electron inelastic mean-free path in inorganic mateiral.32 The Zr 3d, Li 1s, and Al 2p XPS spectra
Sample Average Li2CO3/LLZO
peak ratio (%)*
E_LLZO_L6m 9.3 ± 2.4
E_LLZO_S6m 4.9 ± 1.2
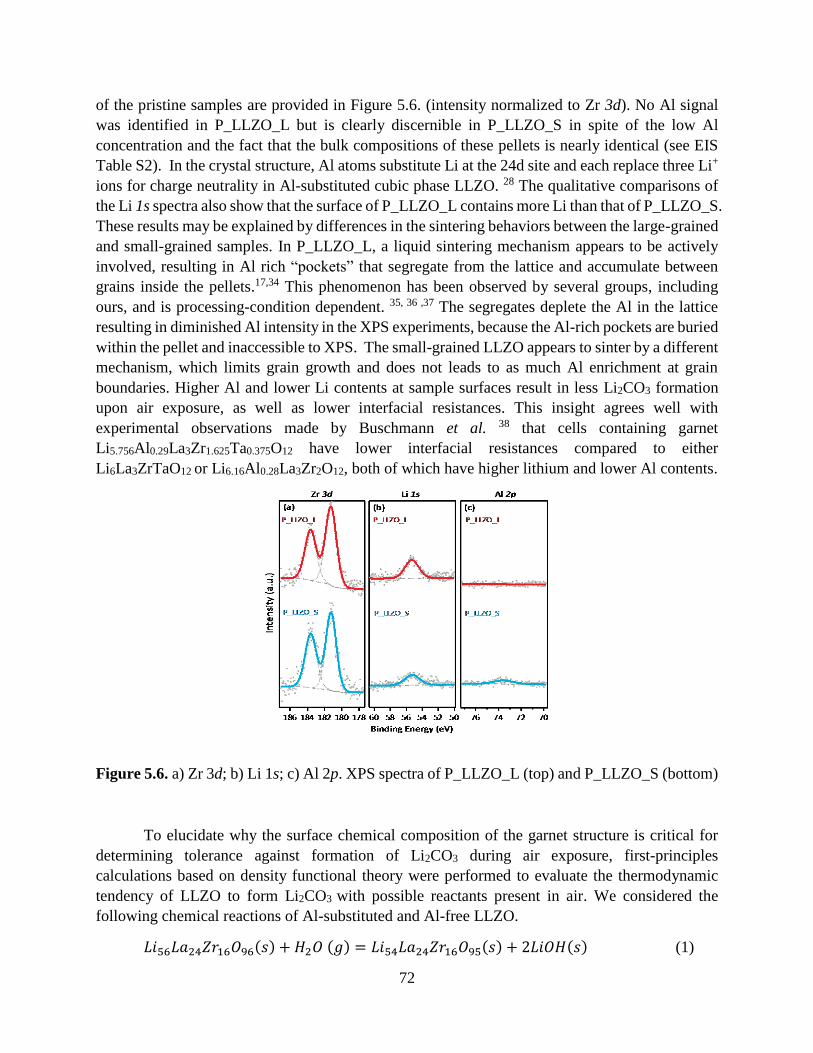
72
of the pristine samples are provided in Figure 5.6. (intensity normalized to Zr 3d). No Al signal
was identified in P_LLZO_L but is clearly discernible in P_LLZO_S in spite of the low Al
concentration and the fact that the bulk compositions of these pellets is nearly identical (see EIS
Table S2). In the crystal structure, Al atoms substitute Li at the 24d site and each replace three Li+
ions for charge neutrality in Al-substituted cubic phase LLZO. 28 The qualitative comparisons of
the Li 1s spectra also show that the surface of P_LLZO_L contains more Li than that of P_LLZO_S.
These results may be explained by differences in the sintering behaviors between the large-grained
and small-grained samples. In P_LLZO_L, a liquid sintering mechanism appears to be actively
involved, resulting in Al rich “pockets” that segregate from the lattice and accumulate between
grains inside the pellets.17,34 This phenomenon has been observed by several groups, including
ours, and is processing-condition dependent. 35, 36 ,37 The segregates deplete the Al in the lattice
resulting in diminished Al intensity in the XPS experiments, because the Al-rich pockets are buried
within the pellet and inaccessible to XPS. The small-grained LLZO appears to sinter by a different
mechanism, which limits grain growth and does not leads to as much Al enrichment at grain
boundaries. Higher Al and lower Li contents at sample surfaces result in less Li2CO3 formation
upon air exposure, as well as lower interfacial resistances. This insight agrees well with
experimental observations made by Buschmann et al. 38 that cells containing garnet
Li5.756Al0.29La3Zr1.625Ta0.375O12 have lower interfacial resistances compared to either
Li6La3ZrTaO12 or Li6.16Al0.28La3Zr2O12, both of which have higher lithium and lower Al contents.
Figure 5.6. a) Zr 3d; b) Li 1s; c) Al 2p. XPS spectra of P_LLZO_L (top) and P_LLZO_S (bottom)
To elucidate why the surface chemical composition of the garnet structure is critical for
determining tolerance against formation of Li2CO3 during air exposure, first-principles
calculations based on density functional theory were performed to evaluate the thermodynamic
tendency of LLZO to form Li2CO3 with possible reactants present in air. We considered the
following chemical reactions of Al-substituted and Al-free LLZO.
𝐿𝑖56𝐿𝑎24𝑍𝑟16𝑂96(𝑠) + 𝐻2𝑂 (𝑔) = 𝐿𝑖54𝐿𝑎24𝑍𝑟16𝑂95(𝑠) + 2𝐿𝑖𝑂𝐻(𝑠) (1)

73
𝐿𝑖56𝐿𝑎24𝑍𝑟16𝑂96(𝑠) + 𝐶𝑂2(𝑔) = 𝐿𝑖54𝐿𝑎24𝑍𝑟16𝑂95(𝑠) + 𝐿𝑖2𝐶𝑂3 (2)
𝐿𝑖50𝐴𝑙2𝐿𝑎24𝑍𝑟16𝑂96(𝑠) + 𝐻2𝑂 (𝑔) = 𝐿𝑖48𝐴𝑙2𝐿𝑎24𝑍𝑟16𝑂95(𝑠) + 2𝐿𝑖𝑂𝐻 (3)
𝐿𝑖50𝐴𝑙2𝐿𝑎24𝑍𝑟16𝑂96(𝑠) + 𝐶𝑂2(𝑔) = 𝐿𝑖48𝐴𝑙2𝐿𝑎24𝑍𝑟16𝑂95(𝑠) + 𝐿𝑖2𝐶𝑂3 (4)
The formation of LiOH or Li2CO3 from these reactions is accompanied by the loss of Li in
LLZO, and presumably compensated by concurrent O loss to balance the charge, resulting in
Li54La24Zr16O95. 15,39 The loss of lithium has been supported experimentally by elemental analysis
using ICP-OES in a previous study. 18 The Gibbs free energies of all related chemical species are
tabulated in Table 5.4 and for reactions (1)-(4) in Table 5.5. Comparison of the reaction Gibbs free
energies indicates that for both Al-free and Al-substituted LLZO, the reactions (2 and 4) with gas
phase CO2 are energetically favorable, consistent with the experimental observations of Li2CO3
on the surfaces of both samples of Al-substituted LLZO in this study. However, the
thermodynamic tendencies for the reactions with gas phase H2O (1 and 3) are very different. The
reaction of un-substituted LLZO with moisture is possible with a Gibbs free energy of -0.53 eV.
In contrast, the reaction of Al substituted LLZO with moisture (reaction 3) is not energetically
favored because it has a positive Gibbs energy of 0.42 eV. LiOH is known to be a good CO2
absorber, 40 so that Li2CO3 is subsequently formed after the reaction with moisture occurs. The
formation of Li2CO3 via direct reaction with CO2 (equations 1 and 2) is likely to be kinetically
slower than formation of LiOH by reaction 3, as it involves one more lithium than LiOH. The fact
that LiOH is not predicted to form readily when Al-substituted LLZO is exposed to moist air limits
production of Li2CO3 to the slower route of direct reaction with CO2 in air. The substitution of Al
for Li at 24d sites limits Li ion motion,41 disrupting Li pathways through 24d-48h-24d sites,
resulting in lower reactivity. This is further supported by the observation that Al-free cubic LLZO
has better conductivity than Al-substituted counterparts.36
Item Experimental
Gibbs free energy
𝐺0,exp (eV/fu)
Calculated
Gibbs free
energy 𝐺0,DFT
(eV/fu)
Li2CO3 -12.60 -12.55
Li2O -6.20 -5.87
LiOH -5.03 -4.69
Li56La24Zr16O96 - -77.51
Li54La24Zr16O95 - -71.05
Li50Al2La24Zr16O96 -75.48
Li48Al2La24Zr16O95 -68.06
H2O (g) -2.37 -
CO2 (g) -4.09 -

74
Table 5.4. Gibbs free energy of relevant compounds in thermodynamic estimation
Chemical reaction Gibbs Energy (eV)
𝐿𝑖56𝐿𝑎24𝑍𝑟16𝑂96(𝑠) + 𝐻2𝑂 (𝑔) = 𝐿𝑖54𝐿𝑎24𝑍𝑟16𝑂95(𝑠) + 2𝐿𝑖𝑂𝐻(𝑠) -0.53
𝐿𝑖56𝐿𝑎24𝑍𝑟16𝑂96(𝑠) + 𝐶𝑂2(𝑔) = 𝐿𝑖54𝐿𝑎24𝑍𝑟16𝑂95(𝑠) + 𝐿𝑖2𝐶𝑂3(𝑠) -1.99
𝐿𝑖50𝐴𝑙2𝐿𝑎24𝑍𝑟16𝑂96(𝑠) + 𝐻2𝑂 (𝑔) = 𝐿𝑖48𝐴𝑙2𝐿𝑎24𝑍𝑟16𝑂95(𝑠) + 2𝐿𝑖𝑂𝐻(𝑠) 0.42
𝐿𝑖50𝐴𝑙2𝐿𝑎24𝑍𝑟16𝑂96(𝑠) + 𝐶𝑂2(𝑔) = 𝐿𝑖48𝐴𝑙2𝐿𝑎24𝑍𝑟16𝑂95(𝑠) + 𝐿𝑖2𝐶𝑂3(𝑠) -1.04
Table 5.5. Gibbs free energy of possible chemical reactions
5.5 Conclusions X-ray absorption and Raman spectroscopy with different probing depths were used to
determine the extent of Li2CO3 formation on LLZO pellets having different microstructures after
air exposure. Small-grained samples formed less Li2CO3 on surfaces after both short and long-
term ambient air exposures, compared to large-grained samples. The extent of formation of Li2CO3
on LLZO pellet surfaces correlates well with area specific resistances measured by impedance
experiments on symmetrical cells with lithium electrodes containing the solid electrolyte samples;
a much more dramatic rise in impedance after exposure to air for 24h is seen for the large-grained
samples than for the small-grained ones. The differences in behavior are attributed to variations in
the bulk compositions due to dissimilar sintering mechanisms for the two types of samples. In
large-grained samples, Al segregates at grain boundaries resulting in depletion from the bulk, while
Al is retained in the grains of the small-grained samples. DFT calculations indicate that Al-
substituted LLZO is less likely to react with water present in air to form LiOH, with subsequent
conversion to Li2CO3 upon reaction with CO2, than is the un-substituted analog. Although both
materials can also react directly with CO2 in air, this route for formation of Li2CO3 is expected to
be much slower than that involving water. These results indicate that careful engineering of LLZO
microstructures and thus composition is critical for the air stability and minimizing interfacial
resistances in devices containing these solid electrolytes.

75
5.6 References 1. K. Takada, Acta Mater., 2013, 61, 759–770.
2. H. Aono, J. Electrochem. Soc., 1990, 137, 1023–1027.
3. P. Knauth, Solid State Ionics, 2009, 180, 911–916.
4. N. Kamaya, K. Homma, Y. Yamakawa, M. Hirayama, R. Kanno, M. Yonemura, T.
Kamiyama, Y. Kato, S. Hama, K. Kawamoto, and A. Mitsui, Nat. Mater., 2011, 10, 682–6.
5. P. Hartmann, T. Leichtweiss, M. R. Busche, M. Schneider, M. Reich, J. Sann, P. Adelhelm,
and J. Janek, J. Phys. Chem. C, 2013, 117, 21064–21074.
6. S. P. Ong, Y. Mo, W. D. Richards, L. Miara, H. S. Lee, and G. Ceder, Energy Environ. Sci.,
2013, 6, 148–156.
7. J. BATES, Solid State Ionics, 1992, 53-56, 647–654.
8. Y.-W. Hu, J. Electrochem. Soc., 1977, 124, 1240–1242.
9. L. Zhang, L. Cheng, J. Cabana, G. Chen, M. M. Doeff, and T. J. Richardson, Solid State
Ionics, 2013, 231, 109–115.
10. R.-J. Chen, M. Huang, W.-Z. Huang, Y. Shen, Y.-H. Lin, and C.-W. Nan, Solid State Ionics,
2014, 265, 7–12.
11. C. A. Geiger, E. Alekseev, B. Lazic, M. Fisch, T. Armbruster, R. Langner, M. Fechtelkord,
N. Kim, T. Pettke, and W. Weppner, Inorg. Chem., 2011, 50, 1089–97.
12. V. Thangadurai and W. Weppner, Adv. Funct. Mater., 2005, 15, 107–112.
13. R. Sudo, Y. Nakata, K. Ishiguro, M. Matsui, A. Hirano, Y. Takeda, O. Yamamoto, and N.
Imanishi, Solid State Ionics, 2014, 262, 151–154.
14. G. Sahu, E. Rangasamy, J. Li, Y. Chen, K. An, N. Dudney, and C. Liang, J. Mater. Chem. A,
2014, 2, 10396–10403.
15. L. Cheng, E. J. Crumlin, W. Chen, R. Qiao, H. Hou, S. Franz Lux, V. Zorba, R. Russo, R.
Kostecki, Z. Liu, K. Persson, W. Yang, J. Cabana, T. Richardson, G. Chen, and M. Doeff, Phys.
Chem. Chem. Phys., 2014, 16, 18294–18300.
16. L. Cheng, J. S. Park, H. Hou, V. Zorba, G. Chen, T. Richardson, J. Cabana, R. Russo, and M.
Doeff, J. Mater. Chem. A, 2014, 2, 172–181.
17. G. Kresse, Phys. Rev. B, 1996, 54, 11169–11186.
18. G. Kresse and D. Joubert, Phys. Rev. B, 1999, 59, 1758–1775.
19. J. P. Perdew, K. Burke, and M. Ernzerhof, Phys. Rev. Lett., 1996, 77, 3865–3868.
20. A. Jain, S. P. Ong, G. Hautier, W. Chen, W. D. Richards, S. Dacek, S. Cholia, D. Gunter, D.
Skinner, G. Ceder, and K. a. Persson, APL Mater., 2013, 1, 011002.

76
21. S. P. Ong, W. D. Richards, A. Jain, G. Hautier, M. Kocher, S. Cholia, D. Gunter, V. L.
Chevrier, K. a. Persson, and G. Ceder, Comput. Mater. Sci., 2013, 68, 314–319.
22. L. Cheng, W. Chen, M. Kunz, K. A. Persson, N. Tamura, G. Chen, and M. M. Doeff, ACS
Appl. Mater. Interfaces, 2015, 7, 2073–2081.
23. Y. Jin and P. J. McGinn, J. Power Sources, 2013, 239, 326–331.
24. H. Buschmann, J. Dolle, S. Berendts, A. Kuhn, P. Bottke, M. Wilkening, P. Heitjans, A.
Senyshyn, H. Ehrenberg, A. Lotnyk, V. Duppel, L. Kienle, and J. Janek, Phys. Chem. Chem.
Phys., 2011, 13, 19378–19392.
25. D. Wang, G. Zhong, O. Dolotko, Y. Li, M. J. McDonald, J.-X. Mi, R. Fu, and Y. Yang, J.
Mater. Chem. A, 2014, 2, 20271–20279.
26. R. Qiao, Y.-D. Chuang, S. Yan, and W. Yang, PLoS One, 2012, 7, e49182.
27. M. Morita, Y. Asai, N. Yoshimoto, and M. Ishikawa, J. Chem. Soc. Faraday Trans., 1998,
94, 3451–3456.
28. R. Downs, in Program and abstracts of the 19th General Meeting of the International
Mineralogical Assoication in Kobe, Janpan, 2006, pp. O03–13.
29. F. Tietz, T. Wegener, M. T. Gerhards, M. Giarola, and G. Mariotto, Solid State Ionics, 2013,
230, 77–82.
30. G. Larraz, A. Orera, and M. L. Sanjuan, J. Mater. Chem. A, 2013, 1, 11419–11428.
31. M. H. Brooker and J. B. Bates, J. Chem. Phys., 1971, 54, 4788–4796.
32. S. Tanuma, C. J. Powell, and D. R. Penn, Surf. Interface Anal., 1991, 17, 927–939.
33. D. Rettenwander, C. A. Geiger, M. Tribus, P. Tropper, and G. Amthauer, Inorg. Chem.,
2014, 53, 6264–9.
34. Y. Jin and P. J. McGinn, J. Power Sources, 2011, 196, 8683–8687.
35. Y. Li, Z. Wang, C. Li, Y. Cao, and X. Guo, J. Power Sources, 2014, 248, 642–646.
36. Y. Li, J.-T. Han, C.-A. Wang, H. Xie, and J. B. Goodenough, J. Mater. Chem., 2012, 22,
15357–15361.
37. Y. Ren, H. Deng, R. Chen, Y. Shen, Y. Lin, and C.-W. Nan, J. Eur. Ceram. Soc., 2015, 35,
561–572.
38. H. Buschmann, S. Berendts, B. Mogwitz, and J. Janek, J. Power Sources, 2012, 206, 236–
244.
39. Y. Wang and W. Lai, J. Power Sources, 2015, 275, 612–620.
40. D. A. Boryta and A. J. Maas, Ind. Eng. Chem. Process Des. Dev., 1971, 10, 489–494.

77
41. L. J. Miara, S. P. Ong, Y. Mo, W. D. Richards, Y. Park, J.-M. Lee, H. S. Lee, and G. Ceder,
Chem. Mater., 2013, 25, 3048–3055.
6 Conclusions and Future work In summary, the work discussed in the chapters above has shown several promising
strategies to engineer solid-state lithium ion conductors for solid-state battery applications. These
focus on tackling the three key technical obstacles: difficulties in sintering, surface chemical
instability and resistive interfaces. Suggestions for future work on ceramic solid electrolytes are
given below.
6.1 Future work
6.1.1 Surface and Interface Engineering
Modification of surface microstructures that interface with electrodes is a promising
direction for future exploration of ceramic solid-state electrolytes. Among several technologies,
including the co-sintering method developed in this work (Chapter 4), thin film deposition on
polycrystalline surfaces would be an interesting direction to explore, as the resulting thin film
structures can be fine-tuned, ranging from totally amorphous to nano-crystalline and even micro-
crystalline, as shown in Figure 6.1. However, deposition of phase-pure garnet materials on garnet
surfaces has not yet been reported and deposition on other substrates remained technically difficult.
Figure 6.1. Generalized structure zone diagram for deposited thin films. 1
6.1.2 Tuning Chemical Stability
Aliovalent doping at the Li 24d site by Al has proven successful in stabilizing LLZO garnet
structure. In addition, Chapter 4 showed that chemical reactions leading to Li2CO3 formation were
slower in a sample in which less Al segregation at grain boundaries was observed. This implies
that Al substitution helps stabilize LLZO against reaction with CO2 in air. From a fundamental
perspective, the dependence of chemical stability on crystal facets will be an interesting topic.
Further systematic study might focus on the Al substitution effects on these crystal facets where
the termination can be widely varied. In addition, alternative approaches should be directed to

78
explore substitution at Zr sites with Ta or Nb, as this creates extra Li vacancies but does not disrupt
the Li ion pathways. This will alter the surface chemistry, and offers an opportunity for studying
the effect of the substitution on the surface stability. By exploring substitution at Zr and La sites,
it might be possible to achieve both a highly conductive and stable solid electrolyte.
6.1.3 In-situ probing sub-surface structural and compositional evolution
It is now understood that LLZO reacts with moisture and CO2 in air, forming Li2CO3. As
a result the LLZO surface loses lithium, but it is not clear whether it decomposes into other phases
or retains the garnet structure with a different stoichiometry. A possible scenario is that under the
Li2CO3 surface layer, LLZO decomposes into other phases such as La2Zr2O7 and LaAlO2 as a
result of the Li loss. On the other hand, the sub-surface LLZO may maintain the cubic structure
but with slightly modified lattice constants due to Li losses. Early trials (Figure 6.2) have shown
a possible two cubic phase co-existence at the sub-surface, supporting the second scenario.
Figure 6.2. Grazing incident XRD pattern of 211 peak at different X-ray incident angle. A two-
phase coexistence is observed at shallow angles.
6.2 Conclusions The present dissertation deals with the difficulty of ceramic processing, the origin of high
interfacial resistance, interface microstructure engineering and surface chemical stability of a
promising solid state lithium ionic conductor LLZO.
Specifically, the study of ceramic processing revealed that the high sintering temperature
can be effectively lowered by controlling the particle size. Depending the sintering parameters,
impurities segregated preferentially at grain boundaries on the top surfaces.
It is shown both experimentally and theoretically that Li2CO3 forms as a result of LLZO
exposure to air. Exposure to air and the resulting formation of Li2CO3 are the origins of the large
16.4 16.6 16.8 17.0
Inte
nsi
ty (
a.u
.)
2 Theta
2 Normalize to [0, 1] of H
0.85 Normalize to [0, 1] of H
0.5 Normalize to [0, 1] of H
0.33 Normalize to [0, 1] of H
0.15 Normalize to [0, 1] of H
0.85 2 Normalize to [0, 1] of H
% (7)
2 degree
0.85 degree
0.5 degree
0.33 degree
0.15 degree

79
interfacial resistances observed in LLZO symmetric cells with lithium metal electrodes. While the
chemical instability of LLZO towards moisture and air complicates the processing, these results
show that high interfacial impedances are not intrinsic to the system, but can be avoided with
simple precautions. In addition to the surface reactions, the electrochemical properties, especially
interfacial resistances and electrical cycling performance of dense LLZO solid electrolytes in
lithium cells are strongly influenced by the microstructures and grain boundaries at the interfaces.
Furthermore, X-ray absorption and Raman spectroscopy with different probing depths
were used to determine the extent of Li2CO3 formation on LLZO pellets having different
microstructures after air exposure. Small-grained samples formed less Li2CO3 on surfaces after
both short and long-term ambient air exposures, compared to large-grained samples. The extent of
formation of Li2CO3 on LLZO pellet surfaces correlates well with area specific resistances
measured by impedance experiments on symmetrical cells with lithium electrodes containing the
solid electrolyte samples; a much more dramatic rise in impedance after exposure to air for 24h is
seen for the large-grained samples than for the small-grained ones. The differences in behavior are
attributed to variations in the bulk compositions due to dissimilar sintering mechanisms for the
two types of samples. In large-grained samples, Al segregates at grain boundaries resulting in
depletion from the bulk, while Al is retained in the grains of the small-grained samples. DFT
calculations indicate that Al-substituted LLZO is less likely to react with water present in air to
form LiOH, with subsequent conversion to Li2CO3 upon reaction with CO2, than is the
unsubstituted analog. Although both materials can also react directly with CO2 in air, this route for
formation of Li2CO3 is expected to be much slower than that involving water. These results
indicate that careful engineering of LLZO microstructures and thus composition is critical for the
air stability and minimizing interfacial resistances in devices containing these solid electrolytes.
6.3 Reference
1 A. Anders, Thin Solid Films, 2010, 518, 4087