interannual variability in the summertime hydrological ...sgs02rpa/papers/zveryaev16jgr.pdf · 1 1...
TRANSCRIPT

1
Interannual Variability in the Summertime Hydrological 1
Cycle over European Regions 2
3
4
Igor I. Zveryaev, Matthias Zahn * and Richard P. Allan ** 5
6
P.P. Shirshov Institute of Oceanology, RAS, Moscow, Russia 7
* Institute of Coastal Research, Helmholtz Centre Geesthacht, Geesthacht, Germany 8
** Department of Meteorology, University of Reading, Reading, UK 9
10
11
Submitted to JGR-Atmospheres 12
October, 2015 13
14
15
Address for correspondence: 16
Dr. Igor I. Zveryaev, P.P. Shirshov Institute of Oceanology, RAS 17
36, Nakhimovsky Ave., Moscow, 117997, Russia 18
Telephone: 7 (499) 1247928 19
Telefax: 7 (499) 1245983 20
Email: [email protected] 21

2
Abstract 22
A variety of observations-based hydrological variables from different data sets are used to 23
investigate interannual variability and changes in the summertime hydrological cycle over four 24
European regions – Iberian Peninsula (IP), British Isles (BI), Central Europe (CE) and European 25
Russia (ER). 26
An analysis performed on seasonal means (June, July and August: JJA) suggests that soil 27
moisture variability is impacted almost equally by precipitation and air temperature in BI and ER 28
regions. However, stronger links between soil moisture and precipitation are revealed for CE 29
region and between soil moisture and air temperature for IP region. In all except IP regions 30
summertime interannual variability of column-integrated water vapour is strongly linked to air 31
temperature consistent with the dominating influence of the Clausius-Clapeyron equation. In BI, 32
CE and ER interannual variability of regional precipitation is driven by variations in atmospheric 33
moisture transport into these regions. In IP the link between precipitation and moisture transport 34
is relatively weak. 35
Based on monthly data, analysis of the lag-lead correlations revealed specific regional 36
relationships between different hydrological variables. In particular, it is shown that in some 37
regions (and months) interannual variability of soil moisture is linked more strongly to 38
precipitation and air temperature anomalies in the previous month, rather than in the coinciding 39
month. 40
An analysis of the vertical structure of regional atmospheric moisture transport has 41
revealed that the more continental the climate of the region is, the larger deviation from the mean 42
(i.e., climatological) profile might be observed during anomalously dry/wet summers. 43
44

3
1. Introduction 45
Variability in elements of the European hydrological cycle on different time-scales 46
substantially impacts human activities in this densely populated region. In particular, 47
deficient/excessive precipitation may lead to serious social and economic consequences. During 48
recent years many such climate anomalies in different parts of Europe have resulted in 49
substantial damage to regional economies [e.g., Christensen and Christensen, 2003; Schär et al., 50
2004; Marsh and Hannaford, 2007; Blackburn et al., 2008, Lenderink et al., 2009]. Many 51
regional climate extremes occur during summer. One of the most recent examples of such 52
extremes is the anomalously high precipitation over the British Isles during summer 2007 which 53
resulted in extensive flooding across England and Wales [Marsh and Hannaford, 2007; 54
Blackburn et al., 2008]. Another remarkable example is the Russian summer heat wave of 2010 55
[e.g., Dole et al., 2011; Otto et al., 2012] during which a large deficit of precipitation has been 56
observed. In particular, in 2010 monthly July precipitation in the Moscow region amounted only 57
to 12.8mm (which is 13.5% of the climatological value). Nevertheless, compared to winter, 58
significantly less attention has been given during recent years to analysis of the European climate 59
variability during the summer season [e.g., Colman and Davey, 1999; Hurrell and Folland, 60
2002; Zveryaev, 2004; Sutton and Dong, 2012]. In general, summertime climate variability in the 61
European region is not well understood. Therefore, to improve the understanding of regional 62
climate and its extremes, particularly for the warm season, further analysis of the processes 63
driving European climate variability is necessary. 64
An important role of soil moisture in the climate system is highlighted by Legates et al. 65
[2010] who particularly emphasize that the temporal variability of soil moisture in a given region 66
is fundamental to the definition of its climate. Soil moisture is a key climate variable in 67

4
hydrological processes which also impacts plant growth and carbon fluxes [e.g., Dirmeyer et al., 68
1999]. Moreover, soil moisture is a critically important variable for weather and climate 69
predictions because it controls local atmospheric water supply and the partitioning of energy flux 70
into sensible and latent heat fluxes at the land surface [e.g., Albergel et al., 2012]. 71
Atmospheric water vapor plays a principal role in the hydrological cycle both at the global 72
and regional scales. The distribution of water vapor and its condensation as cloud is crucial in 73
determining radiative cooling and latent heating of the atmospheric column. Atmospheric water 74
vapor absorbs strongly a portion of the earth's outgoing infrared energy, and radiates energy back 75
to the earth's surface. Thus, water vapor is a primary contributor to the greenhouse effect. During 76
recent decades, analysis of spatial-temporal variability of atmospheric moisture has received 77
considerable attention. A number of recent papers focused on the regional changes in 78
atmospheric water vapor [e.g., Ross and Elliott, 1996; Zhai and Eskridge, 1997; Zveryaev et al., 79
2008; Zveryaev and Rudeva, 2010]. However, a large degree of uncertainty remains regarding 80
interannual variability of atmospheric water vapor over Europe during the summer season when 81
the leading modes of water vapor variability are not associated with regional atmospheric 82
dynamics [Zveryaev et al., 2008; Zveryaev and Rudeva, 2010]. 83
In summer, when the role of atmospheric moisture advection in precipitation variability is 84
diminished, the role of the local land surface processes increases [Trenberth, 1999]. Some 85
studies point to the importance of land surface processes in summer precipitation variability 86
[Koster and Suarez, 1995; Schär et al., 1999; Seneviratne et al., 2006], whereas other works 87
highlight the role of the summer atmospheric circulation [Pal et al., 2004; Koster et al., 2004]. 88
Although the above mechanisms are not mutually exclusive, their relative roles in summer 89
precipitation variability in the European region are not completely clear. 90

5
The present study compares interannual variability in elements of the summertime 91
hydrological cycle over four European regions characterized by contrasting climatic conditions. 92
The climate variables under consideration are precipitation, soil moisture, atmospheric water 93
vapor, horizontal moisture transport and near surface air temperature. While our recent studies 94
[Zveryaev and Allan, 2010; Zveryaev and Rudeva, 2010; Allan and Zveryaev, 2011] explored the 95
leading continental-scale modes of variability in key elements of the hydrological cycle over 96
Europe and their relationships during summer season, the present study examines and highlights 97
regional differences in the hydrological cycle across four European regions. We also examine 98
lag-lead links between soil moisture and precipitation, and between soil moisture and air 99
temperature, thus assessing relative roles of coupling between these two parameters and soil 100
moisture variability. Furthermore, we investigate the highly variable vertical structure of 101
horizontal atmospheric moisture transport and its relation to precipitation anomalies in the 102
regions of interest. The data used and the analysis methods are described in section 2. 103
Interannual variability of the key elements of the hydrological cycle and their relationships 104
during the summer season are analyzed in section 3. In section 4 we explore the vertical structure 105
of horizontal atmospheric moisture transport in four European regions during the summer 106
season. Finally, a summary and discussion are presented in section 5. 107
108
2. Data and methods 109
In this study we use the CRU TS v3.22 monthly precipitation (P) and air temperature (AT) 110
data provided on a 0.5° x 0.5° latitude-longitude grid [Mitchell and Jones, 2005; Harris et al., 111
2013]. This data set has been constructed at the Climatic Research Unit (CRU), University of 112
East Anglia. The data set presents terrestrial surface climate for the 1901-2011 period. The P and 113

6
AT data for the European region used in this study were interpolated directly from station 114
observations. Station P and AT records from which the data set was constructed, were obtained 115
from seven sources (see Table 1 in Mitchell and Jones, 2005). More details on the data 116
construction method can be found in Mitchell and Jones [2005] and Harris et al. [2013]. 117
The soil moisture (SM) data used in the present study are provided by the NOAA Climate 118
Prediction Center (CPC) on a 0.5° x 0.5° latitude - longitude grid for the period 1948-present 119
[Fan and van den Dool, 2004]. This data set constitutes SM estimated by a one-layer 120
hydrological model [Huang et al., 1996; van den Dool et al., 2003]. The model takes observed P 121
and AT and calculates soil moisture, evaporation and runoff. It should be, therefore, emphasized 122
that this is model-calculated and not directly measured data. More detailed information on the 123
model and the data set construction can be found in Huang et al. [1996], van den Dool et al. 124
[2003] and Fan and van den Dool [2004]. 125
Column Integrated Water Vapor (CWV), near surface atmospheric temperature (T0), 126
relative humidity (RH) and 500 hPa vertical motion (ω500) fields were extracted from the ERA 127
Interim reanalysis [Dee et al., 2011] produced by the European Centre for Medium-Range 128
Weather Forecasts (ECMWF) and covering the period 1979 – present. Note, T0 is approximately 129
the same as AT, but this is reanalysis product. The data assimilation system used to produce the 130
ERA-Interim includes a 4-dimensional variational analysis (4D-Var) with a 12-hour analysis 131
window. The spatial resolution of the data set is approximately 80 km (T255 spectral) on 60 132
vertical levels from the surface up to 0.1 hPa. Details on the data set are described in Dee et al. 133
[2011]. 134
Additionally, CWV expressed as a fraction (CWVrat) of the approximated maximum 135
potential value (CWVmax) is calculated using CWV, T0 and ω500 fields over the North Atlantic 136
7
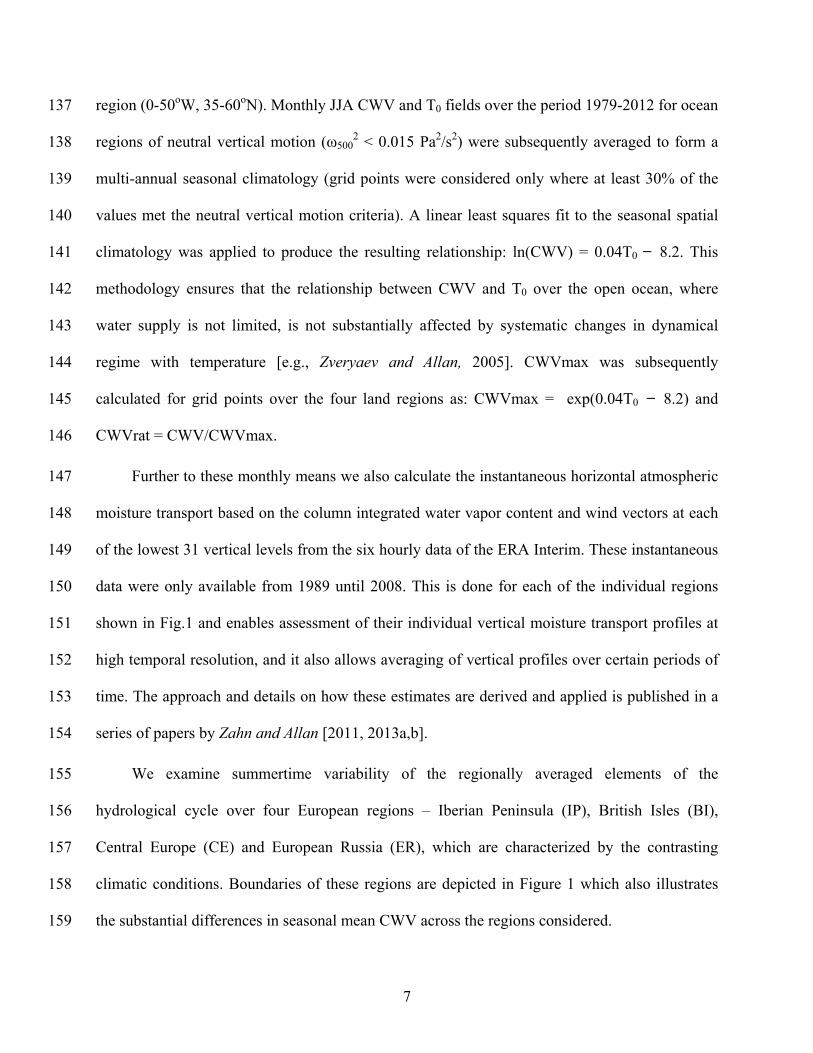
region (0-50oW, 35-60oN). Monthly JJA CWV and T0 fields over the period 1979-2012 for ocean 137
regions of neutral vertical motion (ω5002 < 0.015 Pa2/s2) were subsequently averaged to form a 138
multi-annual seasonal climatology (grid points were considered only where at least 30% of the 139
values met the neutral vertical motion criteria). A linear least squares fit to the seasonal spatial 140
climatology was applied to produce the resulting relationship: ln(CWV) = 0.04T0 ̶ 8.2. This 141
methodology ensures that the relationship between CWV and T0 over the open ocean, where 142
water supply is not limited, is not substantially affected by systematic changes in dynamical 143
regime with temperature [e.g., Zveryaev and Allan, 2005]. CWVmax was subsequently 144
calculated for grid points over the four land regions as: CWVmax = exp(0.04T0 ̶ 8.2) and 145
CWVrat = CWV/CWVmax. 146
Further to these monthly means we also calculate the instantaneous horizontal atmospheric 147
moisture transport based on the column integrated water vapor content and wind vectors at each 148
of the lowest 31 vertical levels from the six hourly data of the ERA Interim. These instantaneous 149
data were only available from 1989 until 2008. This is done for each of the individual regions 150
shown in Fig.1 and enables assessment of their individual vertical moisture transport profiles at 151
high temporal resolution, and it also allows averaging of vertical profiles over certain periods of 152
time. The approach and details on how these estimates are derived and applied is published in a 153
series of papers by Zahn and Allan [2011, 2013a,b]. 154
We examine summertime variability of the regionally averaged elements of the 155
hydrological cycle over four European regions – Iberian Peninsula (IP), British Isles (BI), 156
Central Europe (CE) and European Russia (ER), which are characterized by the contrasting 157
climatic conditions. Boundaries of these regions are depicted in Figure 1 which also illustrates 158
the substantial differences in seasonal mean CWV across the regions considered. 159

8
160
To assess links between different elements of the regional hydrological cycle we use 161
conventional correlation analysis. According to the Student’s t-test [Bendat and Piersol, 1966], 162
the minimum significant correlation coefficient between the time series analyzed (33 years) is 163
0.361 for the 95% significance level. The impact of autocorrelation on the estimation of 164
significance of correlation coefficients was found to be trivial in the analyzed time series which 165
is expected since each JJA season is separated by 1 year. It should be emphasized that statistical 166
methods used in this study imply that only linear relationships between analyzed variables are 167
addressed. 168
169
3. Interannual variability of the key elements of summertime hydrological 170
cycle over European regions 171
3.1 Interannual variability of seasonally averaged parameters 172
To investigate specific regional features of interannual variability in aspects of the 173
hydrological cycle over four European regions during summer, we first examine time series of 174
the normalized (by respective standard deviations) anomalies of seasonally (JJA) and regionally 175
averaged parameters. The time series of P, soil moisture and AT anomalies are shown in Figure 2 176
and the time series of CWV, moisture transport and CWVrat anomalies are depicted in Figure 3. 177
The correlations between considered parameters are presented in Table 1. 178
The time series for the IP region (Figure 2a) displays some correspondence between 179
interannual variations of soil moisture and those of P (r=0.34) and AT (r=-0.41). Indeed, in 1988 180
and 1997 large positive anomalies of P and negative anomalies of AT coincided with large 181
positive anomalies of soil moisture. On the other hand, in 2005 deficient precipitation and high 182
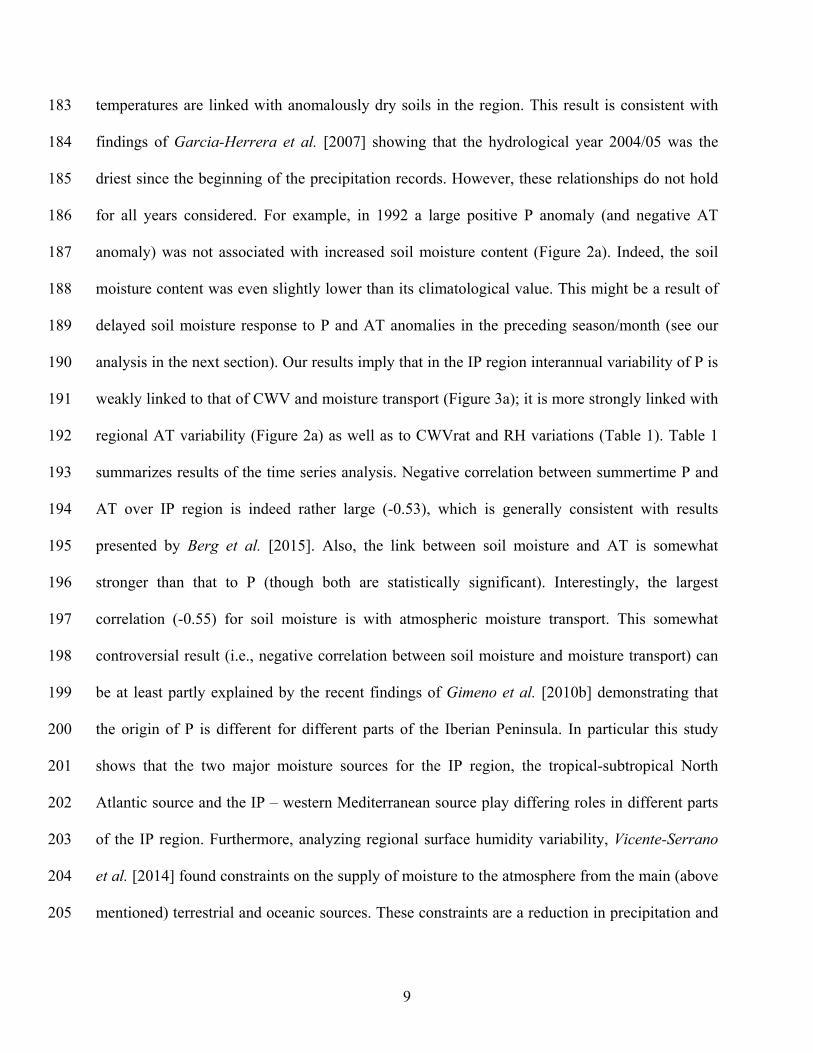
9
temperatures are linked with anomalously dry soils in the region. This result is consistent with 183
findings of Garcia-Herrera et al. [2007] showing that the hydrological year 2004/05 was the 184
driest since the beginning of the precipitation records. However, these relationships do not hold 185
for all years considered. For example, in 1992 a large positive P anomaly (and negative AT 186
anomaly) was not associated with increased soil moisture content (Figure 2a). Indeed, the soil 187
moisture content was even slightly lower than its climatological value. This might be a result of 188
delayed soil moisture response to P and AT anomalies in the preceding season/month (see our 189
analysis in the next section). Our results imply that in the IP region interannual variability of P is 190
weakly linked to that of CWV and moisture transport (Figure 3a); it is more strongly linked with 191
regional AT variability (Figure 2a) as well as to CWVrat and RH variations (Table 1). Table 1 192
summarizes results of the time series analysis. Negative correlation between summertime P and 193
AT over IP region is indeed rather large (-0.53), which is generally consistent with results 194
presented by Berg et al. [2015]. Also, the link between soil moisture and AT is somewhat 195
stronger than that to P (though both are statistically significant). Interestingly, the largest 196
correlation (-0.55) for soil moisture is with atmospheric moisture transport. This somewhat 197
controversial result (i.e., negative correlation between soil moisture and moisture transport) can 198
be at least partly explained by the recent findings of Gimeno et al. [2010b] demonstrating that 199
the origin of P is different for different parts of the Iberian Peninsula. In particular this study 200
shows that the two major moisture sources for the IP region, the tropical-subtropical North 201
Atlantic source and the IP – western Mediterranean source play differing roles in different parts 202
of the IP region. Furthermore, analyzing regional surface humidity variability, Vicente-Serrano 203
et al. [2014] found constraints on the supply of moisture to the atmosphere from the main (above 204
mentioned) terrestrial and oceanic sources. These constraints are a reduction in precipitation and 205

10
soil moisture in the case of terrestrial sources, and stable sea surface temperatures that could 206
reduce the flow of atmospheric moisture into the region. Therefore, averaging of the analyzed 207
parameters over the entire region may impact the results of the analysis. It can also be speculated 208
that in the IP region large fractions of precipitation might (especially during the hot season) 209
quickly evaporate not enhancing regional soil moisture content significantly. Furthermore, higher 210
temperatures are associated with lower soil moisture (r=-0.41) due to reduced cooling by surface 211
evaporative fluxes. The warmer land is generally associated with greater convergence yet 212
moisture convergence and P is only enhanced if the air is moisture laden (high CWVrat). Indeed 213
regional P in the IP region is strongly linked (correlation 0.67) to CWVrat and RH (r=0.83) but 214
not to CWV (Table 1). Therefore, the results imply that in this region the hottest conditions are 215
associated with reduced P which is associated with less cloud and more solar radiation while also 216
reducing soil moisture and allowing more of the sunlight to heat the ground rather than evaporate 217
water. 218
The BI region is characterized by stronger links between soil moisture and P and AT 219
compared to the IP region (Figure 2b, Table 1). In particular, anomalously dry soils were clearly 220
associated with reduced P and higher air AT in 1984, 1995 and 2006. It is interesting that 221
moisture transport into the region was also anomalously low during these years (Figure 3b). On 222
the other hand, in 1985 a positive soil moisture anomaly was clearly associated with increased P 223
(Figure 2b). Similar results are obtained for the recent anomalously moist summer of 2007 224
[Marsh and Hannaford, 2007; Blackburn et al., 2008; Allan and Zveryaev, 2011]. In contrast to 225
the IP region correlation between regional P and moisture transport over the BI region is very 226
large (r=0.93; Table 1). 227
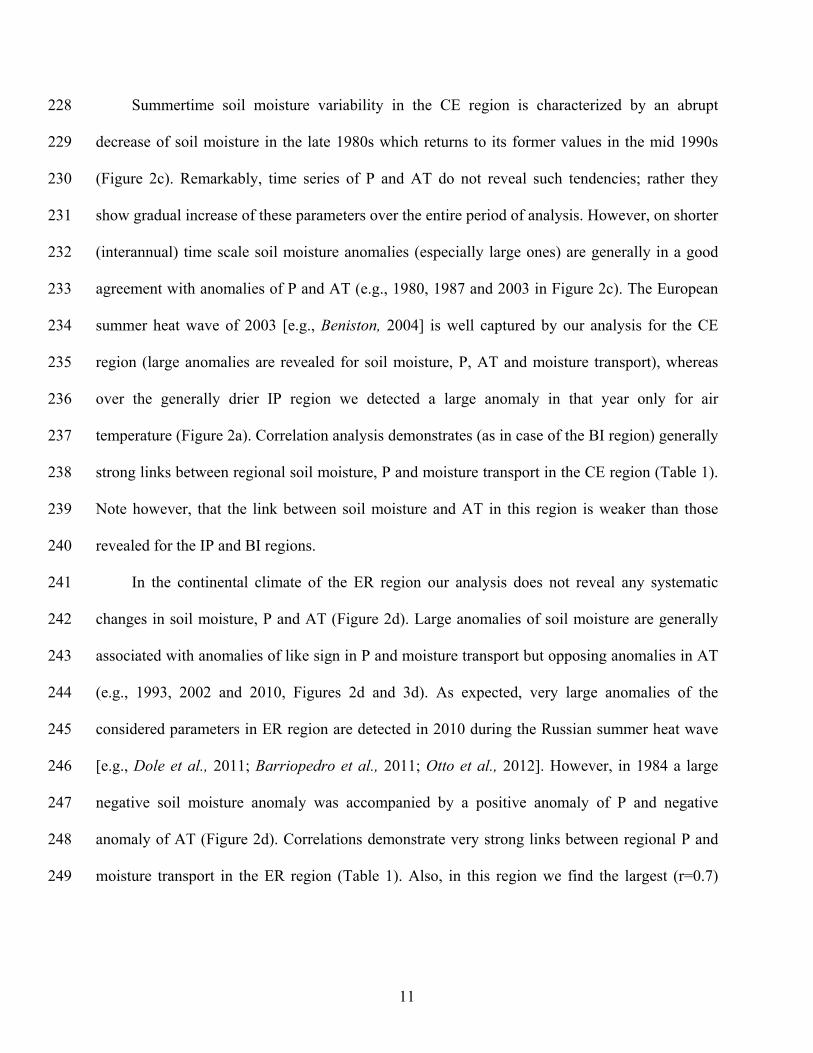
11
Summertime soil moisture variability in the CE region is characterized by an abrupt 228
decrease of soil moisture in the late 1980s which returns to its former values in the mid 1990s 229
(Figure 2c). Remarkably, time series of P and AT do not reveal such tendencies; rather they 230
show gradual increase of these parameters over the entire period of analysis. However, on shorter 231
(interannual) time scale soil moisture anomalies (especially large ones) are generally in a good 232
agreement with anomalies of P and AT (e.g., 1980, 1987 and 2003 in Figure 2c). The European 233
summer heat wave of 2003 [e.g., Beniston, 2004] is well captured by our analysis for the CE 234
region (large anomalies are revealed for soil moisture, P, AT and moisture transport), whereas 235
over the generally drier IP region we detected a large anomaly in that year only for air 236
temperature (Figure 2a). Correlation analysis demonstrates (as in case of the BI region) generally 237
strong links between regional soil moisture, P and moisture transport in the CE region (Table 1). 238
Note however, that the link between soil moisture and AT in this region is weaker than those 239
revealed for the IP and BI regions. 240
In the continental climate of the ER region our analysis does not reveal any systematic 241
changes in soil moisture, P and AT (Figure 2d). Large anomalies of soil moisture are generally 242
associated with anomalies of like sign in P and moisture transport but opposing anomalies in AT 243
(e.g., 1993, 2002 and 2010, Figures 2d and 3d). As expected, very large anomalies of the 244
considered parameters in ER region are detected in 2010 during the Russian summer heat wave 245
[e.g., Dole et al., 2011; Barriopedro et al., 2011; Otto et al., 2012]. However, in 1984 a large 246
negative soil moisture anomaly was accompanied by a positive anomaly of P and negative 247
anomaly of AT (Figure 2d). Correlations demonstrate very strong links between regional P and 248
moisture transport in the ER region (Table 1). Also, in this region we find the largest (r=0.7) 249

12
correlation between CWV and AT (which are linked through Clausius-Clapeyron equations) 250
implying limited variation in relative humidity. 251
252
3.2 Lag-lead correlations between different elements of the hydrological cycle 253
Since the time-scales involved in depleting and replenishing soil moisture are not 254
instantaneous this motivated us to examine lag-lead relationships between regional soil moisture, 255
P and AT by analyzing correlations between monthly time series of these parameters. A lag-lead 256
correlation is calculated between a variable at one time step and values of another variable at 257
later or earlier (lagged) time. The lag-lead correlations are shown in Table 2. It should be noted 258
here that besides the impact of P and AT on soil moisture variability, there is also a feedback 259
from soil moisture on both P and AT that can significantly modify variability of these parameters 260
[e.g., Koster et al., 2004; Seneviratne et al., 2006; Hirschi et al., 2011; Miralles et al., 2012; 261
Berg et al., 2013; Berg et al., 2015]. 262
In the IP region significant lag-lead correlations with regional soil moisture are found only 263
for June P (Table 2). Significant correlations are not detected for July and August P since during 264
this part of the summer season P is very low in the IP region and any soil moisture replenishment 265
is rapidly lost through evaporation. Interestingly, for June P simultaneous correlation with June 266
soil moisture (r=0.42) is lower than those with July (r=0.55) and August (r=0.55) soil moisture. 267
One explanation is that rainfall towards the end of the month will not greatly influence the 268
monthly total soil moisture. However, the time-scale for soil moisture depletion following 269
rainfall will also produce a delayed response of soil moisture variability to the impact of P. A 270
similar result is obtained for June AT, for which simultaneous correlation with June soil moisture 271
(r=-0.49) is lower than for July (r=-0.58) and August (r=-0.57) soil moisture. Though the 272

13
difference is not large, July AT in the IP region shows stronger links to soil moisture in August 273
(r=-0.50) than in July (r=-0.43). In August, however, simultaneous correlation between AT and 274
soil moisture (r=-0.49) is slightly larger than the lagged one (r=-0.40). Note, latter correlation 275
might indicate a soil moisture feedback onto AT. Indeed, in moisture constrained regions large 276
incoming solar radiation cannot result in enhanced latent heat flux (evaporation) due to limited 277
soil moisture content. Instead, it results in enhanced sensible heat flux which in turn increases 278
near surface air AT [e.g., Berg et al., 2015]. 279
Correlations in the BI region do not show statistically significant simultaneous links 280
between regional P and soil moisture in June and July (Table 2). However, August soil moisture 281
is significantly correlated to P in all summer months. We find statistically significant correlation 282
(r=0.57) between June P and July soil moisture, indicative of its lagged response to P impact 283
(precipitation falling at the end of the month will not affect soil moisture for the much that 284
month). AT in June is not correlated significantly to soil moisture in any month (Table 2) 285
suggesting that soil moisture does not generally become limited over the BI region in summer. 286
However, July and August AT both display significant correlations to August soil moisture 287
indicating that warmer prior conditions are able to dry the soils by August. 288
In the CE region there are no statistically significant simultaneous correlations between soil 289
moisture and P or between soil moisture and AT (Table 2). Moreover, we do not find significant 290
lagged correlations between soil moisture and AT. However, rather large lagged correlations are 291
revealed between June P and July soil moisture and between July P and August soil moisture, 292
implying a delayed response of soil moisture variability to P impact as expected (precipitation 293
late in the month will have a greater influence on soil moisture in the following month). 294

14
Lag-lead correlations in the ER region do not show significant simultaneous links between 295
regional P and soil moisture in June and July (Table 2). However, August soil moisture shows 296
significant simultaneous correlation to P (r=0.47). Similar results are obtained regarding regional 297
relationships between soil moisture and AT (Table 2). Consistent with results of the previous 298
subsection (Table 1), this suggests approximately equal roles of P and AT in interannual 299
variability of soil moisture in ER region during summer season. In common with the other 300
regions, the strongest correlations are generally between June (July) P or AT and July (August) 301
soil moisture. This indicates that more cloud and rainfall is associated with lower temperatures 302
(as indicated by negative correlations between P and AT in Table 1) and soil moisture is 303
replenished by the following month. 304
In summary, coupling between AT and soil moisture variability is strongest in the IP region 305
and weakest for CE. In the BI and the ER regions such influence is detected in late summer 306
(August). Significant correlations (both simultaneous and lagged) between soil moisture and P 307
are also revealed mostly in late summer. The exception is the IP region where June P correlates 308
significantly with soil moisture in all summer months. It is important to emphasize that in many 309
cases we find that lagged correlations are larger than respective simultaneous correlations, thus 310
indicating a delayed response of soil moisture variability to impacts of P and AT. 311
312
4. Summertime atmospheric moisture transport over European regions 313
Since our results presented in the previous sections indicate an important role of moisture 314
transport in determining variability of the key elements of the regional hydrological cycle (P and 315
soil moisture), in this section we examine in greater detail the vertical structure of moisture 316
transport in each region. We focus on climatological (i.e. averaged over the period of analysis) 317

15
values of the instantaneous transports and on particular years characterized by large 318
positive/negative anomalies of P. Figure 4 shows summer mean moisture transport at different 319
pressure levels averaged over the entire period of analysis. The term “moisture transport” here 320
means the net transport, i.e. the balance between horizontal moisture flux into the region and that 321
out of the region of analysis. The moisture transport is calculated separately at each pressure 322
level. Hence, positive values in Figure 4 indicate a net moisture flux into the region at a given 323
level (the model levels are indicated by the ticks). Figures 5-8 show horizontal moisture 324
transports at different pressure levels estimated along the borders of the different regions for 325
particular years. 326
The vertical structure of horizontal moisture transport for the IP region demonstrates the 327
largest (compared to other regions) spread of moisture transport at different levels (Figure 4). 328
The major moisture transport into the region is observed at the lower levels (1000-900hPa), 329
whereas large moisture transport at the higher levels between 900-500hPa is directed outward. 330
Note, net moisture divergence out of this region (1.7mm/day) is the greatest of all regions 331
implying significant depletion of soil moisture. Such a low level inflow - upper level outflow 332
profile was found typical for the subtropical moisture transport regimes [Zahn and Allan, 2013b]. 333
The profile of the BI region is more complicated (Figure 4). Inward moisture transport is 334
detected at two levels, near the surface (1000-950hPa) and in the layer 800-550hPa. The 335
moisture transport out of the region prevails between 950-800hPa. Except the lower level inflow, 336
this resembles the extra-tropical profile of moisture transports in Zahn and Allan [2013a], with 337
upper level inflow and lower to mid level outflow. 338
Horizontal moisture transport for the CE region shows relatively small moisture flux into 339
the region near the surface. General moisture flux out of the region is seen between 950hPa and 340
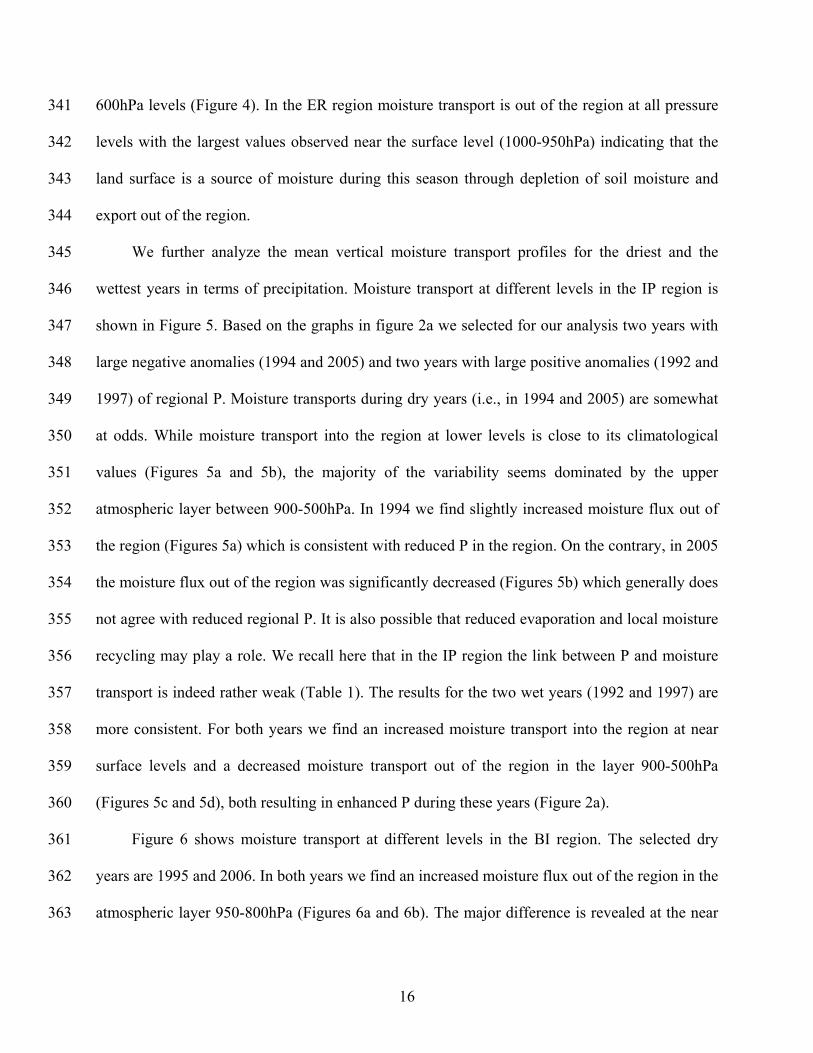
16
600hPa levels (Figure 4). In the ER region moisture transport is out of the region at all pressure 341
levels with the largest values observed near the surface level (1000-950hPa) indicating that the 342
land surface is a source of moisture during this season through depletion of soil moisture and 343
export out of the region. 344
We further analyze the mean vertical moisture transport profiles for the driest and the 345
wettest years in terms of precipitation. Moisture transport at different levels in the IP region is 346
shown in Figure 5. Based on the graphs in figure 2a we selected for our analysis two years with 347
large negative anomalies (1994 and 2005) and two years with large positive anomalies (1992 and 348
1997) of regional P. Moisture transports during dry years (i.e., in 1994 and 2005) are somewhat 349
at odds. While moisture transport into the region at lower levels is close to its climatological 350
values (Figures 5a and 5b), the majority of the variability seems dominated by the upper 351
atmospheric layer between 900-500hPa. In 1994 we find slightly increased moisture flux out of 352
the region (Figures 5a) which is consistent with reduced P in the region. On the contrary, in 2005 353
the moisture flux out of the region was significantly decreased (Figures 5b) which generally does 354
not agree with reduced regional P. It is also possible that reduced evaporation and local moisture 355
recycling may play a role. We recall here that in the IP region the link between P and moisture 356
transport is indeed rather weak (Table 1). The results for the two wet years (1992 and 1997) are 357
more consistent. For both years we find an increased moisture transport into the region at near 358
surface levels and a decreased moisture transport out of the region in the layer 900-500hPa 359
(Figures 5c and 5d), both resulting in enhanced P during these years (Figure 2a). 360
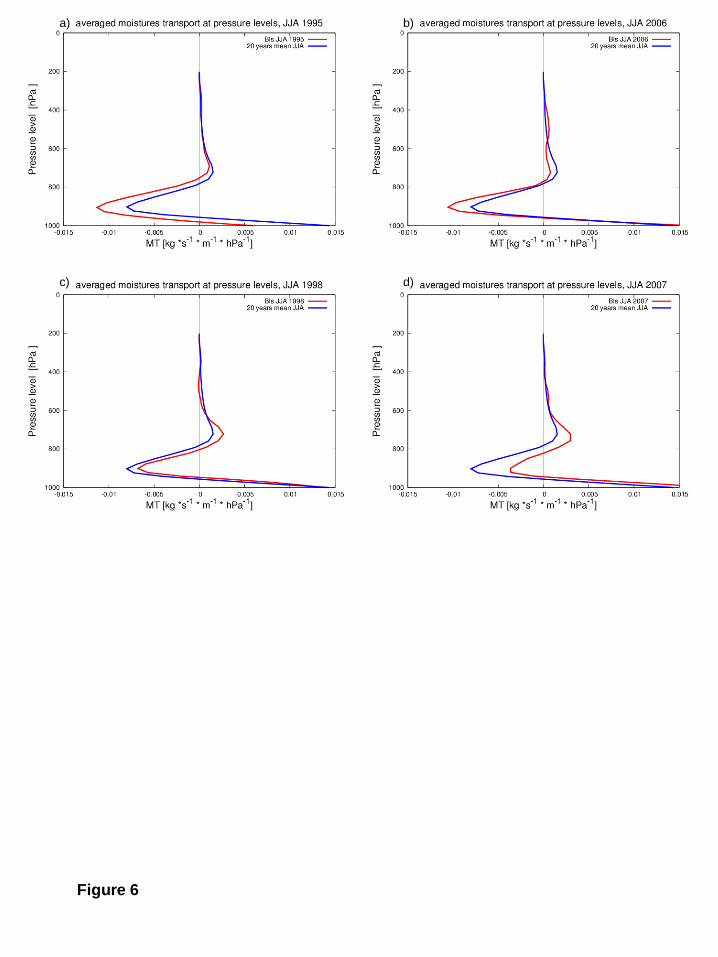
Figure 6 shows moisture transport at different levels in the BI region. The selected dry 361
years are 1995 and 2006. In both years we find an increased moisture flux out of the region in the 362
atmospheric layer 950-800hPa (Figures 6a and 6b). The major difference is revealed at the near 363

17
surface levels where in 1995 we find significantly reduced moisture flux into the region, whereas 364
in 2005 it is close to its climatological value. Indicated moisture transport changes resulted in dry 365
conditions in the region. The selected wet years for BI region are 1998 and 2007. In 1998 366
moisture transport into the region was not unusual near the surface but was greater than average 367
above the 800hPa level whereas the moisture transport out of the region was below average in 368
the layer 950-800hPa (Figure 6c). In 2007 the moisture transport into the region was 369
approximately twice larger than average above the 800hPa level, whereas the moisture transport 370
out of the region was about half of the average in the layer 950-800hPa (Figure 6d). These 371
changes resulted in anomalously wet conditions in the region. Generally, the BI profiles maintain 372
a similar shape in anomalous precipitation years, which just varies in strength. This is consistent 373
with analysis in Section 3.1 which indicates that positive anomalies in moisture transport into the 374
BI region are associated with greater P (Table 1). 375
Moisture transport at different levels in the CE region is depicted in Figure 7. Dry 376
conditions in 1994 and 2003 were mostly associated with increased moisture transport out of the 377
region at the lower to mid levels (below 650hPa, Figures 7a and b). In 2003 this increased 378
outflow was so pronounced, that an increased inflow at upper level could not compensate the 379
total budget. Enhanced P in 2002 and 2007 was associated with increased near surface moisture 380
transport into the CE region and decreased moisture transport out of the region in the layer 950-381
800hPa (Figures 7c and d). For CE the profiles' shapes can deviate considerably from the mean 382
in anomalous P years. 383
Figure 8 demonstrates moisture transport at different levels in the ER region. The selected 384
dry years for this region are 1992 and 2002. Unfortunately, the instantaneous ERA interim data 385
for 2010 were not available to us. In both years we find an increased moisture flux out of the 386

18
region in the lower troposphere, especially near the surface (Figures 8a and 8b). Particularly 387
large (twice its climatological value) moisture flux out of the ER region is observed in 2002 388
(Figure 8b). This coincides with decreased P and generally dry conditions in the region. The 389
selected wet years for the region are 1989 and 2003. In these years substantial changes in 390
regional moisture transport are detected. In both years general climatological moisture flux out of 391
the region has reversed with moisture flux directed into the region. Thus, it appears that the ER is 392
the only region where the moisture flux during anomalous years not only became 393
stronger/weaker, but even changed its resulting direction. This reversal in climatological 394
moisture export lead to enhanced P in the region during 1989 and 2003. 395
Summarizing results of this section, we note that during summer the vertical structure of 396
the horizontal moisture transport is different over each of the considered regions. Our analysis 397
also revealed contrasting changes in moisture transport at the different atmospheric levels 398
associated with anomalously dry/wet summers in the European regions analyzed in this study, in 399
particular for the BI and CE regions. The IP region is characterized by the largest moisture 400
inflow (near the surface) and outflow (around 750hPa) of all regions considered yet is a net 401
exporter of moisture overall indicating substantial depletion of local soil moisture. Similarly 402
climatological net moisture export over the ER region at all levels also indicates depletion of 403
local soil moisture but this situation reverses during anomalously wet years where a net import of 404
remote moisture leads to greater rainfall totals. Regarding the shape of the vertical profiles we 405
found lower variability in the regimes with a strong coastal influence. Towards more continental 406
climate these profiles get more variable, and can even reverse sign in the whole vertical as in the 407
case of the ER. 408
409

19
5. Summary and discussion 410
In the present study we analyzed summer season variability in key elements of the 411
hydrological cycle from multiple datasets over four European regions – Iberian Peninsula (IP), 412
British Isles (BI), Central Europe (CE) and European Russia (ER). We also investigated lag-lead 413
relationships between different parameters and examined the vertical structure of atmospheric 414
moisture transport during anomalously dry/wet summers in the respective regions. 415
It is shown that in all regions considered except the IP region interannual variability of 416
summertime P (and soil moisture) is linked strongly to variations in horizontal atmospheric 417
moisture transport. Regarding the IP region, the detected weak links between the above 418
mentioned parameters were plausible because of the generally low P and prevailing dry 419
conditions in this region during the summer season. Due to these same reasons we also do not 420
find a significant link between AT and CWV in the IP region. Increased AT over the land is not 421
associated with higher CWV since the surface temperature over the ocean source regions [e.g. 422
Gimeno et al., 2010a] is considerably lower and the enhanced evaporation over land is inhibited 423
by low soil moisture content during summer in this region. During the summer season, western 424
and eastern parts of the Iberian Peninsula get moisture from different sources - the tropical-425
subtropical North Atlantic source and the IP – western Mediterranean source [Gimeno et al., 426
2010b]. In other regions considered the link between AT and CWV (determined by Clausius-427
Clapeyron equation) is very strong. Large correlations between summer P and relative humidity 428
(RH) revealed in this study (Table 1) are generally consistent with results of Ye et al. [2014] for 429
northern Eurasia which show that in summer RH is the primary contributor to P (and 430
precipitation efficiency) in the region. 431

20
Analysis of simultaneous and lag-lead links between soil moisture and P or AT on the other 432
side has shown that, in many cases the lagged correlations are larger than the respective 433
simultaneous correlations. It is expected that precipitation falling toward the end of a month will 434
influence soil moisture in the following month. Yet the time-scales of soil moisture depletion and 435
replenishment also indicate an important role for a delayed response between P or AT and 436
regional soil moisture during the summer season. It is found that AT coupling with soil moisture 437
variability is most important in the moisture limited IP region. On the contrary, in the CE region 438
AT does not appear to be strongly linked with interannual soil moisture variability during the 439
summer season. Regions in which P is re-evaporated and recycled, such as continental interiors 440
in summer, may potentially show stronger relationships with P than with soil moisture; for 441
example rainfall associated with cloudy conditions will reduce the surface heating from absorbed 442
sunlight whilst re-evaporation of any P will further reduce the fraction of surface net radiation 443
that directly heats the atmosphere through sensible heat fluxes. 444
Our analysis reveals contrasting vertical structures of the horizontal moisture transport 445
across the different regions in summer. We also found differing changes in moisture transport at 446
the different atmospheric levels associated with anomalously dry/wet summers in the European 447
regions analyzed in this study. In particular, the largest changes of moisture transport are 448
detected over the ER region during anomalously wet summers. In these summers climatological 449
moisture flux out of the region has changed to resulting moisture flux directed into the region. 450
The IP region experiences the greatest moisture inflow (at low levels) and outflow (at around 451
750hPa) yet is the strongest overall net exporter of moisture (1.7mm/day) of all regions 452
considered, indicating substantial depletion of soil moisture over the summer. This suggests that 453

21
precipitation minus evaporation can be negative over land during the summer season with 454
implications for future changes in aridity [e.g., Greve and Seneviratne, 2015]. 455
The present study reveals and compares specific features of summertime interannual 456
variability of the key elements of the hydrological cycle over four European regions. We found 457
differing interannual variabilities as well as different relationships between aspects of the 458
regional hydrological cycles. In particular, different roles of P and AT in soil moisture variability 459
are highlighted. We also found significant changes in atmospheric moisture transport at different 460
pressure levels during anomalously dry/wet years. Further diagnostic studies based on new 461
observational data and involving more parameters (e.g., evapotranspiration) as well as model 462
experiments will enable more accurate assessments of the revealed links and relationships 463
depicting the European hydrological cycle in the summer season. 464
465
Acknowledgments 466
IIZ was supported by the Russian Science Foundation grant # 14-37-00038 and by the 467
Russian Ministry of Education and Science under the contract #14.B25.31.0026. RPA was 468
supported by the Natural Environment Research Council SINATRA project (NE/K00896X/1). 469
MZ was supported through the Cluster of Excellence 'CliSAP' (EXC177), Universität Hamburg, 470
funded through the German Science Foundation (DFG). The soil moisture data was downloaded 471
from the NOAA CPC website: http://www.cpc.ncep.noaa.gov/soilmst/leaky_glb.htm. The ERA 472
Interim reanalysis data was downloaded from the ECMWF website: 473
http://www.ecmwf.int/en/research/climate-reanalysis/era-interim. The CRU data are provided by 474
the British Atmospheric Data Centre at the http://badc.nerc.ac.uk/home/index.html. 475
476

22
References 477
Albergel, C., and co-authors (2012), Soil moisture analyses at ECMWF: Evaluation using global 478
ground-based in situ observations, J. Hydrometeor., 13, 1442-1460. 479
Allan, R. P. and I. I. Zveryaev (2011), Variability in the summer season hydrological cycle over 480
the Atlantic-Europe region 1979-2007, Int. J. Climatol., 31, p.337-348 481
Barriopedro D, Fischer EM, Luterbacher J, Trigo RM, García-Herrera R. 2011. The hot summer 482
of 2010: Redrawing the temperature record map of Europe, Sciencexpress. DOI: 483
10.1126/science.1201224. 484
Bendat, J.S., and A.G. Piersol (1966), Measurement and Analysis of Random Data, 390 pp., John 485
Wiley, Hoboken, N. J. 486
Beniston M. 2004. The 2003 heat wave in Europe: a shape of things to come? An analysis based 487
on Swiss climatological data and model simulations. Geophys Res Lett 31: L02202, DOI: 488
10.1029/2003GL018857. 489
Berg, A., K. Findell, B.R. Lintner, and co-authors (2013), Precipitation sensitivity to surface heat 490
fluxes over North America in reanalysis and model data, J. Hydrometeor., 14, 722-743. 491
Berg, A., B.R. Lintner, K. Findell, and co-authors (2015), Interannual coupling between 492
summertime surface temperature and precipitation over land: Processes and implications for 493
climate change, J. Climate, 28, 1308-1328. 494
Blackburn, M., J. Methven, and N. Roberts (2008), Large-scale context for the UK floods in 495
summer 2007, Weather, 63, 280-288. 496

23
Christensen, J.H., and O.B. Christensen (2003), Severe summertime flooding in Europe, Nature, 497
421, 805-806. 498
Colman, A., and M. Davey (1999), Prediction of summer temperature, rainfall and pressure in 499
Europe from preceding winter North Atlantic ocean temperature, Int. J. Climatol., 19, 513-536. 500
Dee D.P., and co-authors (2011), The ERA-Interim reanalysis: configuration and performance of 501
the data assimilation system, Quat. J. Roy. Met. Soc., 137, 553-597. 502
Dirmeyer, P.A., M.J. Fennessy, and L. Marx (2003), Low skill in dynamical prediction of boreal 503
summer climate: Grounds for looking beyond sea surface temperature, J. Climate, 16, 995-1002. 504
Dole R, Hoerling M, Perlwitz J, and co-authors. 2011. Was there a basis for anticipating the 2010 505
Russian heat wave? Geophys Res Lett 38: L06702, DOI: 10.1029/2010GL046582. 506
Fan, Y., and H. van den Dool (2004), Climate prediction center global monthly soil moisture data 507
set at 0.5° resolution for 1948 to present, J. Geophys. Res., 109, D10102, doi: 508
10.1029/2003JD004345. 509
Garcia-Herrera, R., and co-authors (2007), The outstanding 2004/05 drought in the Iberian 510
peninsula: Associated atmospheric circulation, J. Hydrometeor., 8, 483-498. 511
Gimeno, L., A. Drumond, R. Nieto, R. M. Trigo, and A. Stohl (2010a), On the origin of 512
continental precipitation, Geophys. Res. Lett., 37, L13804, doi:10.1029/2010GL043712. 513
Gimeno, L., and co-authors (2010b), Where does the Iberian Peninsula moisture come from? An 514
answer based on Lagrangian approach, J. Hydrometeor., 11, 421-436. 515
Greve P., and S. Seneviratne 2015. Assessment of future changes in water availability and aridity. 516
Geophys Res Lett 42: 5493-5499, DOI: 10.1002/2015GL064127. 517

24
Harris I, Jones PD, Osborn TJ, Lister DH (2013) Updated high-resolution grids of monthly 518
climatic observations. In press, Int. J. Climatol. Doi: 10.1002/joc.3711 519
Hirschi, M., and coauthors (2011), Observational evidence for soil moisture impact on hot 520
extremes in southeastern Europe, Nat. Geosci., 4, 17-21. 521
Huang, J., H. van den Dool, and K.P. Georgakakos (1996), Analysis of Model-Calculated Soil 522
Moisture over the United States (1931-93) and Application to Long-Range Temperature 523
Forecasts, J. Climate, 9, No.6 524
Hurrell, J.W., and C.K. Folland (2002), A change in the summer atmospheric circulation over the 525
North Atlantic, CLIVAR Exch., 7(3-4), 52-54. 526
Koster, R.D., and M.J. Suarez (1995), Relative contributions of land and ocean processes to 527
precipitation variability, J. Geophys. Res., 100, D7, 13775-13790. 528
Koster, R.D., and coauthors (2004), Regions of strong coupling between soil moisture and 529
precipitation, Science, 305, 1138-1140. 530
Legates, R.L., and coauthors (2010), Soil moisture: A central and unifying theme in physical 531
geography, Progr. in Phys. Geography, 35, 65-86. 532
Lenderink, G., E. van Meijgaard, and F. Selten (2009), Intense coastal rainfall in the Netherlands 533
in response to high sea surface temperatures: analysis of the event of August 2006 from the 534
perspective of a changing climate, Clim. Dyn., 32, 19-33. 535
Marsh, T. J. and J. Hannaford (2007), The summer 2007 floods in England and Wales - a 536
hydrological appraisal. Centre for Ecology & Hydrology. 32pp. 537
Miralles, D.G., and coauthors (2012), Soil moisture – temperature coupling: A multiscale 538
observational analysis, Geophys. Res. Lett., 39: L21707, DOI: 10.1029/2012GL053703. 539
25
Mitchell, T.D., and P.D. Jones (2005), An improved method of constructing a database of 540
monthly climate observations and associated high-resolution grids, Int. J. Climatol., 25, 693-712. 541
Otto FEL, Massey N, van Oldenborgh GJ, and co-authors. 2012. Reconciling two approaches to 542
attribution of the 2010 Russian heat wave. Geophys. Res. Lett., 39: L04702, DOI: 543
10.1029/2011GL050422. 544
Pal, J.S., F. Giorgi, and X. Bi (2004), Consistency of recent European summer precipitation trends 545
and extremes with future regional climate projections, Geophys. Res. Lett., 31, L13202. 546
Ross, R.J., and Elliott, W.P. (1996), Tropospheric Water Vapor Climatology and Trends over 547
North America: 1973–93. J. Climate 9, 3561-3574. 548
Schär, C., D. Lüthi, and U. Beyerle (1999), The soil-precipitation feedback: a process study with 549
a regional climate model, J. Climate, 12, 722-741. 550
Schär, C., D. Lüthi, and U. Beyerle (2004), The role of increasing temperature variability in 551
European summer heatwaves, Nature, 427, 332-336. 552
Seneviratne, S.I., D. Lüthi, M. Litschi, and C. Schär (2006), Land-atmosphere coupling and 553
climate change in Europe, Nature, 443, 205-209. 554
Sutton, R.T. and B. Dong (2012) Atlantic Ocean influence on a shift in European climate in the 555
1990s, Nature Geoscience 5, 788–792, doi:10.1038/ngeo1595 556
Trenberth, K.E. (1999), Atmospheric moisture recycling: Role of advection and local evaporation, 557
J. Climate, 12, 1368-1381. 558
van den Dool, H., J. Huang and Y. Fan (2003), Performance and Analysis of the constructed 559
analogue method applied to US soil moisture applied over 1981-2001, J. Geophys. Res., 108, 1-560
16. 561
26
Vicente-Serrano, S.M., and coauthors (2014), Temporal evolution of surface humidity in Spain: 562
recent trends and possible physical machanisms, Clim. Dyn., 42: 2655-2674, doi: 563
10.1007/s00382-013-1885-7. 564
Ye H, Fetzer EJ, Wong S and co-authors (2014), Impact of increased water vapour on 565
precipitation efficiency over northern Eurasia. Geophys. Res. Lett., 41, 2941-2947, doi: 566
10.1002/2014GL059830. 567
Zahn, M. and R.P. Allan (2011) , Changes in water vapor transports of the ascending branch of 568
the tropical circulation, Journal of Geophysical Research - Atmospheres, 116, D18111, 569
doi:10.1029/2011JD016206 570
Zahn, M., and R.P. Allan (2013a), Quantifying present and projected future atmospheric 571
moisture transports onto land, Water Resources Res., 49, 7266-7277. 572
Zahn, M. and R.P. Allan (2013b), Climate Warming related strengthening of the tropical 573
hydrological cycle, Journal of Climate, 26, 562 - 574, doi: 10.1175/JCLI-D-12-00222.1 574
Zhai, P., and Eskridge, R.E. (1997), Atmospheric water vapour over China. J. Climate 10, 2643-575
2652. 576
Zveryaev, I.I. (2004), Seasonality in precipitation variability over Europe, J. Geophys. Res., 109, 577
D05103, doi: 10.1029/2003JD003668. 578
Zveryaev, I.I., and Allan, R.P. (2005), Water vapor variability in the tropics and its links to 579
dynamics and precipitation. J. Geophys. Res. 110, D21112, doi: 10.1029/2005JD006033. 580
Zveryaev, II, J Wibig, and Allan RP (2008), Contrasting interannual variability of atmospheric 581
moisture over Europe during cold and warm seasons. Tellus, 60A, 32-41. 582

27
Zveryaev II, Allan RP (2010), Summertime precipitation variability over Europe and its links to 583
atmospheric dynamics and evaporation. J. Geophys. Res. 115, D12102, doi: 584
10.1029/2008JD011213. 585
Zveryaev, II, Rudeva IA (2010), Intraseasonal non-stationarity of the leading modes of 586
atmospheric moisture over Europe during summer. Clim. Dyn. 36, 83-95. 587
588
Table Captions 589
Table 1. Correlation coefficients between regional time series of seasonal mean summer 590
precipitation, soil moisture, air temperature, CWV, CWVrat, RH and horizontal moisture 591
transport. Coefficients, shown in color, are statistically significant at the 95% significance level. 592
Table 2. Correlation coefficients between regional time series of monthly mean soil moisture, 593
precipitation and air temperature. Coefficients, shown in bold, are statistically significant at the 594
95% significance level. 595
596
Figure Captions 597 598 Figure 1. Summer (JJA) mean CWV distribution over Europe. Black curves indicate boundaries 599
of the regions under analysis. 600
Figure 2. Regional time series of normalized anomalies of seasonal mean summer precipitation 601
(blue curve), soil moisture (green curve), and air temperature (red curve). 602
Figure 3. Regional time series of normalized anomalies of seasonal mean summer CWV (violet 603
curve), CWVrat (green curve), and horizontal moisture transport (blue curve). 604

28
Figure 4. Climatological vertical structure of horizontal moisture transport over four European 605
regions. Positive (negative) values indicate resulting moisture flux into (out of) the region. 606
Figure 5. Vertical structure of horizontal moisture transport over IP region during selected 607
anomalously dry (a, b) and wet (c, d) summers (red) and the JJA mean profile (blue). Positive 608
(negative) values indicate resulting moisture flux into (out of) the region. 609
Figure 6. Vertical structure of horizontal moisture transport over BI region during selected 610
anomalously dry (a, b) and wet (c, d) summers (red) and the JJA mean profile (blue). Positive 611
(negative) values indicate resulting moisture flux into (out of) the region. 612
Figure 7. Vertical structure of horizontal moisture transport over CE region during selected 613
anomalously dry (a, b) and wet (c, d) summers (red) and the JJA mean profile (blue). Positive 614
(negative) values indicate resulting moisture flux into (out of) the region. 615
Figure 8. Vertical structure of horizontal moisture transport over ER region during selected 616
anomalously dry (a, b) and wet (c, d) summers (red) and the JJA mean profile (blue). Positive 617
(negative) values indicate resulting moisture flux into (out of) the region. 618

Figure 1
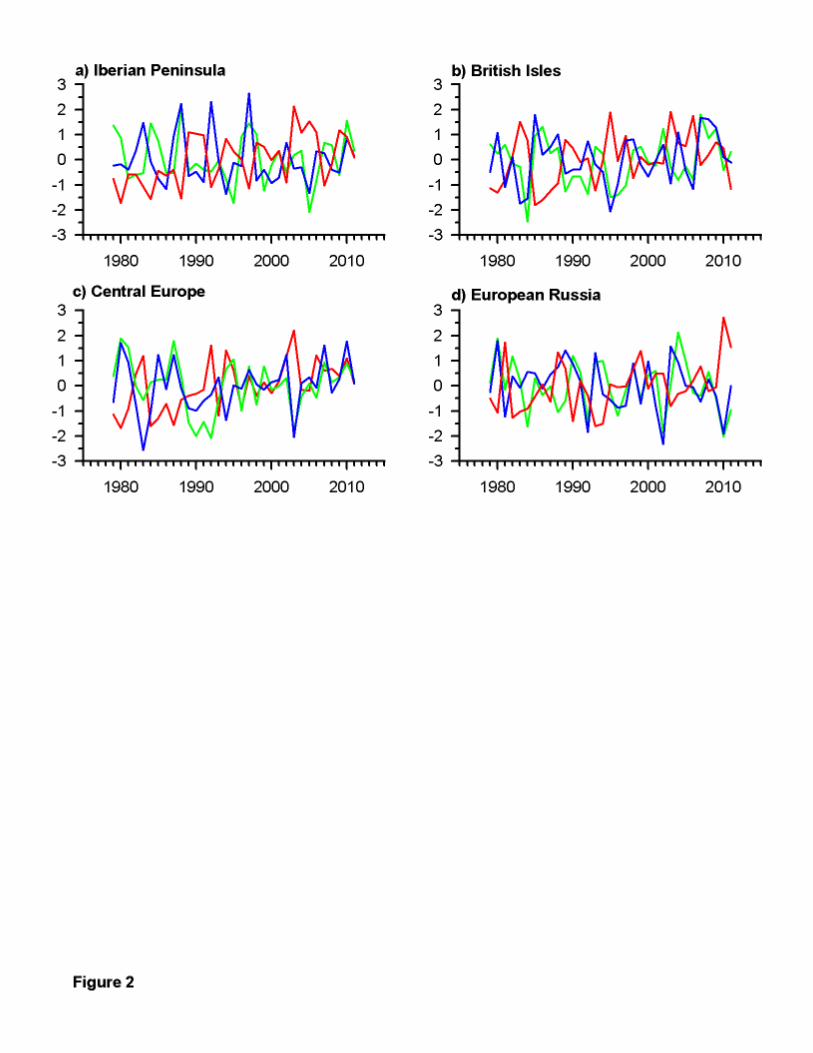
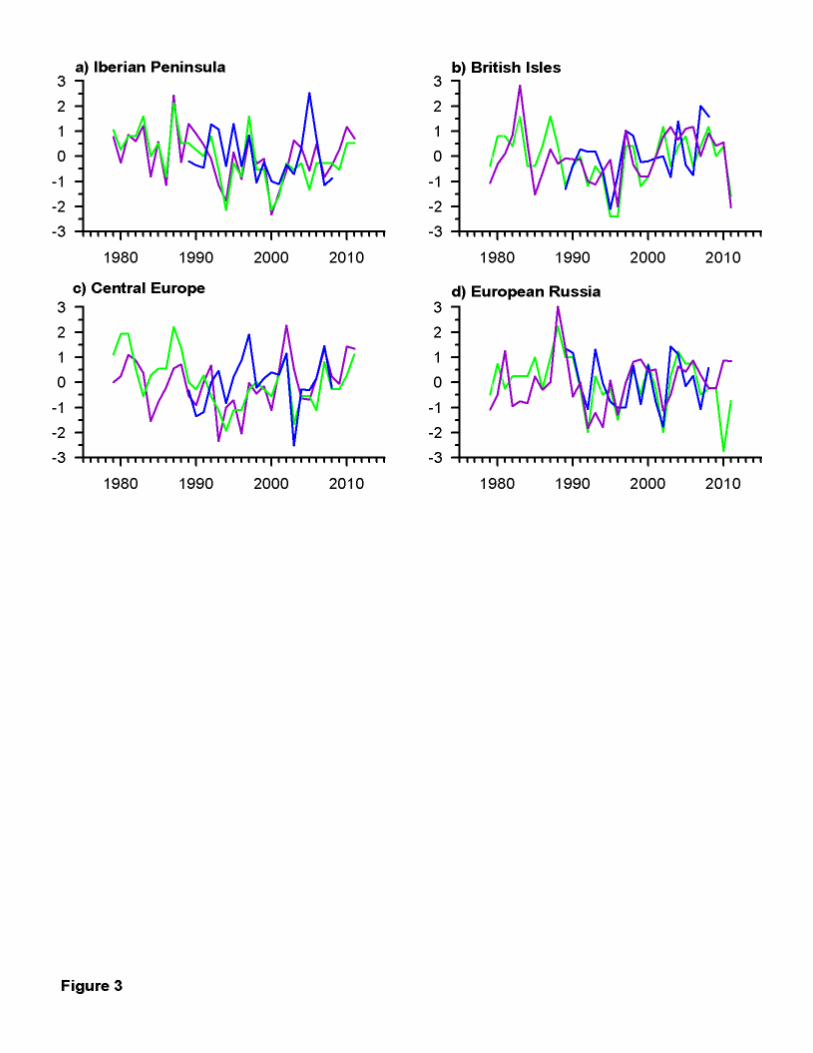
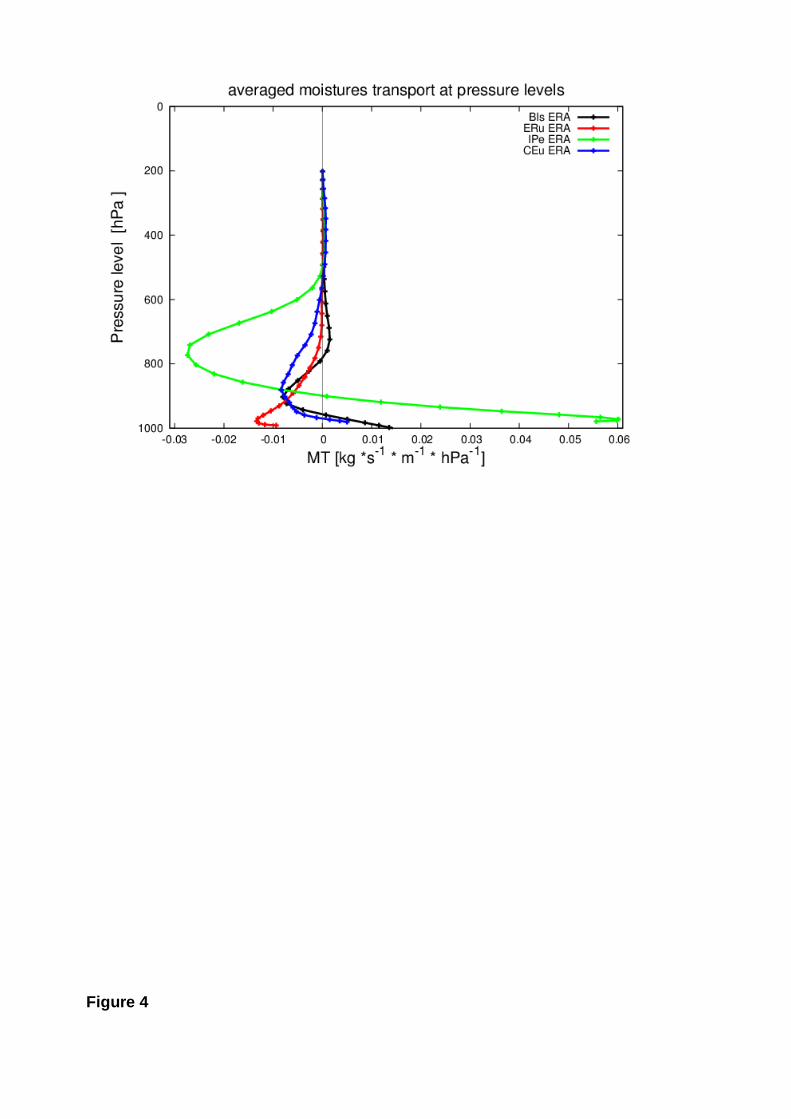
Figure 4

a) b)
c) d)
Figure 5
a) b)
c) d)
Figure 6

a) b)
c) d)
Figure 7

a) b)
c) d)
Figure 8

IP region TMP SM CWV MT CWVr RH PRE -0.53 0.34 0.36 0.30 0.67 0.83
TMP -0.41 0.11 0.02 -0.42 -0.52
SM 0.06 -0.55 0.25 0.20
CWV 0.22 0.84 0.70
MT 0.25 0.31
CWVr 0.94
BI region TMP SM CWV MT CWVr RH PRE -0.48 0.57 -0.15 0.93 0.38 0.86
TMP -0.56 0.64 -0.46 -0.16 -0.72
SM -0.11 0.55 0.43 0.65
CWV 0.19 0.64 -0.16
MT 0.70 0.92
CWVr 0.57
CE region TMP SM CWV MT CWVr RH PRE -0.33 0.61 0.28 0.86 0.54 0.56
TMP -0.31 0.42 -0.24 -0.53 -0.81
SM 0.27 0.59 0.54 0.49
CWV 0.12 0.53 0.16
MT 0.42 0.51
CWVr 0.90
ER region TMP SM CWV MT CWVr RH PRE -0.46 0.60 0.16 0.96 0.80 0.80
TMP -0.55 0.70 -0.46 -0.33 -0.78
SM -0.09 0.64 0.56 0.62
CWV 0.24 0.43 -0.16
MT 0.79 0.84
CWVr 0.79
Table 1

IP PRECIPITATION AIR TEMPERATURE SM JUN JUL AUG JUN JUL AUG MAY 0.21 0.02 -0.19 -0.30 -0.29 -0.34 JUN 0.42 0.04 -0.15 -0.49 -0.35 -0.37 JUL 0.55 0.20 -0.09 -0.58 -0.43 -0.40 AUG 0.55 0.32 0.11 -0.57 -0.50 -0.49
BI PRECIPITATION AIR TEMPERATURE SM JUN JUL AUG JUN JUL AUG MAY -0.03 -0.14 -0.01 -0.02 0.07 -0.11 JUN 0.33 -0.14 -0.05 -0.18 -0.06 -0.19 JUL 0.57 0.34 0.15 -0.20 -0.38 -0.37 AUG 0.40 0.67 0.65 -0.09 -0.58 -0.62
CE PRECIPITATION AIR TEMPERATURE SM JUN JUL AUG JUN JUL AUG MAY 0.07 -0.03 0.14 -0.03 0.12 -0.12 JUN 0.34 -0.04 0.17 -0.23 0.04 -0.18 JUL 0.56 0.39 0.10 -0.24 -0.26 -0.24 AUG 0.44 0.59 0.37 -0.07 -0.36 -0.35
ER PRECIPITATION AIR TEMPERATURE SM JUN JUL AUG JUN JUL AUG MAY -0.12 -0.08 -0.01 -0.05 0.09 0.12 JUN 0.28 -0.01 0.04 -0.31 -0.07 -0.07 JUL 0.53 0.39 0.09 -0.52 -0.36 -0.25 AUG 0.39 0.61 0.47 -0.39 -0.52 -0.45