interactive of gadolinium poisoned pins in bwrs p, wydler
TRANSCRIPT
NEACRP - A - 567
Benchmark on Interactive Effects of Gadolinium
Poisoned Pins in BWRs
C, Maeder and P, Wydler
EIR, 5303 WLirenlingen, Switzerland
Status report prepared for the
26th meeting of NEACRP, Oak Ridge, USA, October 17 - 21, Kl83
In this report the results of the bumup calculations for a
simplified BWR fuel element with two adjacent gadolinium rods
are presented and discussed. Complete solutions were contri-
buted by FEZXX, Italy, ,Japan, Switzerland and the UK. Partial
results and additional calculations obtained from Denmark,
Italy, Poland and the US are included in the Appendices.

.
-l-
contents
summary
;
.
1. Introduction
2. Problem Specification
3. Participants
4. Calculational Methods
5. Definitions and Method of Evaluation
6. Results
7. Discussion of the Results
8. Conclusions
9. References
Acknowledynent
Tables 1 - 30
Fiyures 1 - 26
l Appendix A:
Appendix B:
Appendix C:
Appendix D;
Appendix E:
Shadowiny Effect of Poisoned Pins
Influence of Calculation Models on Reactivity
Reaction Rates for the Reyular Lattice
Partial Solutions
Solutions Submitted after September 10, 1983
2
3
4
6
11
13
15
18
19
21
22
38
Al
A3
A5
A6
A9
-2-
1. Introduction
From 1974 till 1977 the Nuclear Energy Agency Committee on Reactor Physics
(NEACRP) sponsored a BWR lattice benchmark exercise (L). Two of the con-
sidered lattices contained isolated.gadolinium fuel rods. In the meantime
fuel elements with adjacent poisoned fuel pins have been introduced in
BWRs to enhance the performance of the fuel. It has to be checked, whether
the calculational methods used in BWR core analysis can adequately predict
the resulting mutual shielding of the pins and, in particular, its effect
on the depletion of the burnable poison.
In view of this development, the Swiss Federal Institute for Reactor Re-
search (EIR) in 1980 proposed a naw gadolinium benchmark for a simplified
BWR fuel element with 14 unpoisoned and 2 adjacent poisoned fuel rods. The
intension was to investigate whether calculational methods used for iso-
lated Gd pins are capable of treating this nwre complex geometry with
sufficient accuracy. A preliminary calculation, in which an azimuthal
variation of the flux was taken into account in the Gd pin cells (cf.
Appendix A), indicated that the shadowing effect of neighbouring Gd rods
is small.
.’
.
‘.
First results for the benchmark problem with adjacent Gd rods, contributed
by EIR, EPRI and the Institute of Nuclear Research Swierk wera presented
at the European Nuclear Conference at Brussels in April 1982 CL). In
autumn 1981 the NEACRP provided an organisational basis for the new bench-
mark. In contrast to the earlier NEACRP lattice benchmarks (L), in which
6-group macroscopic cross sections "era prescribed, the participants wera
asked to use their own cross sections libraries and group structures and to per-
form burnup calculations up to 10 GWd/t. In addition, a reference solution
for the regular unpoisoned pin was requested, allowing checks on basic data
and calculational methods to be made (2).
The results obtained till sufmner 1982 were documented in a progress report
prepared for the 25th meeting of the NEACRP (4-j. Xn the meantime additio-
nal solutions have been obtained from Denmark, France, Italy and Japan bringing
the total number of solutions up to 11.
-3-
‘.
.
:
!Co be able to present consistent standard deviations in th& tables of the
present report, the submitted results have been divided into 7 complete
solutions, which are discussed in the main part of the report, and 3 partial
solutions (from ENEA, EPRI and SWIERK), for which multiplication factors
only are given in Appendix D. The submitted ENEA- and RIS@-results are listed
in Appendix E.
2. Problem Specification
The simplified fuel element, as' shorn in Fig. 1, consists of 14 initially
identical unpoisoned fuel rods and 2 Gd rods. Taking the synnnetry into
account, the 16 pins can be reduced to 5 different unpoisoned pins (numbered
1 to 5 in Fig. 1) and a single Gd pin (number 6). Reflective boundary con-
ditions are prescribed on the four surf,aces. The material properties are as
follows:
Fuel:
ClS3d:
Material = UO 2, density = 10 g/cm3, temperature = 60V°C,
U-235 enrichment = 3 weight-%, diameter = 1 cm.
The Gd pin contains 3 weight-% of Gd203
(i.e. 0.3 g/cm3 Gd203 and 9.7 g/cm3 UO2).
Material = Zircaloy-2, density = 6.55 g/cm3,
temperature = 300 OC, inside diameter = 1 cn~,
outside diameter = 1.2 cm.
Moderator: Material = H20, void content = @A, state of saturation at
a temperature of 286 'C (pressure = 70.06 bar), lattice pitch = 1.6 cm.
The assembly average power density is 20 W per gram of the uranium metal
in the fresh fuel.
The following results are requested for assetily average exposure steps of
1 GWd per metric ton of loaded U metal up to 10 GWd/t:
- The multiplication factor km,
- the relative power of the 6 different rods normalised to an
assembly avarage value of 1,

-4-
- the Gd pin avaraga densities of the isotopes Gd-155, Gd-157, U-235,
Pu-239 and ~~-240 in atoms/barn.cm,
- the spatial distribution of the Gd isotopes at 2 GWd/t. .’
A burnup calculation has also to be performed for a regular lattice without
burnable poison rods. The regular lattice is equivalent to a single un-
poisoned fuel pin with a IJO density of 10 g(cm3 and the associated cladding
and moderator. The infinite multiplication factor and the fuel pin awraga
densities of V-235, Pu-239 and Pu-240 are requested for the same burnup
intervals of 1 GWd/t.
In addition, the calculational method has to be briefly described.
3. Participants
The following organisations and authors participated in the benchmark
calculations:
AEEW:
AMN: -
CEA: -
CISE:
M.J. Halsall Atomic Energy Establishment Winfrith Dorchester, Dorset England
P. Neuhold AMN Ansaldo Impianti Via Gabriele D'Annunzio, 113 I-16121 Geneva Italy
P. Chaucheprat, G. Girieud and B. Nouveau Ddpartement des rgacteurs & eau Centre d'&udes nucl&ires de Cadarache B.P. No. 1 F-13115 Saint Paul l.ez Durance France
G. Pierini Centre ~nfomazioni Studi Esperienze P.O. BOX 12081 I-20134 Milan Ztaly

-5-
C. Mae&x Eidg. Institut fiir Reaktorforschung CH-5303 W~renlingen Switzerland
NAIG: M. Yamanmto and H. Mimta Nippon Atomic Industry Group 4-l Ukishima-cho, Kawasaki-ku Kawasaki, 210 Japan
:
OSAKA: T. Take& a& H. Sat0 Osaka Vniversity Faculty of Engineering, Nuclear Engineering Yam&-oka 2-1, Suita Osaka
K. Shinhama and H. Kmmbata Jap~an Information Service, Tnc., Tosabori 2-2-7, Nishi-ku Osaka Japan
Partial solutions were provided by:
ENEA F. Casali Centre Nazionale Energia Nucleate e Energie Alternative Centm Ricerche Energie “Ezio Clem.stel” Via G. Mazzini, 2 I-40138 Bologna Italy
EPRI: B.A. Zolotar .Electr.ic Power Research Institute P.O. Box 10412 Pa10 Alto, CA 94303 USA
SWIERK: K. Kowalska Institute of Nuclear Research Swierk PL - 05400 Otwock Poland

-6-
4. Calculational Methods
An overview of the adopted calculational methods is given in TAB 1.
The following descriptions are based on the summaries provided by the
participants.
4.1 AEEW
The solution is based on standard design calculation options normally used
in LWRWIMS (5). The exercise was taken as an opportunity to test the rela- - tively new CACTUS characteristics transport code in order to assess the
importance of a detailed spatial calculation.
A 28 group condensed WIMS library of cross-sections was used, with identi-
fiers 2235, 7238, 5239 for U-235, U-238 and Pu-239 and the pseudo-fission
product scheme as defined in Ref.(z).Cross-sections in 28 qroups were gs-
nerated using WIMS equivalence theory for the resonance qroups, and a
multicell collision probability calculation wag used to generate 28 group
fluxes for each region in the problem. For the design calculation there
wars nine regions: fuel, can and coolant for standard pins and 4 fuel zones
plus can and coolant for the Gd pins. Condensation to 6 qroups (with
boundaries at 821 keV, 9118.4, 0.625 and 0.140 eV) and pin-cell smearing wers followed by a straightforward diffusion theory solution in 4 x 4
meshes. For the re9ular lattice cass a simple pin-cell calculation was
made as above, and the smearing and diffusion calculations were omitted.
. .
Depletion is by numerical integration allowing only for the variation of
gadolinium through the fuel pin. Adjustments wars made by using the "FXNE"
option to radial reaction rates of gadolinium at 200 MWd/t intervals with
the full lattice calculation interval of 1000 MWd/t. The so-called
"DIFFERENTIAL" option was invoked to calculate the pin by pin isotopic
compositions for uss in evaluating the powsr distribution.
An alternative solution method which does not require pin cell smearing is
the CACTUS option in LWRWXMS. This method is based on explicit tracking
through the problem, integration of thetransport equation along each track
segment, and numerical integration of the scalar flux by means of tracks at
appropriate spaciny and angles. A detailed CACTUS calculation with 170

-7-
spatial .zone.s was made for the poisoned lattice at start of life.
The results given in this report are based on a depletion calculation using
the diffusion theory method with "FINE" and "DIFFERENTIAL" options. How-
ever, the calculation was normalised to the detailed CACTUS eigenvalue by
adjusting the poison pin dimensions. To reduce the initial km from the
value of the adjusted desiqn calculation (1.0253) to the value of the de-
tailed CACTUS calculation (1.0093) it was found necessary to increase the
poison pin radius from 0.5 cm to 0.5775 cm. The fuel density was correspon-
dingly reduced and the clad density increased to preserve the total numba's
of atoms. This technique is currently used at Winfrith in PWR design cal-
culations to correct the initial worth of boron poison pins.(c).
0 4.2 AMN
:
a
Modules of the BLA code system were used to perform the following calcula-
tion steps:
1) Preparation of (one-group) thermal cross SectJons;
A transport theory method was used for averaging cross sections in the
pin cells. An additional supercell calculation provided the fluxes for
collap3inq the energy groups in the Gd pin cell.
2) Preparation of epithermal and fast cross sections (one broad qroup in
each enerqy ranqe). Epithermal cross sections were qenerated using a
GAM type ~??sonance calculation and a B-1 flux solution. In the top (fast)
broad qroup a discrete collision probability calculation was performed.
This allowed the fast fission effect to be treated appropriately. The.'
exposure dependence of the resonance cross sectionsincludes effects due
to isotope concentration, Dancoff factor and neutron spectrum.
3) 2-D lattice calculation:
Three-qroup diffusion theory was used, and each square fuel cell was
divided into a square fuel pin and a surrounding homoqenized clad-water
region (this procedure permits the modellinq of spatially varying void
contents).
-a-
4) Effects of c?x&msure:
The thermal/epithermal cz'oss sections and 2-D fluxes were recalculated
after specified exposure steps.
4.3 CEA -
The calculations were performed with the APOLLO-NEPTUNE code which is beiny
developed by the CEA for light water reactor calculations CL). The APOLLO
code solves the transport equation in its integral form by the collision
probability method in the multigroup approximation. Tn the calculation 99
ane~'yy groups with 52 fast and 47 thermal groups were used (the thermal cut-
off is located at 2.8 eV).
The lattice calculations were performed with the ROT 4 option of the EVRYDICE a code (g), which is based on the following approximations:
- Four entering currents per cell.
- WIGNER cylindrization which respect to the tie11 Volume.
- The current anisotropy on the cell surfaces is neylected.
The calculations were carried out with a spatial mesh consistiny of 56 points
(22 independent points), these being distributed as follows:
- 7 points in each Gd pin cell. The fuel was divided into 5 spatial zones
ofequal volume to be able to calculate the fine spectrum flux in the
poisoned pin.
- 3 points in every UO2 cell. In the burnup calculations the depletion chain uranium + neptunium + plu-
tonium and the complete gadolinium chain from Gd-154 to Gd-160 were con-
sidered. The self-shieldiny of the resonance nuclei was recalculated for
each burnup step.
4.4 CISE
The calculations were performed with the NUOVO AUTOBUS code (z), which pro-
vides libraries of nuclear parameters for LWR fuel elements. The code is
capable of describiny several types of compositions (fuel, fuel with Gd
content, borosilicate, structural materials, cross control rods, Ay-Cd-In
rods) and solves two-dimensional finite difference diffusion equations in
five yroups with eneryy boundaries at 183 keV, 5.S keV, 0.625 .eV and 0.2 eV.

-9-
Correlated group constants are used for the 'reiular cells. For the Gd pins
the transport-evaluated cross sections are properly modified to preserve the
correspondiny absorption rate.
4.5 EIR -
The solution is based on the code BOXER (c) and a 70-yroup library, with
resonance parameters, which. was derived from ENDF/B-4. The resonance ranye
is treated by a two-reyion collision probability method in,= few thousand
eneryy points. The cylindricalized fuel cells were calculated in the 70
energy yroups with en inteyral transport method assuming a first order spa-
tial polynomial approximation for the scatteriny source in each zone. The
Gd pin was divided into 4 annular zones of eq&l volume. The outgoiny sur-
face flux of the unpoisoned cell served as the boundary condition for the
Gd cell calculation. The pin cell homogenization was performed by flux-
volume-weiyhting with an energy dependent heterogeneity correction in the
Gd cell.
The lattice calculation in x-y yeometry used 11 eneryy yroups with upper
boundaries at 15 MeV, 0.821 MeV, 907, 76, 16, 4, 0.625, 0.32, 0.14, 0.058
and 0.025 eV. The calcul.ation is based on a transmission probability trans-
port method which approximates the anyular dependence of.the mesh surface
flux by a first order quadrupole spherical harmonics expansion and uses a
linear spatial representation of the volume source and of the mesh surface
flux.
The first two burnup step lengths were 0.1 and 0.4 GWd/t. These were
followed by steps of 0.5 GWd/t up to 5 GWd/t and +teps of 1 GWd/t beyond
5 GWd/t. After each step a cell calculation in the thermal energy ranye be-
low 4 eV and a twodimensional lattice calculation were perfortied. The time
dependence of the microscopic cross sections is taken into account by re-
calculating the burnup step usiny the one-yroup cross sections at the end
of the step (predictor - corrector method) end by a density dependent self-
shielding factor for the isotopes Pu-239 and Pu-240. Within .a burnup step the
neutron flux is expanded into .e second order Taylor series in the time
variable.
- 10 -
4.6 NAIG
The data base used for the calculations is ENDF/B-5 for the main fertile
and fissile nuclides and ENDF/B-4 for the remaining isotopes. The cross
section library contains 68 enei-gy groups in the fast and epithermal range
(GAM type structure) and 30 groups in the thermal range (THERMOS structure).
The TGBLA model (11) uses a spatially dependent neutron energy spectrum to -
construct three-group (fast, epithermal and theimal) cross sections with
transport theory corrections for a diffusion theory calculation.
In the epithexmal energy range, the level-wise resonance integrals are cal-
culated by an improved intermediate resonance approximation with parameters
depending on the fuel temperature. The thermi neutron spectra in the fuel
cells are calculated using a method which is similar to the THERMOS forma-
lism. The major difference is that the neutron leakage from rod to rod is
taken into account. The leakage is determined by diffusion theory and fed
into the thermal spectrum calculation. Iterations between assembly diffusion
theory calculation and thermal spectrum calculation are carried out to de-
termine accurate, spatially dependent, thermal cross sections. The Gd rods
were subdivided into 10 regions of equal volume.
In the burnup calculations 100 isotopes are treated, including 25 fissile
and fertile isotopes and 48 fission products plus one pseudo fission pro-
duct. An improved burnup integration scheme is employed that avoids nu-
mez-ical problems associated with the stiff set of equations encountered in
poison burnup calculations. New flux spectra were calculated at 0, 0.2, 0.5,
1, 2, . . . . 10 GWd/t.
4.7 OSAKA
The solution was. obtained with the RESPLA code (g). RESPLA uses the 69
group WIMS cross section library for all nuclides except gadolinium and
69 group cross sections generated from ENDF/B-3 for the gadolinium iso-
topes.
The pin cell calculations were carried out in cylindrical approximation.
For the Gd pins a supercell, consisting of a Gd pin which is surrounded
by a mixture of the adjacent eight pin cells, was used to calculate the

- 11 -
the flux fine structure. Each fuel pin including the Gd pin was divided into
six regions of equal volume. Based on these cell calculations the fine group
microscopic cross sections were condensed to 6,group cross sections with
energy boundaries at 0.821 MeV, 9.118 keV, 9.B77, 0.625 and 0.14 eV.
For the lattice calculation RESPLA utilises a transmission probability
method in which PO and Pl angular components of the neutron current a-e
considered. Each pin cell surface is divided into three subsurfaces to take
account of the spatial distribution of the neutron current. The heteroge-
neity within each pin cell is treated with response matrices obtained from
the pin cell calculations. The burnup calculation was performed using the
time steps 0.1 GWd/t, 0.4 GWd/t and 0.5 GWd/t thereafter. The flux and the
cross sections are assumed to be constant during e. time step.
5. Definitions and Method of Evaluation
In the evaluation of the results the following notation is used:
Varaibles and calculated quantities:
N = 7 = number of participants
E = exposure (GWd/t)
k = infinite neutron multiplication factor (-)
d = isotopic density (atoms/barn-cm)
Indices
lY?q = regular lattice
poi = poisoned lattice
25 = U-235
49 = Pu-239
40 = Pu-240
155 = Gd-155
157 = Gd-157
Gd = gadolinium

- 12 -
From the submitted Xx?sult~ the following quantities an? derived:
Densities (dimensionless):
U-235 destruction: D25CEJ = L
d25COJ - d25(EJ 1 / d2$W Gd destruction: DGdW = dGdCO) - dGd(EJ 1 / aGdm , Total Gd density (atoms/barn.cm):
Reactivities (dimensionless):
Gadolinium reactivity worth:
Reactivity loss in the regular lattice:
Reactivity gain in the poisoned lattice:
P poi(EJ = kpoi(E) - kpoiCl) 1 / kpoiW In these formulae k(l) = k(E=l GWd/t) is chosen as the reference multipli-
cation factor in order to separate the xenon effect from the calculated
reactivity effects.
Standard deviations:
If yn(E) denotes any of the submitted or derived quantities of partici-
pant n (n = 1, 2, . . . . NJ, the rneaa value of all participants is defined
by
- 13 -
The standard deviation (calkd STA.DEV. in the tables) is
and the coefficient of variation (called VARIATION in the tables) is
In TABS 2 - 26, in addition to the mean value, the standard deviation is
given for normalised quantities (relative power, reactivity and destruc-
tion) and the variation for the other quantities (multiplication factor and
densities).
In TABS 16 - 17 the reactivity deviation from the mean is calculated as
ApnCEl = kn(E, - r(E) 1 / FiE, .
6. Results
The submitted results ara listed in TABS 2 - 13 and represented graphi-
cally in FIGS 2 - 13 (figure numbers agree with the corresponding table
numbers,. If possible, corresponding results for the regular and the
poisoned lattice are shown on the same page.
The spatial distributions of the Gd isotopes at 2 GWd/t wera presented by
all participants as average values in annular zones. However, as can be
seen in TAB 1, the different participants chose different numbers of annuli
and different annular boundaries. To determine comparable quantities,

- 14 -
quadratic interpolation functions ss s function of r2 (r = radius) were
fitted to the submitted radial distributions. From these functions average
values in 4 zones of equal volume (as. used in the EIR solutions) were de-
rived. The values sre listed in TABS 14 - 15 and plotted in the form of
histograms in FIGS 14 - 15.
From the submitted multiplication factors and denskties the following
quantities ss defined in section 5 wers derived:
- R@activity deviations (TABS 16 - 17 and FIGS 16 - 17)
-~ gadolinium reactivity worth (TAB 18 and FIG 18)
- gadolinium destruction (TAB 19 and FIG 19)
- reactivity gain in the poisoned lattice ss a function of exposure
and of the Gd destruction (TABS 20 - 21 and FIGS 20 - 21)
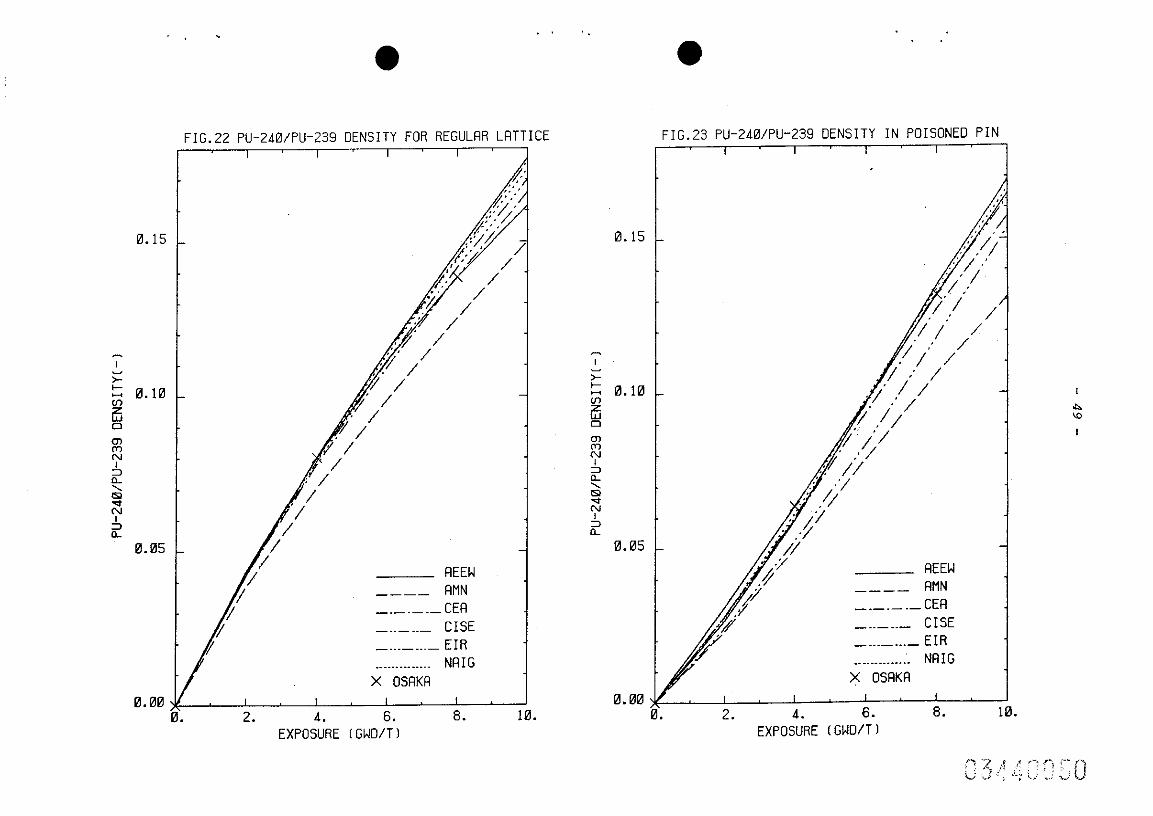
- plutonium ratio (TABS 22 - 23 and FIGS 22 - 23)
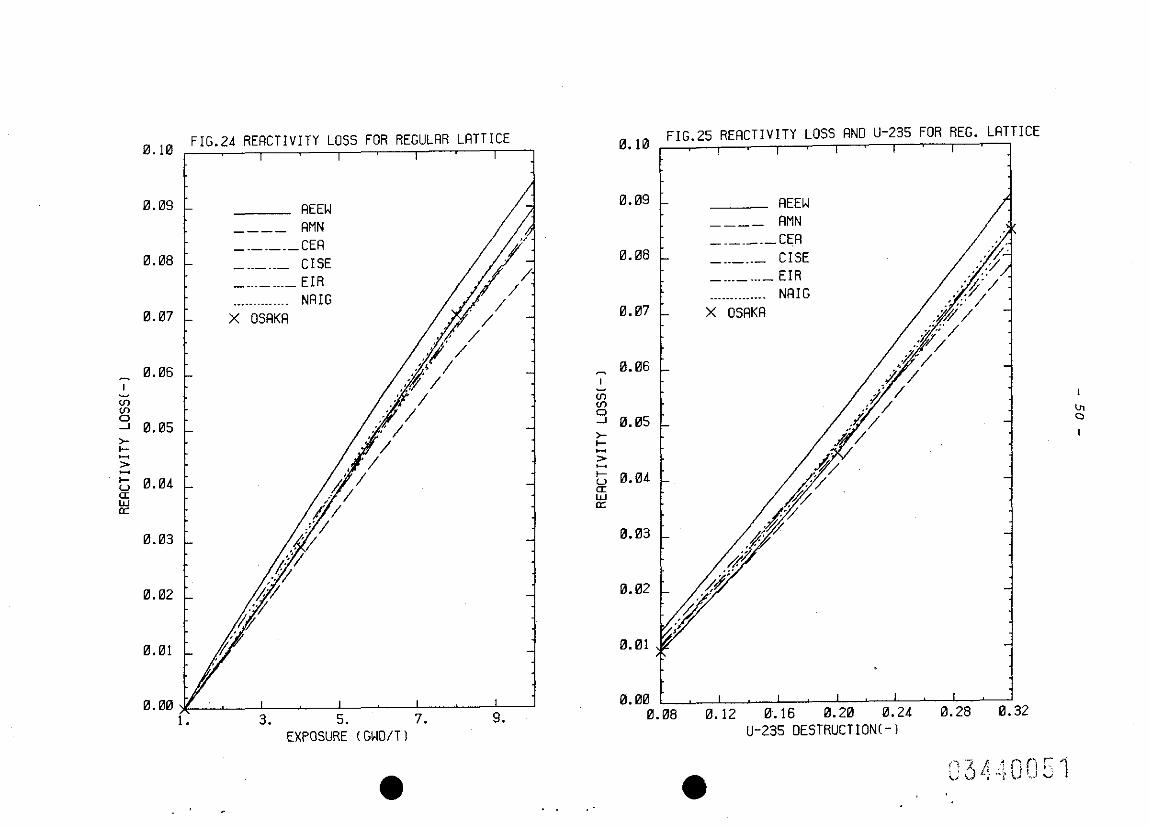
- reactivity loss in the regular lattice ss s function of exposure,
u-235 destruction and Pu-239 density (TABS 24 - 26 and FIGS 24 - 26).
A quadratic interpolation was used to determine the reactivity gain (loss)
at given values of the Gd destruction, V-235 destruction and Pu-239 den-
sity (see TABS 21 and 25 - 26).
.’
l

- 15 -
7. Discussion of the Results
To facilitate the subsequent discussion of exposuz'e dependent effects it is
useful to begin with an analysis of the influence of the Gd poisoning on the
neutron flux and the microscopic capture and absorption rates (uc$ and ~a$)
in the fresh lattice.
3-group flux spectra in the regular lattice and in the poisoned cell at zero
burnup are compared in TAB 27. Due to the large thermal cross sections of the
Gd isotopes the flux below 0.6 eV is reduced in the Gd cell, while, above this
energy limit, no appreciable effect on the flux spectrum can be detected.
however, because of the normalisation to the equal power density of 20 W/g
in both lattices, the energy integrated flux is larger in all cells of the
poisoned lattice.
The hard spectrum reduces the one-group cross sections of.a.11 nuclides in the
Gd cell (TAB 28). The largest reductions occur for the nuclides with impor-
tant resonances in the thermal energy range, i.e. for the Gd isotopes, U-235
and Pu-239. The cross sections of U-238 and Pu-240, whose resonances lie
above 0.6 eV, are only slightly affected.
The net effects of the flux and cross section changes on the reaction rates
are as follows:
- Capture and absorption rates of u-235 and Pu-239 are smaller in the
poisoned cell than in the regular lattice.
- The V-238 reactions remain practically unchanged.
- Pu-240 reaction rates become somewhat larger in the Gd cell (TAB 28).
The relative effects on the time variation of the nuclide densities in the
regular and the poisoned case can now be understood easily:
- The smaller absorption rate of U-235 in the poisoned cell causes a smaller
amount of v-235 destruction (TABS 4 and 5).
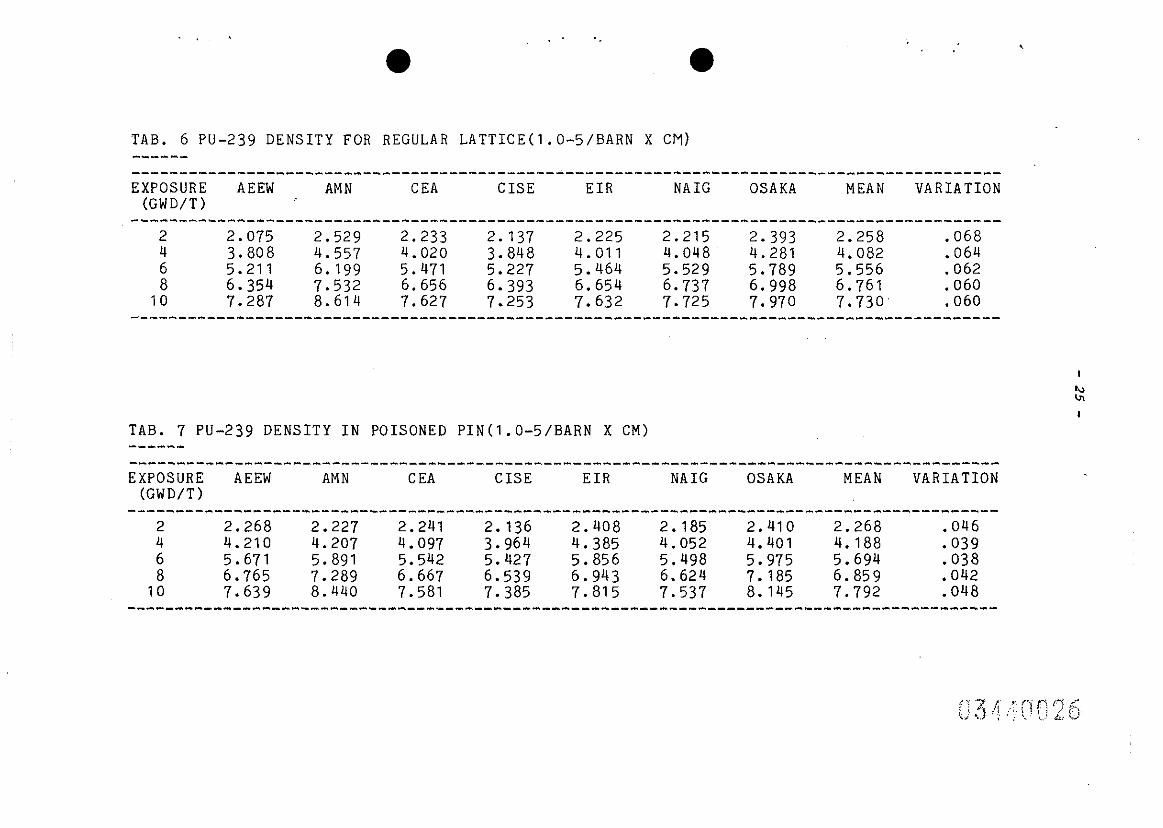
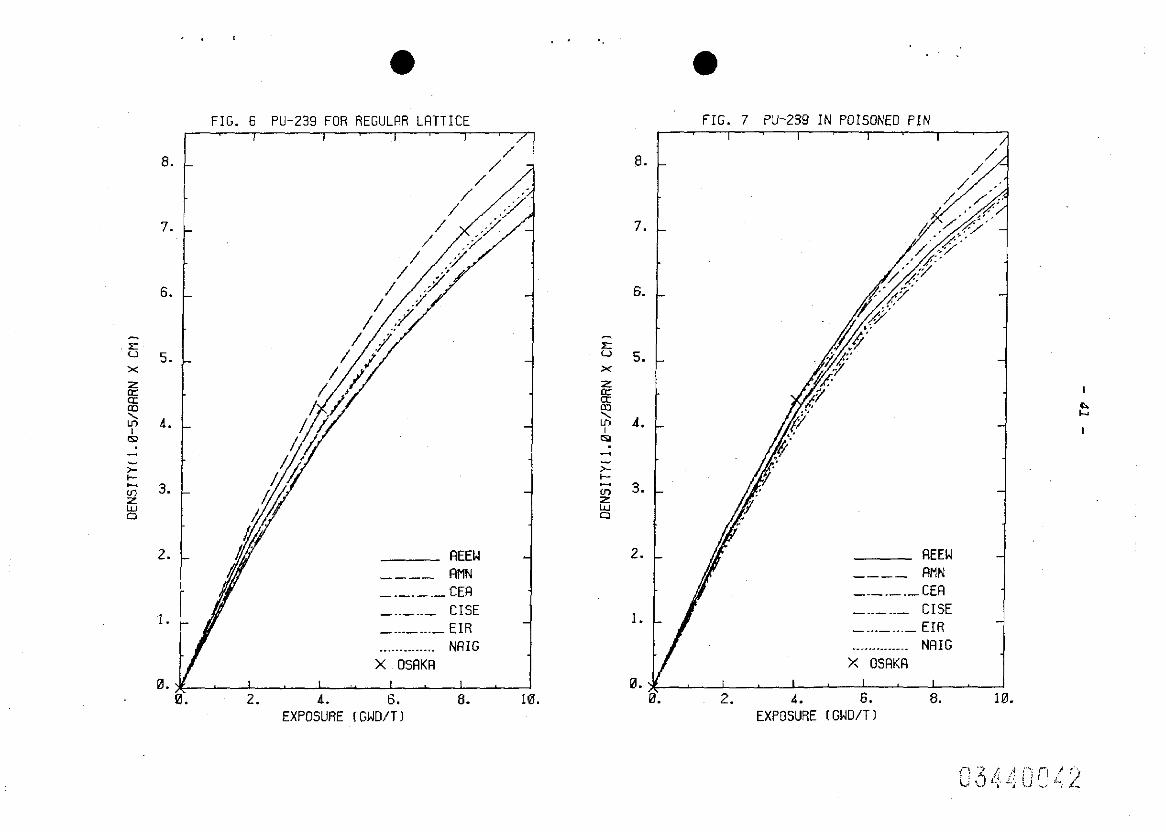
- The smaller Pu-239 absorption, together with only a negligible change in
U-238 capture increases the buildup of Pu-239 in the poisoned cell (TABS
6 and 7).
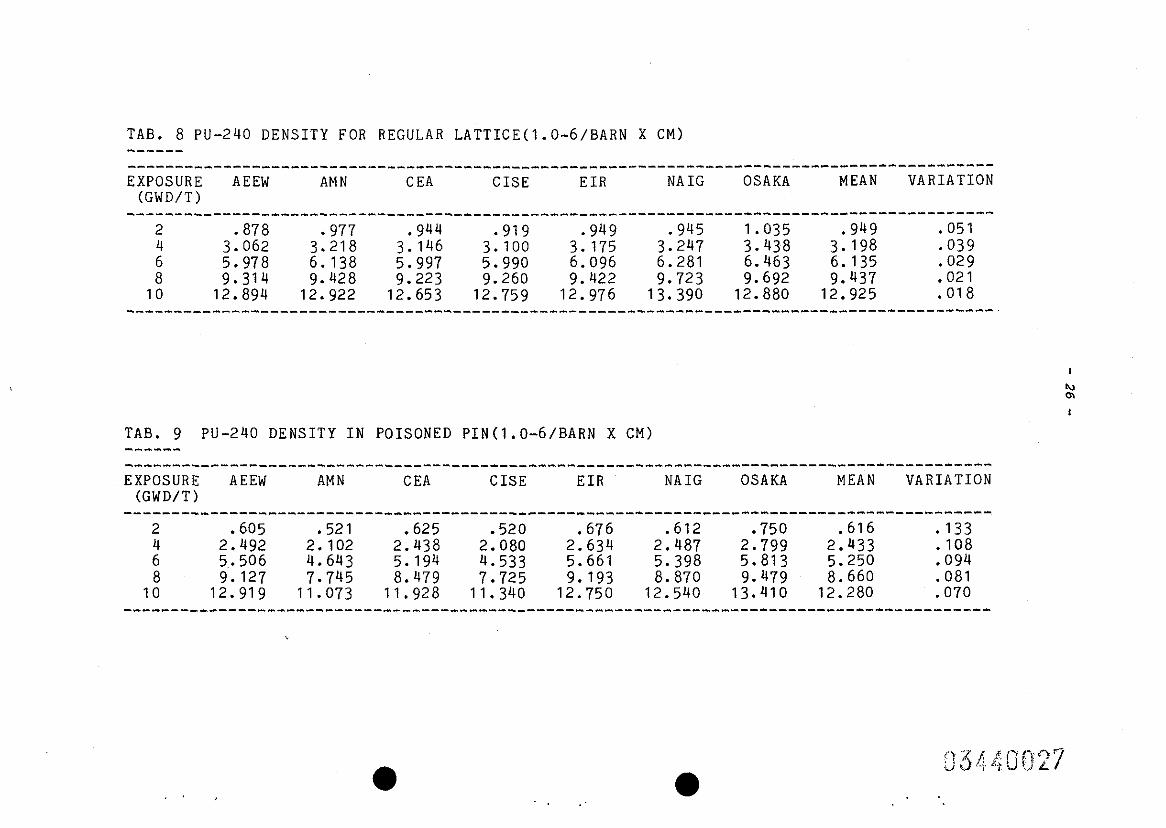
- The larger Pu-240 absorption and smaller Pu-239 capture in the Gd cell re-
duce the. buildup of Pu-240 (TABS 8 and 9) and the Pu-24O/Pu-239 - ratio (TABS 22 and 23).

- 16 -
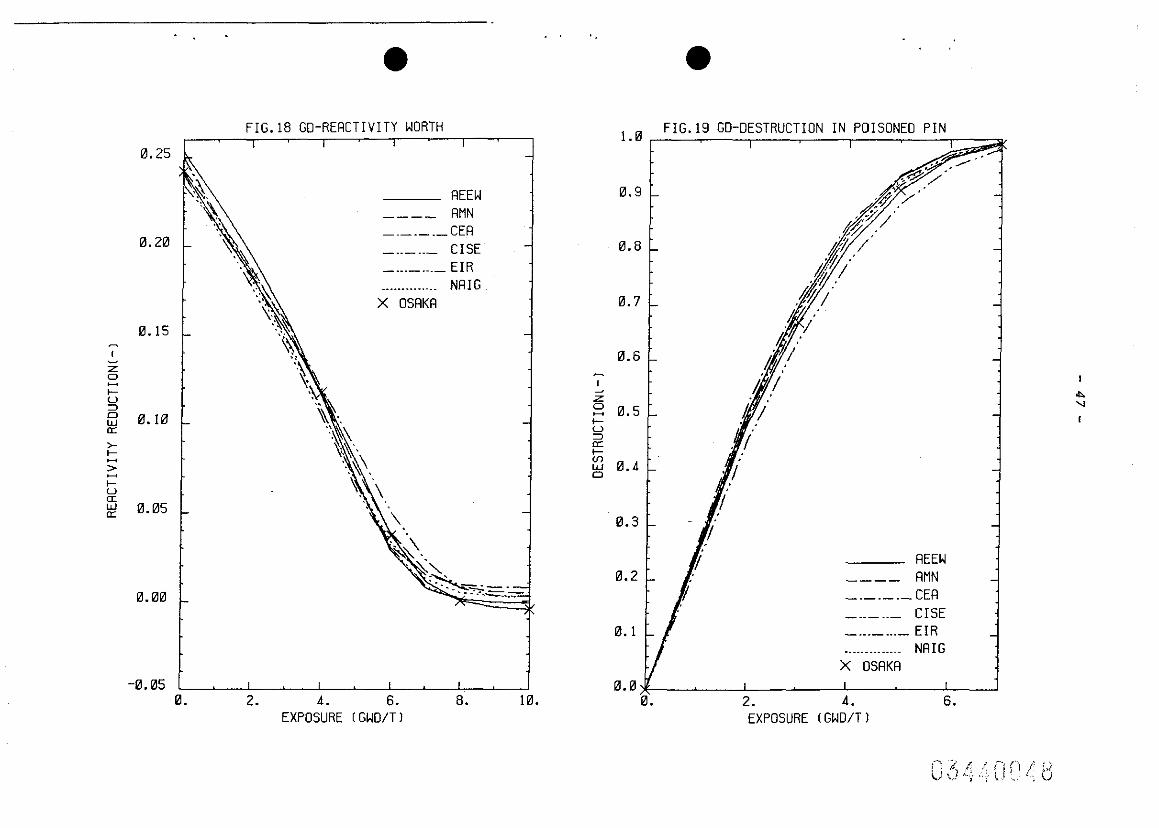
TAB 11 shows that the large cross section of Gd-157 causes a fast depletion
of this nuclide.
Let us now compare the results of the different solutions for the benchmark
problem.
The axposura dependent multiplication factors for the regular and the Gd
poisoned lattice are listed in TABS 2 and 3 and plotted in FIGS 2 and 3. The
corresponding deviations from the mean multiplication factor are shown in
TABS/FIGS 16 and 17.
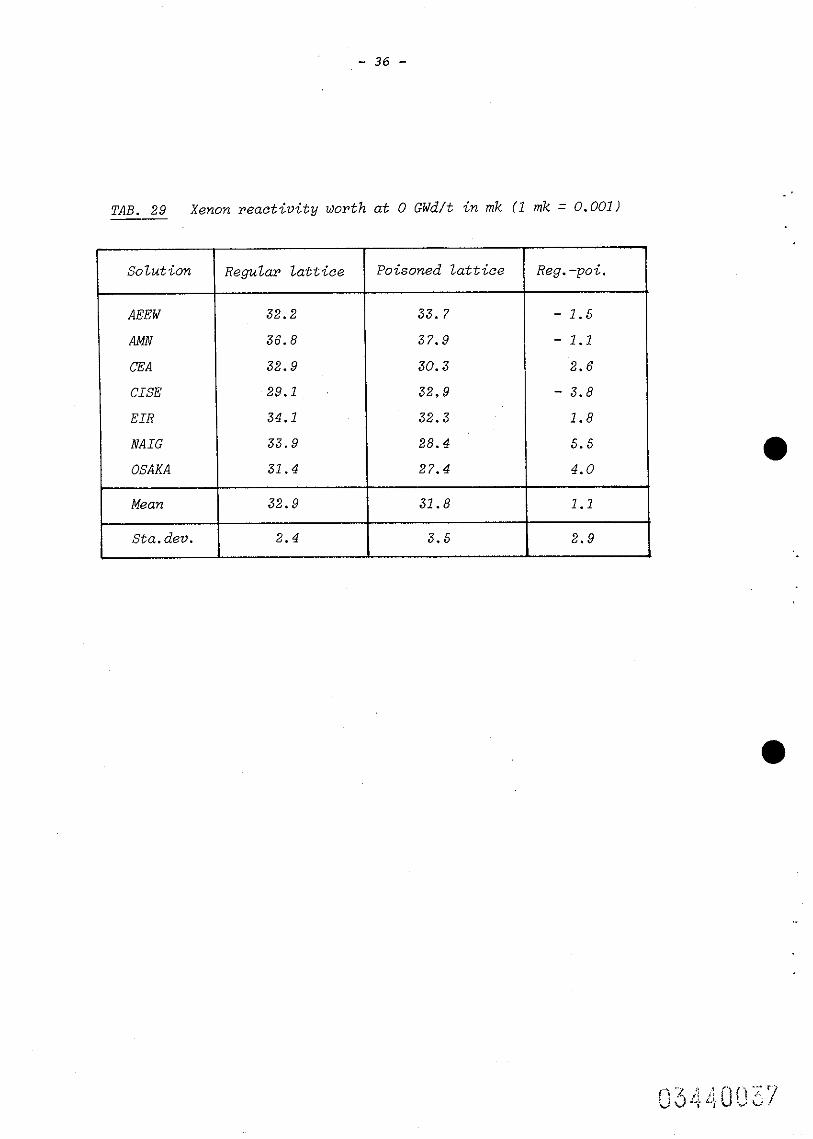
By extrapolating the multiplication factors at 1 GWd/t and 2 GWd/t to zero
burnup the xenoQ effects shown in TAB 29 have been derived. It can be seen
that both for the regular and the poisoned lattice the standard deviation
of the xenon effect is considerably smaller than the standard deviation of
the multiplication factor at ze.ro burnup. Furthermore, the magnitude of the
xenon effect seems to be insensitive to the Gd poisoning. In the following
discussion of the deviations between the solutions it can therefore be
assumsd that effects related to xenon are negligible.
For the regular lattice good agreement between the CEA, CISE, EIR and NAIG
multiplication factors can be observed. Relative to the mean value AEEW and
AMN predict higher and OSAkX ~predicts consistently lower multiplication fac-
tors. The variation is 1% at the beginning of life and remains practically
constant during burnup.
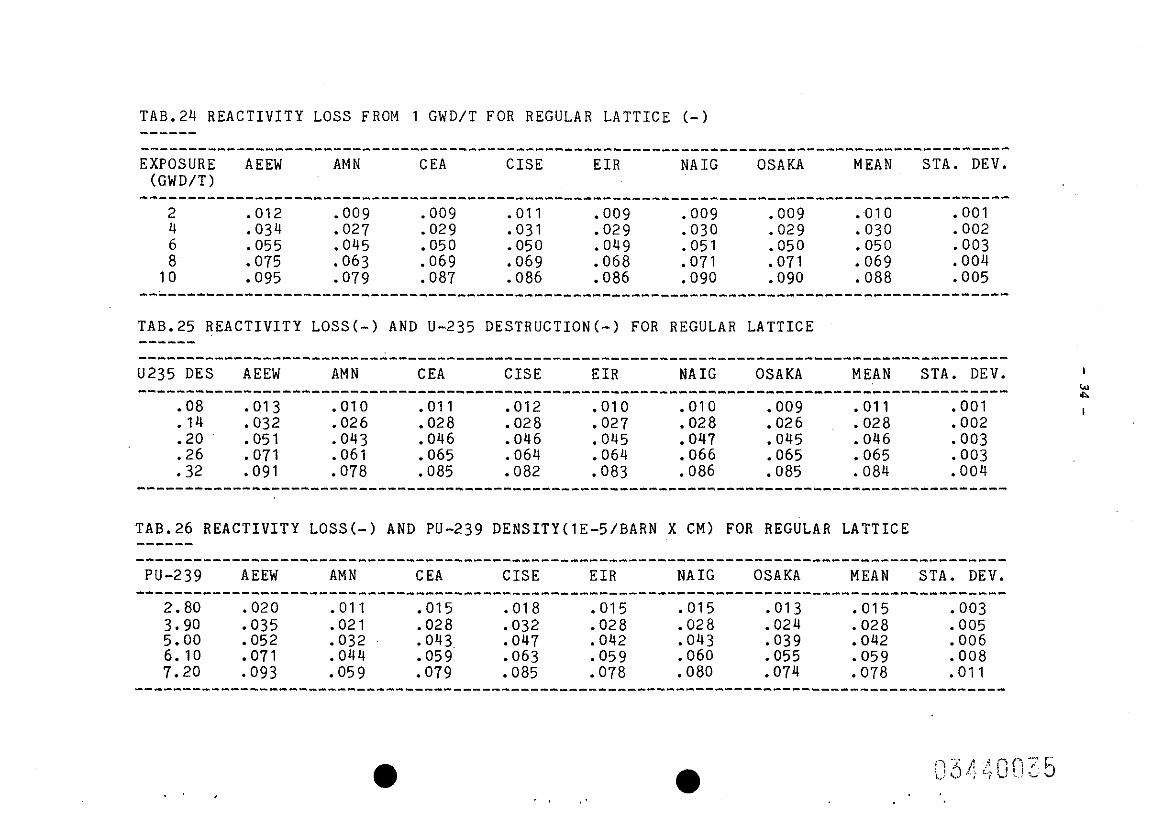
TAB/FIG 24 shows the reactivity loss above 1 GWd/t for the regular lattice.
As can be seen in TAB/FIG 25 the reactivity loss is correlated with the
U-235 destruction. As one would expect only a week correlation between the
reactivity loss and the Pu-239 density can be identified.(TAB/FIG 26).
For the poisoned lattice similar variations of about 1% as in the regular
lattice can be observed both at zero burnup and at the highest exposure of
10 GWd/t. However, in this case the variation reaches a maximum of 1.4% at
intermediate exposurt? values where relatively large fluctuations in the
reactivity deviation curves (FIG 17) occur. These fluctuations can be asso-
ciated with different Gd destruction rates (TAB/FZG 19) and the resulting
sff& on the Gd reactivity worth (TAB/FIG 1~8). In particular, the troughs
and humps in the curves are caused respectively by low Gd destruction rates

- 17 -
(as predicted by CISE and OSAkYA) and high Gd destruction rates (as predicted
e.g. by AEEW).
A comparison of FIG 20 and FIG 21 shows that in the poisoned lattice the
reactivity gain above 1 GWd/t is more strongly correlated with the Gd de-
struction than with the burnup. A plot of the reactivity deviations as a
function of Gd destruction would therefore show smaller fluctuations than
are visible in FIG 17.
The densities of the heavy isotopes U-235 and Pu-240 (TABs/FZGS 4, 5, 8 and
9) as well as the Pu-24O/Pu-239 ratio (TABs/FZGS 22 and 23) show larger
variations in the poisoned than ln the regular lattice. The opposite is true
for the Pu-239 density (TABS/FIGS 6 and '7). Surprisinyly, in the regular
lattice the variation of the Pu-240 density is signifjcantly smaller than
that of the Pu-239 density. Such a systematic effect could be caused by
spectrum variations in the regular cell. For instance, from a simple two-
group model it can be estimated that at low burnup an increase in the epi-
thermal-to-thermal flux ratio enhances the Pu-239 and, to a lesser extent,
the ~~-240 concentration, the ratio of the enhancement factors being appro-
ximately 1.3. It is worth noticiny that at 2 GWd/t the variations of the
Pu-239 and Pu-240 densities are in a similar ratio (TABS 6 and 8).
The pin powers are compared in TABs/FXGs 12 and 13. For the pin with.the
hiyhest rating (pin 4) and the poisoned pin the maximum standard deviations
are respectively 0.008 and 0.035 (Relative to the averaye power of the
lattice this corresponds to pin power variations of 0.8 and 3.5%). Duriny
burnup the standard deviations are nearly constant.
Although for this benchmark exercise neither an "accurate" reference solution
nor experimental bias factors are known, it may be interesting to compare the
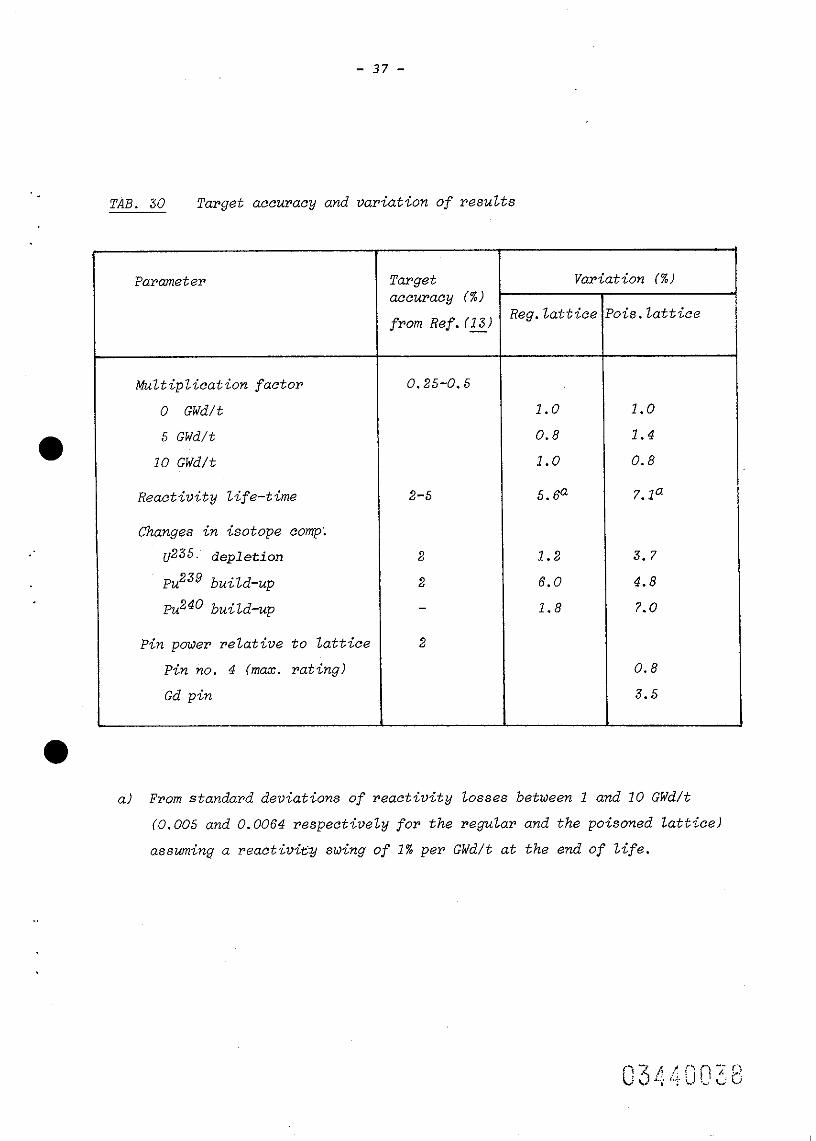
observed standard deviations with typical target accuracies for power reactors.
In TAB 30 variations of some important parameters are listed together with
target accuracies recommended by a 1971 ZAEA panel on reactor burnup physics
(l3J. More recently (in 1978)‘ the same taryet accuracies were adopted by
Crowther et al. (g).
TAB 30 shows that for the regular lattice the variations are laryer than the
taryet accuracies, except for U-235 depletion. This is true particularly for
- 18 -
the Pu-239 concentration which exceeds the target accuracy by a factor of 3.
RX- parameters related to reactivity of the poisoned lattice no significant
increase of the variations can be observed which could be attributed to the
additional complexity of this lattice. Whereas the variations of the isoto-
pic concentrations in the poisoned lattice appear to be large, the pin power
variations are acceptable, especially in the case of pin number 4 with the
highest rating. It should be remembered however, that bias factors ar.e un-
knowm and definite conclu$ions concerning the accuracy of the solutions can
therefore not be drawn.
8. conclusions.
From the comparison of the results of the gadolinium benchmark the following 0 conclusions may be drawn:
- The uncertainties in the prediction of important parameters of simple pin
cells seem to be relatively large, A standard deviation of 6% for the Pu-
239 build-up is hardly acceptable. iY can be expected that the deviations
are caused predominantly by differences in the data base. To identify the
origin of the differences more precisely, a further investigation would be
desirable.
- For the geometrically more complicated~~adolinium poisoned lattice no
significant or only a small increase of the variations of the multiplica-
tion factor and the reactivity life-time can be identified. The variation
of the Pu-239 build-up is smaller and the variations for U-235 depletion
and Pu-240 build-up are considerably larger than the respective values for
the regular lattice. To be able to separate data from methods effects it
would be necessary to repeat the calculations starting from a connnon data
base.
- Both in the regular and the poisoned lattice the ~xenon effect does not con-
tribute significantly to the variations of the parameters. It is interesting
to notice that the magnitude of the xenon effect is rather insensitive to
the Gd poisoning,
- 19 -
- With the aim to identify particularly large parameter variations a compari-
son with target accuracies for power reactors has been made. Variations
exceeding the target accuracies by a factor of 2 or mre are observed for
the multiplication factors, the reactivity life-time in the poisoned
lattice and the Pu-239 build-up.
- If systematic biases are small compared with the variations it can be tenta-
tively deduced that pin powers in the poisoned lattice are predicted ade-
quately. For the Gd pin a somewhat larger pow& variation than for a nor-
mal fuel pin seems to be acceptable, since the rating is lower and the
number of Gd pins is small. Regarding the multiplication factor and the
reactivity life-time it can be said that, if the accuracy requirements ara
judged to be fulfilled for the simple pin cell, this can also be assumed
for the Gd poisoned lattice.
It should be mentioned that none of the solutions takes an azimuthal depen-
dence of the Gd depletion into account. Appendix A shows that the azimuthal
variation of the flux and the power is relatively small, indicating that in
normal design calculations azimuthal effects can be neglected.
9. References
(l-J M.J. Halsall, "Review of International Solutions to NEACRP Benchmark
BWR Lattice Cell Problems", AEEW-R 1052 ?1977)
(z) C. Maeder, K. Kowalska and B.A. Solotar, "A Computational Benchmark for adjacent poisoned fuel rods", Trans. Am. Nucl. Sot. c, 19& (1982)
CL) C. Maeder and P. Wydler, "Specifications for a BWR Benchmark Problem
with Adjacent Poisoned Fuel Rods", NEACRP-A-460 (1981).
(51 C. Naeder and P. Wydler, "Burnup Calculations for a BWR Lattice with
Adjacent Poisoned Fuel Rods", NEACRP-A-521 (1982)
(2) M.J. Halsall, "LWR-WXMS, A Computer Code for Light Water Reactor Lattice Calculations", AEEW-R 1498 (1982)

- 20 -
Cc) M.J. Halsall, "The Treatment of Burnable Poison Pins in LWRWZMS",
AEEW-M 1999 (1982)
(L) A. Hoffmann et al., "APOLLO, code multigroupe de r&solution de l'&qua-
tion du transport pour les neutrons thermiques et rapides",Note CEA-
N-1610 (1973)
(g) A.H&bert, "Development of the SPH method: cell homogenisation of a
zion-uniform lattice and reflector parameters calculation", Note CEA-
N-2209 (1981)
(2) P. Peroni and U. Ciarniello: Report CISE-1784 (1982)
(g) C. Maeder and J.M. Paratte, %.lculation of LWR Fuel Elements Con-
taining Burnable Poisons and Plutonium", Trans. Am. Nucl. Sot. z,
259 (1975)
(g) M. Yamamoto et al,, "Validation of the TGBLA BWR Bundle Design
Methods", Trans. Am. Nucl. Sot: e, 698 (1982)
(z) E. Saj, S. Sakurai and T. Takeda, "Application of the Response Matrix
Method to BWR Lattice Analysis", Annals of Nuclear Energy g, 155 (1981)
(2) "Reactor Burnup Physics", Proc. of an TAEA panel, 12-16 July 1971,
p. 278, Vienna (1973)
(E) R.L. Crowther et al., v*Feedback of Reactor Operating Data to Nuclear
Methods Developmentr', Proc. ANS Topical Meeting, Gatlinburg, p. 285 (1978)
(E) C. Maeder, internal EIR-report (August 1980)
(E) H. Neltrup, internal RISU-report (March 1983)
(g) T. Sate et al., internal report of the university of OSAm (1982)
(2) A. Ahlin and M. Edenius, "MICBm-CASMO/CPM for Analysis of Assemblies
with Gadolinium", Trans. Am. Nucl. Sot. 4& 590 (1~982)

- 21 -
'.
(El K. Kowalska, "The S-WIMS Code for the CYBER-72 Computer", INR-Report
No. 1509 (1975)
(g) J.R. Askew, F.J. Fayers and P.B. Kernshell, "A General Description of
the Lattice Code WIMS", 3. Brit. Nucl. En. Sot. !$ 564 (1966)
(2) E. Cupini et al., "KIM - A mo-Dimensional Monte Carlo Proyram for
Thermal Reactors”, CNEN-RT/FIMA(80)2 (1980)
Acknowledcjment
The authors are indebted to J.M. Paratte, El'R for valuable discussions
and suyyestions.

TAB. 1: a9unmzry of calc~~l.atio,,al methods
AEE!+Q
WINS (ENDF/B-4 for Gd)
RESPLA
69
6
Data 1ibw.y UIMS ENDF/B-4 ENDF/B-3 + MUFT-I V+TEMPEST ENDF/E-4 ENDF/B-4 + ENDF/B-4 (THERMOS for Cd) ENDF/B-5
Code &me LWR-WIMS BLA APOLLO NUOVO AUTOBUS EOXER TGBLA
Pin cell calculatb?l: nr. of groups 28 68 99 30 70 P8
nr.’ of zones in Gd-pin 4 4 3 16 4 10
Lattice calcu- klt?h
methodb D~/ch.m. D DPO D QPl D
m: of groups 6 3 99 3 11 3
nr. of zones 1 b-0 70 32 56 144 16 16
nr. of t&e pchte 11 14 16 14 17 13
horn: OF het.~ calculAt&t= hom/het het bet horn horn horn
a Fh’st/mmmd entry: Calcuk,t,k, bewee,, 1 and IO F / at ze,.o b,,z.,,up
-
b D : Diffusion cal.c,xlation DPO, DPl, QPl: Transport calculation with double Po, ch. m. : Characteristics transpoz.t method
double PI or quadmple PI approx<mation at cell boundaries
c horn : Fuel cell.6 (fuel p<n, clad and moderator) az.e homoge,,<zed het : .Yet&wgenous calculation withhat cell homogenizat<on
DPl
6
58
22
bet
CISE NAIG EIR os4.u
,

TAB. 2 K-INFINITY FOR REGULAR LATTICE *
------------------------------------------------------------------------------------------ EXPOSURE AEEW AMN CEA CISE EIR NAIG OSAKA MEAN VARIATION
(GWD/T)
OCNO XE) 1.3514 1.277'3 1.2926
1.3400 1.2681 1.2794
1.3298 1.2742
1.3278 1.27!+2 ; *;;z
1.3340 1.3060 1.3315 i 1.2767 1.2537 1.2752
1.2623 1.2613 I:2626 1.2646 1.2424 1.2627 008 z 1.2489. 1.2630 1.2445 1.2563 1.2495 1.2488 1.2501 1.2515 1.2301 I.2499 :008
1.2369 1.2357 1.2373 1.2381 1.2172 I.2369 008 5 1.2349 1.2329 1.2240 1.2238 1.2245 1.2246 1.2040 1.2241 :008 6 1.2213 1.2214 1.2111 1.2111 1.2119 1.2114 1.1908 1.2113 008 7 1.2080 1.2098 I.1987 .I.1993 I.1996 1.1985 I.1779 1.1988 :009 8 1.1951 1.1986 1.1865 1.1876 1.1875 1.1860 1.1652 1.1866 .009 9 'I.1825 1.1882 1.1747 1.1764 1.1758 1.1529 .009
10 1.1703 1.1781 1.1633 1.1652 XT 1.1645 . x;; 1.1410 . . 010 ------------------------------------------------------------------------------------------
TAB. 3 K-INFINITY FOR POISONED LATTICE ------ ------------------------------------------------------------------------------------------ EXPOSURE AEEW AMN CEA CISE EIR NAIG OSAKA MEAN VARIATION
(GWD/T) ------------------------------------------------------------------------------------------ OCNO XE) 1.0093 1.0140 .9970 1.0164 1.0110 1.0004
1 1.0024 1.0036 .9991 1.0058 I.0093 1.0044 : Z 1.0054 010 1.0020 :006
2 1.0295 1.0316 1.0?14 1.0286 1.0403 1.0368 1.0162 1.0306 .007
z I.0655 I.0631 1.0658 1.1042 1.1002 1.1035
5 1.1516 1.1412 1.1433 6 1.1866 1.1747 1.1731 7 1.1989 1.1895 1.1811
; I.1439 l.l8$i 1.1756 1.1832 I.1819 1.1654
10 1.1715 1.1727 1.1546
.0531
.0884 1196
:1501 1717
:I788
: E
.072? l.Oi9il 1.0439 I.0516 004
.I083 1.1051 1.0742 I. 0977 :011
: i;;; 1.1419 1.1714 1.1105 1.1465 1.1365 1.1683 .014 012
:I861 1895 1.1803 1.1834 1.1650 1.1651 1.1813 1.1827 :010 008
:I657 1765 1.1595 1.1707 1.1566 1.1466 1.1618 1.1724 :008 .008

TAB. 4 U-235 DENSITY FOR REGULAR LATTICE(l.O-4/BARN X CM)
--------------------------------------------------------------------------------- -~~~~--~~ EXPOSURE AEEW AMN CEA CISE EIR NAIG OSAKA MEAN VARIATION
(GWD/T) ------------------------------------------------------------------------------------------
0 2 ?Z
517f34 z;: 5:7a9
:z 6.777 6.775
Z~ 6.776 6.776 .ooo
517a9 6.253 6.257
5:770 6.243 6.254 .OOl
t2 5.769 5.780 5.757 5.777 .002
5.341 5.359 5.350 5.319 5.325 5.3Oi3 .003 a 4.927 4.959 4.940 4.898 4.911 4.a92 005
10 4.539 4.586 4.556 4.503 4.525 4.504 :006 ------------------------------------------------------------------------------------------
TAB. 5 U-235 DENSITY IN POISONED PIN(l.O-4/BARN X CM) ------
EXPOSURE AEEW AMN CEA CISE EIR NAIG OSAKA MEAN VARIATION (GWD/TJ
------------------------------------------------------------------------------------------ .O 6.573 6.572 6.571 6.574 6.572 6.572 6.572 6.572 000
2 6.353 6.352 6.340 6.374 6.33a 6.339 6.332 6.347 :002
i 6.059 6.077 6.036 6.115 6.032 6.038 6.041 6.057 .005 5.678 5.728 5.658 5.663 5.668 5.683 5.696 .009
a 5.256 5.342 5.248 x 5.249 5.269 5.291 10 4.a47 4.969 4.a53 5:003 ;* 2 4.861 . 4.860 4.894 ::;g
------------------------------------------------------------------------------------------
:
TAB. 6 PU-239 DENSITY FOR REGULAR LATTICE(l.O-5/BARN X CM) ------ ------------------------------------------------------------------------------------------ EXPOSURE AEEW AMN CEA CISE EIR NAIG OSAKA MEAN VARIATION
(GWD/T) , ------------------------------------------------------------------------------------------
2 2.075 2.529 2.233 2.137 2.225 2.215 2.393 2.258 068 4 3.808 4.557 4.020 3.848 4.011 4.048' 4.281 4.082 :064
TAB. 7 PU-239 DENSITY IN POISONED PIN(l.O-5/BARN X CM)
------------------------------------------------------------------------------------------ EXPOSURE AEEW AMN CEA CISE EIR NAIG OSAKA MEAN VARIATION
(GWD/T) ------------------------------------------------------------------------------------------
z 4.210 2.268 2.227 4.207 2.241 4.097 2.136 3.964 2.408 4.385 2.185 4.052 2.410 4.401 2.268 4.188 :039 046
6 5.671 5.891 5.542 5.427 5.856 5.498 5.975 5.694 .038 8 6.765 7.289 6.943 6.624 7.185 6.859
10 7.639 8.440 7.815 7.537 8.145 7.792 :%i ------------------------------------------------------------------------------------------
TAB. 8 PU-240 DENSITY FOR REGULAR LATTICE(l.O-6/BARN X CM) ------ ------------------------------------------------------------------------------------------ EXPOSURE AEEW AMN CEA CISE EIR NAIG OSAKA MEAN VARIATION
(GWD/T) ------------------------------------------------------------------------------------------
TAB. 9 PU-240 DENSITY IN POISONED PIN(l.O-6/BARN X CM) -*---- ------------------------------------------------------------------------------------------ EXPOSURE AEEW AMN CEA CISE EIR NAIG OSAKA MEAN VARIATION
(GWD/T) ------------------------------------------------------------------------------------------
2 .605 .521 .625 .520 ,676 .612 .750 .616 133
: 2.492 2.102 2.438
e;;; ;- 2% ;* ;;i 2.799
;%z :I08
5.. 506 4.643 5.194 8 9.127 7.745 8.479 71725 9: 193 81870
5.813 094 9.479 a:660 :081
10 12.919 11.073 11.928 11.340 12.750 12.540 13.410 12.280 .070 ------------------------------------------------------------------------------------------
.’ , l

TAB. 10 GD-155 DENSITY IN POISONED PIN(l.O-4/BARN X CM) --e--v- ------------------------------------------------------------------------------------------ EXPOSURE AEEW AMN CEA CISE EIR NAIG OSAKA MEAN VARIATION
(GWD/T) ------------------------------------------------------------------------------------------
0 1.47E+OO 1.47E+OO 1.47E+OO 1.47E+OO l.47E+OO'l.47E+OO 1.47E+OO 1.47E+OO 9.94E-01 9.88E-01 9.34E-01 l..O4E+OO 9.67E-01 9.53E-01 l.OlE+OO 9.84E-01 6.95E-01 7.OlE-01 6.39E-01 7.8lE-01 6.79E-01 6.72E-01 7.47E-01 7.02E-01 .068
4 4.19E-01 4.43E-01 3.85E-01 5.3lE-01 4.2lE-01 4.2lE-01 4.89E-01 4.44E-01 .112 1.97E-01 2.3lE-01 1.88E-01 3.12E-01 2.lOE-01 2.17E-01 2.6lE-01 2.3lE-01
------------------------------------------------------------------------------------~~~~--
6.56E-02 9.15E-02 6.24E-02'1.47E-01 8.12E-02 8.23E-02 9.95E-02 8.99E-02 7 1.59E-02 2.82E-02 1.65E-02 5.05E-02 1.93E-02 2.32E-02 2.65E-02 2.57E-02
TAB. 11 GD-157 DENSITY IN POISONED PIN(l.O-4/BARN X CM) ------- ------------------------------------------------------------------------------------------ EXPOSURE AEEW AMN CEA CISE EIR NAIG OSAKA MEAN VARIATION
(GWD/T) ------------------------------------------------------------------------------------------
0 1.56E+OO 1.56E+OO 1.56E+OO 1.56E+OO 1.56E+OO 1.56E+OO 1.56E+OO 1.56EtOO 000 2 5.OOE-01 5.43E-01 5.lOE-01 6.06E-01 5.45E-01 5.37E-01 5.45E-01 5.4lE-01 :063
z 2.18E-01 2.66E-01 2.39E-01 3.2lE-01 2.56E-01 2.58E-01 2.55E-01 2.59E-01 122 5.95E-02 9.27E-02 6.99E-02 1.32E-01 8.29E-02 8.93E-02 8.63E-02 8.75E-02 :260 5.8OE-03 1,59E-02 8.7lE-03 3.96E-02 9.42E-03 1.53E-02 1.29E-02 1.54E-02 .735
7 9.48E-05 1.23E-03 1.65E-03 4.94E-03 2.56E-04 l.gOE-03 3.7OE-04 1.49E-03 ;.;;; 2.75E-07 7.lOE-04 4.04E-05 1.2l,E-04 9.32E-07 1.26E-03 1.82E-06 3.04E-04 .
------------------------------------------------------------------------------------------

TAB. 12 POWER IN PIN 4 (-) -------
EXPOSURE AEEW AMN CEA CISE EIR NAIG OSAKA MEAN STA. DEV. (GWD/T)
0 1.163 1.165 1.159 I.153 1.159 1.166 1.178 1.163 008 2 1.118 I.123 1.111 1.116 1.113 1.113 1.126 1.117 :006 4 1.060 1.074 1.057 1.070 1.062 1.060 1.071 1.065 .007
i 1.004 1.027 I.009 1.023 1.014 1.012 1.014 1.015 008
1.010 .996 .997 .996 .996 :007 10 % . 1.008 .995 :E -996 .995 :;;: .gg5 .006
------------------------------------------------------------------------------------------
TAB. 13 POWER IN POISONED PIN c-j ---v--e ------------------------------------------------------------------------------------------ EXPOSURE AEEW AMN CEA CISE EIR NAIG OSAKA MEAN STA. DEV.
(GwD/T) ------------------------------------------------------------------------------------------
0 .462 .384 .355 .391 411 .394 035 2 :;2 .592 .563 .507 :;i; .566 :559 .553 :026 4 .771 .755 .769 .674 .736 .757 .731 .742 .034
: 985
1:045 :;2! .956 870 936 .935 .932 .035
1.007 1:022 :;;A 1:003 1.018 1.010 021 10 1.047 .990 1.010 1.041 .gg4 1.008 I,. 022 1.016 :022
------------------------------------------------------------------------------------------

.
l ,
TAB.14 RAD. GD-155 DISTRIBUTION AT 2 GWD/T ------ --ee--- ---------------------------------------------------------------------------------
R;;&- AEEW AMN CEA CISE EIR NAIG OSAKA MEAN VARIATION
------------------------------------------------------------------------------------------
:;2 1.273 1.264 1.278 I.363
zz 1.279 1.264 1.289 027
1.176 1.188 1.174 1.276 1.187 1.167 1.198 I032 .39 .947 .952 .879 1.004 :946 .914 .969 .945 .042
----~~~-----:~~~-----~~~~-----:~~~-----~~~~-----~~~~-----:~~~-----~~~~-----~~~~-----:~~~--
a At the centre of the annular region
TAB.15 RAD. GD-157 DISTRIBUTION AT 2 GWD/T w-mm-- ------------------------------------------------------------------------------------------
RADIUS AEEW AMN CEA CISE EIR NAIG OSAKA MEAN VARIATION (CM)
------------------------------------------------------------------------------------------
:;i 1.027 1.088 1.038 1.157 1.081 1.074 1.041 1.072 041
.705 .797 .715 .8a5 -812 .780 .744 .777 :080 .39 .335 .396 .277 .276 .335~ ,,~ .314 180 .47 .ooo .ooo .008 .018 .062 .025 I:027
------------------------------------------------------------------------------------------

TAB.16 REACTIVITY DEVIATION FROM MEAN FOR REGULAR LATTICE(-) ------ ---------------------------------------------------------------------------------- -------- EXPOSURE AEEW AMN CEA CISE EIR NAIG OSAKA MEAN STA. DEV.
(GWD/T) ------------------------------------------------------------------------------------------ OCNO XE) .015 .006 -. 001 -.003 000 .002 -. 019 000 010
1 014 :012
-003 -. 001 .ooo -:001 .OOl -.017 : 000 : 009 2 .004 -. 000 -.OOl -. 000 -.016 .ooo 008
z 010
:010 005
:006 -. 000 -. 001 000
: 000 :E -.016 000 :008
-.ooo -. 001 .OOl -.016 : 000 .008 5 .oog 007 -. 000 -. 000 .ooo .ooo -.016 .ooo .008 6 008
ii :008
:008 -. 000 -. 000 .OOl .ooo ,-.017 000 .008 009
:010 -.ooo .ooo 001
:001 -. 000 -.017 : 000
.007 -. 000 .OOl -.OOl -.018 000 :::; 9 .006 .Oll -. 000 .OOl -. 001 -. 019 : 000 009
10 . 006 .013 -. 000 -001 ::i; -.OOl -.019 .ooo :010 ------------------------------------------------------------------------------------------
TAB.17 REACTIVITY DEVIATION FROM MEAN FOR POISONED LATTICE(-)
------------------------------------------------------------------------------------------ EXPOSURE AEEW AMN CEA CISE EIR NAIG OSAKA MEAN STA. DEV.
(GWD/T) ----------------------------------------------------------------~------------------------- OCNO XE) .004 009
:002 -.008 .Oll .006 -.005 -.015 000 010
1 .ooo -.003 .004 .007 .002 -.012 : 000 :006 2 -.OOl -001 .OOl -.002 .006 -.014 000 007
i 001
:006 .OOl .004 -.008 :% 008 -.017 : 000 :009 .002 .005 -.008 010 :007 -.021 000 011
2 .013 004
:006 .006 -.015 :010 -.023 : 000 :014
.016 .004 -.016 .006
.

. . .
TAB.18 GD-REACTIVITY WORTH(-)
------------------------------------------------------------------------------------------ EXPOSURE AEEW AMN CEA CISE EIR NAIG OSAKA MEAN STA. DEV.
(GWD/T) ------------------------------------------------------------------------------------------ OCNO XE) .253 243
:216 .250 -235 .241 250 242 .245 007
1 .225 216 :I83
211 2 194
:;W$ .186 :184
208 :I76
:213 :211 .214 :005 180 182 184 006
3 4
:067 :Ki
147 :I08
157 :119
142 :104
:145 :151 :151 :006 107
2 .074 066 .085 .063 :068 :A;; 2;:
.006 008
028 :008
038 :017
:031 .050 .030 .033 .037 .036 :007
; 015
: 009 .023 008
:001 .013' .Oll
.OOl .008 007 .ooo :iE 005
:004 9 -. 001 005
:005 008 :003 -. 001 ::g -.003 .004
10 -. 001 :007 .003 -.OOl .002 -.005 :K .004 ------------------------------------------------------------------------------------------
TAB.19 GD-DESTRUCTION IN POISONED PIN (-) ------ ----------------------------------------------------------------~------------------------- EXPOSURE AEEW AMN CEA CISE EIR NAIG OSAKA MEAN STA. DEV.
(GWD/T) ------------------------------------------------------------------------------------------
2 .507 .495 .524 .456 .501 .509 .486 .497 .021
i .699 .681 .7lO .636 .691 .fj!u .669 .683 .024 .842 .823 .850 .781 ,834 .832 .810 .825 023
2 .933 .918 .935 .884 .928 - 923 .910 .919 :018 .978 .969 .979 .950 .973 .972 .967 .970 .OlO

TAB.20 REACTIVITY GAIN FOR POISONED LATTICE(-) ------ ------------------------------------------------------------------------------------------ EXPOSURE AEEW AMN CEA CISE EIR NAIG OSAKA MEAN STA. DEV.
(GWD/T) ------------------------------------------------------------------------------------------
; .027 028 032 023 032 .027 029 .003
060 :102
1059 :067 :047 22; :065 055 :086
:059 .007 4 .096 .104 .082 .098 .I00 .095 .008
TAB.21 REACTIVITY GAIN(-) AND GD-DESTRUCTION(-) m-e-e-
GD-DEST. AEEW AMN CEA CISE EIR NAIG OSAKA MEAN STA. DEV. ------------------------------------------------------------------------------------------
.50 .026 .029 .029 .027 .031 .031 .029 ,029 002 .60 .040 043
:064 044
:064 .040 045
:065 .047 043
:059 043
:063 :002
2: .060 .061 .067 .003
085 .Q88 .086 .087 .090 .083 087 .002 .90 :I28 127 :Z 119 123 117 :I24 .004
1.00 .200 :I92 .185 :177 :I83 2; :I85 .I86 .007 -------~----------------------------------------------------------------------------------

:
TAB.22 PU-24O/PU-239 DENSITY FOR REGULAR LATTICE t-) ------ ------------------------------------------------------------------------------------------ EXPOSURE AEEW AMN CEA CISE EIR NAIG OSAKA MEAN VARIATION
(GWD/T) ------------------------------------------------------------------------------------------
TAB.23 PIJ-24O/PU-239 DENSITY IN POISONED PIN (-) -e-w-w ------------------------------------------------------------------------------------------ EXPOSURE AEEW AMN CEA CISE EIR NAIG OSAKA MEAN VARIATION
(GWD/T) ------------------------------------------------------------------------------------------
2 .027 .023 .028 024 028 .028 031 027 W6
: .059 .050 060 :052 :060 .061 :064 :058 :085
097 :135
.079 : 094 084 ,097 .098 .097 .084 8 106
:131 .I27 :I18
3; 134
:I66 132 :!Zi
:165 .I58 084
10 . 169 .I57 .I54 :082 ------------------------------------------------------------------------------------------
TAB.24 REACTIVITY LOSS FROM 1 GWD/T FOR REGULAR LATTICE (-) ------ ------------------------------------------------------------------------------------ ------ EXPOSURE AEEW AMN CEA CISE EIR NAIG OSAKA MEAN STA. DEV.
(GwD/T) ------------------------------------------------------------------------------------- -m--m
2 012 009 .009 011 .oog 009 .009 .Ol 0 .OOl
z :034 :027 .029 :031 .029 :030 029 .055 045
:063 050
:069 -050 049
:06a 051
:071 :050
:030 050
a .075 .069 071 : 069 :g
10 .095 -079 .oa7 .oa6 .oa6 .090 1090 .oaa .004 .005
------------------------------------------------------------------------------------------
TAB.25 REACTIVITY LOSS(-) AND U-235 DESTRUCTION(-) FOR REGULAR LATTICE v-e-e- ------------------------------------------------------------------------------------------ U235 DES AEEW AMN CEA CISE EIR NAIG OSAKA MEAN STA. DEV. ------------------------------------------------------------------------------------------
.oa :i;;
.OlO .Oll .012 .OlO .OlO .009 011 .OOl .I4 026 .02a 02a .027 02a .026 102a 002
:2 .051 :043 .046 :046 .045 :047 .045 .046 :003
071 . 32 :091
061 107a
.065 064 1oa2
064 .066 .065 .oa5 1oa3 .oa6 .oa5
065 1oa4
003 :004
------------------------------------------------------------------------------------------
TAB.26 REACTIVITY LOSS(-) AND PU-239 DENSITYlIE-5/BARN X CM) FOR REGULAR LATTICE ------ ------------------------------------------------------------------------------------------
PU-239 AEEW AMN CEA CISE EIR NAIG OSAKA MEAN STA. DEV. ------------------------------------------------------------------------------------------
2.ao 020 :035
011 :021
.015 ola 015 015 3.90 .02a I032 102a 102a
.013 015 003
.024 102a :005 5.00 052
:071 032
:044 .043. 047
:063 2;; .043 .039 042
:059 .006
6.10 .059 .060 .055 ooa 7.20 .093 .059 .079 .oa5 .07a .oao .074 .07a :011
------------------------------------------------------------------------------------------
,

- 35 -
TAB. 27 Average fluxes in the regular and in the poisoned pin cell
(EIR results at 0 GWd/t)
Energy range Flux $I (1013/cm2sec)
cew Regular lattice Poisoned cell
1.5.lo7 - 900 8.95 11.52
900 - 0.6 2.86 3.69
0.6 -0 2.53 2.04
1.5*107 - 0 '14.34 17.25 ,
4 poi ' 'reg
1.29
1.29
0.81
1.20
l'AB. 28 cell-average, microscopic, one-group cross sections and
reaction rates (EIR-results at 0 GWd/t)
Quantity Nuclide Regular lattict? Poisoned cell
0 Gd-155 2500 200 a (barn) Gd-157 10800 770
U-235 65 20
V-238 1.01 0.84
Pll-239 208 91
Pu-240 242 221
'c ' 'a U-235 0.18 0.25
L-j U-238 0.89 0.87
Pll-239 0.36 0.39
~~-240 1.00 1.00
Oa @ U-235 93 35
-10 -1 (10 set ) V-238 1.45 1.45
Pu-239 298 157
Pu-240 347 381
- 36 -
TAB. 29 Xenon reactivity worth at 0 GWd/t in mk (1 mk = 0.001)
solution Regular latt&?
AEEW 32.2
AMN 36.8
CEA 32.9
USE 29.1
EIR 34.1
NAIG 33.9
OSAKA 31.4
Mean 32.9
%a.dev. 2.4
Poisoned lattice Reg.-poi.
33.7 - 1.5
37.9 - 1.1
30.3 2.6
32:9 - 3.8
32.3 1.8
28.4 5.5
27.4 4.0
31.8
3.5
1.1
2.3
- 37 -
TAB. 30 Target accuracy and variation of resuk?
ParY7mete~ Target variation C%) am2.uwey C%) - from Ref.(E) Reg.kttice Pois.lattice
MultipIication f?actor 0,25-0.5 0 GWd/t 1.0 1.0 5 GWd/t 0.8 1.4
10 GWd/t 1.0 0.8
Reactivity life-time 2-5 5.@ 7. la
Changes in isotope eomp: ~235. depletion 2 1.2 3.7 h23g build-up 2 6.0 4.8 Pu240 build-up 1.8 7.0
Pin power rekxtive to LattSce 2 Pin no. 4 (max. rating) 0.8
Gd pin 3*5
a) From standard deviations of reactivity Losses between 1 and 10 GWd/t
(0,005 and 0.0064 respectively for the regdar and the poisoned lattice)
assuming a reactivit$ swing of 1% pep GWd/t at the end of life.

- 38 -

1.30
1.25
1.20
1.15
1.10
FIG. 2 K-INFINITY FOR REGULRR LRTTICE 1.20
1.15
1.05
---- WIN w.-.m.vCER -~-..- CISE -...-...- EIFI . . . . . . . . . . . . NFIIG
X OSRKR , I , I
0. 2. A. 6. 0. 10.
EXPOSURE (GWO/TJ
FIG. 3 K-INFINITY FOR POISONEO LRTTICE I I I
---- RNN -.-.-.-CER -..-..- CISE
2. A. 6. a. EXPOSURE lGWO/T)
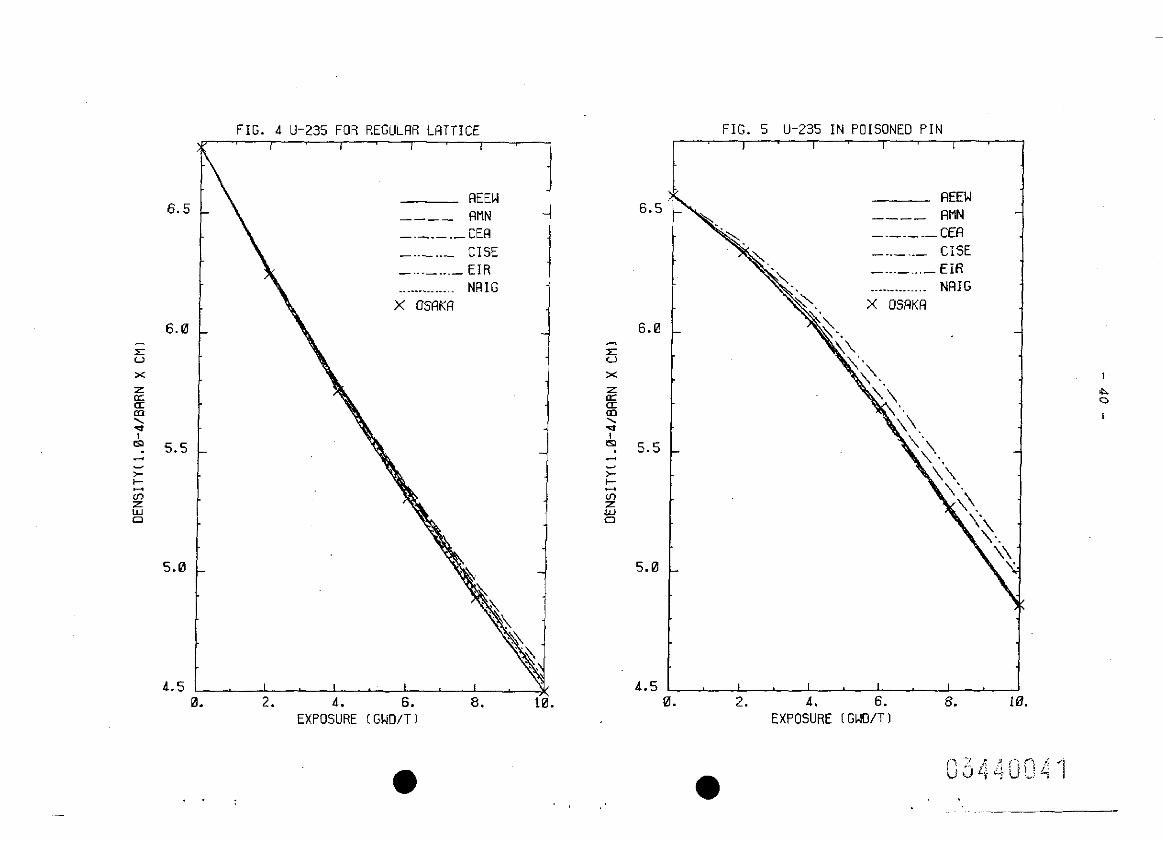
FIG. 4 U-235 FOR REGULFIR LRTTICE 1 , 1 ,
flEE!A ---- RMN -.-.-.-CER -..- ..- CISE -...-...- EIR
. . . NRIG x USRKR
EXPOSURE (Gi.D/TJ
6.5
5.0
FIG. 5 U-235 IN POISONED PIN
---- l=iMN -.-.-.-CEfl -..- ..- CISE -...-...- EIIT . . ..- . . NRIG
d.5 na 2. b. 6. 8. I
EXPOSURE fGWU/Tl
. . :
.,
FIG. 6 PU-239 FOR REGULRR LRTTICE
8. &
REEW ---- FlilN -.-.-.-CEB -..-..- CISE - .- - EIR . . . NRIG
X OSRKR , 1 ,
A. 6. 8. EXPOSURE cGWD/Tl
FIG. 7 PU-239 IN POISONED PlN I 1 1 1
,
---- RHN -.-.-.-cm -..- ..- CISE -...-...- EIR . . .-.. . . . .-. . NFIIG
X OSRKR 1 , I I
2. 4. 6. 8. 10. EXPOSURE cGWD/Tl
, : 4 p’

13. FIG. 8 PU-240 FOR REGULRR LRTTICE
\ , , I
FIEEW ---- RMN -.-.-.- CER -..-..- CISE -...- . ..- EIR
~~~ NTG 1
6. 8. 10.
FIG. 9 PU-240 IN POISONED PIN
13. cjg
--. -
11. -
10. -
9. -
a. -
7. -
REEW ---- FlMN -.-.e.-CEfl -..-..- CISE -...-...- ElR . . . . . . . . . . . . . . NRIG
X OSRKR 0. , ,
0. 2. A. 6. 8. 10. EXPOSURE cGWO/Tl EXPOSURE lGWO/TJ
.’ ,

‘, *
l
1.6 FIG. 10 GO-155 IN POISONEO PIN 1.6
FIG. 11 GO-157 IN POISONEO PIN 1 1 I I I ,
0.4
REEW ---- RMN w.-.-.-CER -..-..- CISE
. NRIG X OSRKR
2. 4. EXPOSURE cGWO/Tl
6.
l .
1.4
Ii
\ 1.2
"\
REEW ---- FINN -.-.-.-CEI? -..-..- CISE -...-...- EIR . NfiIG
X OSRKR
0.4 1
0. 2. 4. 6.

1.10
E :
1.05
FIG. 12 POWER IN PIN 4 , I 1 I
REEW ---- RMN m.-.v.-CER -~-~- CISE -...-...- EIR . . . . . . . . . . . NRIG
X OSRKR
I I , ,
2. 4. 6. 8. EXPOSURE (GWD/Tl
1.1
0.8
0.7
0.6
0.5
0.4
FIG. 13 POWER IN POISONEO PIN 1 I I 1
J
REEM ---- FNIN v.-.-.-CER -..- ..- CISE -...-... - EIR . . . . . . . . . . . . NRIG
t X OSRKR 0.3 1 1 , , 1
0. 2. 4. 6. 8. 10. EXPOSURE tGWD/T)
: ,

. . . a 1 4 FIG.14 FiRD. GO-155 DISTRIBUTION RT 2 GWO/T
r , I , 1
0.3 - REEW
---- WIN -.-.-.-CER -..-..- CISE -...-...- EIR . . . . . . . . . . . . . NRIG
X OSRKR 0.0 I 1 I I I
0. 0.1 0.2 0.3 0.4 RRDIUS(Ctll
-
0.5
1 4 FIG.15 RRD. GO-157 CIISTRI8UTION RT 2 GWD/T
I I I , I
1.3
1.2
1.1
1.0
0.2
0.1
0.0
L----- --- . lzz .---.
f?EEW ---- RHN -.-.-.-CER -..-..- CISE -...-...- EIR . . NRIG
X OSFIKR
7
-
-..-~. .-.-
0. 0.1 0.2 0.3 0.4 RRCIIUS~CN~
zl -.. 0.5

0.04 FIG.16 RERCTIVITY IJEV. FOR REGULFIR LRTTICE
1 I L I
REEW ---- RMN
0.03 -.-.-.-CER - CISE
-...-...- EIR . . . . . . . . . . NRIG
X OSRKR 0.02
-0.03 < 0. 2. A. 6. a. 10.
EXPOSURE cGuwT1
0,04 FIG.17 REQCTIVITY DEV. FOR POISONED LRTTICE
, I 1 I
REEW ---- RNN
0.03 - e.-.-.-CER -~-..- CISE -...-...- EIR . . . . . . . . . . . . NFIIG
X OSRKR 0.02 -
----...-.
-0.01 -
X
-0.02 -
-0.03 > 0. 2. A. 6. 0. 10.
EXPOSURE lGlJL'/TJ
.’ ,
. . .
0.00
FIG.18 GO-REFICTIVITY WORTH
FIEEW ---- RNN -.-.-.vCER -..-..- CISE -...-...- EIR
-....-.....
NFIIG X OSRKR
-0.05 7 0. 2. A. 6. 0. 10.
EXPOSURE ~G!-dD/Tl
. .
l
1.0 , FIG.19 GD-DESTRUCTION IN POISONED PIN
0.9 -
0.8 -
0.7 -
0.6 -
7
5 p 0.5 -
2 E 2 0.A-
0.3 -
FIEEW ---- ITIN -.-.-.-CEfl -..-..- CISE -...-...- EIR
. NRIG X OSFIKFI
EXPOSURE tGWD/Tl .,.

0.20
0.15
0.05
0.00
FIG.20 RERCTIVITY GRIN FOR POISONED LRTTICE I I
REEW ---- RMN -.-.-.-CC4 -~-..- CISE -...-...- EIR . . . . . . . . . . . . NFIIG
X OSFiKFi
EikOSURE cGWD/TJ
0 20 FIG.21 RERCTIVITY GRIN RN0 GO-DESTRUCTION I',"'.,',,'.","'."""
0.05
0.00 e
FlEEW ---- WIN -.-.-.-El? -~-..- CISE -...-...- EIR
NRIG X OSflKfl
I . . . . I. I . 1..
, 0.6 0.7 0.8 0.9 GO-OESTRUCTIONI-I
.,
0.00
.
l . . . .
FIG.22 PU-240/PU-239 DENSITY FOR REGULRR LRl .TIl CE , , 1 I
/
/.
Iin
I’
---- RNN e.e.-.-CER
1'
-..-..- CISE -...-...- EIR . . NR:
X OSRKR 1 1 I 1 2. 4. 6. 0. 10.
EXPOSURE cGWD/Tl
:IG.23 PU-240/PU-239 DENSITY IN POISONED PIP I 1 1 I
,
---- RHN v.m.-.-CER -..-..- CISE -...-...- EIR . . . . . . . . . . ...'. NRIG
y OSRKR 1 I I 1 2. A. 6. 0. 10.
EXPOSURE IGWCVTI
0.10
0.09
0.08
0.07
7 0.06
Tl g J 0.05 z 2 ’ 0.04 E &
0.03
0.02
0.01
0.00
FIG.24 RERCTIVITY LOSS FOR REGULFIR LRTTICE 1 , I ,
4
REEW ---- FINN e.-.-.-CER -~-..- CISE -...-...- EIR . . . . . . . . . NFIIG
X OSRKR
EXPOSURE ~G'AO/Tl
0.10
0.08
0.07
0.03
FIG.25 REXTIVITY LOSS RN0 U-235 FOR REG. LFITTICE , 1 1 1 1
---- WIN -.-.-.-CCR -~-..- CISE -...-...- EIR . . . . . . . . . . . . . NRIG
0.00 1 , , 1 i , 0.08 0.12 0.16 0.20 0.24 0.28 0.32
U-235 OESTRUCTION(-1

.~ . .
0 l0 FIG.26 REQCT. LOSS RN0 IV-239 FOR REG. LRTTICE , '. , " , " x , " ,
0.08 -
0.07 -
7 0.06 -
ci z J 0.05 - z 2 2 c-j 0.04 -
i2
0.03 -
0.00-,.,,,,,,,,,,,,,,.,.,,. 2.8 3.6 4.4 5.2 6.0 6.8
PU-239 DENSITY(l.0-S/BRRN X CM1

- Al -
APPENDIX A Shadowing Effect of Poisoned Pins
At EIR, c. Maeden pesfomned a burnup calculation up to 5 GWd/t with a sub-
division of the Gd cell into 2x2 meshes for the few-group lattice calcula-
tion (E). The subdivision is illustrated in FIG Al, Case A. During burnup
the isotope densities in the Gd pin were tracked in 16 regions, 12 of which
az-e different from each other. These regions were obtained by subdiving each
annulus of the standard case (Case S in FIG Al) into 4 azimuthal regions
(e.g. annulus 64 was divided into the regions 74, 84, 84 and 94). For the
fine-group cell calculation, which was performed in cylindrical geometry as
in the standard case, the regions lying in the same annulus wez'e homogenised,
thus neglecting the azimuthal flux dependence in the Gd pin. The superposi-
tion of the flux values obtained in the cell and in the lattice calculations
provided the flux spectra which were used to determine the one-group reac-
tion rates for the burnup calculation.
FIG Al shows that the effects of the azimuthal subdivision of the Gd pin ase
small. The associated reactivity difference is less than 0.2%, and the largest
difference in the average power of the Gd pin (at 2 GWd/t) amounts to 0.6%.
An azimuthal power variation of 4% can be observed in the four sectors of
the pin.
By means of the response matrix pnogi-am REPRO-FLUS0 H. Neltrup, Ri.5'6 National
Laboratory, Denmark, determined detailed flux distributions in a lattice with
an isolated Gd pin and in a poisoned lattice with adjacent Gd pins as shown
in FIG 1 (l6). For this calculation the cell geometry and 6-group macnosco-
pit cross sections were taken from Ref. (A). Each Gd pin was subdived into
16 azimuthal sectors and 7 annuli, thus considering a total number of 112
subregions pen pin. Within the four azimuthal sectors shown in FIG Al, case A
a flux tilt of 11% was predicted for the most absorbing energy group. The
total absorption in the two poisoned pins corresponds to twice the absorption
in the isolated pin minus a correction of 4%. The EIR and Risb investigations
indicate that the usual BWR reactor physics design methods, which are based on
one-dimensional cylindrical cell calculations, axe adequate for adjacent Gd pins.

Cenire
- A2 -
Case A (azimuthal subdivision 1
l
.523 .54i.
.54i .545
Case S (standard case j
.lzl : .540
Relative power in Gd pin at 2 GWd/t
- 2
1.001
.
2 1
Exposure (GWd/t 1
0.999 0 4 2 3 4 5
Fig. Ai Effect of Gd pin subdivision ( El R- results I

- A3 -
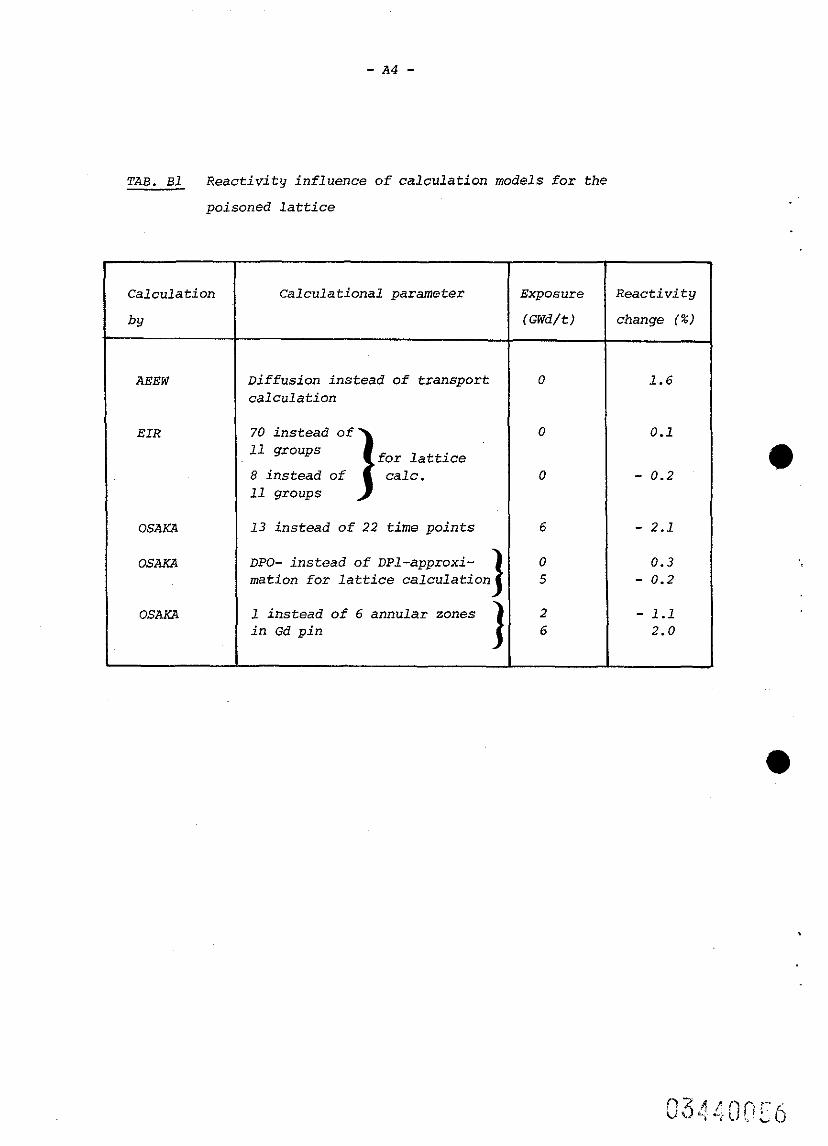
APPENDIX B Influence of Calculation Models on Reactivity
Par the poisoned lattice three participants (AEEW, EIR and OSAKA) performed
additional calculations in which they varied different parameters of the
calculaCiona1 models. The resulting reactivity changes (Ap = Ak/k) are listed
in TAB Bl.
The diffusion and transport calculations perform&d by AEEW at zero burnup are
described in Section 4.1. The EIR multiplication factors for the 70- and 8-
group lattice calculations are respectively 1.0118 and 1.0096.
OSAKA performed a burnup calculation using burnup steps of 1 GWd/t between
1 and 10 GWd/t instead of the standard steps.of 0.5 GWd/t ~(lJ. It should be
kept in mind that the necessary number of time steps depends on how the burn-
up models account for the time variation of the microscopic cross sections
and the flux during a time step. Alsoassessedby 0SA.U were the influence of
the angular flux approximation on the cell surface (DPO of DPl) and the num-
ber of annular zones in the Gd pin.
TAB Bl indicates that the angular approximation of the cell surface flux and
(above a certain minimum) the number of groups for the lattice calculation
have a small influence on the results. More important mdel parameters are
the lattice calculation method (diffusion versus transport theory), the num-
ber of time points during burnup end the spatial subdivision in the Gd pin.
- A4 -
TdB. Bl Reactivity influence of calculation models for the
poisoned lattice
Calculation
by
Calculational parameter Exposure Reactivity
tQ.'d/tJ change (%)
AEEW Diffusion instead of transport calculation
0 1.6
EIR
OSdkYd
OSdKd
OSAm
70 instead of 1 11 groups for lattice 8 instead of talc. 11 groups
13 instead of 22 time points
DPO- instead of DPl-approxi- mation for lattice calculation
1 instead of 6 annular zones in Gd pin
0 0.1
0 - 0.2
6 - 2.1
0 0.3 5 - 0.2
2 - 1.1 6 2.0

- A5 -
'.
APPENDIX C Reaction Rates for the Regular Lattice
!FAB Cl contains macroscopic absorption and production reaction rates, norm-
lized to 100% for each reaction, as a function of burnup. These values, which
were provided by G. Pierini, CISE, are useful for assessinq the contribution
of different isotopes to the multiplication f&to=,
TAB. Cl Reaction Rates (%) in the Regular Lattice (CISE-Results)
Exposure (GWd/t) 0 2 4 7 10
Absorptions in U-235 63 54 49 43 37
Absorptions in U-238 30 29 29 28 28
Absorptions in Pu-239 0 6 10 14 18
Other absorptions 7 11 12 15 17
Productions by U-235 94 86 79 73. 64
Productions by U-238 6 6 6 6 6
Productions by Pu-239 0 8 15 22 28
Other productions 0 0 0 1 2

- A6 -
APPENDIX D Partial Solutions
B. Zolotar, EPRI, performed a calculation f& the poisoned lattice using the
CASMO code (g), and K. Kowalska, SWIERK, provided results for both lattices
up to 7 GWd/t obtained with S-WIMS (E), the latter code being an adapted
version of the British WIMS-D code'(g). The calculation methods and the de-
tailed results of the EPRI and SWIERK solutions are described in Refs. (2) -
and (5).
.’
Calculations for both lattices were also performed by F. Casali, ENEA Bologna,
using the Monte Carlo code KIM (gj. The data base for KIM was obtained from
the UKNDL and ENDF/B-4, with the exception of the Gd isotopes for which the
evaluation of the Joint European File was used. The energy range above 5 eV
was divided into 70 groups, and a scheme corresponding to a practically in- *
finite number of groups was used in the thermal range, For the calculation of
the time dependence of the microscopic cross sections and the nuclide densi-
ties the Gd pin was divided into 3 annular sonas, The flux and microscopic
reaction rates were determined at 14 time points between 0 and 10 GWd/t. The '*
computing time was about 1.5 hours per time point for the poisoned case. So
far, the poisoned lattice has only been calculated.up to 4 GWd/t.
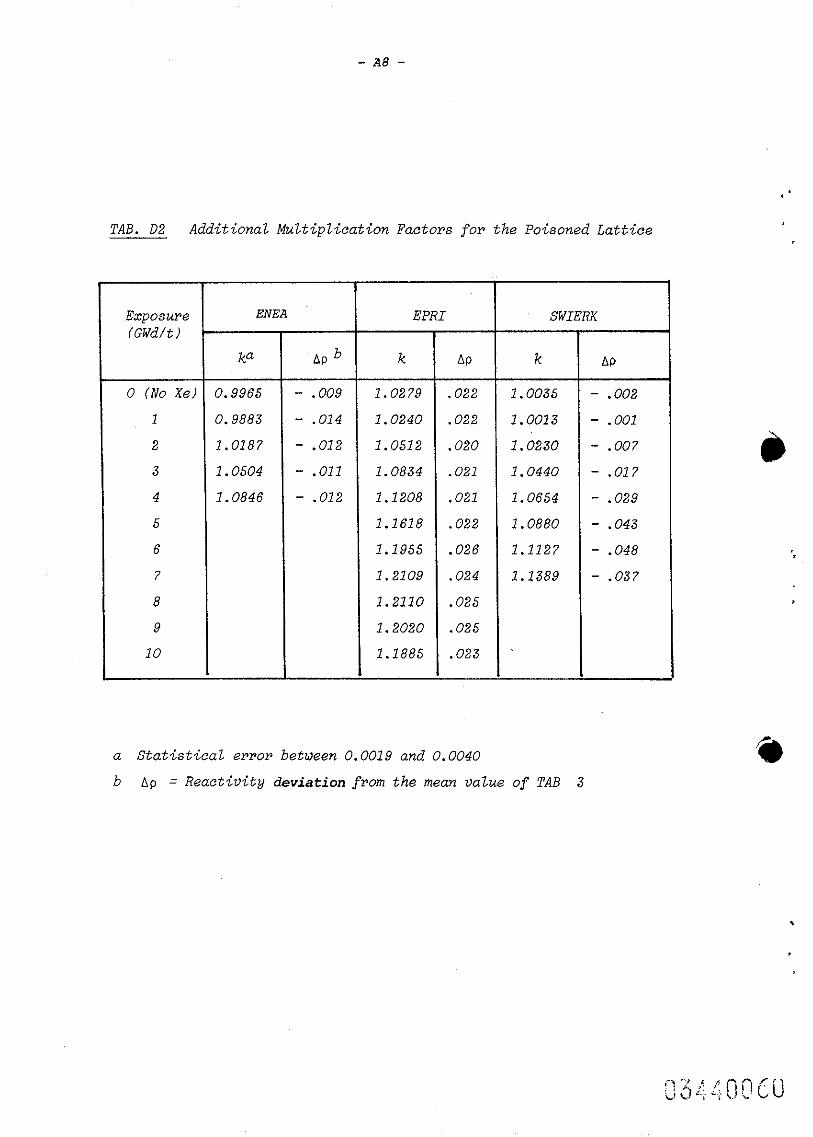
The multiplication factors obtained by ENEA, EPRI and SWIERK and the respec-
tive deviations from the mean values (cf..TABs 2-3) are listed in TABS Dl
and D2.

- 27 -
TAB. Dl Additional Multiplication Factors for the Regular Latt$ce
Exposme CGWd/tJ
0 (No Xe,
1
2
3
4
5
6
7
8
9
10
1.3390 .006
1.2869 ..009
2.2692 . 005
1.2618 .OlO
1.2449 .006
1.2354 .009
1.2226 .009
1.2067 .OO?
1.2000 .Oll
1.1844 .008
1.1740 .009
1.3360 .003
1.2794 .003
1.2673 .004
1.2543 .004
1.2401 .003
1.2277 .003
1.2146 .003
1.2019 ,.003
SWIERK 1
a Statistical ewe? C 1 sta. dev.) between 0.0018 and 0.0028
b AP = Reactivity deviation from mean value of TAB 2
- A8 -
TAB. DZ Additional Multiplication Factors for the Poisoned Lattice
Exposure CGWd/t)
0 (No Xe)
1
2
3
4
5
6
7
8
9
10 -
ka HAP '
7.9965 - .009
7.9883 - .014
1.0187 - .012
z.0504 - .Oll
2.0846 - .012
EPRl SWIERK
k AP
1.0279 .022
1.0240 .022
1.0512 .020
1.0834 .021
1.1208 .021
1.1618 .O22
1.1955 .026
1.2109 .024
1.2110 .025
1.2020 .025
1.1885 .023
a Stat-istieal e?po? between 0.0019 and 0.0040
k AP
1.0035 - .002
1.0013 - .OOl
1.;230 - .007
1.0440 - .017
1.0654 - .029
1.0880 - .043
1.1127 - .048
1.1389 - .037
b Ap = Reactivity deyiation from the mean value of TAB 3
- A9 -
,
.
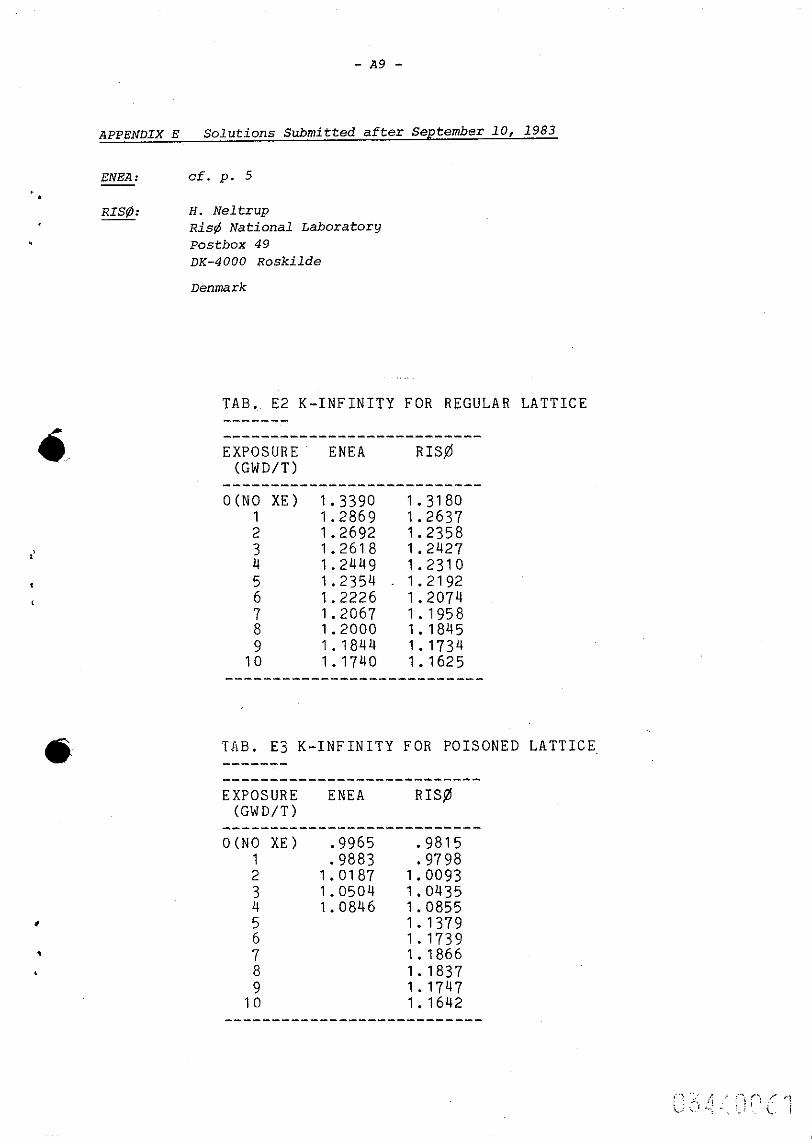
APPENDIX E Solutions Submitted after September 10, 1983
ENEA:
RI@:
cf. p. 5
H. Neltmp Risb National Laboratory Postbox 49 DK-4000 Roskilde
Denmark
TAB. E2 K-INFINITY FOR REGULAR LATTICE ------- --------------------------- EXPOSURE' ENEA RI@
(GWD/T)
O(N0 XE) I.3390 1.3180 1 1.2869 1.2637 2 I. 2692 1.2358 z 1.2618 1.2449 1.2427
1.2310 5 1.2354 1.2192 6 1.2ii6 I.2074
; 1.2067 1.1958 1.2000 1.1845
9 1.1844 1.1734 10 1.1740 1.1625
---------------------------
TAB. E3 K-INFINITY FOR POISONED LATTICES
EXPOSURE ENEA RI@ (GWD/T)
--------------------------- OCNO XE) .9965 .9815
1 9883 .9798 2 I:0187 1.0093
z 1.0504 1.0435 1.0846 1.0855
5 1.1379 6 I.1739 7 1.1866
; 1.1837
10 X~~ . ---------------------------

- Al0 -
TAB. E4 U-235 DENSITY FOR REGULAR LATTICE(l.O-4/BARN X CM)
EXPOSURE ENEA RI@ (GWD/T)
0 6.777 t5.777 2 6.25a 6.261
: 5.77a 5.7a7 5.330 5.347
1: 4.911 4.937 4.517 4.553
---------------------------
TAB. E5 U-235 DENSITY IN POISONED PIN(l.O-4/BARN v--e--- --------------------------- EXPOSURE ENEA RI@
(GWD/T) ---------------------------
0 6.574 6.573 c 6.083 6.352 6.106 6.37a
i 5.747 5.341
10 4.941
X CM)
TAB. E6 PU-239 DENSITY FOR REGULAR LATTICE(l.O-5/BARN X CM)
---------------------------
EXPOSURE ENEA RISfj (GWD/T)
--------------------------- 2 2.061 2.133
3.714 3.902 5.062 5.330
4
i 6.151 6.484 IO 7.025 7.430
---------------------------
TAB. E7 PU-239 DENSITY IN POISONED PIN(l.O-5/BARN X CM) ------- --------------------------- EXPOSURE ENEA
(GWD/T) RI+
--------------------------- 2 2.140 2.217 4 3.943 4.174 6 5.664 8 6.758
10 7.615 ---------------------------
. .
.

- All -
‘.
.
TAB. E8 PU-240 DENSITY FOR REGULAR LATTICE(l.O-6/BARN X CM)
EXPOSURE ENEA RIS# (GWD/T)
--------------------------- 2 .954 .884 4 3.187 3.083 i 6.083 9.437 9.409 6.027
10 13.030 13.052
TAB. E9 PU-240 DENSITY IN POISONED PIN(l.O-6/BARN X CM) ------- -----------~--------------- EXPOSURE ENEA RIS$
(GWD/T)
2 ".657 471 4 2.423 2:067 6 4.864 8 a.428
10 12.250
.
TAB.ElO GD-155 DENSITY IN POISONED PIN(l.O-4/liiAiN X CM) ,
--------------------------- EXPOSURE ENEA RI@
(GWD/T) ---------------------------
0 1.47E+OO 1.47E+OO 2 9.4OE-01 9.6lE-01 3 6.72E-01
z 4.42E-01 4.29E-02
6 6.76E-02 7 1.82E-02
---------------------------
TAB.Ell GD-157 DENSITY IN POISONED PIN(l.O-4/BARN X CM) -------
‘
.
EXPOSURE ENEA RIS$ (GWD/T)
--------------------------- 0 1.56E+OO 1.56E+OO 2 4.&3E-01 5.29E-01 3 2.35E-01 4 9.88E-02 6.46E-02 5 6 7

- Al2 -
,
.’
TAB.El2 POWER IN PIN 4 C-j ------- --------------------------- EXPOSURE ENEA RIS$
CGWD/TJ ---------------------------
; 1.154 '1.174 I.137 1.126
4 1,055 1.066
i 1.007
.992 10 .991
---------------------------
TAB.Elj POWER IN POISONED PIN ---v-n- --------------------------- EXPOSURE ENEA
CGWD/T) RIS$
--------------------------- 0 .36a .32Q 2 i33 4 :716 6 a 1.026
10 1.02a ---------------------------