inter-office correspondence office of data and
TRANSCRIPT
- 1 -
INTER-OFFICE CORRESPONDENCE Los Angeles Unified School District Office of Data and Accountability
INFORMATIVE October 4, 2012 TO: Members, Board of Education John E. Deasy, Superintendent FROM: Cynthia Lim, Executive Director Office of Data and Accountability SUBJECT: RELEASE OF SCHOOL ACADEMIC GROWTH OVER TIME RESULTS On October 5, 2012 the third year of school level Academic Growth over Time (AGT) results will be released on the following website: http://agt.lausd.net. This memo provides a brief description of the district’s AGT model and a summary of the results. Background Academic Growth over Time is a statistical method used to identify the individual impact of a school, (school leader or teacher) on student learning. The academic growth over time measure uses a value-added approach where a student’s prior year achievement on the CST English language arts and math tests is used to predict future performance on the CST. The difference between the “predicted” and “actual” score is considered the “value-added” score. Growth estimates are provided for each school and grade level compared to the District average. Results fall into five categories:
1. Far Above Predicted AGT (blue) 2. Above Predicted AGT (green) 3. Within the predicted Range (gray) 4. Below Predicted AGT (yellow) 5. Far Below Predicted AGT (red)
LAUSD’s Model Currently, a variety of value-added models are being used by school districts throughout the nation. LAUSD contracted with the University of Wisconsin’s Value-Added Research Center (VARC) to develop the AGT model and calculate scores for schools and teachers. With input from stakeholders and a Technical Advisory Group that includes national and regional experts on these methods, LAUSD incorporated and “controlled for” a variety of factors, as shown in Table 1.
- 2 -
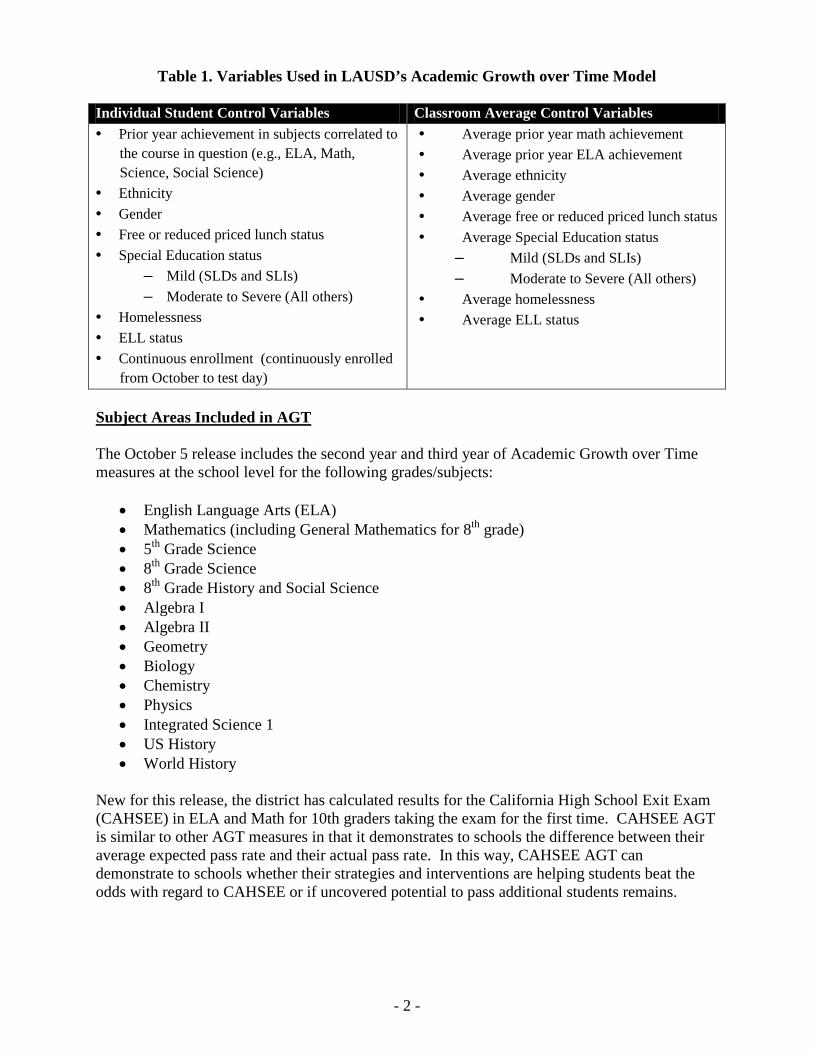
Table 1. Variables Used in LAUSD’s Academic Growth over Time Model
Individual Student Control Variables Classroom Average Control Variables • Prior year achievement in subjects correlated to
the course in question (e.g., ELA, Math, Science, Social Science)
• Ethnicity • Gender • Free or reduced priced lunch status • Special Education status
– Mild (SLDs and SLIs) – Moderate to Severe (All others)
• Homelessness • ELL status • Continuous enrollment (continuously enrolled
from October to test day)
• Average prior year math achievement • Average prior year ELA achievement • Average ethnicity • Average gender • Average free or reduced priced lunch status • Average Special Education status
– Mild (SLDs and SLIs) – Moderate to Severe (All others)
• Average homelessness • Average ELL status
Subject Areas Included in AGT The October 5 release includes the second year and third year of Academic Growth over Time measures at the school level for the following grades/subjects:
• English Language Arts (ELA) • Mathematics (including General Mathematics for 8th grade) • 5th Grade Science • 8th Grade Science • 8th Grade History and Social Science • Algebra I • Algebra II • Geometry • Biology • Chemistry • Physics • Integrated Science 1 • US History • World History
New for this release, the district has calculated results for the California High School Exit Exam (CAHSEE) in ELA and Math for 10th graders taking the exam for the first time. CAHSEE AGT is similar to other AGT measures in that it demonstrates to schools the difference between their average expected pass rate and their actual pass rate. In this way, CAHSEE AGT can demonstrate to schools whether their strategies and interventions are helping students beat the odds with regard to CAHSEE or if uncovered potential to pass additional students remains.
- 3 -
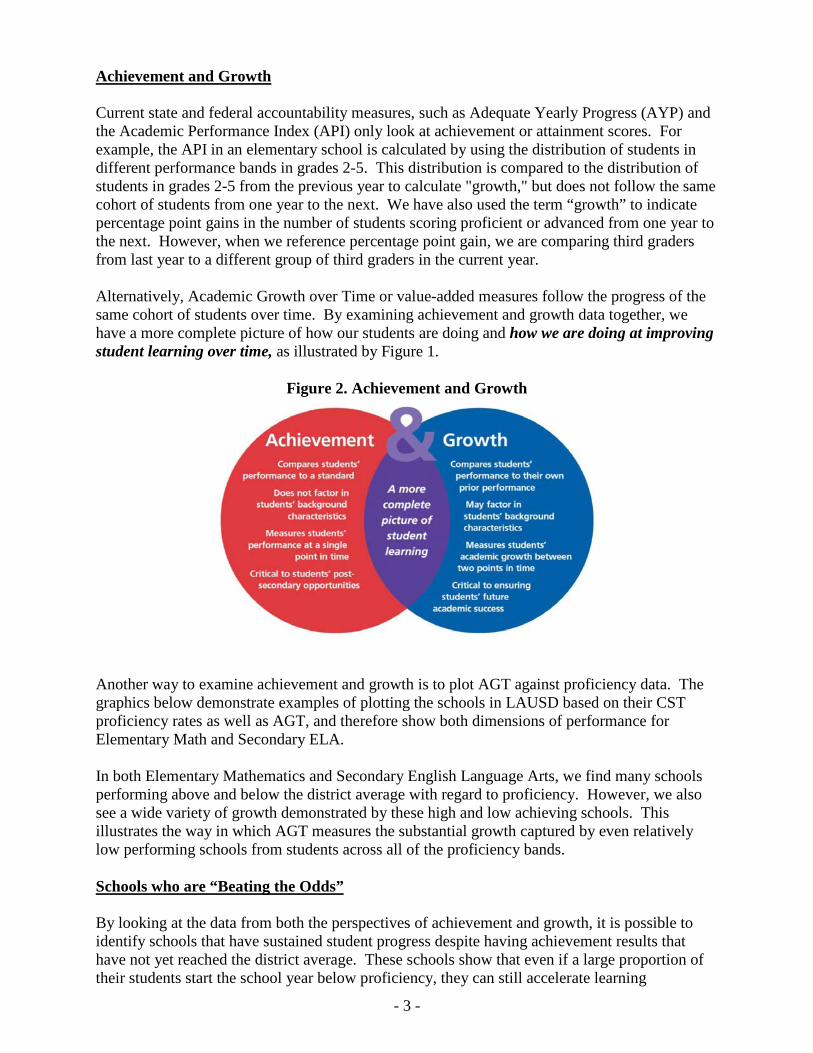
Achievement and Growth Current state and federal accountability measures, such as Adequate Yearly Progress (AYP) and the Academic Performance Index (API) only look at achievement or attainment scores. For example, the API in an elementary school is calculated by using the distribution of students in different performance bands in grades 2-5. This distribution is compared to the distribution of students in grades 2-5 from the previous year to calculate "growth," but does not follow the same cohort of students from one year to the next. We have also used the term “growth” to indicate percentage point gains in the number of students scoring proficient or advanced from one year to the next. However, when we reference percentage point gain, we are comparing third graders from last year to a different group of third graders in the current year. Alternatively, Academic Growth over Time or value-added measures follow the progress of the same cohort of students over time. By examining achievement and growth data together, we have a more complete picture of how our students are doing and how we are doing at improving student learning over time, as illustrated by Figure 1.
Figure 2. Achievement and Growth
Another way to examine achievement and growth is to plot AGT against proficiency data. The graphics below demonstrate examples of plotting the schools in LAUSD based on their CST proficiency rates as well as AGT, and therefore show both dimensions of performance for Elementary Math and Secondary ELA. In both Elementary Mathematics and Secondary English Language Arts, we find many schools performing above and below the district average with regard to proficiency. However, we also see a wide variety of growth demonstrated by these high and low achieving schools. This illustrates the way in which AGT measures the substantial growth captured by even relatively low performing schools from students across all of the proficiency bands. Schools who are “Beating the Odds” By looking at the data from both the perspectives of achievement and growth, it is possible to identify schools that have sustained student progress despite having achievement results that have not yet reached the district average. These schools show that even if a large proportion of their students start the school year below proficiency, they can still accelerate learning
- 4 -
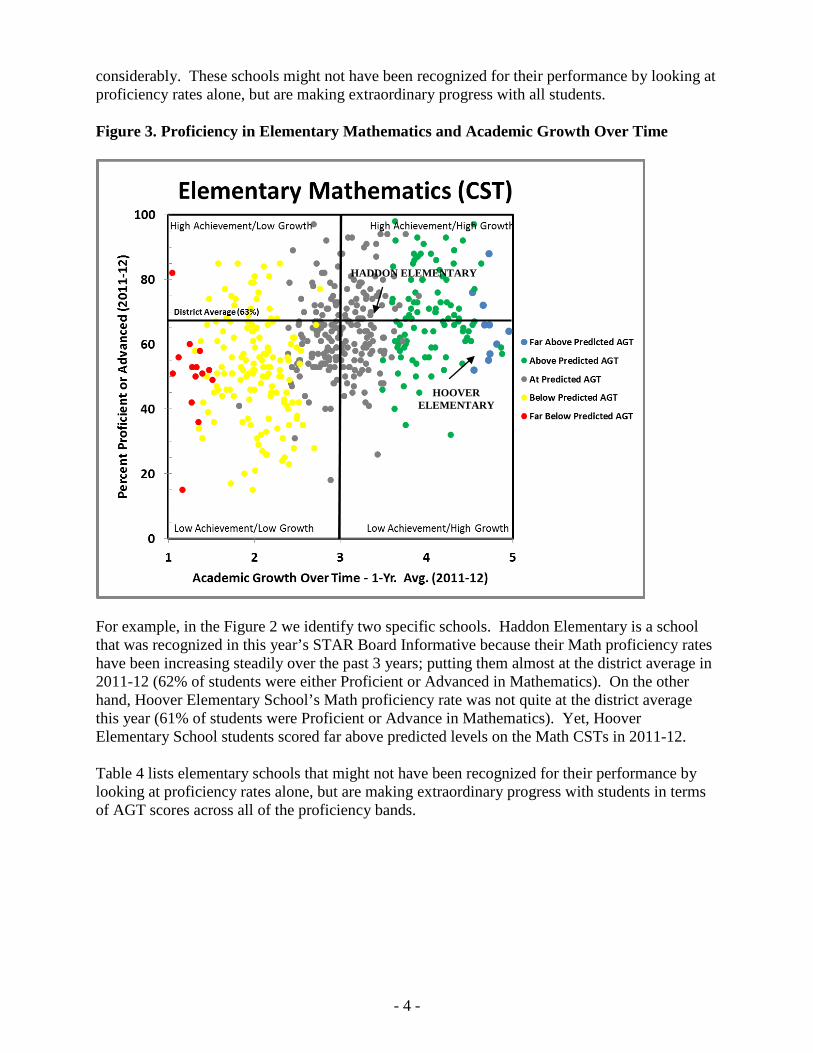
considerably. These schools might not have been recognized for their performance by looking at proficiency rates alone, but are making extraordinary progress with all students. Figure 3. Proficiency in Elementary Mathematics and Academic Growth Over Time
For example, in the Figure 2 we identify two specific schools. Haddon Elementary is a school that was recognized in this year’s STAR Board Informative because their Math proficiency rates have been increasing steadily over the past 3 years; putting them almost at the district average in 2011-12 (62% of students were either Proficient or Advanced in Mathematics). On the other hand, Hoover Elementary School’s Math proficiency rate was not quite at the district average this year (61% of students were Proficient or Advance in Mathematics). Yet, Hoover Elementary School students scored far above predicted levels on the Math CSTs in 2011-12. Table 4 lists elementary schools that might not have been recognized for their performance by looking at proficiency rates alone, but are making extraordinary progress with students in terms of AGT scores across all of the proficiency bands.
HOOVER ELEMENTARY
HADDON ELEMENTARY
- 5 -
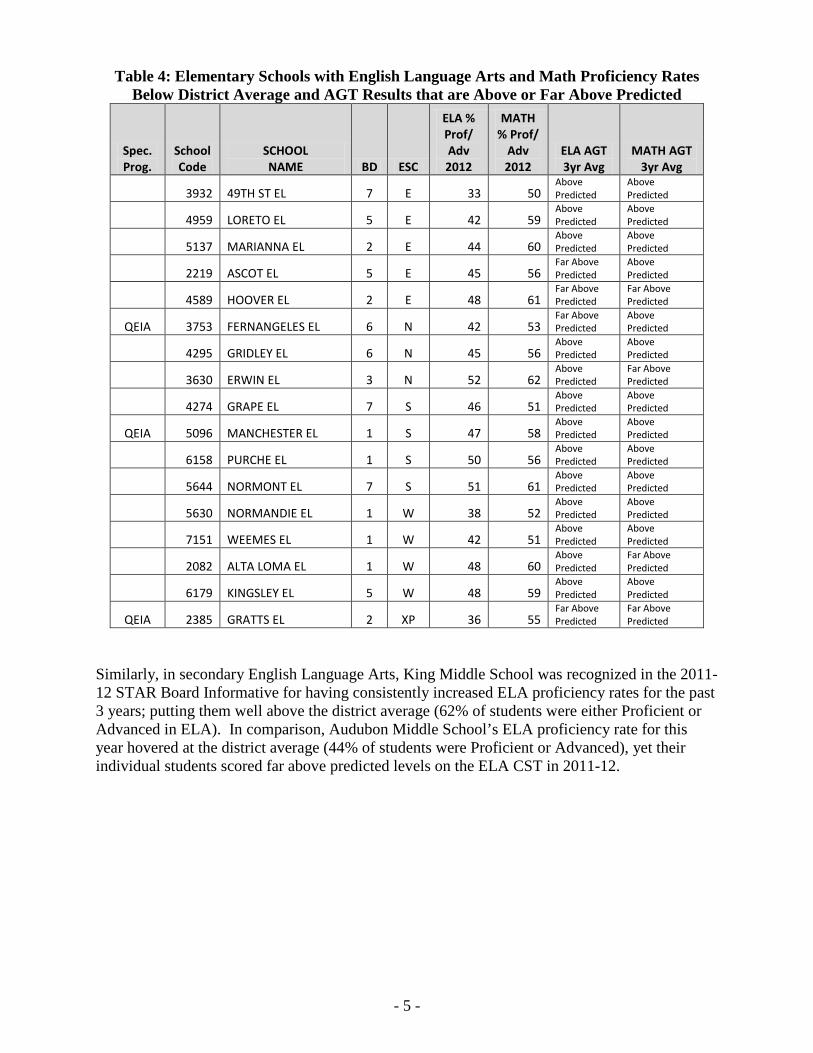
Table 4: Elementary Schools with English Language Arts and Math Proficiency Rates Below District Average and AGT Results that are Above or Far Above Predicted
Spec. Prog.
School Code
SCHOOL NAME BD ESC
ELA % Prof/ Adv 2012
MATH % Prof/
Adv 2012
ELA AGT 3yr Avg
MATH AGT 3yr Avg
3932 49TH ST EL 7 E 33 50
Above Predicted
Above Predicted
4959 LORETO EL 5 E 42 59
Above Predicted
Above Predicted
5137 MARIANNA EL 2 E 44 60
Above Predicted
Above Predicted
2219 ASCOT EL 5 E 45 56
Far Above Predicted
Above Predicted
4589 HOOVER EL 2 E 48 61
Far Above Predicted
Far Above Predicted
QEIA 3753 FERNANGELES EL 6 N 42 53 Far Above Predicted
Above Predicted
4295 GRIDLEY EL 6 N 45 56 Above Predicted
Above Predicted
3630 ERWIN EL 3 N 52 62 Above Predicted
Far Above Predicted
4274 GRAPE EL 7 S 46 51 Above Predicted
Above Predicted
QEIA 5096 MANCHESTER EL 1 S 47 58 Above Predicted
Above Predicted
6158 PURCHE EL 1 S 50 56 Above Predicted
Above Predicted
5644 NORMONT EL 7 S 51 61 Above Predicted
Above Predicted
5630 NORMANDIE EL 1 W 38 52 Above Predicted
Above Predicted
7151 WEEMES EL 1 W 42 51 Above Predicted
Above Predicted
2082 ALTA LOMA EL 1 W 48 60 Above Predicted
Far Above Predicted
6179 KINGSLEY EL 5 W 48 59 Above Predicted
Above Predicted
QEIA 2385 GRATTS EL 2 XP 36 55 Far Above Predicted
Far Above Predicted
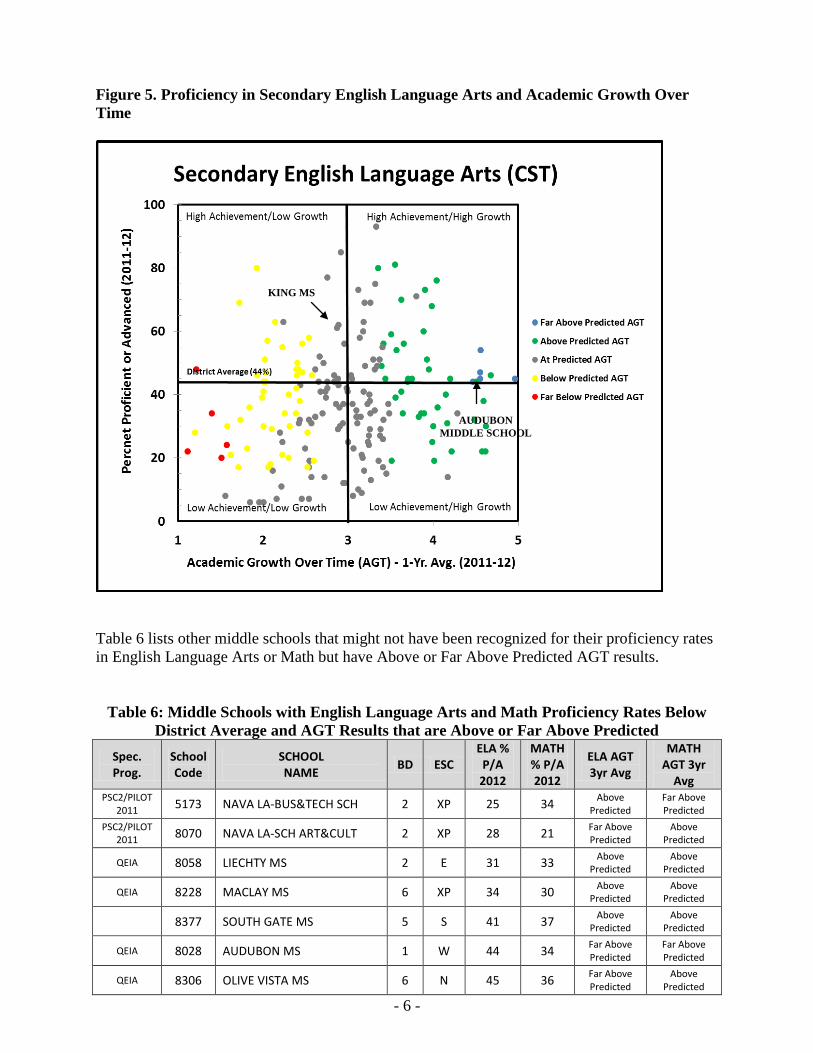
Similarly, in secondary English Language Arts, King Middle School was recognized in the 2011-12 STAR Board Informative for having consistently increased ELA proficiency rates for the past 3 years; putting them well above the district average (62% of students were either Proficient or Advanced in ELA). In comparison, Audubon Middle School’s ELA proficiency rate for this year hovered at the district average (44% of students were Proficient or Advanced), yet their individual students scored far above predicted levels on the ELA CST in 2011-12.
- 6 -
Figure 5. Proficiency in Secondary English Language Arts and Academic Growth Over Time
Table 6 lists other middle schools that might not have been recognized for their proficiency rates in English Language Arts or Math but have Above or Far Above Predicted AGT results.
Table 6: Middle Schools with English Language Arts and Math Proficiency Rates Below District Average and AGT Results that are Above or Far Above Predicted
Spec. Prog.
School Code
SCHOOL NAME BD ESC
ELA % P/A
2012
MATH % P/A 2012
ELA AGT 3yr Avg
MATH AGT 3yr
Avg PSC2/PILOT
2011 5173 NAVA LA-BUS&TECH SCH 2 XP 25 34 Above Predicted
Far Above Predicted
PSC2/PILOT 2011 8070 NAVA LA-SCH ART&CULT 2 XP 28 21 Far Above
Predicted Above
Predicted
QEIA 8058 LIECHTY MS 2 E 31 33 Above Predicted
Above Predicted
QEIA 8228 MACLAY MS 6 XP 34 30 Above Predicted
Above Predicted
8377 SOUTH GATE MS 5 S 41 37 Above Predicted
Above Predicted
QEIA 8028 AUDUBON MS 1 W 44 34 Far Above Predicted
Far Above Predicted
QEIA 8306 OLIVE VISTA MS 6 N 45 36 Far Above Predicted
Above Predicted
AUDUBON MIDDLE SCHOOL
KING MS
- 7 -
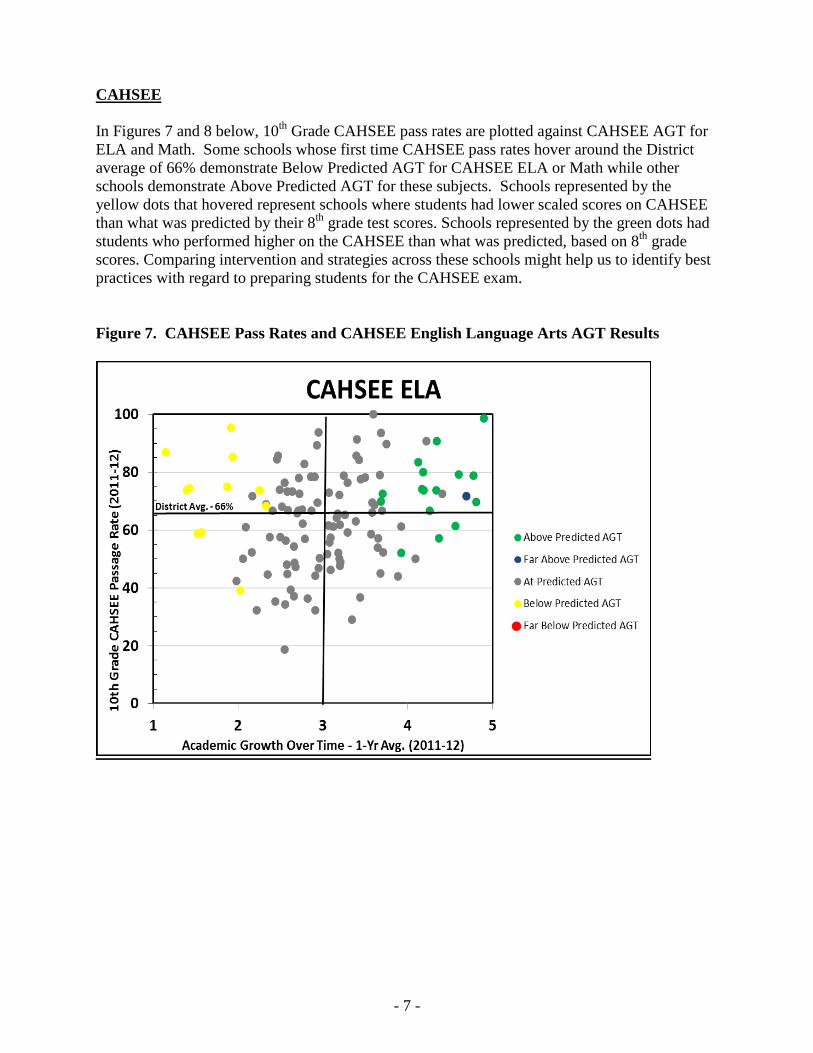
CAHSEE In Figures 7 and 8 below, 10th Grade CAHSEE pass rates are plotted against CAHSEE AGT for ELA and Math. Some schools whose first time CAHSEE pass rates hover around the District average of 66% demonstrate Below Predicted AGT for CAHSEE ELA or Math while other schools demonstrate Above Predicted AGT for these subjects. Schools represented by the yellow dots that hovered represent schools where students had lower scaled scores on CAHSEE than what was predicted by their 8th grade test scores. Schools represented by the green dots had students who performed higher on the CAHSEE than what was predicted, based on 8th grade scores. Comparing intervention and strategies across these schools might help us to identify best practices with regard to preparing students for the CAHSEE exam. Figure 7. CAHSEE Pass Rates and CAHSEE English Language Arts AGT Results
- 8 -
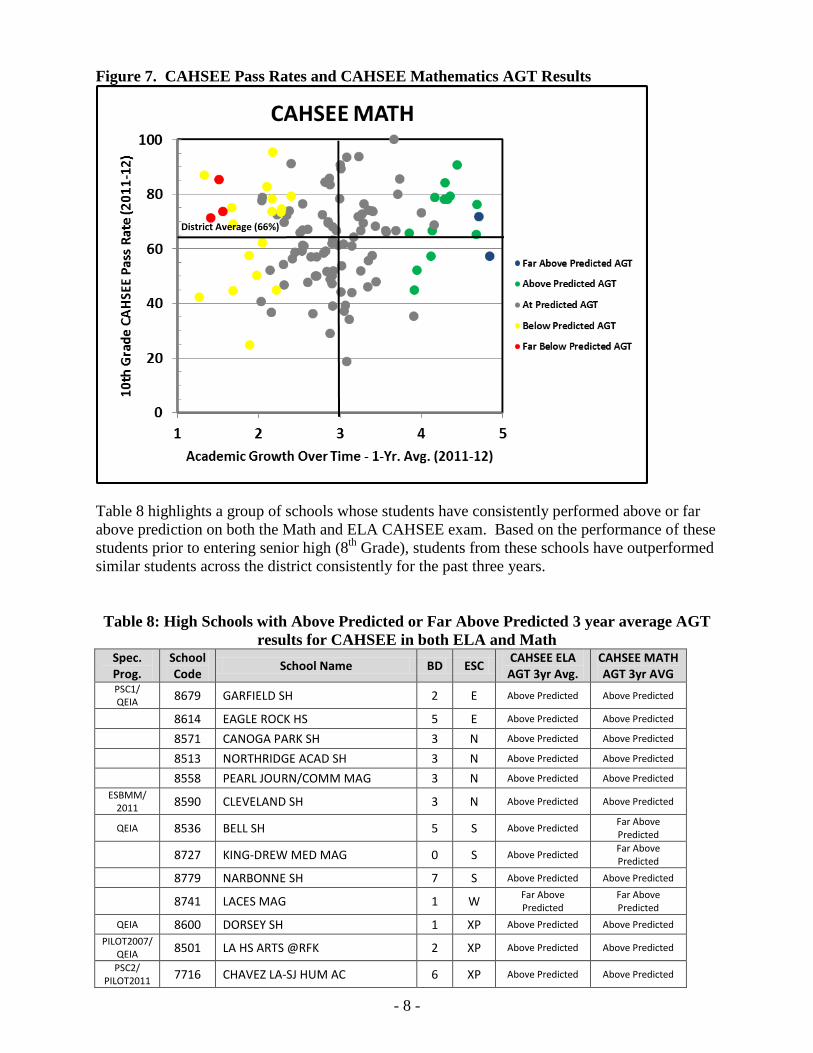
Figure 7. CAHSEE Pass Rates and CAHSEE Mathematics AGT Results
Table 8 highlights a group of schools whose students have consistently performed above or far above prediction on both the Math and ELA CAHSEE exam. Based on the performance of these students prior to entering senior high (8th Grade), students from these schools have outperformed similar students across the district consistently for the past three years. Table 8: High Schools with Above Predicted or Far Above Predicted 3 year average AGT
results for CAHSEE in both ELA and Math Spec. Prog.
School Code School Name BD ESC CAHSEE ELA
AGT 3yr Avg. CAHSEE MATH AGT 3yr AVG
PSC1/ QEIA 8679 GARFIELD SH 2 E Above Predicted Above Predicted
8614 EAGLE ROCK HS 5 E Above Predicted Above Predicted
8571 CANOGA PARK SH 3 N Above Predicted Above Predicted
8513 NORTHRIDGE ACAD SH 3 N Above Predicted Above Predicted
8558 PEARL JOURN/COMM MAG 3 N Above Predicted Above Predicted ESBMM/
2011 8590 CLEVELAND SH 3 N Above Predicted Above Predicted
QEIA 8536 BELL SH 5 S Above Predicted Far Above Predicted
8727 KING-DREW MED MAG 0 S Above Predicted Far Above Predicted
8779 NARBONNE SH 7 S Above Predicted Above Predicted
8741 LACES MAG 1 W Far Above Predicted
Far Above Predicted
QEIA 8600 DORSEY SH 1 XP Above Predicted Above Predicted PILOT2007/
QEIA 8501 LA HS ARTS @RFK 2 XP Above Predicted Above Predicted
PSC2/ PILOT2011 7716 CHAVEZ LA-SJ HUM AC 6 XP Above Predicted Above Predicted
District Average (66%)
- 9 -
Spec. Prog.
School Code School Name BD ESC CAHSEE ELA
AGT 3yr Avg. CAHSEE MATH AGT 3yr AVG
PLAS/ QEIA 7749 ROOSEVELT HS CNMT 2 XP Above Predicted Above Predicted
8517 CONTRERAS LC 2 XP Far Above Predicted Above Predicted
LAP/QEIA 8748 WEST ADAMS PREP SH 2 XP Above Predicted Above Predicted
8843 SAN FERNANDO SH 6 XP Above Predicted Far Above Predicted
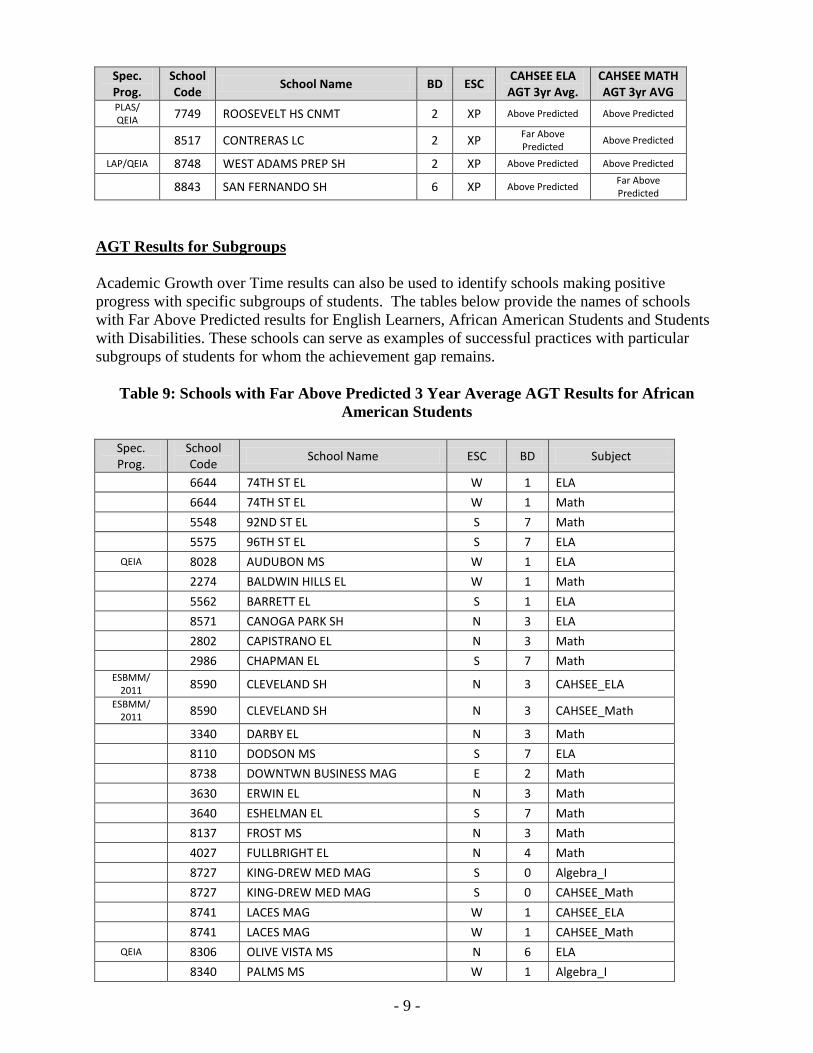
AGT Results for Subgroups Academic Growth over Time results can also be used to identify schools making positive progress with specific subgroups of students. The tables below provide the names of schools with Far Above Predicted results for English Learners, African American Students and Students with Disabilities. These schools can serve as examples of successful practices with particular subgroups of students for whom the achievement gap remains.
Table 9: Schools with Far Above Predicted 3 Year Average AGT Results for African American Students
Spec. Prog.
School Code School Name ESC BD Subject
6644 74TH ST EL W 1 ELA 6644 74TH ST EL W 1 Math 5548 92ND ST EL S 7 Math 5575 96TH ST EL S 7 ELA
QEIA 8028 AUDUBON MS W 1 ELA 2274 BALDWIN HILLS EL W 1 Math 5562 BARRETT EL S 1 ELA 8571 CANOGA PARK SH N 3 ELA 2802 CAPISTRANO EL N 3 Math 2986 CHAPMAN EL S 7 Math
ESBMM/ 2011 8590 CLEVELAND SH N 3 CAHSEE_ELA
ESBMM/ 2011 8590 CLEVELAND SH N 3 CAHSEE_Math
3340 DARBY EL N 3 Math 8110 DODSON MS S 7 ELA 8738 DOWNTWN BUSINESS MAG E 2 Math 3630 ERWIN EL N 3 Math 3640 ESHELMAN EL S 7 Math 8137 FROST MS N 3 Math 4027 FULLBRIGHT EL N 4 Math 8727 KING-DREW MED MAG S 0 Algebra_I 8727 KING-DREW MED MAG S 0 CAHSEE_Math 8741 LACES MAG W 1 CAHSEE_ELA 8741 LACES MAG W 1 CAHSEE_Math
QEIA 8306 OLIVE VISTA MS N 6 ELA 8340 PALMS MS W 1 Algebra_I
- 10 -
Spec. Prog.
School Code School Name ESC BD Subject
4980 PIO PICO MS W 1 Algebra_I 4980 PIO PICO MS W 1 Math 8842 SOCES MAG N 3 Algebra_I 8406 SUTTER MS N 4 Math 7422 VAN GOGH EL N 3 ELA
QEIA 7479 VERMONT EL E 1 Math 7712 WESTPORT HTS EL W 4 ELA 7712 WESTPORT HTS EL W 4 Math
QEIA 8490 WILMINGTON MS S 7 Algebra_I
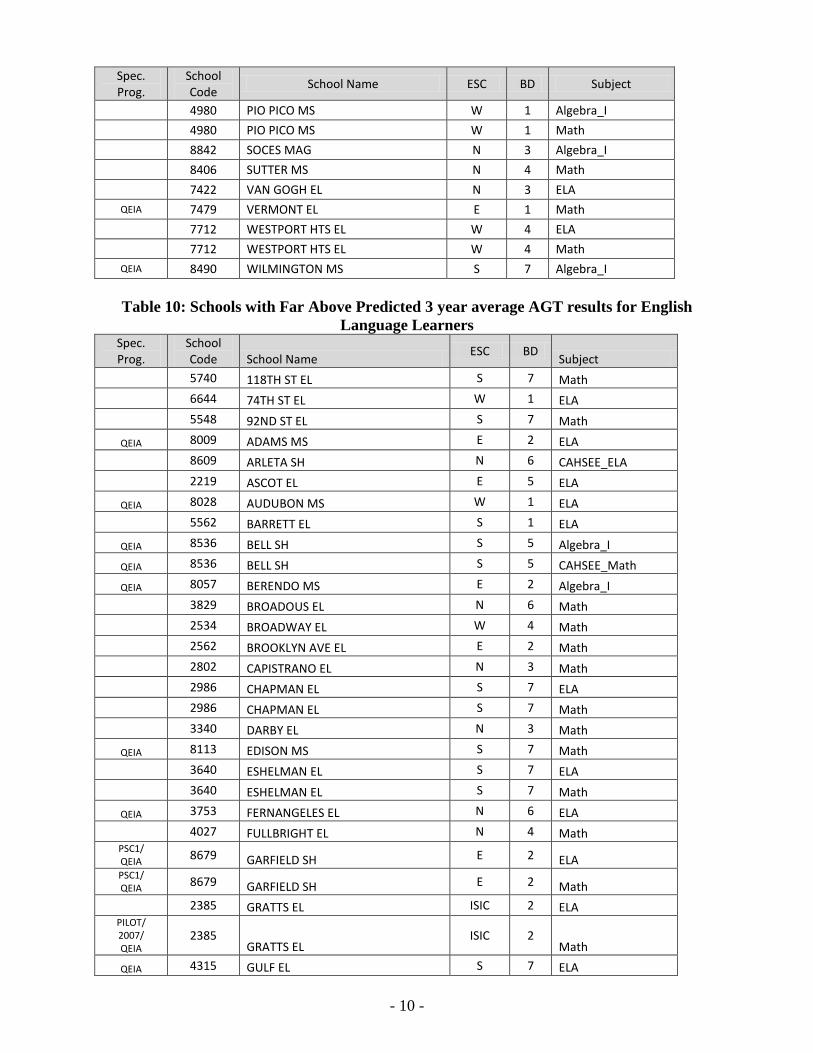
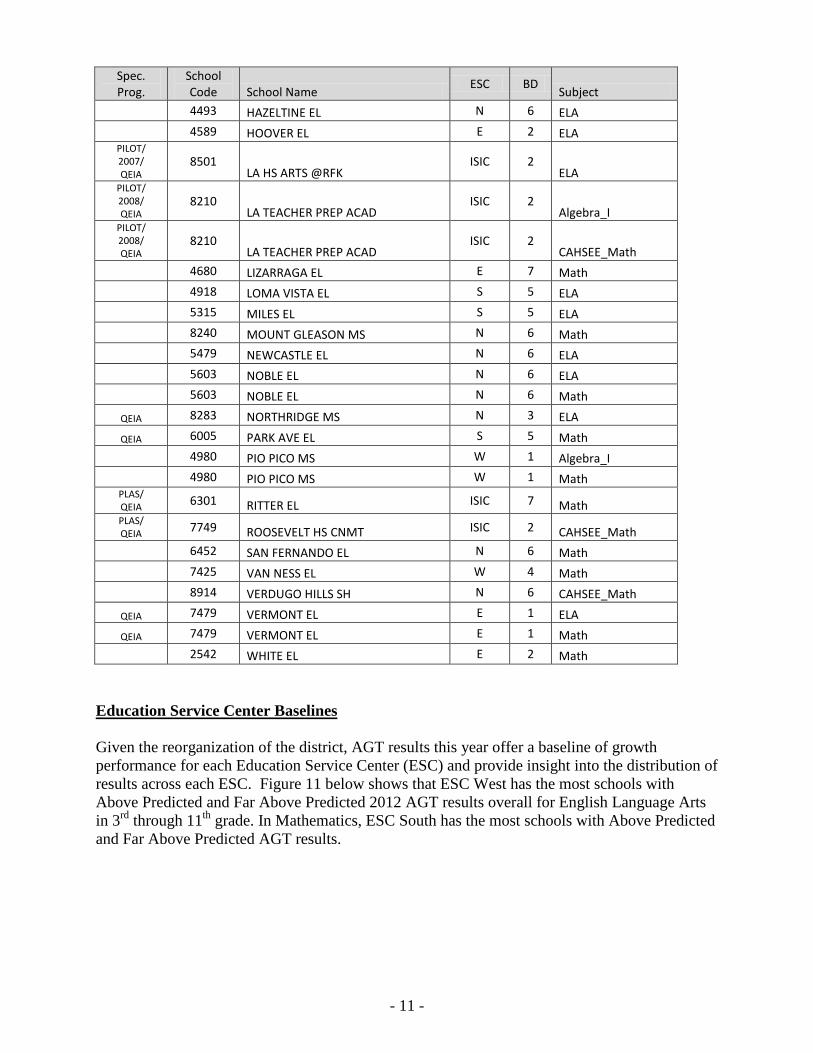
Table 10: Schools with Far Above Predicted 3 year average AGT results for English Language Learners
Spec. Prog.
School Code School Name ESC BD Subject
5740 118TH ST EL S 7 Math
6644 74TH ST EL W 1 ELA
5548 92ND ST EL S 7 Math
QEIA 8009 ADAMS MS E 2 ELA
8609 ARLETA SH N 6 CAHSEE_ELA
2219 ASCOT EL E 5 ELA
QEIA 8028 AUDUBON MS W 1 ELA
5562 BARRETT EL S 1 ELA
QEIA 8536 BELL SH S 5 Algebra_I
QEIA 8536 BELL SH S 5 CAHSEE_Math
QEIA 8057 BERENDO MS E 2 Algebra_I
3829 BROADOUS EL N 6 Math
2534 BROADWAY EL W 4 Math
2562 BROOKLYN AVE EL E 2 Math
2802 CAPISTRANO EL N 3 Math
2986 CHAPMAN EL S 7 ELA
2986 CHAPMAN EL S 7 Math
3340 DARBY EL N 3 Math
QEIA 8113 EDISON MS S 7 Math
3640 ESHELMAN EL S 7 ELA
3640 ESHELMAN EL S 7 Math
QEIA 3753 FERNANGELES EL N 6 ELA
4027 FULLBRIGHT EL N 4 Math PSC1/ QEIA 8679 GARFIELD SH E 2 ELA PSC1/ QEIA 8679 GARFIELD SH E 2 Math
2385 GRATTS EL ISIC 2 ELA PILOT/ 2007/ QEIA
2385 GRATTS EL
ISIC 2 Math
QEIA 4315 GULF EL S 7 ELA
- 11 -
Spec. Prog.
School Code School Name ESC BD Subject
4493 HAZELTINE EL N 6 ELA
4589 HOOVER EL E 2 ELA PILOT/ 2007/ QEIA
8501 LA HS ARTS @RFK
ISIC 2 ELA
PILOT/ 2008/ QEIA
8210 LA TEACHER PREP ACAD
ISIC 2 Algebra_I
PILOT/ 2008/ QEIA
8210 LA TEACHER PREP ACAD
ISIC 2 CAHSEE_Math
4680 LIZARRAGA EL E 7 Math
4918 LOMA VISTA EL S 5 ELA
5315 MILES EL S 5 ELA
8240 MOUNT GLEASON MS N 6 Math
5479 NEWCASTLE EL N 6 ELA
5603 NOBLE EL N 6 ELA
5603 NOBLE EL N 6 Math
QEIA 8283 NORTHRIDGE MS N 3 ELA
QEIA 6005 PARK AVE EL S 5 Math
4980 PIO PICO MS W 1 Algebra_I
4980 PIO PICO MS W 1 Math PLAS/ QEIA 6301 RITTER EL ISIC 7 Math PLAS/ QEIA 7749 ROOSEVELT HS CNMT ISIC 2 CAHSEE_Math
6452 SAN FERNANDO EL N 6 Math
7425 VAN NESS EL W 4 Math
8914 VERDUGO HILLS SH N 6 CAHSEE_Math
QEIA 7479 VERMONT EL E 1 ELA
QEIA 7479 VERMONT EL E 1 Math
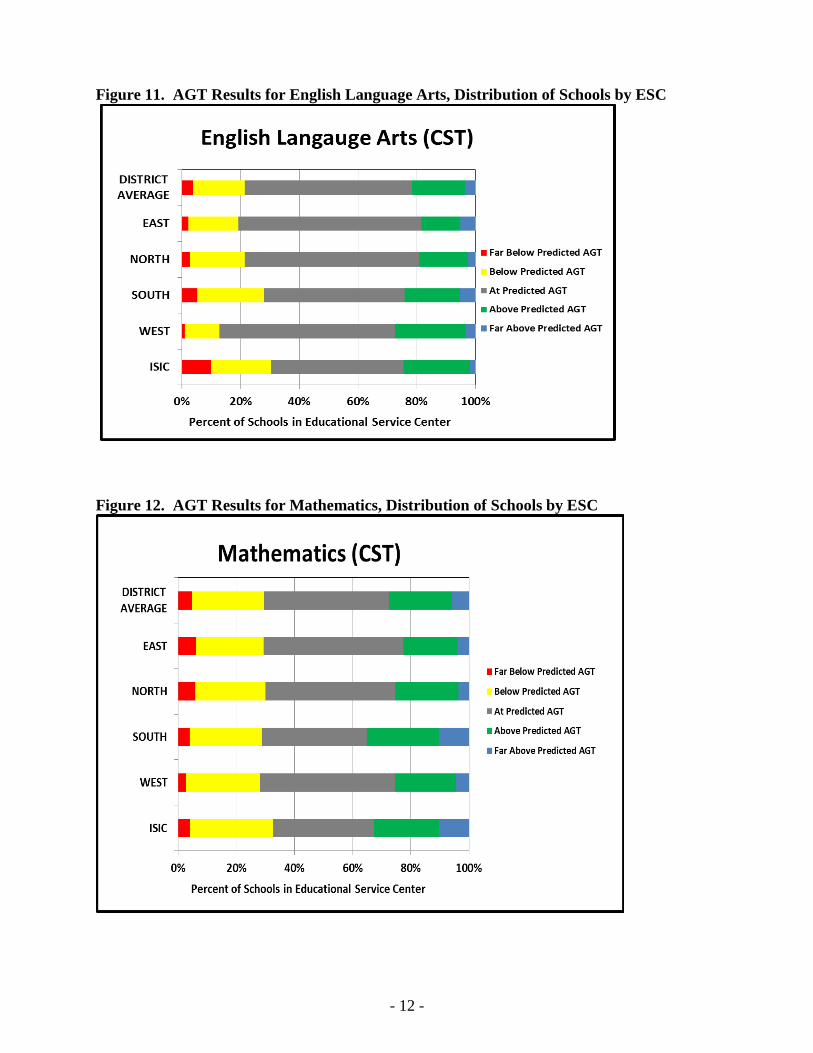
2542 WHITE EL E 2 Math Education Service Center Baselines Given the reorganization of the district, AGT results this year offer a baseline of growth performance for each Education Service Center (ESC) and provide insight into the distribution of results across each ESC. Figure 11 below shows that ESC West has the most schools with Above Predicted and Far Above Predicted 2012 AGT results overall for English Language Arts in 3rd through 11th grade. In Mathematics, ESC South has the most schools with Above Predicted and Far Above Predicted AGT results.
- 12 -
Figure 11. AGT Results for English Language Arts, Distribution of Schools by ESC
Figure 12. AGT Results for Mathematics, Distribution of Schools by ESC
- 13 -
Next Steps for AGT On October 5, 2012, school level reports will be available at http://agt.lausd.net. On October 5, 2012, teachers will receive their individual results confidentially. Principals will have access to their teachers’ results on October 15, 2012. AGT has also been incorporated in the School Performance Framework (SPF) for all school levels, and will but used as another data point to consider when ESCs are conducting performance dialogues with principals. Finally, AGT results will be populated into a “2 x 2 Matrix” tool that will allow the broader community to investigate school data more deeply from the lenses of both achievement and growth. If there are additional questions, please contact me at (213) 241-2460 or Noah Bookman at (213) 241-2022. c: Jaime Aquino Michelle King Matt Hill Donna Muncey Tom Waldman Dave Holmquist Lydia Ramos Mark Hovatter Steve Zipperman