intelligent prognostics tools and...
TRANSCRIPT

Intelligent prognostics tools and e-maintenance
Jay Lee a,*, Jun Ni b, Dragan Djurdjanovic b, Hai Qiu a, Haitao Liao c
a NSF Center for Intelligent Maintenance System, University of Cincinnati, USAb NSF Center for Intelligent Maintenance System, University of Michigan, USA
c Wichita University, USA
Accepted 9 February 2006
Abstract
In today’s global competitive marketplace, there is intense pressure for manufacturing industries to continuously reduce and eliminate costly,
unscheduled downtime and unexpected breakdowns. With the advent of Internet and tether-free technologies, companies necessitate dramatic
changes in transforming traditional ‘‘fail and fix (FAF)’’ maintenance practices to a ‘‘predict and prevent (PAP)’’ e-maintenance methodology. E-
maintenance addresses the fundamental needs of predictive intelligence tools to monitor the degradation rather than detecting the faults in a
networked environment and, ultimately to optimize asset utilization in the facility.
This paper introduces the emerging field of e-maintenance and its critical elements. Furthermore, performance assessment and prediction tools
are introduced for continuous assessment and prediction of a particular product’s performance, ultimately enable proactive maintenance to prevent
machine from breakdowns. Recent advances on intelligent prognostic technologies and tools are discussed. Several case studies are introduced to
validate these developed technologies and tools.
# 2006 Elsevier B.V. All rights reserved.
Keywords: E-maintenance; Prognostics; Predictive maintenance; Remote monitoring
www.elsevier.com/locate/compind
Computers in Industry 57 (2006) 476–489
1. Introduction
A lot of machine maintenance today is either reactive (fixing
or replacing equipment after it fails) or blindly proactive
(assuming a certain level of performance degradation, with no
input from the machinery itself, and servicing equipment on a
routine schedule whether service is actually needed or not).
Both scenarios are extremely wasteful. To human beings, it
often seems that machines fail suddenly, but in fact machines
usually go through a measurable process of degradation before
they fail. Today, that degradation is largely invisible to human
users, even though a great deal of technology has been
developed that could make such information visible. Many
sophisticated sensors and computerized components are
capable of delivering data about the machine’s status and
performance. The problem is that little or no practical use is
made of most of this data. We have smart devices, but we do not
have a continuous and seamless flow of information throughout
* Corresponding author.
E-mail address: [email protected] (J. Lee).
0166-3615/$ – see front matter # 2006 Elsevier B.V. All rights reserved.
doi:10.1016/j.compind.2006.02.014
entire processes. Sometimes this is because the available data
are not rendered in a useable form. More often, no
infrastructure exists for delivering the data over a network,
or for managing and analyzing the data even if the devices were
networked. When smart machines are networked and remotely
monitored, and when their data is modelled and continually
analyzed with sophisticated embedded systems, it is possible to
go beyond mere ‘‘predictive maintenance’’ to intelligent
‘‘prognostics’’. Intelligent prognostics is defined as a systema-
tic approach that can continuously track health degradation and
extrapolating temporal behaviour of health indicators to predict
risks of unacceptable behaviour over time as well as
pinpointing exactly which components of a machine are likely
to fail. Such continuous insight into present and future health of
machines and their components, as well as the information flow
infrastructure enable the move to e-maintenance based on
intelligent prognostics, where maintenance actions are syn-
chronized with the overall operation of the system as well as
with the necessary maintenance resources and spare parts. Such
synchronization of maintenance actions and information flow
infrastructure should enable autonomously triggering of
services and ordering of spare parts, yielding near-zero

J. Lee et al. / Computers in Industry 57 (2006) 476–489 477
downtime system operation through proactive, cost-effective
maintenance that is the least intrusive on the normal function of
the system [1,2]. The purpose of this paper is to present an
overview of the methods that enable the above-described
paradigm of intelligent prognostics and e-maintenance.
The rest of this paper is organized as follows. Section 2
offers a brief review of the research in the area of condition-
based maintenance. Section 3 outlines more recent achieve-
ments in development of predictive condition-monitoring tools
and intelligent maintenance decision making based on the use
of those tools. Several examples of real-life implementation of
predictive monitoring and intelligent maintenance decision-
making tools are enclosed in Section 4. Finally, Section 5
summarizes conclusions of this work and outlines guidelines
for possible future work.
2. Condition-based maintenance
Traditional reliability prediction is made based on failure
time data; meanwhile, maintenance actions are initiated in
terms of a reliability index. Usually such preventive
maintenance schemes as block-replacement and age-replace-
ment are time-based without considering the current health
state of the product, and thus are inefficient and less valuable for
a customer whose individual asset is of the utmost concern.
The major role of degradation analysis is to investigate the
evolution of the physical characteristics, or performance
measures, of a product leading up to its failure. A maintenance
scheme, referred to as condition-based maintenance (CBM), is
developed by considering current degradation and its evolution.
CBM methods and practices have continued to improve over
recent decades. For example, a major manufacturer of elevators
for high-rise buildings continuously monitors the braking
systems, and acceleration and deceleration of elevators globally
to meet high safety requirements. The main idea of CBM is to
utilize the product degradation information extracted and
identified from on-line sensing techniques to minimize the
system downtime by balancing the risk of failure and
achievable profits. The decision making in CBM focuses on
predictive maintenance. To do so, many diagnostic tools and
methods have been developed with much success. Sensor
fusion techniques are also commonly emploted due to the
inherent benefits in taking advantage of mutual information
from multiple sensors [3–5]. For example, vibration signature
analysis and oil analysis, because of their excellent capacity for
describing machine performance, have been successfully
employed for prognostics for a long time [6,7]. Alternative
approaches in using time/stress, temperature, acoustic emis-
sions [8], and ultrasonic are widely employed as well. However,
a major breakthrough has not been made in the development of
prognostics since many methods have remained based on
traditional signal processing methods [9].
In the recent technical literatures, a large variety of
prognostic applications have been reported, and many of these
were more application specific rather than generic. For
instance, the development of neural networks has added new
dimensions to solving existing problems in conducting
prognostics of a centrifugal pump case [10]. A comparison
of the results using the signal identification technique showed
various merits of neural nets including the ability to handle
multivariate wear parameters in a much shorter time. A
helicopter transmission prognostic application was presented
by Parker et al. [11], whereby fault detection, isolation, and
estimation were conducted by a polynomial neural network. A
fuzzy logic-based neural network and decision tree were
applied to the prediction of paper web breakage in a paper mill
[12]. Yet another prognostic application presented an integrated
prognosis system using a dynamically linked ellipsoidal basis
function neural network coupled with an automated rule
extractor to develop a tree-structured rule set that closely
approximates the classification of the neural network [13]. That
method allowed assessment of trending from the nominal class
to each of the identified fault classes, which means quantitative
prognostics were built into the network functionality. Garga
et al. [14] introduced a hybrid reasoning method for
prognostics, which integrated explicit domain knowledge
and machinery data. In this approach, a feed-forward neural
network was trained using explicit domain knowledge to get a
parsimonious representation of the explicit domain knowledge.
Some research activities in the infrastructure of prognostics
have also been reported. From 1998 to 2000, the U.S. army
logistics integration agency funded a project entitled, ‘‘Prog-
nostics Framework’’ [15]. The project aimed at providing an
overall architecture to manage the information provided by the
individual prognostic techniques. This prognostics framework is
generic and scalable, with an open architecture and horizontal
technology, which is intended to integrate with embedded
diagnostics to provide ‘‘total health management’’ capability.
Generally speaking, current prognostic approaches can be
classified into three basic groups: model-based prognostics,
data-driven prognostics, and hybrid prognostics. An example
of a characteristic model-based prognostics application
includes data collected from model-based simulations under
normal and degraded conditions. Prognostic models are
constructed based on different random load conditions, or
modes. However, in the absence of a reliable or accurate system
model, another approach to determine the remaining useful life
is to monitor the trajectory of a developing fault and predict the
amount of time until the developing fault reaches a
predetermined level requiring action, which is the so called
data-driven prognostic method. The alpha–beta–gamma track-
ing filter and the Kalman filter, two well-known tracking and
prediction tools, have been applied to gearbox prognostics
[16,17]. Both filters have been investigated for their ability to
track and smooth features from gearbox vibration data. The
literature presented additional discussions on using Kalman
filters to track changes in features like vibration levels, mode
frequencies, or other waveform signature features, and how to
estimate the future hazard rate, probability of survival, and
remaining useful life [18,19]. An example of a hybrid method,
which fuses the model-based information and sensor-based
information and takes advantage of both model- and data-
driven methods, was proposed by Hansen et al. [20], by which a
more reliable and accurate prognostic result can be generated.

J. Lee et al. / Computers in Industry 57 (2006) 476–489478
Fig. 1. Infotronics structure of IM systems.
Prognostic information obtained through intelligence
embedded into the manufacturing process or equipment can
also be used to improve the manufacturing and maintenance
operations in order to increase process reliability and improve
product quality. For instance, the ability to increase the reliability
of manufacturing facilities using awareness of the deterioration
levels of manufacturing equipment has been demonstrated
through an example of improving robot reliability [21].
Moreover, a life cycle unit (LCU) [22] was proposed to collect
usage information about key product components, enabling one
to assess product reusability and facilitating reuse of products
that have significant remaining useful life.
In spite of the progress made, many fundamental issues still
remain:
� M
ost of the developed prognostics approaches are applicationor equipment specific. A generic and scalable prognostic
methodology or toolbox does not exist;
� C
urrently, methods are generally focused on solving thefailure prediction problem. Tools for system performance
assessment and degradation prediction have not been well
addressed;
� F
eatures used for prognostics need to be further developed;� M
any developed prediction algorithms have been demon-strated only in a laboratory environment without industrial
validations.
To address these issues, a toolbox of algorithms for multi-
sensor performance assessment and prediction, named Watch-
dog AgentTM, has been developed at the Center for Intelligent
Maintenance Systems (IMS) which is a multi-campus NSF
Industry/University Cooperative Research Center between the
University of Cincinnati and the University of Michigan. These
tools enable one to quantitatively assess and predict perfor-
mance degradation levels of key product components [23–26],
thus offering the possibility of physically realizing closed-loop
product life cycle monitoring and management.
3. Development of predictive tools and intelligent
maintenance systems
Fig. 1 shows the system elements of ‘‘intelligent main-
tenance systems (IMS)’’. The key research elements of
intelligent maintenance systems consist of (1) transforming
data to information to knowledge and synchronizing decisions
with remote systems; (2) intelligent embedded prognostics
algorithms for performance degradation assessment and
prediction; (3) infotronics software and hardware platforms
that enable a product to think, link, reconfigure and sustain in a
networked and tether-free environment; (4) embedded product
services and life cycle information for closed-loop product
designs.
3.1. Smart prognostics algorithms (Watchdog AgentTM)
The Watchdog AgentTM bases its degradation assessment on
the readings from multiple sensors that measure critical
properties of the process, or machinery, that is being
considered. It is expected that the degradation process will
alter the sensor readings that are being fed into the Watchdog
AgentTM, and thus enable it to assess and quantify the
degradation through quantitatively describing the correspond-
ing change in sensor signatures. In addition, a model of the
process or piece of equipment that is being considered, or
specific knowledge available for the application can be used to
aid the degradation process description, provided that such a
model and/or such knowledge exists. The prognostic function
of the watchdog is realized through trending and statistical
modelling of the observed process performance signatures and/
or model parameters. This allows one to predict the future
behaviour of these patterns and thus forecast the behaviour of
the process, or piece of machinery that is being considered.
Furthermore, the Watchdog AgentTM also has the diagnostic
capabilities through memorizing the significant signature
patterns in order to recognize situations that have been

J. Lee et al. / Computers in Industry 57 (2006) 476–489 479
Fig. 2. Tools utilized for feature extraction, performance assessment, condition diagnosis, and performance prediction.
observed in the past, or be aware of the situation that was never
observed before. Thus, the Watchdog AgentTM has elements of
intelligent behaviour that enable it to answer the questions:
� W
hen the observed process, or equipment, is going to fail ordegrade to the point when its performance becomes
unacceptable?
� W
hy the performance of the observed process, or equipmentis degrading, or, in other words, what is the cause of the
observed process or machinery degradation?
The answer to the first question enables the prognostic
Watchdog function and the answer to the second question
enables its diagnostic function. The prognostic and diagnostic
outputs of Watchdogs mounted on all the processes and
machinery of interest are fed into the decision support tool
(DST) that addresses the question: what is the most critical
object, or process in the system with respect to maintenance, or
repair?
The answer to this question is obtained through taking into
account the risks of taking, or not taking, a maintenance action at
a given time, and then optimizing the costs associated with the
maintenance operation if the decision to perform maintenance is
made, or the cost of downtime and repair, if the maintenance is
omitted and the process, or the machine fails.
In order to facilitate the use of the Watchdog AgentTM in a
wide variety of applications, with various requirements and
limitations regarding the character of signals, available
processing power, memory and storage capabilities, limited
space, power consumption, personal user’s preference, etc., the
performance assessment module of the Watchdog AgentTM has
been realized in the form of a modular, open architecture
toolbox. A toolbox that consists of different prognostics tools
has been developed for predicting the degradation or
performance loss on devices, processes, and systems. The
algorithms include neural network-based, time series-based,
wavelet-based and hybrid joint time-frequency methods, etc.
Open architecture of the toolbox allows one to easily add new
solutions to the performance assessment modules as well as to
easily interchange different tools, depending on the application
needs. Fig. 2 summarizes the tools used for feature extraction,
performance assessment, condition diagnosis, and performance
prediction.
� S
ensory processing and feature extraction module transformssensor signals into domains that are most the revealing in
terms of the product’s performance and extracts features most
relevant to describing the product’s performance. Time series
analysis [27] or frequency domain analysis [28] could be used
to process stationary signals (signals with time invariant
frequency content), while wavelet [29], or joint time-
frequency domains [30] could be used to describe non-
stationary signals (signals with time-varying frequency
content).
� T
he features are extracted from the domain into whichsensory processing module transforms sensory signals, using
expert knowledge about the application, or automatic feature
selection methods such as roots of the autoregressive time
series model, or time-frequency moments and singular value
decomposition.
� Q
uantitative health assessment module evaluates the overlapbetween the most recently observed signatures and those
observed during normal product operation. This overlap is
expressed through the so-called confidence value (CV),
ranging between 0 and 1, with higher CVs signifying a high
overlap, and hence performance closer to normal. In case data
associated with some failure modes exists, most recent
performance signatures obtained through the signal proces-

J. Lee et al. / Computers in Industry 57 (2006) 476–489480
Fig. 3. Performance evaluation using confidence value (CV).
sing, feature extraction and sensor fusion modules can be
matched against signatures extracted from faulty behaviour
data.
Realization of the performance evaluation module
depends on the character of the application and extracted
performance signatures. If significant application expert
knowledge exists, simple but rapid performance assessment
based on the feature-level fused multi-sensor information can
be made using the relative number of activated cells in the
neural network, or using the logistic regression approach. For
open-control architecture products, the match between the
current and nominal control inputs and performance criteria
can also be utilized to assess the product’s performance. For
more sophisticated applications with intricate and compli-
cated signals and performance signatures, statistical pattern
recognition methods, or feature map-based approach are
employed. Over time, as new failure modes occur,
performance signatures related to each specific failure can
be collected and used to teach the Watchdog AgentTM to
recognize and diagnose that failure mode in the future. Thus,
the Watchdog AgentTM is can be seen as an intelligent device
that utilizes its experience and human supervisory inputs over
time to build its own expandable and adjustable world model.
� P
Fig. 4. Prognostics and performance forecasting.
erformance prediction module is aimed at extrapolating the
behaviour of process signatures over time and predicts their
behaviour in the future. Autoregressive moving average
(ARMA) [27] modelling and match matrix [38] methods are
used to forecast the performance behaviour. Fig. 4 shows the
concept of feature-based prognostics and diagnostics
methods explained in more detail in [37].
Performance assessment and prediction can be enhanced
through feature-level or decision-level sensor fusion, as defined
by the Joint Directors of Laboratories (JDL) standard of multi-
sensor data fusion [31], Chapter 2 [32]. Feature-level sensor
fusion is accomplished through concatenation of features
extracted from different sensors and joint consideration of the
concatenated feature vector in the performance assessment and
prediction modules. Decision-level sensor fusion is based on
separately assessing and predicting process performance from
individual sensor readings and then merging these individual
sensor inferences into a multi-sensor assessment and prediction
through some averaging technique.
Condition diagnosis module tells not only the level of
behavior degradation (the extent to which the newly arrived
signatures belong to the set of signatures describing the normal
system behavior), but also how close the system behavior is to
any of the previously observed faults (overlap between signatures
describing the most recent system behavior with those
characterizing each of the previously observed faults).This
matching allows the Watchdog Agent(R) to recognize and
forecast a specific faulty behavior, once a high match with the
failure associated signatures is assessed for the current process
signatures, or forecasted based on the current and past product’s
performance. Fig. 3 illustrates this signature matching process
for performance evaluation. Furthermore, this entire infrastruc-
ture for multi-sensor performance assessment and prediction
could be even further enhanced if Watchdog AgentTM are
embedded on identical products operating under similar
conditions could exchange information and thus assist each
other in building the world model. Furthermore, this commu-
nication can be used to benchmark the performance of ‘‘brother-
products’’ and thus rapidly and efficiently identify under-
performing units before they cause any serious damage and
losses. This paradigm of communication and benchmarking
between identical products operating in similar conditions is
referred to as the ‘‘peer-to-peer’’ (P2P) paradigm.
Fig. 5 illustrates the aforementioned Watchdog AgentTM
functionalities supported by the P2P communication and
benchmarking paradigm. A list of developed prognostics tools

J. Lee et al. / Computers in Industry 57 (2006) 476–489 481
Fig. 5. Peer-to-peer (P2P) functionalities of the intelligent Watchdog AgentTM.
and their capabilities are summarized in [37]. Many of these
algorithms have been validated on industry testbeds. These
works can be seen in the publication list.
Fig. 6 shows the results of predicting the behaviour of
machining process spindle load signatures using ARMA
modelling techniques. Load sensor readings from a boring
machine spindle have been remotely collected and processed
into joint time-frequency (TF) distributions. Performance
related signatures were extracted from the TF distributions
using the TF moments and principal component analysis [26].
Fig. 6. ARMA prediction of features extracte
ARMA modelling techniques were then utilized to predict the
behaviour of the extracted principal components, as indicated
in Fig. 6.
4. Implementation examples
Several Watchdog Agents for on-line performance assess-
ment, as well as intelligent maintenance decision-making tools,
have already been developed and implemented as standalone
applications in a number of industrial and service facilities.
d from the spindle load sensor readings.

J. Lee et al. / Computers in Industry 57 (2006) 476–489482
Fig. 7. Bearing test rig.
Below is a list of a few examples to illustrate the developed
tools.
4.1. Example 1: roller bearing performance prediction
Most bearing diagnostics research involves studying the
defective bearings recovered from the field, where the bearings
exhibit mature faults, or from simulated or ‘‘seeded’’ damage.
Experiments using defective bearings are less likely to help
discover natural defect propagation in the early stages. In order to
truly reflect the real defect propagation processes, bearing run-to-
failure tests were performed under normal load conditions on a
specially designed test rig supported by an industrial partner.
More details about this work can be found in [33].
The bearing test rig hosts four test bearings on one shaft.
Shaft rotation speed was kept constant at 2000 rpm. A radial
load of 6000 lbs is added to the shaft and bearing by a spring
mechanism. A magnetic plug installed in the oil feedback pipe
collects debris from the oil as evidence of bearing degradation.
The test stops when the accumulated debris adhered to the
magnetic plug exceeds a certain level.
Four double row bearings were installed on one shaft as
shown in Fig. 7. A high-sensitivity accelerometer was installed
on each bearing housing. Four thermocouples were attached to
the outer race of each bearing to record bearing temperature for
monitoring the lubrication purposes. Several sets of tests ending
with various failure modes were carried out. The time domain
feature shows that most of the bearing fatigue time is consumed
during the period of material accumulative damage, while the
period of crack propagation and development is relatively short.
Fig. 8. The vibration signal waveform of a faulty bearing.
This means that if the traditional threshold-based condition-
monitoring approach is used, the response time available for the
maintenance crew to respond prior to catastrophic failure after a
defect is detected in such bearings, is very short. A prognostic
approach that can detect the defect at the early stage is
demanded so that enough buffer time is available for
maintenance and logistical scheduling.
Fig. 8 presents the vibration waveform collected from
bearing 4 at the last stage of the bearing test. The signal exhibits
strong impulse periodicity because of the impacts generated by
a mature outer race defect. However, when examining the
historical data and observing the vibration signal 3 days before
the bearing failed, there is no sign of periodic impulse as shown
in Fig. 9(a). The periodic impulse feature is totally masked by
the noise.
An adaptive wavelet filter is designed to de-noise the raw
signal and increase the probability of degradation detection.
Fig. 9. The vibration waveform with early stage defect: (a) raw signal (b) de-
noised signal using the wavelet filter.

J. Lee et al. / Computers in Industry 57 (2006) 476–489 483
Fig. 10. Hazard rate prediction of bearing 3 in test 1.
Table 1
Estimates of expected remaining useful life — Test 1, bearing 3
Timea 26 29 31
Estimated expected remaining
useful lifea
3.5549 3.3965 1.5295
True remaining useful lifea 6.5278 3.5278 1.5278
Errora 2.9729 0.1313 0.0017
a In days.
The adaptive wavelet filter is yielded in two steps. At first, the
optimal wavelet shape factor is found by the minimal entropy
method, then the optimal scale is identified by maximizing the
signal periodicity. Applying the designed wavelet filter to the
noisy raw signal, the de-noised signal can be obtained as shown
in Fig. 9(b). The periodic impulse feature is, therefore,
revealed, which is strong evidence of bearing outer race
degradation. The wavelet filter-based de-noising method
successfully enhanced the signal feature and provided potent
evidence for prognostic decision-making.
An important issue in prognostic technology is to estimate the
risk of failure and the remaining useful life of a component given
the component’s age and its past and current operating
conditions. In numerous cases, failures can be attributed to
many correlated degradation processes, which could be reflected
by multiple degradation features extracted from sensor signals.
These features are the major source of information regarding the
health of the component under monitoring; however, the failure
boundary is hard to define using these features. In reality, the
same feature vector could be attributed to totally different
combinations of the underlying degradation processes and their
severity levels. In other words, the failure boundary is grey by
monitoring the degradation features. There is only a probabilistic
relationship between the component failure and certain levels of
degradation features. A typical example can be found during
bearing operation. Two bearings of the same type could fail at
different levels of RMS and Kurtosis of vibration signal. To
capture the probabilistic relationship between the multiple
degradation features and the component failure, as well as predict
the risk of failure and the remaining useful life, IMS has
developed a proportional hazards (PH) approach [34] based on
the PH model proposed by [39]. The PH model involving
multiple degradation features is given by
lðt; ZÞ ¼ l0ðtÞexpðb0ZÞ (1)
where lðt; ZÞ is the hazard rate of the component given the
current age t and degradation feature vector Z, l0(t) called the
baseline hazard rate function, and b is the model parameter
vector. This formulation relates the working age and multiple
degradation feature to the hazard rate of the component. To
estimate the parameters, a maximum probability approach
could be utilized using offline data, including the degradation
features over time of many components and their failure times.
Afterwards, the established model can be used for predicting
the risk of failure in regards to the component by plugging in the
working age and the degradation features extracted from the on-
line sensor signals. In addition, the remaining useful life
L(tcurrent) given the current working age and the history of
degradation features can be estimated by
LðtcurrentÞ �Z 1
tcurrent
exp
��Z t
tcurrent
lðv; zðvÞÞdv
�dt (2)
where zðvÞ is the predicted feature vector.
Consider the vibration data obtained from the signal
enhanced using the Morlet-wavelet filtering described above.
To facilitate on-line implementation, root-mean-square (RMS)
and Kurtosis are calculated and used as degradation features.
Fig. 10 shows the predicted hazard rate over time based on these
degradation features. This value can be utilized to trigger
maintenance when the risk level crosses a predetermined
threshold level. Table 1 provides the remaining useful life
predictions given the current bearing age and the feature
observations. The predictions are in accordance with the actual
life of the studied bearing (32.5278 days) with minor prediction
errors when the degradation progresses.
4.2. Example 2: industrial network fault detection
A large number of industrial network failures are attributed
to loose or degrading terminating resistors. This data set is from
an experiment done at the University of Michigan using a
controller area network (CAN) test set-up from an industrial
sponsor. Normal signals were acquired using a properly
functioning terminating resistor and then faulty signals were
created by removing one terminating resistor from the network.
The CAN signal is a logical differential signal, with a high and
low voltage component (Fig. 11). One way to detect a faulty
resistor in a network that emits this kind of signal is to measure
the overshoot and the signal-to-noise ratio of the logical 0’s and
1’s in the signal. Since the changes happen very quickly, the
signal must be sampled at a very high sampling rate. Here we
used a sampling rate of 20 MHz.
The overshoot is the percentage at which the signal goes
beyond the steady state value. The signal-to-noise ratio (SNR)

J. Lee et al. / Computers in Industry 57 (2006) 476–489484
Fig. 11. Time series data for CAN Network.
Fig. 12. Categorized normal and faulty signals.
is a measure of signal strength to background noise, usually
given in decibels. It was found that the overshoot value tended
to increase while the SNR decreased whenever system
resistance increased; for example, a terminating resistor is
removed. Fig. 12 shows how normal and faulty data can be
categorized by taking an average of the overshoot and signal-to-
noise ratio between the CAN high and CAN low signals.
For manipulation of the network data, we do not use the
frequency-based methods for feature extraction, instead the
overshoot and signal-to-noise ratio are used as expert extracted
features. These expert extracted features are taken from 10
normal and 10 faulty signals for training. Using these signals, it
is possible to use logistic regression to classify the 200
measured signals as normal or faulty. The data cannot be
successfully classified using statistical pattern recognition.
4.3. Example 3: maintenance scheduling using predictive
information about equipment condition
Discrete-event simulation and heuristic optimization can be
utilized for strategic scheduling of maintenance operations that
are the least intrusive on the normal production operation in a
manufacturing system, as suggested in [35]. In this paper, the
cost effectiveness of many maintenance schedules were
evaluated based on predicted probabilities of equipment
failures over time, obtained from predictive condition-based
algorithms, such as those described in [37]. The impact of
equipment failures and maintenance operations was assessed
through discrete-event simulations and a GA-based search
algorithm was suggested to search for maintenance schedules
with highest corresponding average cost-benefits. The follow-
ing is a short description of an example given in [35] where
Fig. 13. Manufacturing system used for evalua
advantages of the newly proposed maintenance scheduling
method over more traditional methods are demonstrated. This
method is also being used for maintenance decision-evaluation
and -making by a major automotive manufacturer.
Three types of maintenance strategies have been simulated
and compared with the maintenance schedule obtained using
the method from [35], where the predictive information about
equipment condition-based is used to maximize average cost-
benefits of the maintenance using discrete-event simulations
and a GA-based search. The four maintenance strategies
considered in this example were:
� C
tio
orrective maintenance strategy, which uses the simple first-
come–first-serve scheme in which the maintenance is
performed whenever there is a machine failure and there is
a maintenance person available. If any of the two conditions
is not satisfied, the machine will remain in a failed mode, not
producing anything. This maintenance strategy will be
referred to as ‘Strategy A’;
� S
cheduled maintenance strategy, in which maintenance isperformed in regular time intervals. This strategy will be
referred to as ‘Strategy B’;
� C
ondition-based maintenance, in which maintenance crewspossess information about the current condition of the
equipment. Thus, instead of waiting for machine failure, it is
assumed that user-defined thresholds are set on the
degradation level of any given machine to trigger main-
tenance operations. It is different from purely reactive
maintenance in the sense that condition-based information
enables a portion of the maintenance action to be done as
scheduled maintenance-before equipment failure actually
happens. This strategy will be referred to as ‘Strategy C’;
n and benchmarking of strategies A–D.
J. Lee et al. / Computers in Industry 57 (2006) 476–489 485
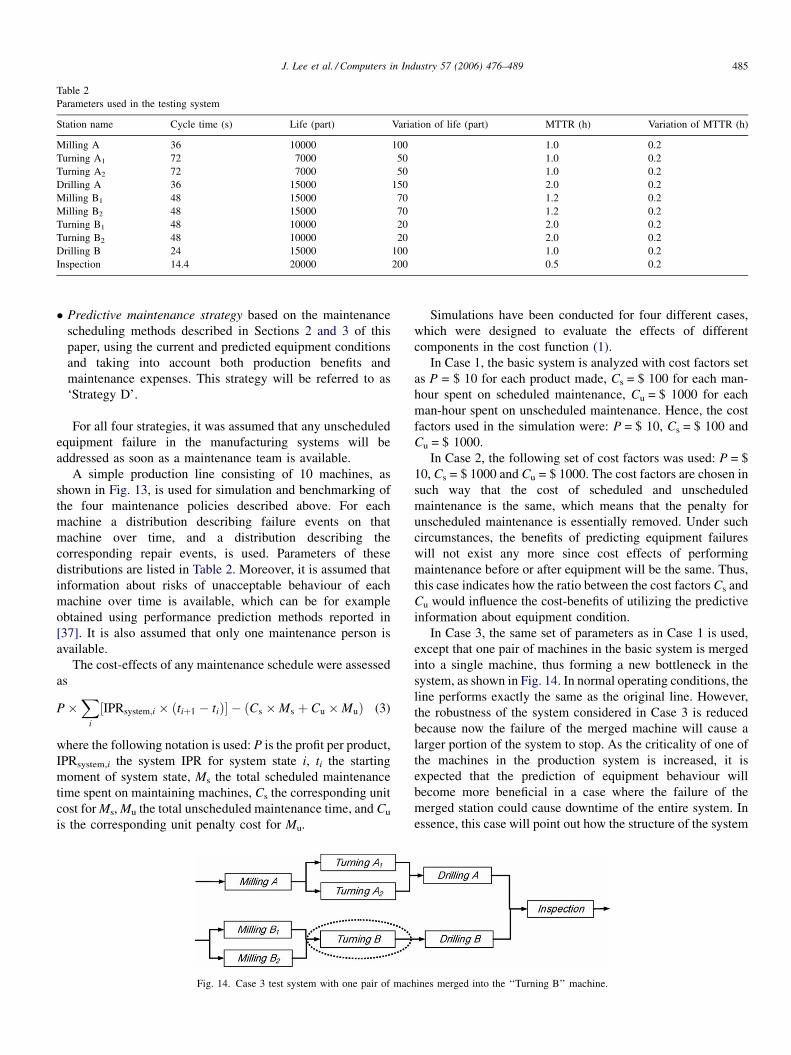
Table 2
Parameters used in the testing system
Station name Cycle time (s) Life (part) Variation of life (part) MTTR (h) Variation of MTTR (h)
Milling A 36 10000 100 1.0 0.2
Turning A1 72 7000 50 1.0 0.2
Turning A2 72 7000 50 1.0 0.2
Drilling A 36 15000 150 2.0 0.2
Milling B1 48 15000 70 1.2 0.2
Milling B2 48 15000 70 1.2 0.2
Turning B1 48 10000 20 2.0 0.2
Turning B2 48 10000 20 2.0 0.2
Drilling B 24 15000 100 1.0 0.2
Inspection 14.4 20000 200 0.5 0.2
� P
redictive maintenance strategy based on the maintenancescheduling methods described in Sections 2 and 3 of this
paper, using the current and predicted equipment conditions
and taking into account both production benefits and
maintenance expenses. This strategy will be referred to as
‘Strategy D’.
For all four strategies, it was assumed that any unscheduled
equipment failure in the manufacturing systems will be
addressed as soon as a maintenance team is available.
A simple production line consisting of 10 machines, as
shown in Fig. 13, is used for simulation and benchmarking of
the four maintenance policies described above. For each
machine a distribution describing failure events on that
machine over time, and a distribution describing the
corresponding repair events, is used. Parameters of these
distributions are listed in Table 2. Moreover, it is assumed that
information about risks of unacceptable behaviour of each
machine over time is available, which can be for example
obtained using performance prediction methods reported in
[37]. It is also assumed that only one maintenance person is
available.
The cost-effects of any maintenance schedule were assessed
as
P�X
i
½IPRsystem;i � ðtiþ1 � tiÞ� � ðCs �Ms þ Cu �MuÞ (3)
where the following notation is used: P is the profit per product,
IPRsystem,i the system IPR for system state i, ti the starting
moment of system state, Ms the total scheduled maintenance
time spent on maintaining machines, Cs the corresponding unit
cost for Ms, Mu the total unscheduled maintenance time, and Cu
is the corresponding unit penalty cost for Mu.
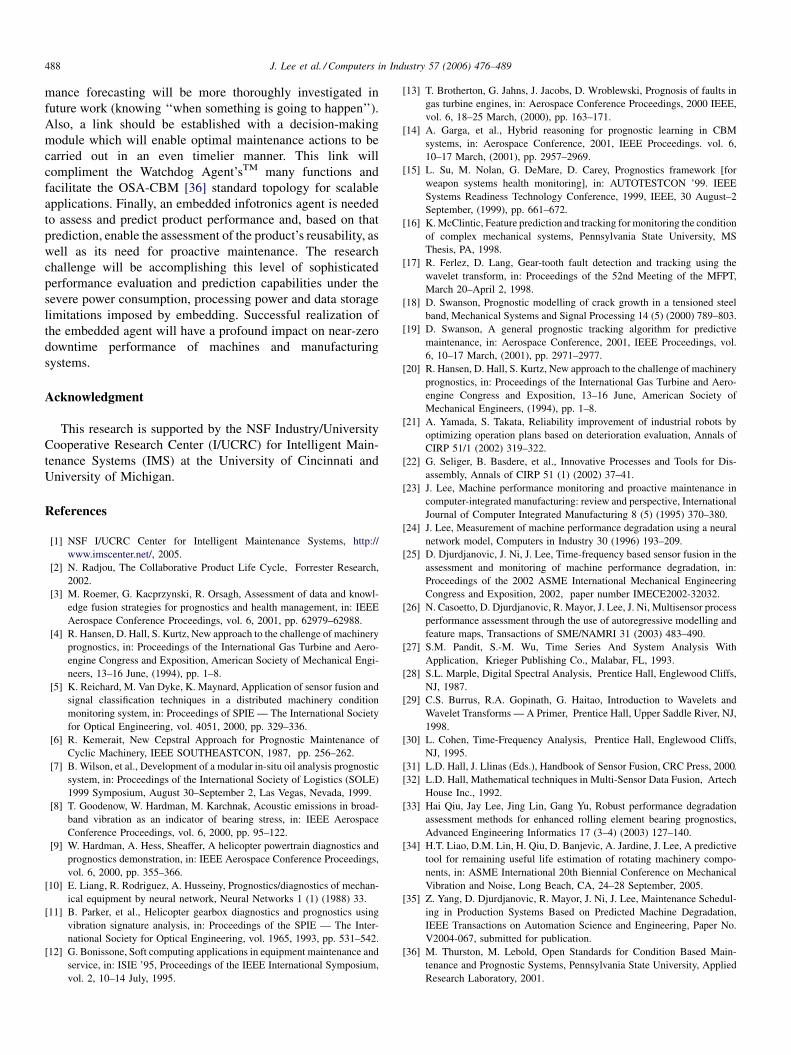
Fig. 14. Case 3 test system with one pair of mac
Simulations have been conducted for four different cases,
which were designed to evaluate the effects of different
components in the cost function (1).
In Case 1, the basic system is analyzed with cost factors set
as P = $ 10 for each product made, Cs = $ 100 for each man-
hour spent on scheduled maintenance, Cu = $ 1000 for each
man-hour spent on unscheduled maintenance. Hence, the cost
factors used in the simulation were: P = $ 10, Cs = $ 100 and
Cu = $ 1000.
In Case 2, the following set of cost factors was used: P = $
10, Cs = $ 1000 and Cu = $ 1000. The cost factors are chosen in
such way that the cost of scheduled and unscheduled
maintenance is the same, which means that the penalty for
unscheduled maintenance is essentially removed. Under such
circumstances, the benefits of predicting equipment failures
will not exist any more since cost effects of performing
maintenance before or after equipment will be the same. Thus,
this case indicates how the ratio between the cost factors Cs and
Cu would influence the cost-benefits of utilizing the predictive
information about equipment condition.
In Case 3, the same set of parameters as in Case 1 is used,
except that one pair of machines in the basic system is merged
into a single machine, thus forming a new bottleneck in the
system, as shown in Fig. 14. In normal operating conditions, the
line performs exactly the same as the original line. However,
the robustness of the system considered in Case 3 is reduced
because now the failure of the merged machine will cause a
larger portion of the system to stop. As the criticality of one of
the machines in the production system is increased, it is
expected that the prediction of equipment behaviour will
become more beneficial in a case where the failure of the
merged station could cause downtime of the entire system. In
essence, this case will point out how the structure of the system
hines merged into the ‘‘Turning B’’ machine.

J. Lee et al. / Computers in Industry 57 (2006) 476–489486
Table 3
Comparison of maintenance strategies A–D in Case 1
Type Scheduled maint. (H) Unscheduled maint. (H) Produced part Effective gain Improvement
(%)Mean S.D. Mean S.D. Mean S.D. Mean ($) S.D. ($)
Strategy A 0.00 0.00 7.33 1.00 3016.16 267.56 22833 3429
Strategy B 2.68 1.12 6.01 1.34 2848.88 165.25 22214 2280 �2.71
Strategy C 6.76 2.35 2.78 1.63 2880.58 240.07 25346 3069 11.01
Strategy D 5.58 1.04 2.81 1.24 3315.39 144.30 29787 2285 30.46
affects the cost-benefits of utilizing the predictive information
about the equipment’s condition.
In Case 4, the same set of parameters as in Case 1 are used,
except that unscheduled maintenance takes 50% more time to
finish than the same maintenance performed according to the
schedule, meaning that more maintenance time is needed for
unscheduled events. This Case is constructed in order to
demonstrate the effects of downtime on the system-level
benefits of various maintenance schedules. It is expected that
prediction of equipment performance and elimination of
unscheduled maintenance events through maintenance sche-
dules provided by the newly proposed Strategy D will yield
more prominent system-level benefits in this case.
From the results of the first test case given in Table 3, it is
noticeable that an improvement in the overall cost-benefits
can be achieved using the GA optimized maintenance
scheduling ‘Strategy D’. With ‘Strategy B’, some main-
tenance is done as scheduled work to prevent machine
failures. However, the fixed length of the time interval
between two successive maintenance tasks on one machine
does not always match the actual machine life. Thus,
maintenance is either done too early, when there is still
remaining useful life in the equipment, or too late, after
failure already occurs and maintenance is performed as an
unscheduled task. Thus, the corresponding cost effects of
maintenance are characterized by high-cost maintenance and
reduced overall gain expressed by Eq. (1). In ‘Strategy C’,
more scheduled maintenance occurs, due to the direct use of
machine conditions as indicators of imminent machine
failure. Shorter and more flexible maintenance intervals on
each machine increase the overall maintenance time, but
results in fewer unscheduled maintenance events. Thus, it
achieves a higher profit than the purely reactive ‘Strategy A’
or ‘Strategy B’ characterized by fixed schedules. As for
‘Strategy D’, the corresponding increase of productivity is
even bigger. Even though the overall maintenance time and
Table 4
Comparison of maintenance strategies A–D in Case 2
Type Scheduled maint. (H) Unscheduled maint. (H) P
Mean S.D. Mean S.D. M
Strategy A 0.00 0.00 7.28 0.78 3
Strategy B 2.75 1.25 5.50 1.31 2
Strategy C 6.99 2.67 2.85 1.97 2
Strategy D 1.27 1.10 6.19 1.26 3
P = $ 10, cm = $ 1000, Ci = $ 1000.
unscheduled maintenance time both increased, the schedule
of the maintenance is arranged in such a way that the system
productivity grew, which proved to be more than enough to
compensate for the increased maintenance cost.
In Case 2, the cost factors are changed so that the costs for
scheduled maintenance and unscheduled maintenance are the
same. As can be seen in Table 4, both ‘Strategy B’ and ‘Strategy
C’ achieved lower system gain than the purely reactive
‘Strategy A’. Removing the cost penalty on unscheduled
maintenance resulted in no benefits in performing any
maintenance action before machine breakdowns actually
happen. Then, the cost-benefits associated with any main-
tenance schedule are determined only by the system
productivity and overall maintenance time. The increased
maintenance activities in both ‘Strategy B’ and ‘Strategy C’
reduce the system productivity relative to the one correspond-
ing to ‘Strategy A’, thus causing the corresponding profits to be
decreased. In this extreme case, the benefits of using ‘Strategy
D’ are non-existent since there is no benefit in performing
scheduled rather than unscheduled maintenance.
In Case 3, two identical machines working in parallel in the
original configuration (identified as Turnings B1 and B2 in
Fig. 8), are merged into one machine (identified as Turning B in
Fig. 9). Obviously, the Turning B machine from Case 3 is more
critical in the new system than the original two machines were
in the original system from Case 1 because when it fails, a
larger portion of the production system is down, and the
production losses are higher (essentially, machine Turning B is
a local bottleneck in the system considered in Case 3). The
maintenance schedule offered by the newly proposed ‘Strategy
D’ calls for timely maintenance based on the predicted
equipment conditions, while avoiding excessive usage of
maintenance resources by eliminating schedules that call for
excessive maintenance, and thus resulting in low system-level
cost-benefits as defined by Eq. (1) that do not propagate through
the GA-based optimization procedure. Thus, the overall profit it
roduced part Effective gain Improvement
(%)ean S.D. Mean (%) S.D. (%)
135.24 185.35 24067 2255
885.03 164.26 20595 1861 �14.43
896.69 226.90 19125 3671 �20.53
221.34 216.13 24745 3018 2.82

J. Lee et al. / Computers in Industry 57 (2006) 476–489 487
Table 5
Comparison of maintenance strategies A–D in Case 3
Type Scheduled maint. (H) Unscheduled maint. (H) Produced part Effective gain Improvement
(%)Mean S.D. Mean S.D. Mean S.D. Mean ($) S.D. ($)
Strategy A 0.00 0.00 6.42 1.20 1670.95 171.26 10288 2582
Strategy B 0.85 0.85 5.40 1.04 1684.30 99.00 11361 1500 10.43
Strategy C 5.53 2.27 2.11 1.66 1607.05 163.96 13407 2439 30.32
Strategy D 6.68 0.77 2.43 1.11 1751.04 92.53 14410 1923 40.07
Table 6
Comparison of maintenance strategies A–D in Case 1
Type Scheduled maint. (H) Unscheduled maint. (H) Produced part Effective gain Improvement
(%)Mean S.D. Mean S.D. Mean S.D. Mean ($) S.D. ($)
Strategy A 0.00 0.00 10.90 1.07 2634.86 350.01 15451 4006
Strategy B 1.86 1.11 9.05 1.87 2644.84 216.68 17212 3416 11.39
Strategy C 6.44 2.42 4.21 1.83 2797.37 311.63 23118 3579 49.61
Strategy D 5.52 1.32 4.31 2.18 3099.46 248.77 26135 4278 69.14
Fig. 15. Relative profit chart between maintenance strategies for the four test cases.
made exceeded all other strategies, as illustrated in Table 5.
Furthermore, due to the existence of the more critical Turning B
machine, the benefits of avoiding the costly downtime
increased even more, which resulted in an increase in
system-level cost-benefits associated with the maintenance
‘Strategy D’, as compared to the corresponding benefits
observed in Case 1.
In Case 4, the increased time needed for unscheduled tasks
implied that unscheduled maintenance tasks would involve
more machine downtime and thus effectively increases the
detrimental costs associated with unscheduled maintenance
that takes place after equipment failures occur. The main-
tenance schedule offered by ‘Strategy D’ showed the ability of
the newly proposed maintenance scheduling method to avoid
unscheduled downtime and thus achieve high system-level
cost-benefits, as defined by Eq. (1). Furthermore, since the
impact of unscheduled downtime was increased in this case, the
cost-benefits of utilizing the maintenance schedule offered by
the newly proposed scheduling ‘Strategy D’ improved even
more dramatically compared to the improvement observed in
Case 1, as can be seen in Table 6 (the cost-benefits increased by
as much as 69% over the corrective ‘Strategy A’, while in Case
1 the corresponding improvement was 30.5%).
Relative effects of the four maintenance strategies for the
four test cases are shown in Fig. 15. In each Case, the cost-
benefits for corrective ‘Strategy A’ are set to 100%. One can
conclude from these results that overall production profits, due
to lower maintenance costs, can be increased through the
implementation of this proposed method. Furthermore, the
more critical the unscheduled system downtime and main-
tenance are, the higher the benefits associated with utilizing this
newly proposed method will be.
5. Conclusions and future work
The Watchdog AgentTM is a tool for multi-sensor assessment
and prediction of a machine’s or process’s performance. This
tool can be utilized to realize predictive condition-based
maintenance as well as to identify the components that possess
significant remaining useful life that could be efficiently and
cost-effectively disassembled and reused. A wide variety uses
for the Watchdog AgentTM have been devised to address many
applications of a different nature, with different levels of
complexity and criticality. Even though preliminary results for
autoregressive moving average (ARMA) modelling-based
behaviour prognostics have already been obtained, perfor-
J. Lee et al. / Computers in Industry 57 (2006) 476–489488
mance forecasting will be more thoroughly investigated in
future work (knowing ‘‘when something is going to happen’’).
Also, a link should be established with a decision-making
module which will enable optimal maintenance actions to be
carried out in an even timelier manner. This link will
compliment the Watchdog Agent’sTM many functions and
facilitate the OSA-CBM [36] standard topology for scalable
applications. Finally, an embedded infotronics agent is needed
to assess and predict product performance and, based on that
prediction, enable the assessment of the product’s reusability, as
well as its need for proactive maintenance. The research
challenge will be accomplishing this level of sophisticated
performance evaluation and prediction capabilities under the
severe power consumption, processing power and data storage
limitations imposed by embedding. Successful realization of
the embedded agent will have a profound impact on near-zero
downtime performance of machines and manufacturing
systems.
Acknowledgment
This research is supported by the NSF Industry/University
Cooperative Research Center (I/UCRC) for Intelligent Main-
tenance Systems (IMS) at the University of Cincinnati and
University of Michigan.
References
[1] NSF I/UCRC Center for Intelligent Maintenance Systems, http://
www.imscenter.net/, 2005.
[2] N. Radjou, The Collaborative Product Life Cycle, Forrester Research,
2002.
[3] M. Roemer, G. Kacprzynski, R. Orsagh, Assessment of data and knowl-
edge fusion strategies for prognostics and health management, in: IEEE
Aerospace Conference Proceedings, vol. 6, 2001, pp. 62979–62988.
[4] R. Hansen, D. Hall, S. Kurtz, New approach to the challenge of machinery
prognostics, in: Proceedings of the International Gas Turbine and Aero-
engine Congress and Exposition, American Society of Mechanical Engi-
neers, 13–16 June, (1994), pp. 1–8.
[5] K. Reichard, M. Van Dyke, K. Maynard, Application of sensor fusion and
signal classification techniques in a distributed machinery condition
monitoring system, in: Proceedings of SPIE — The International Society
for Optical Engineering, vol. 4051, 2000, pp. 329–336.
[6] R. Kemerait, New Cepstral Approach for Prognostic Maintenance of
Cyclic Machinery, IEEE SOUTHEASTCON, 1987, pp. 256–262.
[7] B. Wilson, et al., Development of a modular in-situ oil analysis prognostic
system, in: Proceedings of the International Society of Logistics (SOLE)
1999 Symposium, August 30–September 2, Las Vegas, Nevada, 1999.
[8] T. Goodenow, W. Hardman, M. Karchnak, Acoustic emissions in broad-
band vibration as an indicator of bearing stress, in: IEEE Aerospace
Conference Proceedings, vol. 6, 2000, pp. 95–122.
[9] W. Hardman, A. Hess, Sheaffer, A helicopter powertrain diagnostics and
prognostics demonstration, in: IEEE Aerospace Conference Proceedings,
vol. 6, 2000, pp. 355–366.
[10] E. Liang, R. Rodriguez, A. Husseiny, Prognostics/diagnostics of mechan-
ical equipment by neural network, Neural Networks 1 (1) (1988) 33.
[11] B. Parker, et al., Helicopter gearbox diagnostics and prognostics using
vibration signature analysis, in: Proceedings of the SPIE — The Inter-
national Society for Optical Engineering, vol. 1965, 1993, pp. 531–542.
[12] G. Bonissone, Soft computing applications in equipment maintenance and
service, in: ISIE ’95, Proceedings of the IEEE International Symposium,
vol. 2, 10–14 July, 1995.
[13] T. Brotherton, G. Jahns, J. Jacobs, D. Wroblewski, Prognosis of faults in
gas turbine engines, in: Aerospace Conference Proceedings, 2000 IEEE,
vol. 6, 18–25 March, (2000), pp. 163–171.
[14] A. Garga, et al., Hybrid reasoning for prognostic learning in CBM
systems, in: Aerospace Conference, 2001, IEEE Proceedings. vol. 6,
10–17 March, (2001), pp. 2957–2969.
[15] L. Su, M. Nolan, G. DeMare, D. Carey, Prognostics framework [for
weapon systems health monitoring], in: AUTOTESTCON ’99. IEEE
Systems Readiness Technology Conference, 1999, IEEE, 30 August–2
September, (1999), pp. 661–672.
[16] K. McClintic, Feature prediction and tracking for monitoring the condition
of complex mechanical systems, Pennsylvania State University, MS
Thesis, PA, 1998.
[17] R. Ferlez, D. Lang, Gear-tooth fault detection and tracking using the
wavelet transform, in: Proceedings of the 52nd Meeting of the MFPT,
March 20–April 2, 1998.
[18] D. Swanson, Prognostic modelling of crack growth in a tensioned steel
band, Mechanical Systems and Signal Processing 14 (5) (2000) 789–803.
[19] D. Swanson, A general prognostic tracking algorithm for predictive
maintenance, in: Aerospace Conference, 2001, IEEE Proceedings, vol.
6, 10–17 March, (2001), pp. 2971–2977.
[20] R. Hansen, D. Hall, S. Kurtz, New approach to the challenge of machinery
prognostics, in: Proceedings of the International Gas Turbine and Aero-
engine Congress and Exposition, 13–16 June, American Society of
Mechanical Engineers, (1994), pp. 1–8.
[21] A. Yamada, S. Takata, Reliability improvement of industrial robots by
optimizing operation plans based on deterioration evaluation, Annals of
CIRP 51/1 (2002) 319–322.
[22] G. Seliger, B. Basdere, et al., Innovative Processes and Tools for Dis-
assembly, Annals of CIRP 51 (1) (2002) 37–41.
[23] J. Lee, Machine performance monitoring and proactive maintenance in
computer-integrated manufacturing: review and perspective, International
Journal of Computer Integrated Manufacturing 8 (5) (1995) 370–380.
[24] J. Lee, Measurement of machine performance degradation using a neural
network model, Computers in Industry 30 (1996) 193–209.
[25] D. Djurdjanovic, J. Ni, J. Lee, Time-frequency based sensor fusion in the
assessment and monitoring of machine performance degradation, in:
Proceedings of the 2002 ASME International Mechanical Engineering
Congress and Exposition, 2002, paper number IMECE2002-32032.
[26] N. Casoetto, D. Djurdjanovic, R. Mayor, J. Lee, J. Ni, Multisensor process
performance assessment through the use of autoregressive modelling and
feature maps, Transactions of SME/NAMRI 31 (2003) 483–490.
[27] S.M. Pandit, S.-M. Wu, Time Series And System Analysis With
Application, Krieger Publishing Co., Malabar, FL, 1993.
[28] S.L. Marple, Digital Spectral Analysis, Prentice Hall, Englewood Cliffs,
NJ, 1987.
[29] C.S. Burrus, R.A. Gopinath, G. Haitao, Introduction to Wavelets and
Wavelet Transforms — A Primer, Prentice Hall, Upper Saddle River, NJ,
1998.
[30] L. Cohen, Time-Frequency Analysis, Prentice Hall, Englewood Cliffs,
NJ, 1995.
[31] L.D. Hall, J. Llinas (Eds.), Handbook of Sensor Fusion, CRC Press, 2000.
[32] L.D. Hall, Mathematical techniques in Multi-Sensor Data Fusion, Artech
House Inc., 1992.
[33] Hai Qiu, Jay Lee, Jing Lin, Gang Yu, Robust performance degradation
assessment methods for enhanced rolling element bearing prognostics,
Advanced Engineering Informatics 17 (3–4) (2003) 127–140.
[34] H.T. Liao, D.M. Lin, H. Qiu, D. Banjevic, A. Jardine, J. Lee, A predictive
tool for remaining useful life estimation of rotating machinery compo-
nents, in: ASME International 20th Biennial Conference on Mechanical
Vibration and Noise, Long Beach, CA, 24–28 September, 2005.
[35] Z. Yang, D. Djurdjanovic, R. Mayor, J. Ni, J. Lee, Maintenance Schedul-
ing in Production Systems Based on Predicted Machine Degradation,
IEEE Transactions on Automation Science and Engineering, Paper No.
V2004-067, submitted for publication.
[36] M. Thurston, M. Lebold, Open Standards for Condition Based Main-
tenance and Prognostic Systems, Pennsylvania State University, Applied
Research Laboratory, 2001.

J. Lee et al. / Computers in Industry 57 (2006) 476–489 489
[37] D. Djurdjanovic, J. Lee, J. Ni, Watchdog agent — an infotronics-based
prognostics approach for product performance degradation assessment
and prediction, special issue on intelligent maintenance systems, Engi-
neering Informatics Journal (formerly AI in Engineering) 17 (3–4) (2003)
107–189.
[38] J. Liu, D. Djurdjanovic, J. Ni, J. Lee, Performance similarity based method
for enhanced prediction of manufacturing process performance, in: Pro-
ceedings of the 2004 ASME International Mechanical Engineering Con-
gress and Exposition (IMECE), 2004, Paper No. IMECE2004-62246.
[39] D.R. Cox, Regression models and life tables, J. Royal Stat. Soc. Ser. B 34
(1972) 187–220.
Dr. Jay Lee is Ohio Eminent Scholar and L.W. Scott
Alter Chair Professor in Advanced Manufacturing at
the University of Cincinnati. Previously, he held a
position as Wisconsin Distinguished Professor and
Rockwell Automation Professor at the University of
Wisconsin-Milwaukee and is founding director of
National Science Foundation (NSF) Industry/Uni-
versity Cooperative Research Center (I/UCRC) on
Intelligent Maintenance Systems (IMS) which is a
multi-campus NSF Center of Excellence between the
University of Cincinnati (lead institution), the University of Michigan, and the
University of Missouri-Rolla. His current research focuses on smart infotronics-
based prognostics technologies including predictive machine degradation
assessment, remote monitoring, embedded prognostics, and self-maintenance
systems. Currently, he serves as member of Board on Manufacturing and
Engineering Design (BMAED) of National Research Council (NRC)/National
Academy of Engineering. Dr. Lee received his BS degree from Taiwan, a MS in
Mechanical Engineering from the University of Wisconsin-Madison, a MS in
Industrial Management from the State University of New York at Stony Brook,
and DSc in Mechanical Engineering from the George Washington University.
He received Milwaukee Mayor Technology Award in 2003 and was a recipient
of SME Outstanding Young Manufacturing Engineering Award in 1992. He is
also a Fellow of ASME and SME.
Dr. Jun Ni is currently a professor in the department
of mechanical engineering at the University of
Michigan, USA. He is the director of the S.M. Wu
Manufacturing Research Center. He also serves as
the deputy director of a National Science Foundation
sponsored Engineering Research Center for Reconfigurable Machining Sys-
tems, and the co-director of a National Science Foundation sponsored Industry/
University Cooperative Research Center for Intelligent Maintenance Systems.
Prof. Ni’s research and teaching interests are in the area of manufacturing
science and engineering, with special focuses on precision machining, man-
ufacturing process modelling and control, statistical quality design and
improvement, micro/meso systems and manufacturing processes, and intelli-
gent monitoring, maintenance and service systems.
Dragan Djurdjanovic obtained his B.S. in Mechan-
ical Engineering and in Applied Mathematics in
1997 from the University of Nis, Yugoslavia, his
M.Eng. in Mechanical Engineering from the
Nanyang Technological University, Singapore in
1999, and his M.S. in Electrical Engineering (Sys-
tems) and Ph.D. in Mechanical Engineering in 2002
from the University of Michigan, Ann Arbor. His
research interests include quality control, intelligent
proactive maintenance techniques and applications
of advanced signal processing in biomedical engineering. He co-authored 40
journal and conference publications and is the recipient of several prizes and
awards, including the 2006 Outstanding Young Manufacturing Engineer Award
from the Society of Manufacturing Engineers (SME), Nomination for the
Distinguished Ph.D. Thesis from the Department of Mechanical Engineering,
University of Michigan in 2002, and The Outstanding Paper Award at 2001
SME North American Manufacturing Research Conference.
Dr. Hai Qiu is a Research Scientist in the GE Global
Research at Niskayuna, New York. Prior to join GE,
he was a Research Assistant Professor in the
Mechanical, Industrial and Nuclear Engineering
Department of the University of Cincinnati and
served as the Lead Researcher of the NSF Indus-
trial/University Cooperative Research Center for
Intelligent Maintenance Systems (IMS). He obtained
his Bachelor and Ph.D. degree in mechanical engi-
neering from the Xi’an Jiaotong University in 1995
and 1999, respectively. He has been involved in the areas of prognostics and
intelligent maintenance systems research for 9 years. His current research areas
include vibration analysis, intelligent diagnostic and prognostics, remote
monitoring and intelligent maintenance systems.