intelligent compaction for soils, subbase, & stabilized ... · intelligent compaction for...
TRANSCRIPT
TRB IC Workshop
Intelligent Compaction for Soils, Subbase, & Stabilized Base Field Demo Results - 1
Intelligent Compaction for Soils, Intelligent Compaction for Soils, Subbase, & Stabilized BaseSubbase, & Stabilized Base
Field Demo ResultsField Demo Results
ByByDavid J. White, Ph.D.David J. White, Ph.D.
Iowa State UniversityIowa State UniversityEarthworks Engineering Research Center (EERC)Earthworks Engineering Research Center (EERC)
FHWA/IC TeamFHWA/IC Team
MN
KS
TXMS
IN
NY
PA
VA
MD
ND
GA
WI
200820092010
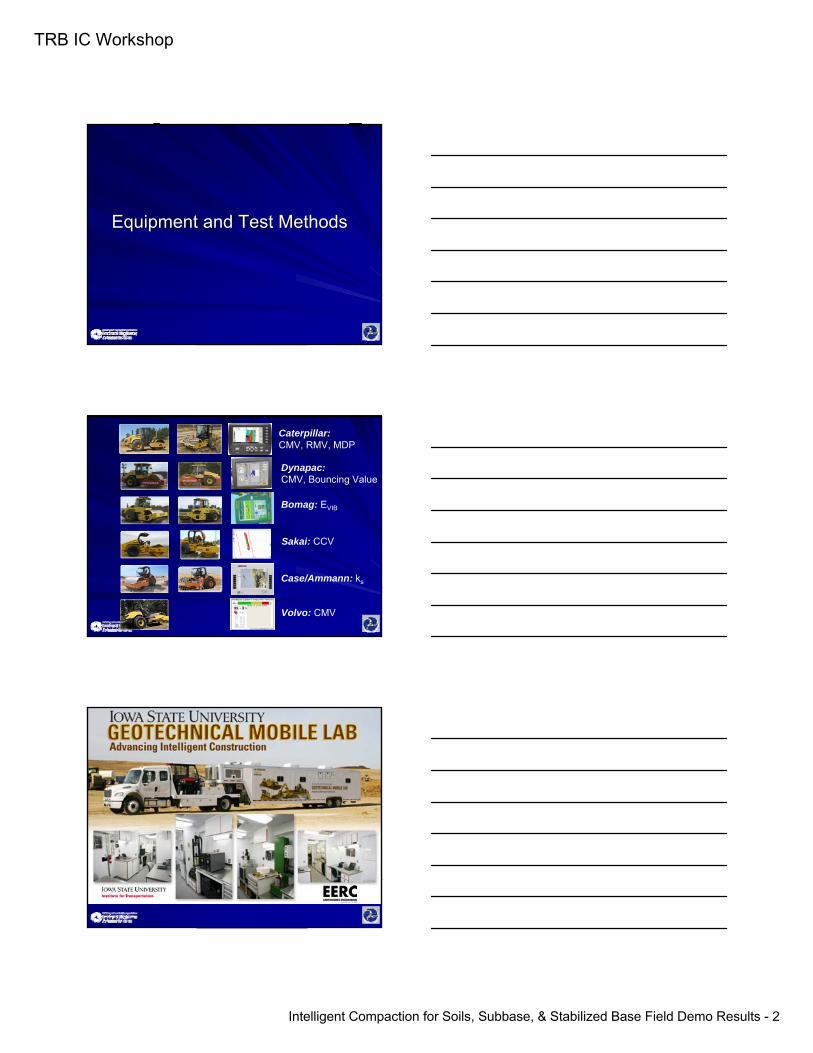
IC Field Demo Schedule
IC Field Demo for Soils/SB/STB
State Dates Materials Rollers
TX July, 2008 Cohesive Soils, SB, STB
Case/AmmannDynapac
KS Aug, 2008 Cohesive Soils SakaiCaterpillar
NY May, 2009 Incohesive Soils, SB
BomagCaterpillar
MS July, 2009 STB Case/AmmannCaterpillar
TRB IC Workshop
Intelligent Compaction for Soils, Subbase, & Stabilized Base Field Demo Results - 2
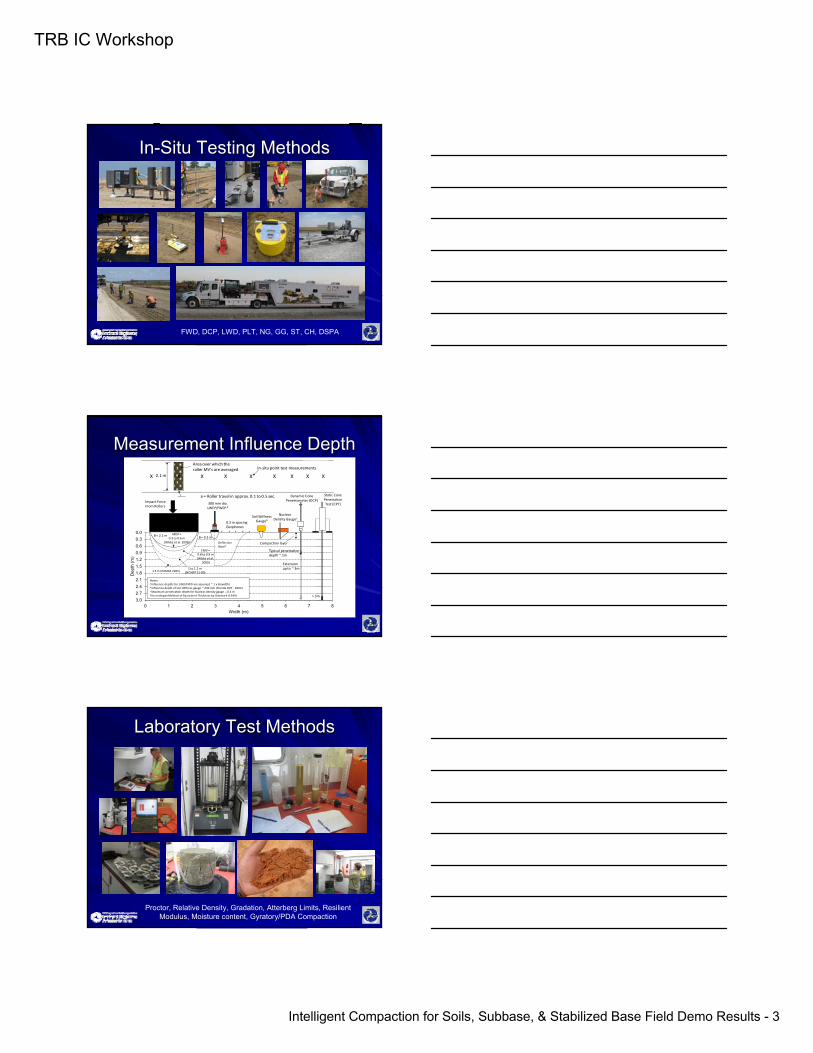
Equipment and Test MethodsEquipment and Test Methods
Caterpillar:CMV, RMV, MDP
Dynapac: CMV, Bouncing Value
Bomag: EVIB
Sakai: CCV
Case/Ammann: ks
Volvo: CMV
TRB IC Workshop
Intelligent Compaction for Soils, Subbase, & Stabilized Base Field Demo Results - 3
InIn--Situ Testing MethodsSitu Testing Methods
FWD, DCP, LWD, PLT, NG, GG, ST, CH, DSPA
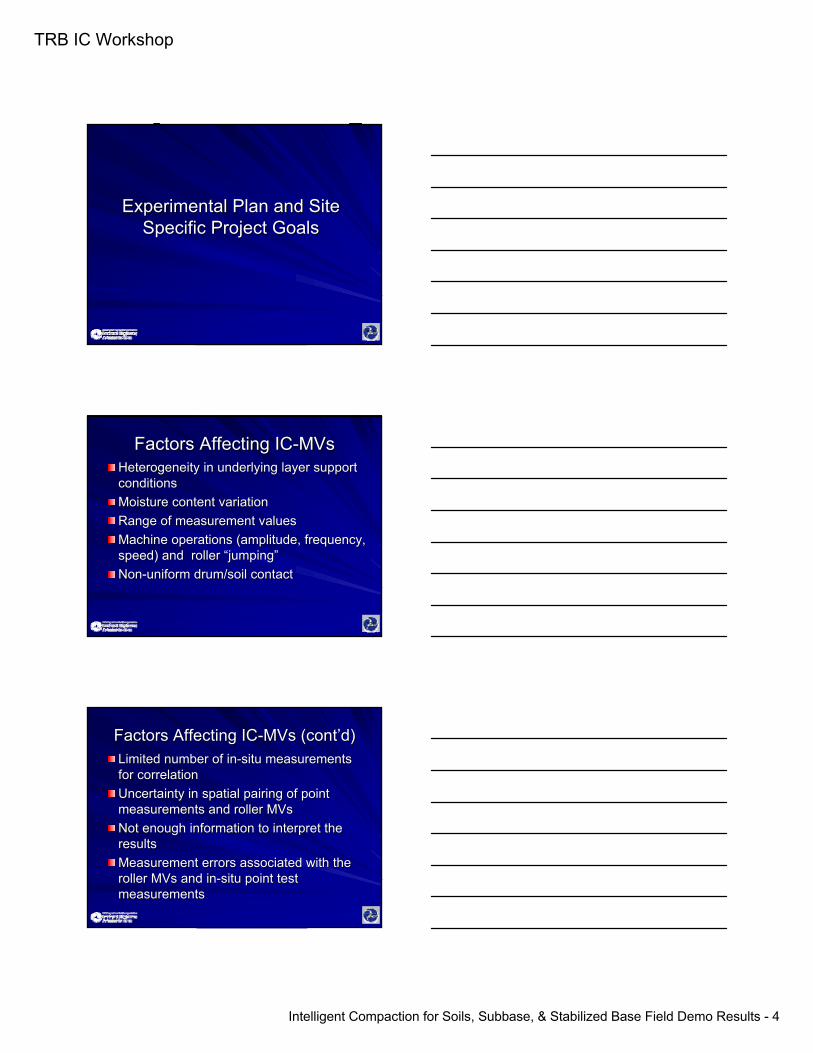
Measurement Influence DepthMeasurement Influence Depth
Width (m)0 1 2 3 4 5 6 7 8
Dep
th (m
)
0.00.30.60.91.21.51.82.12.42.73.0
Nuclear Density Gaugec
Dynamic Cone Penetrometer (DCP)
Notes:a Influence depths for LWD/FWD are assumed ~ 1 x B (width)b Influence depth of soil stiffness gauge ~ 230 mm (Florida DOT , 2003)cMaximum penetration depth for Nuclear density gauge = 0.3 mdAccording to Method of Equivalent Thickness by Odemark (1949)
Soil StiffnessGaugeb
Typical penetration depth ~ 1m
Extensionup to ~ 3m
B = 0.3 m
Compaction layer
1 to 1.2 m (NCHRP 21‐09)1.5 m (ISSMGE 2005)
0.3 m spacingGeophones
Deflection Basind
Static Cone Penetration Test (CPT)
X
> 3m
B = 2.1 m
300 mm dia.LWDa/FWDa,d
X X X X X
In‐situ point test measurementsArea over which the roller MV’s are averaged
Distance = Roller travel in approx. 0.1 to 0.5 sec.Impact ForceFrom Rollers
XX 2.1 m X
CMV = 0.8 to 0.9 m (White et al.
2009)
MDP = 0.3 to 0.6 m
(White et al. 2009)
Laboratory Test MethodsLaboratory Test Methods
Proctor, Relative Density, Gradation, Atterberg Limits, Resilient Modulus, Moisture content, Gyratory/PDA Compaction
TRB IC Workshop
Intelligent Compaction for Soils, Subbase, & Stabilized Base Field Demo Results - 4
Experimental Plan and Site Experimental Plan and Site Specific Project GoalsSpecific Project Goals
Factors Affecting ICFactors Affecting IC--MVsMVsHeterogeneity in underlying layer support Heterogeneity in underlying layer support conditionsconditionsMoisture content variation Moisture content variation Range of measurement valuesRange of measurement valuesMachine operations (amplitude, frequency, Machine operations (amplitude, frequency, speed) and roller speed) and roller ““jumpingjumping””NonNon--uniform drum/soil contactuniform drum/soil contact
Factors Affecting ICFactors Affecting IC--MVsMVs (cont(cont’’d)d)Limited number of inLimited number of in--situ measurements situ measurements for correlation for correlation Uncertainty in spatial pairing of point Uncertainty in spatial pairing of point measurements and roller measurements and roller MVsMVsNot enough information to interpret the Not enough information to interpret the resultsresultsMeasurement errors associated with the Measurement errors associated with the roller roller MVsMVs and inand in--situ point test situ point test measurementsmeasurements

TRB IC Workshop
Intelligent Compaction for Soils, Subbase, & Stabilized Base Field Demo Results - 5
Project GoalsProject Goals1.1. Document impact of Document impact of variable feedback variable feedback
controlcontrol on compaction uniformityon compaction uniformity2.2. Document machine Document machine vibration amplitudevibration amplitude
influence on compaction efficiencyinfluence on compaction efficiency3.3. Evaluate impact of Evaluate impact of lift thicknesslift thickness on IC on IC
roller values and compaction efficiencyroller values and compaction efficiency
Project Goals (contProject Goals (cont’’d)d)4.4. Develop Develop correlationscorrelations b/w IC roller values b/w IC roller values
to traditional measurementsto traditional measurements5.5. Study IC roller Study IC roller measurement influence measurement influence
depthdepth6.6. Compare IC results to Compare IC results to tradition tradition
compaction operationscompaction operations7.7. Study IC roller measurement values in Study IC roller measurement values in
production compaction operationsproduction compaction operations
ISU Research Team Contacts:David J. White, Associate Professor, [email protected], (515) 290‐1080 (cell)Heath Gieselman, Assistant Scientist, [email protected], (515) 450‐1383 (cell)
Embankment/Subgrade (Sandy Silt/Gravel)
Aggregate Base (4 inch minus)
1
2
3
Embankment/Pavement Foundation LayersAccelerated Implementation of IC Technology for Embankment
Subgrade Soils, Aggregate Base, and Asphalt Pavement MaterialsUS 219, Springville, NY – New York State Department of Transportation
[May 17-May 22, 2009]
Notes:A. Moisture condition calibration test strip areas ± 1.5% optimum except as noted. B. NYSDOT assistance requested for FWD testing and information on project QA testing requirements. C. As time permits repeatability passes for roller will be performed on embankment and aggregate base.
Aggregate Base (2 inch minus)4”
8”
Date TB MachineAmp (mm)
Spot Tests Notes/Comments
05/17
ISU arrives at site to setup mobile lab (2pm)Setup BOMAG/CAT rollers and make trial runs with GPS (3pm)Meet with Contractor and identify potential test areas (4pm)Collect material samples for on‐site laboratory characterization (5pm)
05/18
1BOMAG (smooth)
0.7, 2.0Auto
DCP, LWD, NG, PLT, BCD(?)
10 m x 60 m calibration test area. 1. Compact foundation layer with 8 roller passes and
map.2. Place one 300 mm loose lift of silty gravel over
area3. Compact in three lanes using low, high, and vario
control – 10 passes + 3 mapping passes4. Develop compaction curves5. Excavate trenches and repeat compaction
2CAT
(smooth)TBD
DCP, LWD, NG, PLT, FWD
Roller mapping in production areas of embankment and aggregate base. Monitor existing practice and perform in‐situ tests for comparison. Use data for test run on IC QA specification.
05/19
3CAT
(smooth)0.91.8
DCP, LWD, NG, PLT, BCD
15 m x 60 m calibration test area. 1. Compact foundation layer with 8 roller passes and
map.2. Place 300 mm loose lift of silty gravel over a area
for lanes 1/2 and 600 mm loose lift lanes 3/4.3. Create wet spot (+4%) 15 m x 10 m4. Compact in four lanes using low and high 10
passes + 2 mapping passes5. Develop compaction curves
4BOMAG (smooth)
TBDDCP, LWD, NG,
PLT, FWD
Roller mapping in production areas of embankment and aggregate base. Monitor existing practice and perform in‐situ tests for comparison. Use data for test run on IC QA specification.
5/20 to 5/22
5/6
BOMAG (smooth)/
CAT (Smooth)
TBDDCP, LWD, NG,
PLT, FWDProduction compaction areas of embankment and aggregate base. Multiple lifts.
05/21 Open House –presentation of preliminary results and roller demonstrations.
#2 (Vario Control)#3 (High Amp)
#1 (Low Amp)
Plan View Profile View
Notes: Compact underlying layer with 8 roller passes
Lift = 300 mm10 m
~60 m
Notes: After compaction testing, excavate two trenches and recompact
10 m
~60 m
Trench depth = 0.3 m and 1 mTrench widths = 1 m and 2m
Loose trenches
Calibration Test Strips - BOMAG
#1 #2 #3
Profile View
Lift = 600 mm
Notes: Compact underlying layer with 8 roller passes
Lift = 300 mmLanes 1/2
Lanes 3/4Wet zone (+4% wopt)
#3 (Low Amp)
Plan View
15 m#2 (High Amp)
#4 (High Amp)
#1 (Low Amp)
~60 m
Calibration Test Strips - CAT
Example Experimental Plan
TRB IC Workshop
Intelligent Compaction for Soils, Subbase, & Stabilized Base Field Demo Results - 6
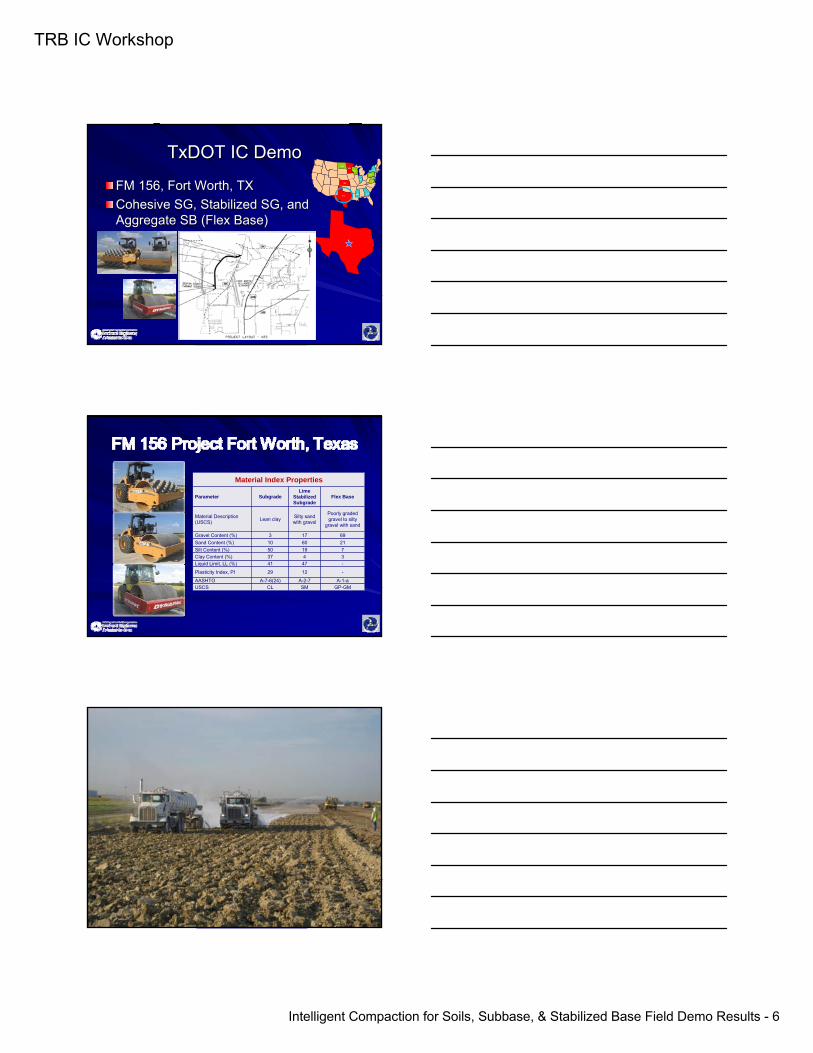
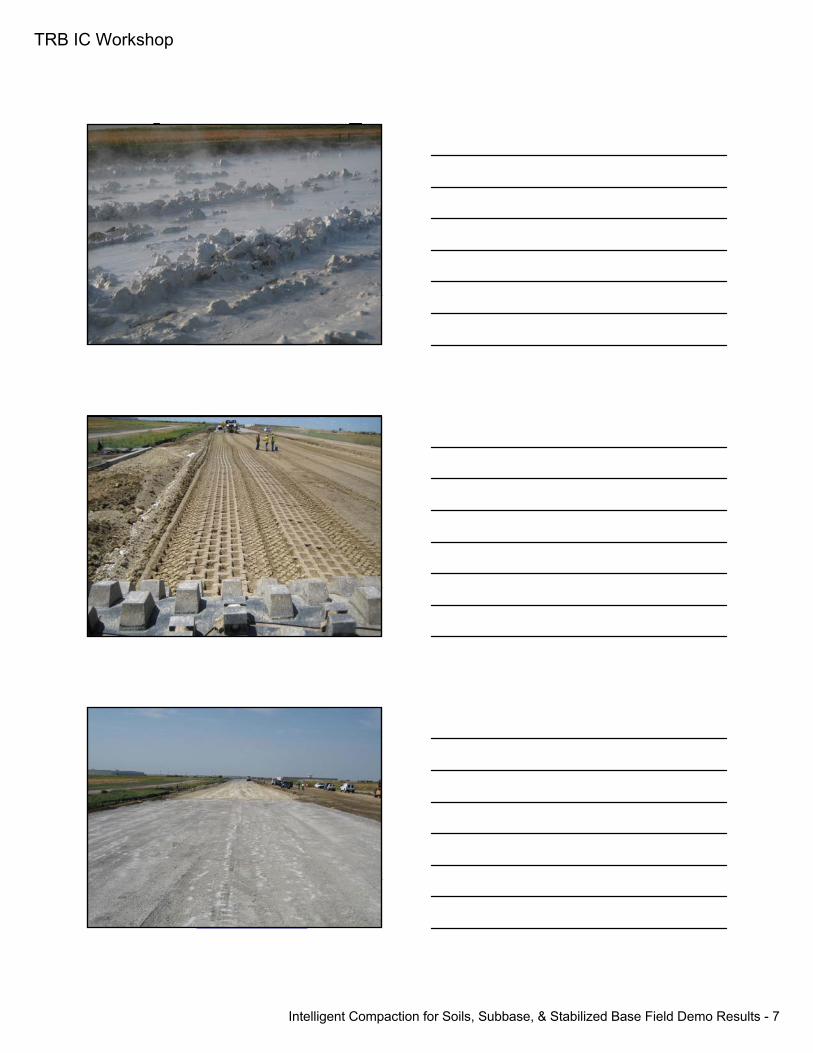
TxDOTTxDOT IC DemoIC Demo
FM 156, Fort Worth, TXFM 156, Fort Worth, TXCohesive SG, Stabilized SG, and Cohesive SG, Stabilized SG, and Aggregate SB (Flex Base)Aggregate SB (Flex Base)
MN
KS
TXMS
IN
NY
PA
VA
MD
ND
GA
WI
Material Index Properties
Parameter SubgradeLime
Stabilized Subgrade
Flex Base
Material Description (USCS) Lean clay Silty sand
with gravel
Poorly graded gravel to silty
gravel with sand
Gravel Content (%) 3 17 69Sand Content (%) 10 60 21Silt Content (%) 50 19 7Clay Content (%) 37 4 3Liquid Limit, LL (%) 41 47 -
Plasticity Index, PI 29 12 -
AASHTO A-7-6(24) A-2-7 A-1-aUSCS CL SM GP-GM
TRB IC Workshop
Intelligent Compaction for Soils, Subbase, & Stabilized Base Field Demo Results - 7
InIn--Situ Testing MethodsSitu Testing Methods
TRB IC Workshop
Intelligent Compaction for Soils, Subbase, & Stabilized Base Field Demo Results - 8
Dis
tanc
e (m
)
0
20
40
60
80
100
120
140
160
180
Pass 1 2 3 4 5 6 7 8
Lane12345
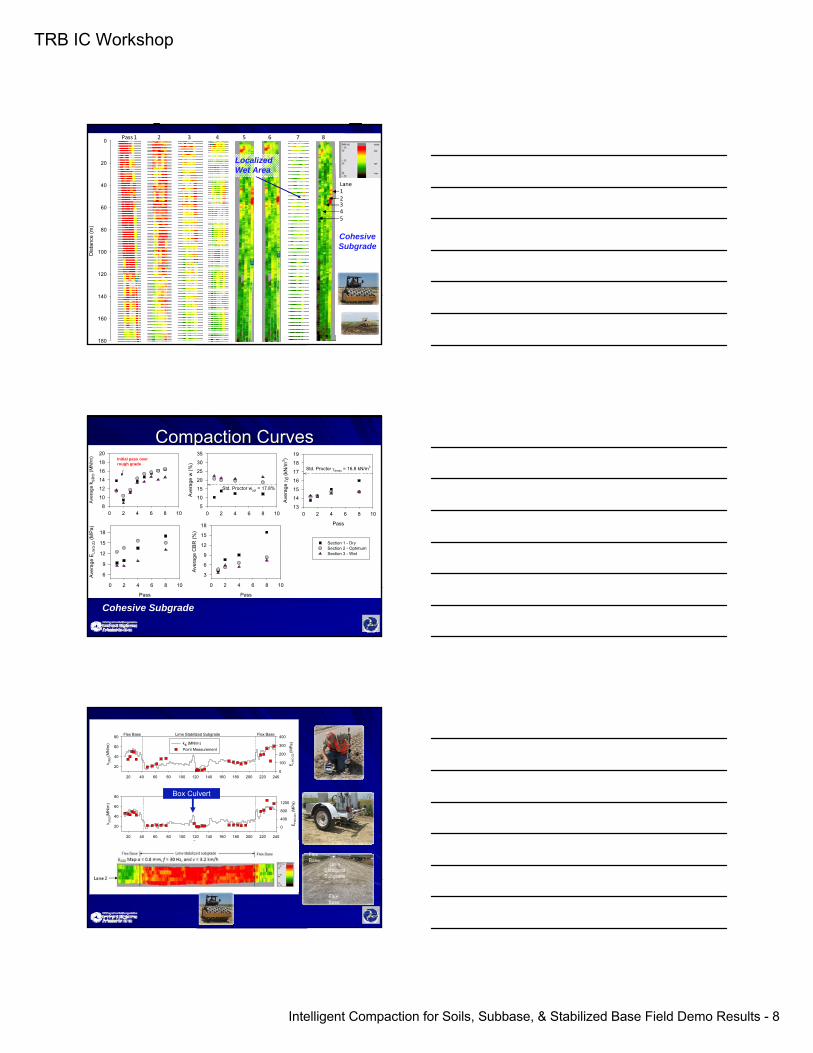
Localized Wet Area
Cohesive Subgrade
Compaction CurvesCompaction Curves
Pass
0 2 4 6 8 10
Ave
rage
ELW
D-Z
2 (M
Pa)
6
9
12
15
18
Pass
0 2 4 6 8 10
Ave
rage
γd
(kN
/m3 )
13
14
15
16
17
18
19
Section 1 - Dry Section 2 - OptimumSection 3 - Wet
0 2 4 6 8 10
Ave
rage
w (%
)
5
10
15
20
25
30
35
Pass
0 2 4 6 8 10
Ave
rage
CB
R (%
)
3
6
9
12
15
18
0 2 4 6 8 10
Ave
rage
kS
IPD (M
N/m
)
8
10
12
14
16
18
20
Std. Proctor wopt = 17.8%
Std. Proctor γdmax = 16.8 kN/m3
Initial pass over rough grade
Cohesive Subgrade
20 40 60 80 100 120 140 160 180 200 220 240
k SIS
D(M
N/m
)
20
40
60
80
EFW
D-D
3 (M
Pa)
0
400
800
1200
20 40 60 80 100 120 140 160 180 200 220 240
k SIS
D(M
N/m
)
20
40
60
80
ELW
D-Z
2 (M
Pa)
0
100
200
300
400ks (MN/m)Point Measurement
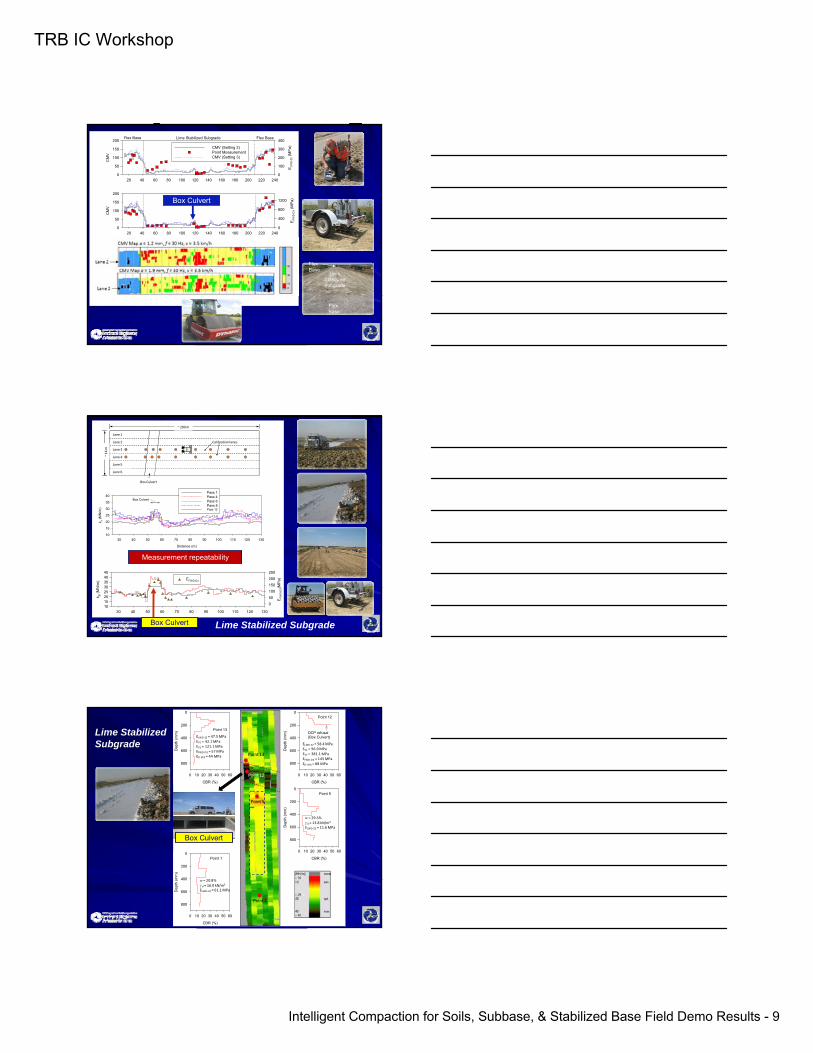
Flex Base Flex BaseLime Stabilized Subgrade
Flex Base
Lime StabilizedSubgrade
Flex Base
Box Culvert
TRB IC Workshop
Intelligent Compaction for Soils, Subbase, & Stabilized Base Field Demo Results - 9
20 40 60 80 100 120 140 160 180 200 220 240
CM
V
0
50
100
150
200
ELW
D-Z
2 (M
Pa)
0
100
200
300
400
CMV (Setting 2)Point MeasurementCMV (Setting 3)
Flex Base Flex BaseLime Stabilized Subgrade
20 40 60 80 100 120 140 160 180 200 220 240
CM
V
0
50
100
150
200
EFW
D-D
3 (M
Pa)
0
400
800
1200Box Culvert
Flex Base
Lime StabilizedSubgrade
Flex Base
Lane 6
Lane 5
Lane 4
Lane 3
Lane 2
~ 200 m
~ 14
m
Calibration lanes
Lane 1
Box Culvert
Distance (m)
30 40 50 60 70 80 90 100 110 120 130
k s (M
N/m
)
10
15
20
25
30
35
40Pass 1Pass 4Pass 6Pass 8Pass 12
Box Culvert
30 40 50 60 70 80 90 100 110 120 130
k s (M
N/m
)
1015202530354045
EFW
D-D
3(M
Pa)
050100150200250
EFWD-D3
Measurement repeatability
Box Culvert Lime Stabilized Subgrade
CBR (%)
0 10 20 30 40 50 60
Dep
th (m
m)
0
200
400
600
800
Point 13
CBR (%)
0 10 20 30 40 50 60
Dep
th (m
m)
0
200
400
600
800
Point 12
DCP refusal(Box Culvert)
CBR (%)
0 10 20 30 40 50 60
Dep
th (m
m)
0
200
400
600
800
Point 5
CBR (%)
0 10 20 30 40 50 60
Dep
th (m
m)
0
200
400
600
800
Point 1
Point 1
Point 5
Point 12
Point 13
w = 29.5%γ d = 13.8 kN/m3
ELWD‐Z2 = 11.6 MPa
ELWD‐Z2 = 58.4 MPaEV1 = 96.9 MPaEV2 = 381.1 MPaEFWD‐D3 = 145 MPaED‐SPA = 88 MPa
w = 20.8%γ d = 16.0 kN/m3
ELWD‐Z2 = 61.1 MPa
ELWD‐Z2 = 47.5 MPaEV1 = 42.1 MPaEV2 = 121.1 MPaEFWD‐D3 = 57 MPaED‐SPA = 44 MPa
Box Culvert
Lime Stabilized Subgrade
TRB IC Workshop
Intelligent Compaction for Soils, Subbase, & Stabilized Base Field Demo Results - 10
w (%)
16 18 20 22 24 26 28 30 32
k SIP
D (M
N/m
)
10
15
20
25
30
35
40
EV2 (MPa)
100 200 300 400 500 600 70010
15
20
25
30
35
40ELWD-Z2 (MPa)
0 20 40 60
k SIP
D (M
N/m
)
10
15
20
25
30
35
40
CBR (%)
0 5 10 15 2010
15
20
25
30
35
40
γd (kN/m3)
12 13 14 15 16 17 1810
15
20
25
30
35
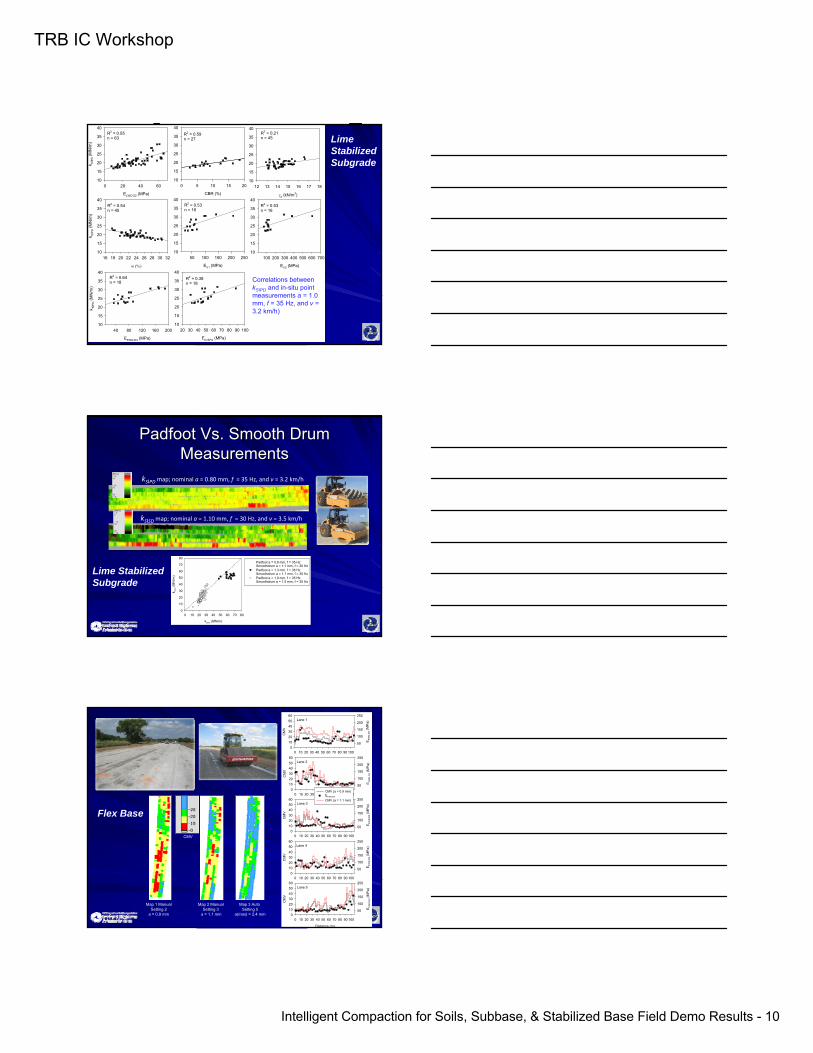
40R2 = 0.55n = 63
EV1 (MPa)
50 100 150 200 25010
15
20
25
30
35
40
EFWD-D3 (MPa)
40 80 120 160 200
k SIP
D (M
N/m
)
10
15
20
25
30
35
40
ED-SPA (MPa)
20 30 40 50 60 70 80 90 10010
15
20
25
30
35
40
R2 = 0.59n = 27
R2 = 0.21n = 45
R2 = 0.54n = 45
R2 = 0.53n = 16
R2 = 0.53n = 16
R2 = 0.64n = 18
R2 = 0.38n = 18
Correlations between kSΙPD and in-situ point measurements a = 1.0 mm, f = 35 Hz, and v = 3.2 km/h)
Lime Stabilized Subgrade
Padfoot Vs. Smooth Drum Padfoot Vs. Smooth Drum MeasurementsMeasurements
kSΙSDmap; nominal a = 1.10 mm, f = 30 Hz, and v = 3.5 km/h
kSΙPDmap; nominal a = 0.80 mm, f = 35 Hz, and v = 3.2 km/h
kSIPD
(MN/m)
0 10 20 30 40 50 60 70 80
k SIS
D (M
N/m
)
0
10
20
30
40
50
60
70
80Padfoot a = 0.8 mm, f = 35 HzSmoothdrum a = 1.1 mm, f = 30 HzPadfoot a = 1.3 mm, f = 35 HzSmoothdrum a = 1.1 mm, f = 30 HzPadfoot a = 1.0 mm, f = 35 HzSmoothdrum a = 1.5 mm, f = 35 Hz
Lime Stabilized Subgrade
Map 3 Auto Setting 5
a(max) = 2.4 mm
Map 2 Manual Setting 3
a = 1.1 mm
Map 1 Manual Setting 2
a = 0.9 mm
CMV
0 10 20 30 40 50 60 70 80 90 100
CM
V
0102030405060
EFW
D-D
3 (M
Pa)
50
100
150
200
250
0 10 20 30 40 50 60 70 80 90 100
CM
V
0102030405060
EFW
D-D
3 (M
Pa)
50
100
150
200
250
0 10 20 30 40 50 60 70 80 90 100
CM
V
0102030405060
EFW
D-D
3 (M
Pa)
50
100
150
200
250
0 10 20 30 40 50 60 70 80 90 100
CM
V
0102030405060
EFW
D-D
3 (M
Pa)
50
100
150
200
250
CMV (a = 0.9 mm)EFWD-D3
CMV (a = 1.1 mm)
Distance (m)
0 10 20 30 40 50 60 70 80 90 100
CM
V
0102030405060
EFW
D-D
3 (M
Pa)
50
100
150
200
250
Lane 1
Lane 2
Lane 3
Lane 4
Lane 5
Flex Base
TRB IC Workshop
Intelligent Compaction for Soils, Subbase, & Stabilized Base Field Demo Results - 11
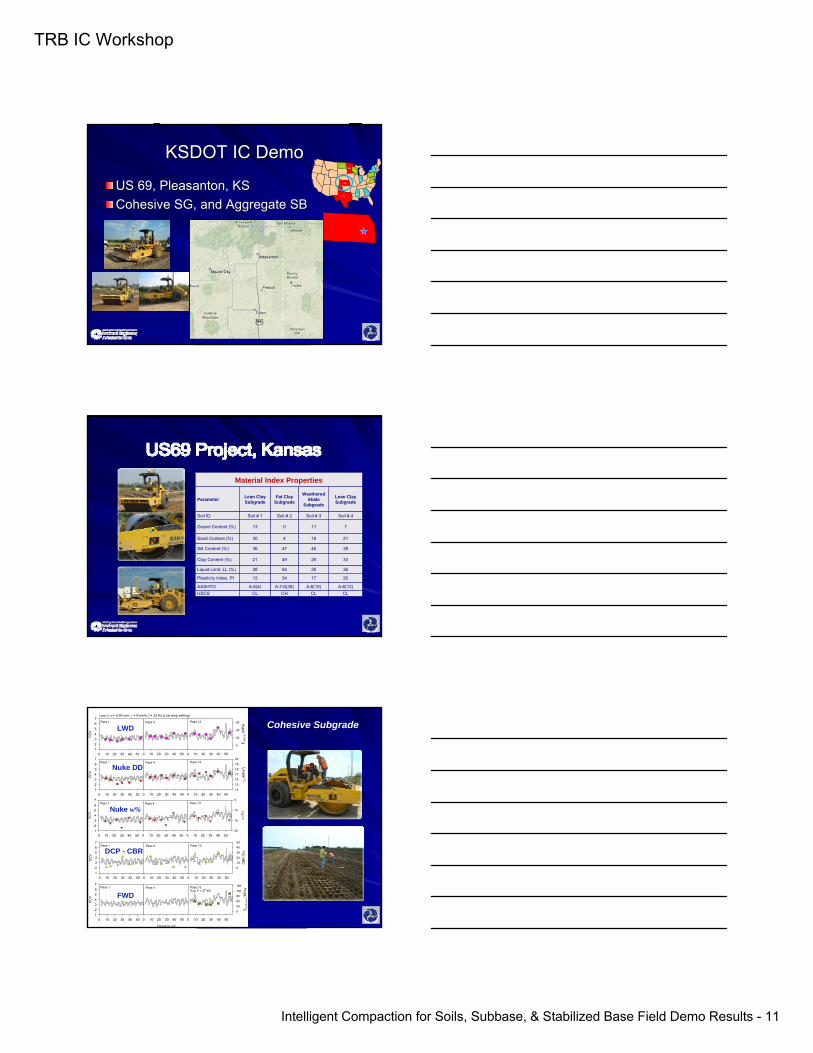
KSDOT IC DemoKSDOT IC Demo
US 69, Pleasanton, KSUS 69, Pleasanton, KSCohesive SG, and Aggregate SBCohesive SG, and Aggregate SB
MN
KS
TXMS
IN
NY
PA
VA
MD
ND
GA
WI
Material Index Properties
Parameter Lean Clay Subgrade
Fat Clay Subgrade
Weathered Shale
Subgrade
Lean Clay Subgrade
Soil ID Soil # 1 Soil # 2 Soil # 3 Soil # 4
Gravel Content (%) 13 0 11 7
Sand Content (%) 30 4 18 21
Silt Content (%) 36 47 46 39
Clay Content (%) 21 49 25 33
Liquid Limit, LL (%) 28 54 35 36
Plasticity Index, PI 12 34 17 20
AASHTO A-6(4) A-7-6(36) A-6(10) A-6(12)USCS CL CH CL CL
0 10 20 30 40 50
CC
V
1234567
0 10 20 30 40 50 0 10 20 30 40 50
ELW
D-Z
2 (M
Pa)
0
20
40
60Pass 1
Lane 2: a = 0.93 mm, v = 6 km/h, f = 33 Hz (Low amp setting)
Pass 4 Pass 13
0 10 20 30 40 50
CC
V
1234567
0 10 20 30 40 50 0 10 20 30 40 50
γ d (kN
/m3 )
14
15
16
17
18
19
20Pass 1 Pass 4 Pass 13
Dist 1 vs Pass 1 Dist 1 vs Pass 1
0 10 20 30 40 50
CC
V
1234567
0 10 20 30 40 50 0 10 20 30 40 50
w (%
)
5
10
15
20
Pass 1 Pass 4 Pass 13
Dist 1 vs Pass 1 Dist 1 vs Pass 1
0 10 20 30 40 50
CC
V
1234567
0 10 20 30 40 50 0 10 20 30 40 50
CBR
(%)
0
10
20
30
40
50Pass 1 Pass 4 Pass 13
Dist 1 vs Pass 1 Dist 1 vs Pass 1
Distance (m)
0 10 20 30 40 50
CC
V
1234567
0 10 20 30 40 50 0 10 20 30 40 50
E FWD
-D4.
5 (M
Pa)
0
30
60
90
120
150Pass 1 Pass 4 Pass 13Avg. F = 27 kN
LWD
Nuke DD
Nuke w%
DCP - CBR
FWD
Cohesive Subgrade
TRB IC Workshop
Intelligent Compaction for Soils, Subbase, & Stabilized Base Field Demo Results - 12
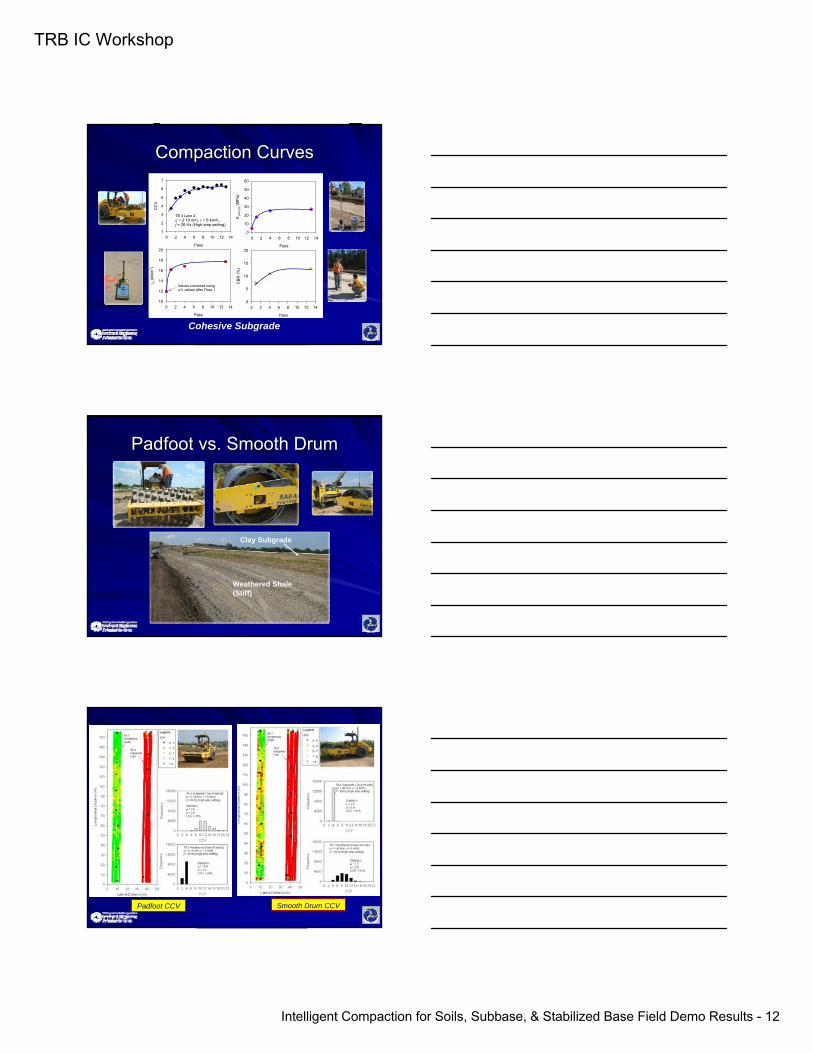
Compaction CurvesCompaction Curves
Pass
0 2 4 6 8 10 12 14
CC
V
1
2
3
4
5
6
7
Pass
0 2 4 6 8 10 12 14E
LWD
-Z2 (
MP
a)0
10
20
30
40
50
60
Pass
0 2 4 6 8 10 12 14
γ d (kN
/m3 )
10
12
14
16
18
20
Pass
0 2 4 6 8 10 12 14
CB
R (%
)
0
5
10
15
20
Values corrected using w% values after Pass 1
TB 4 Lane 3: a = 2.19 mm, v = 6 km/h, f = 26 Hz (High amp setting)
Cohesive Subgrade
Padfoot vs. Smooth DrumPadfoot vs. Smooth Drum
Weathered Shale(Stiff)
Clay Subgrade
Padfoot CCV Smooth Drum CCV
TRB IC Workshop
Intelligent Compaction for Soils, Subbase, & Stabilized Base Field Demo Results - 13
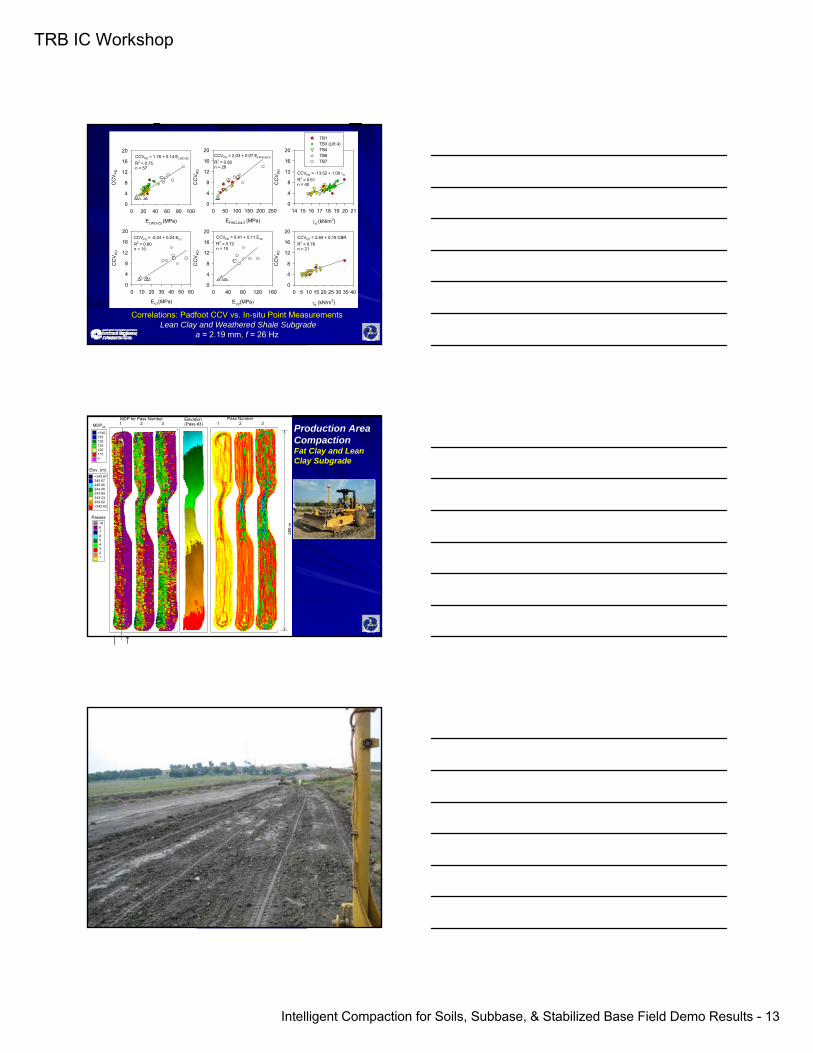
Correlations: Padfoot CCV vs. InCorrelations: Padfoot CCV vs. In--situ Point Measurementssitu Point MeasurementsLean Clay and Weathered Shale Subgrade Lean Clay and Weathered Shale Subgrade
a a = 2.19 mm, = 2.19 mm, f f = 26 Hz= 26 Hz
EV2(MPa)
0 40 80 120 160
CC
VP
D
0
4
8
12
16
20
γd (kN/m3)
14 15 16 17 18 19 20 21
CC
VP
D
0
4
8
12
16
20
ELWD-Z2 (MPa)
0 20 40 60 80 100
CC
VP
D
0
4
8
12
16
20
TB1TB3 (Lift 4)TB4TB6TB7
EFWD-D4.5 (MPa)
0 50 100 150 200 250
CC
VP
D
0
4
8
12
16
20
EV1(MPa)
0 10 20 30 40 50 60
CC
VP
D
0
4
8
12
16
20
γd (kN/m3)
0 5 10 15 20 25 30 35 40
CC
VP
D
0
4
8
12
16
20
CCVPD = 1.76 + 0.14 ELWD-Z2
R2 = 0.75n = 57
CCVPD = 2.03 + 0.07 EFWD-D4.5
R2 = 0.82n = 28
CCVPD = -13.52 + 1.09 γd
R2 = 0.61n = 40
CCVPD = -0.24 + 0.24 EV1
R2 = 0.80n = 15
CCVPD = 0.41 + 0.11 EV2
R2 = 0.72n = 15
CCVPD = 2.84 + 0.19 CBRR2 = 0.78n = 21
MDP for Pass Number1 2 3
Elevation (Pass #3)
Elev. (m)>245.67245.67245.06244.45243.84243.23242.62<242.62
Passes>987654321
280
m
Pass Number1 2 3MDP80
>1401351301251201150
Production AreaCompactionFat Clay and Lean Clay Subgrade
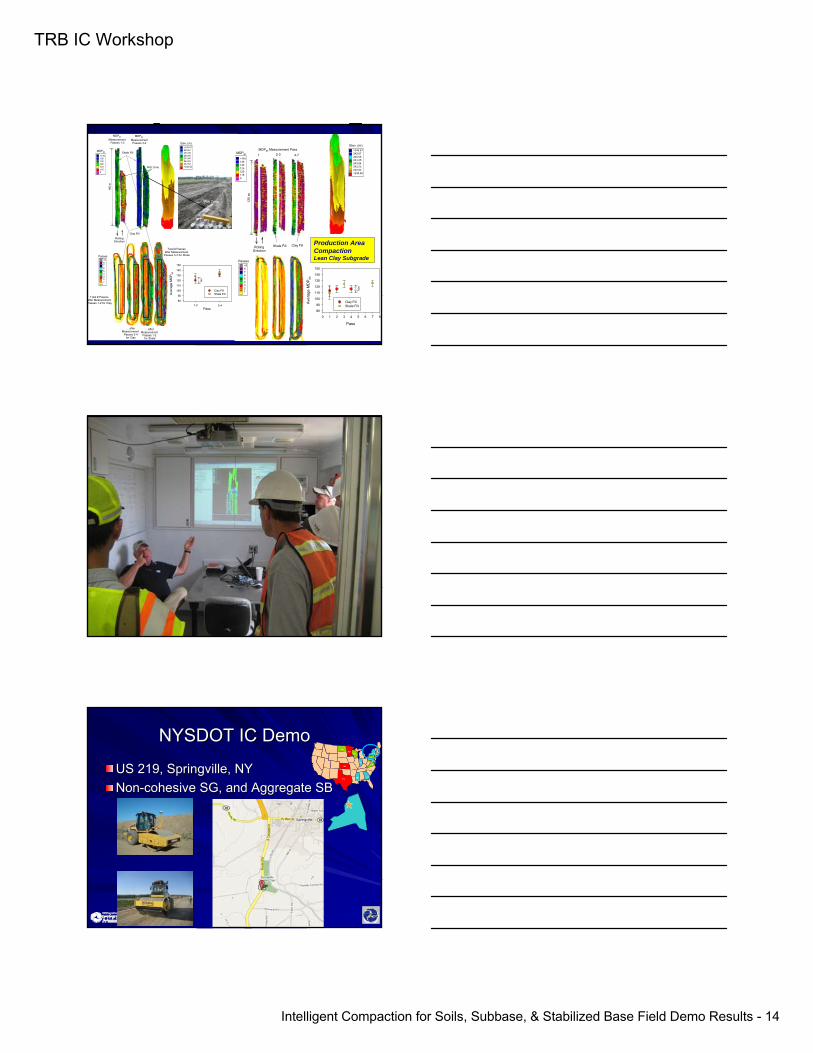
TRB IC Workshop
Intelligent Compaction for Soils, Subbase, & Stabilized Base Field Demo Results - 14
165
m
Elev. (m)>245.67245.67245.06244.45243.84243.23242.62<242.62
Passes>987654321
MDP80 Measurement
Passes 1-2
MDP80 MeasurementPasses 3-4
Clay Fill
Shale Fill
Total # Passes after Measurement Passes 1-2 for Clay
Total # Passes after Measurement
Passes 3-4 for Shale
... afterMeasurement
Passes 3-4for Clay
... after Measurement
Passes 1-2 for Shale
Wet Zone
RollingDirection
MDP80
>1401351301251201150
Pass
Ave
rage
MD
P80
80
90
100
110
120
130
140
150
Clay FillShale Fill
1xσ
1-2 3-4
Wet Zone
Elev. (m)>245.67245.67245.06244.45243.84243.23242.62<242.62
125
m
MDP80 Measurement Pass
1 2-3 4-7
Passes>987654321
MDP80
>1401351301251201150
RollingDirection
Shale Fill Clay Fill
Pass
0 1 2 3 4 5 6 7 8
Ave
rage
MD
P80
80
90
100
110
120
130
140
150
Clay FillShale Fill
1xσ
Production AreaCompactionLean Clay Subgrade
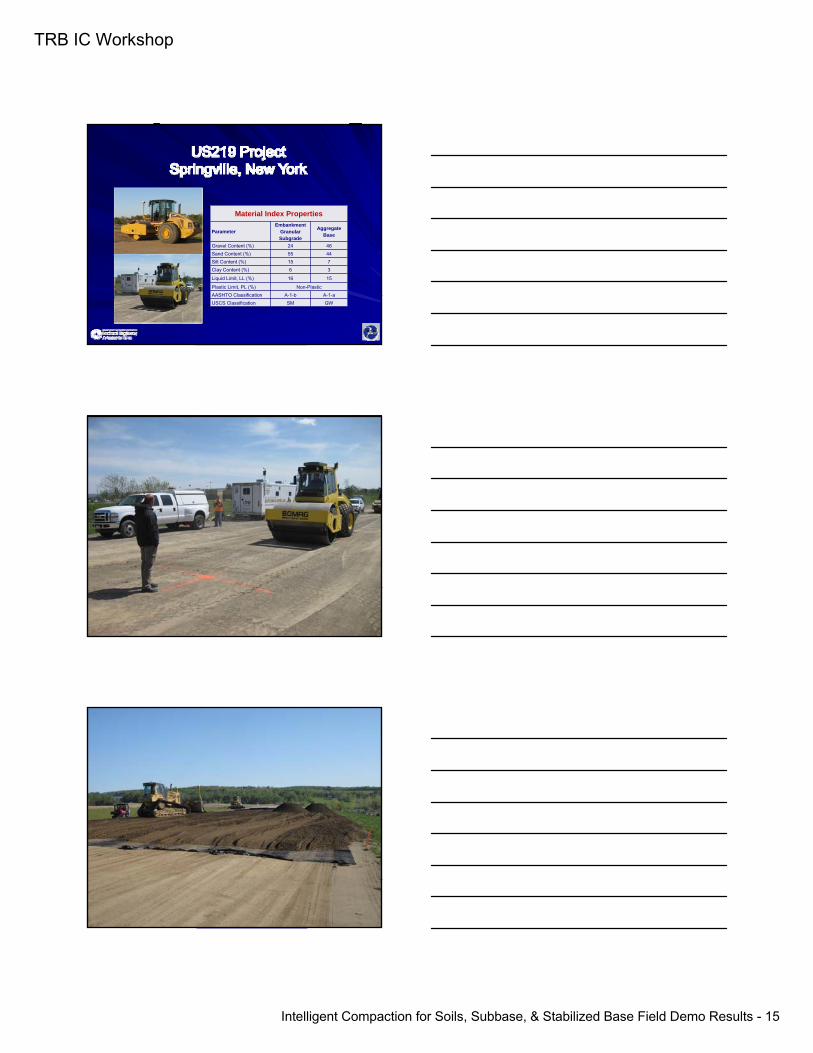
NYSDOT IC DemoNYSDOT IC Demo
US 219, Springville, NYUS 219, Springville, NYNonNon--cohesive SG, and Aggregate SBcohesive SG, and Aggregate SB
MN
KS
TXMS
IN
NY
PA
VA
MD
ND
GA
WI
TRB IC Workshop
Intelligent Compaction for Soils, Subbase, & Stabilized Base Field Demo Results - 15
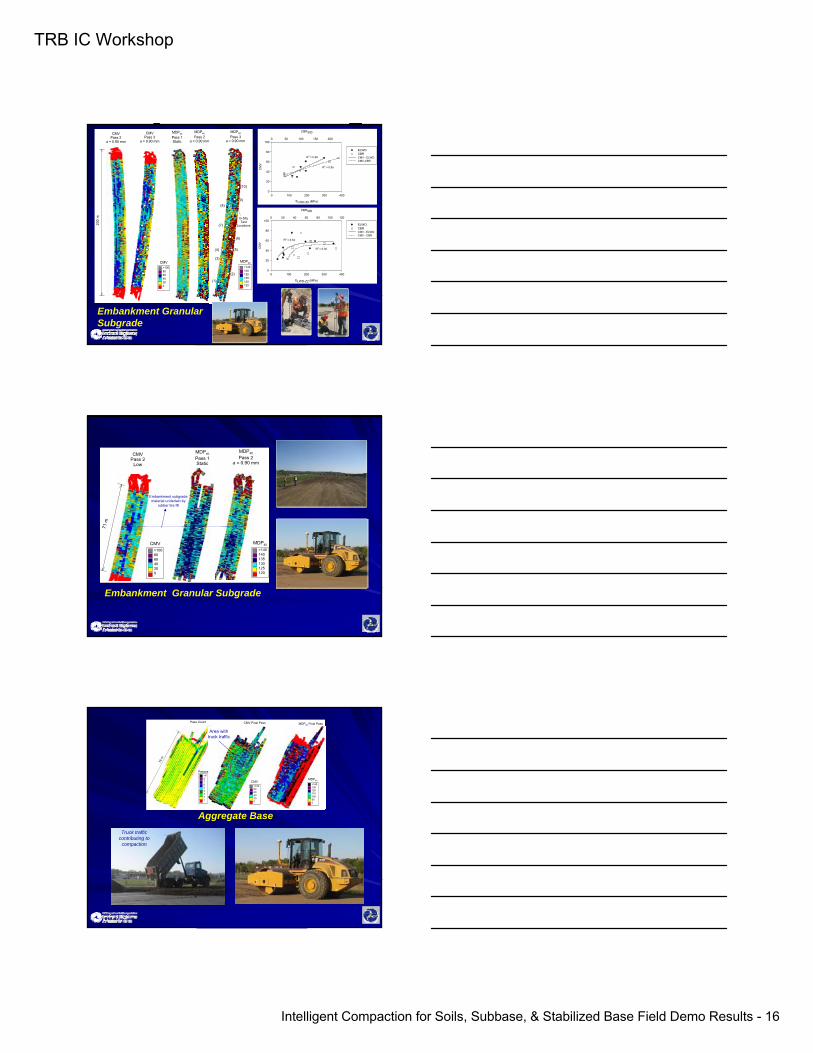
Material Index Properties
ParameterEmbankment
Granular Subgrade
Aggregate Base
Gravel Content (%) 24 46Sand Content (%) 55 44Silt Content (%) 15 7Clay Content (%) 6 3
Liquid Limit, LL (%) 16 15
Plastic Limit, PL (%) Non-PlasticAASHTO Classification A-1-b A-1-aUSCS Classification SM GW
TRB IC Workshop
Intelligent Compaction for Soils, Subbase, & Stabilized Base Field Demo Results - 16
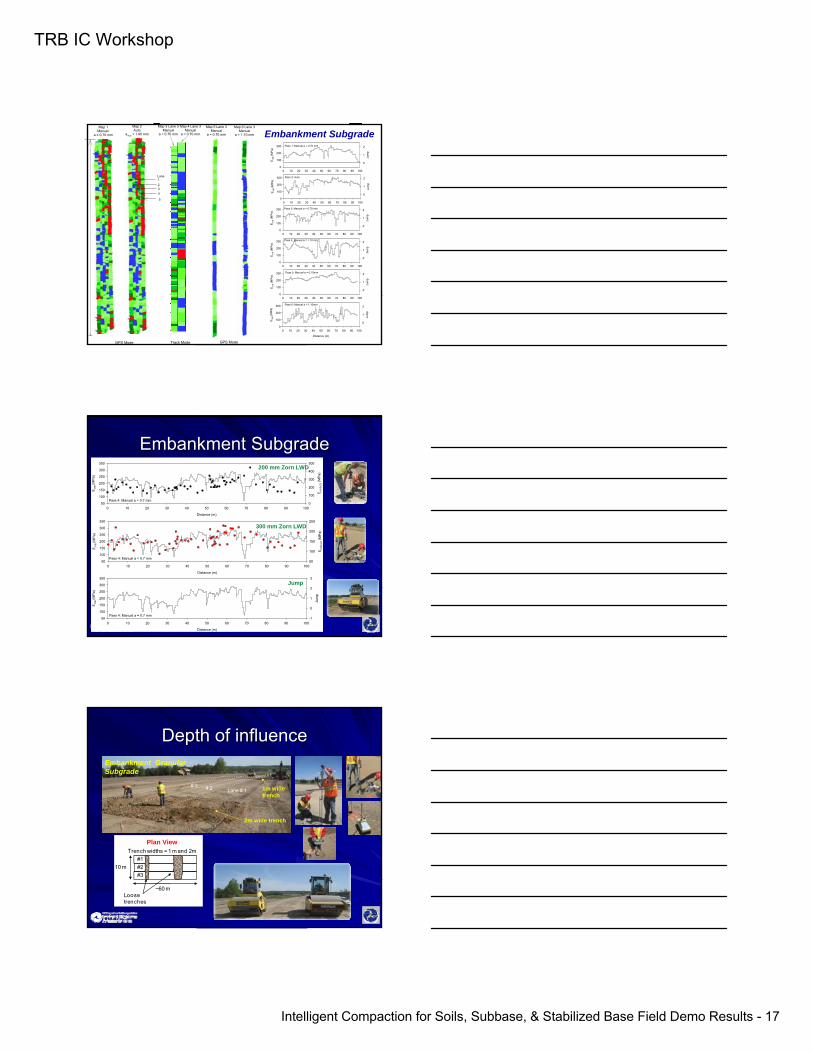
CMVPass 2
a = 0.90 mm
CMVPass 3
a = 0.90 mm
200
m
MDP40
Pass 1Static
MDP40
Pass 2a = 0.90 mm
MDP40
Pass 3a = 0.90 mm
MDP40
>145140135130125120
CMV>100806040200
In-SituTest
Locations
(1)
(2)
(3)
(4) (5)
(6)
(7)
(8)(9)
(10)
ELWD-Z2 (MPa)
0 100 200 300 400
CM
V
0
20
40
60
80
100
CBR300
0 50 100 150 200
ELWDCBR CMV - ELWDCMV-CBR
R2 = 0.68
R2 = 0.85
ELWD-Z2 (MPa)
0 100 200 300 400
CM
V
0
20
40
60
80
100
CBR300
0 20 40 60 80 100 120
ELWDCBR CMV - ELWDCMV - CBR
R2 = 0.54
R2 = 0.30
Embankment Granular Subgrade
CMVPass 2
Low
71 m
MDP40
Pass 1Static
MDP40
Pass 2a = 0.90 mm
MDP40
>145140135130125120
CMV>100806040200
Embankment subgrade material underlain by
rubber tire fill
Embankment Granular Subgrade
Truck traffic contributing to
compaction
MDP40
>140130120110100900
76 m
CMV>100806040200
Passes>987654321
MDP40 Final PassPass Count CMV Final Pass
Area withtruck traffic
Aggregate Base
TRB IC Workshop
Intelligent Compaction for Soils, Subbase, & Stabilized Base Field Demo Results - 17
Map 1Manual
a = 0.70 mm
Map 2Auto
amax = 1.90 mm
Map 5 Lane 3Manual
a = 0.70 mm
Map 6 Lane 3Manual
a = 1.10 mm
Lane 1234
5
Map 3 Lane 3Manual
a = 0.70 mm
Map 4 Lane 3Manual
a = 0.70 mm
Track ModeGPS Mode GPS Mode
0 10 20 30 40 50 60 70 80 90 100
EV
IB (M
Pa)
0
100
200
300
Jum
p
0
1
2
0 10 20 30 40 50 60 70 80 90 100
EV
IB (M
Pa)
0
100
200
300
Jum
p
0
1
2
0 10 20 30 40 50 60 70 80 90 100
EV
IB (M
Pa)
0
100
200
300
Jum
p
0
1
2
0 10 20 30 40 50 60 70 80 90 100
EV
IB (M
Pa)
0
100
200
300
Jum
p
0
1
2
Distance (m)
0 10 20 30 40 50 60 70 80 90 100
EV
IB (M
Pa)
0
100
200
300
Jum
p
0
1
2
0 10 20 30 40 50 60 70 80 90 100
EV
IB (M
Pa)
0
100
200
300
Jum
p
0
1
2
Pass 1: Manual a = 0.70 mm
Pass 2: Auto
Pass 3: Manual a = 0.70 mm
Pass 4: Manual a = 1.10 mm
Pass 5: Manual a = 0.70mm
Pass 6: Manual a = 1.10mm
Embankment Subgrade
Embankment SubgradeEmbankment Subgrade
Distance (m)
0 10 20 30 40 50 60 70 80 90 100
EVI
B (M
Pa)
50
100
150
200
250
300
350
ELW
D-Z
2 (M
Pa)
0
100
200
300
400
500
Pass 4: Manual a = 0.7 mm
Distance (m)
0 10 20 30 40 50 60 70 80 90 100
EVI
B (M
Pa)
50
100
150
200
250
300
350
ELW
D-Z
3 (M
Pa)
50
100
150
200
250
Pass 4: Manual a = 0.7 mm
Distance (m)
0 10 20 30 40 50 60 70 80 90 100
EVI
B (M
Pa)
50
100
150
200
250
300
350
Jum
p
-1
0
1
2
3
Pass 4: Manual a = 0.7 mm
300 mm Zorn LWD
Jump
200 mm Zorn LWD
Depth of influenceDepth of influence
2m wide trench
1m wide trench
Lane # 1# 2# 3
Plan View
10 m
~60 m
Trench widths = 1 m and 2m
Loose trenches
#1 #2 #3
Embankment Granular Subgrade
TRB IC Workshop
Intelligent Compaction for Soils, Subbase, & Stabilized Base Field Demo Results - 18
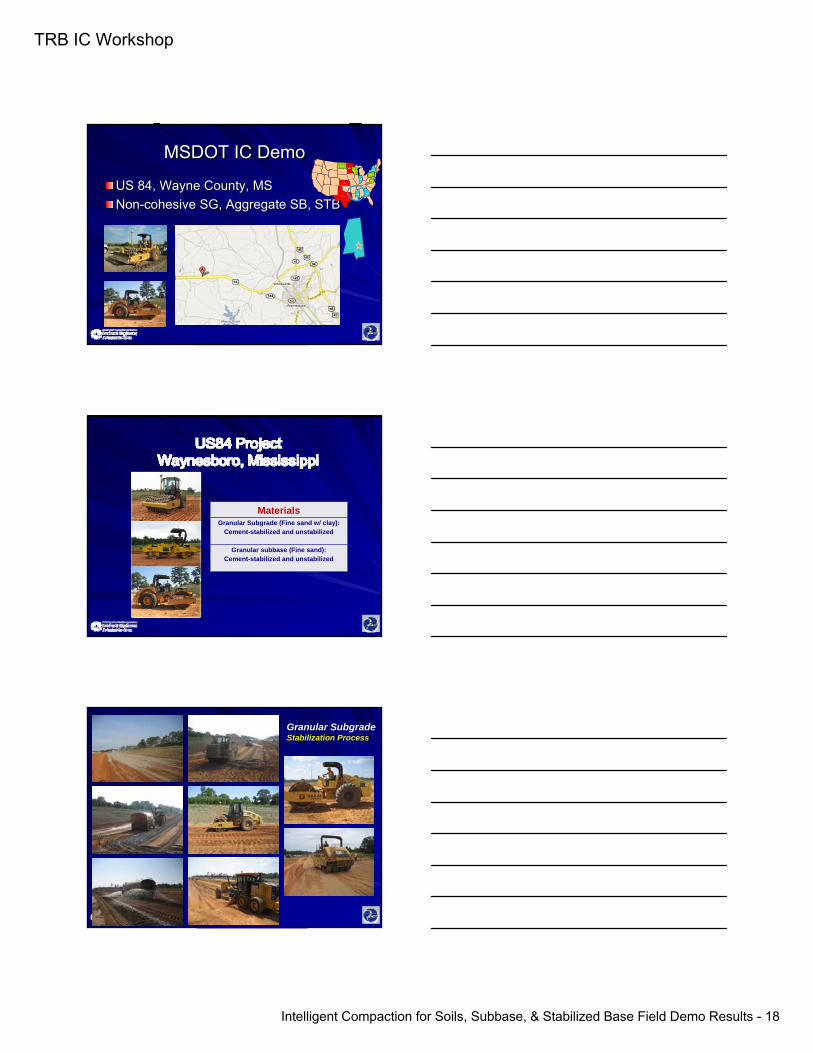
MSDOT IC DemoMSDOT IC Demo
US 84, Wayne County, MSUS 84, Wayne County, MSNonNon--cohesive SG, Aggregate SB, STBcohesive SG, Aggregate SB, STB
MN
KS
TXMS
IN
NY
PA
VA
MD
ND
GA
WI
MaterialsGranular Subgrade (Fine sand w/ clay):
Cement-stabilized and unstabilized
Granular subbase (Fine sand): Cement-stabilized and unstabilized
Granular SubgradeStabilization Process
TRB IC Workshop
Intelligent Compaction for Soils, Subbase, & Stabilized Base Field Demo Results - 19
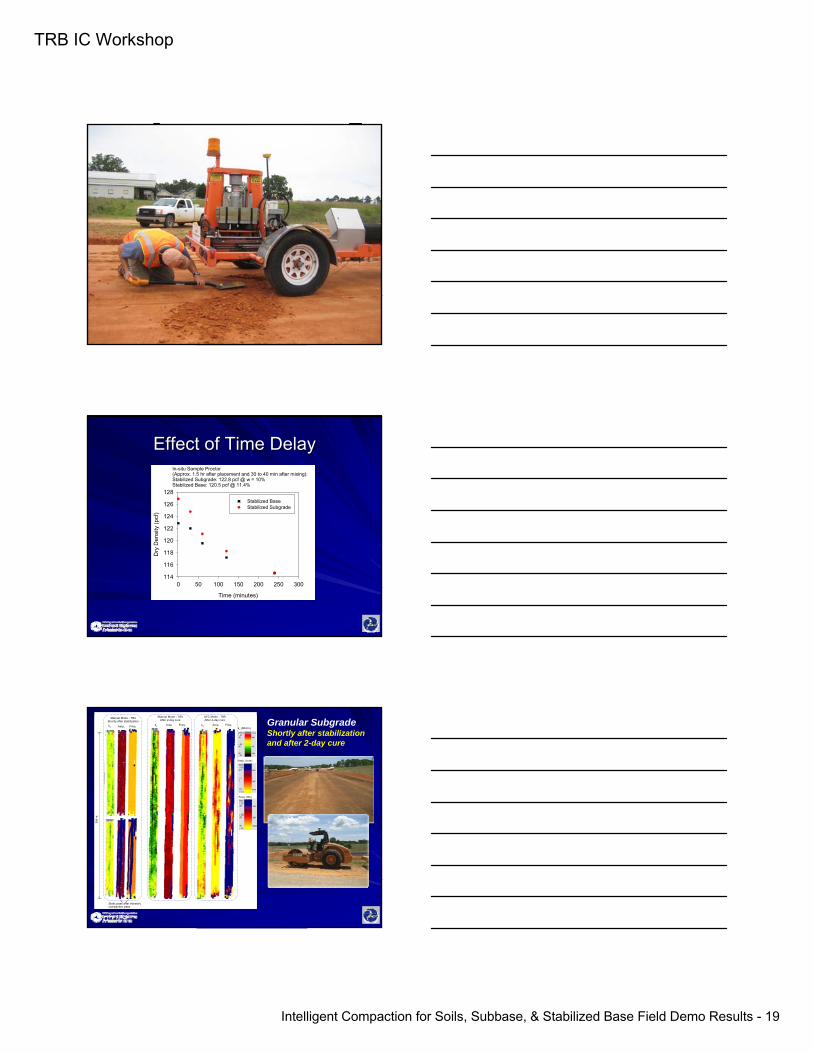
Effect of Time DelayEffect of Time Delay
Time (minutes)
0 50 100 150 200 250 300
Dry
Den
sity
(pcf
)
114
116
118
120
122
124
126
128Stabilized BaseStabilized Subgrade
In-situ Sample Proctor (Approx. 1.5 hr after placement and 30 to 40 min after mixing):Stabilized Subgrade: 122.8 pcf @ w = 10%Stabilized Base: 120.5 pcf @ 11.4%
ks
Amp. (mm)
Freq. (Hz)
Amp. Freq.
Manual Mode - TB4Shortly after stabilization
ks Amp. Freq.
AFC Mode - TB9After 2-day cure
ks (MN/m)
304
m
ks Amp. Freq.
Manual Mode - TB9After 2-day cure
Static pass after vibratory compaction pass
Granular SubgradeShortly after stabilization and after 2-day cure
TRB IC Workshop
Intelligent Compaction for Soils, Subbase, & Stabilized Base Field Demo Results - 20
ks
Amp. (mm)
Freq. (Hz)
Amp. Freq.
Manual Mode - TB3Shortly after stabilization
ks Amp. Freq.
Manual Mode - TB8After 2-day cure
ks (MN/m)
201
m
213
m
ks Amp. Freq.
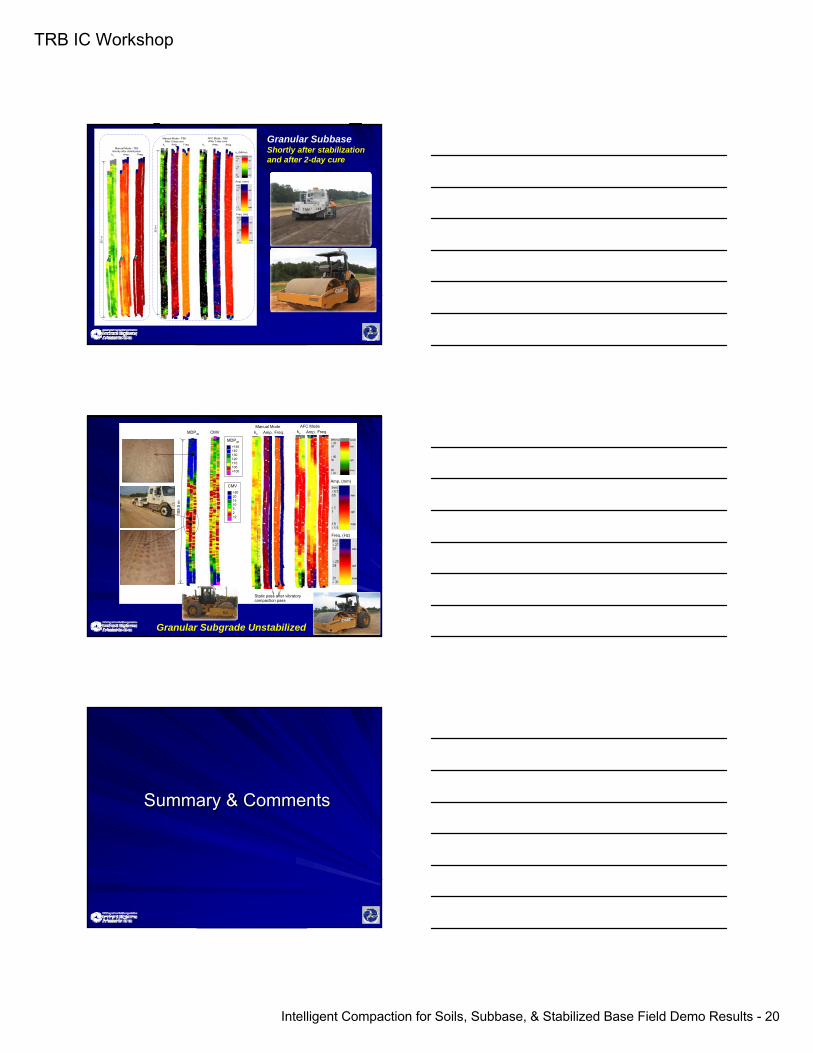
AFC Mode - TB8After 2-day cure Granular Subbase
Shortly after stabilization and after 2-day cure
109.
5 m
MDP40
>140140130120110100<100
CMV>2020151052<2
MDP40 CMV ks
Amp. (mm)
Freq. (Hz)
Amp. Freq. ks Amp. Freq.Manual Mode AFC Mode
Static pass after vibratory compaction pass
Granular Subgrade Unstabilized
Summary & CommentsSummary & Comments
TRB IC Workshop
Intelligent Compaction for Soils, Subbase, & Stabilized Base Field Demo Results - 21
Key FindingsKey FindingsConstruction processConstruction process--control control greatlygreatlyimprovedimprovedICIC--MVsMVs correlate to various incorrelate to various in--situ point situ point measurementsmeasurementsMeasurement influence depth varies Measurement influence depth varies depending on technology and site depending on technology and site conditionsconditionsMachine operation parameters influence Machine operation parameters influence MVsMVs
Key FindingsKey FindingsNeed better data visualization, Need better data visualization, correlation, transfer, archiving correlation, transfer, archiving tools/capabilitiestools/capabilitiesImplementation: (1) use ICImplementation: (1) use IC--MVsMVs as part of as part of ““intelligent QC/QAintelligent QC/QA””; (2) Link IC; (2) Link IC--MVsMVs to to mechanistic QA parameters in top 1~3 mmechanistic QA parameters in top 1~3 mStatistical analysis tools/protocols Statistical analysis tools/protocols –– need need to better understand link to performance!to better understand link to performance!
2010 Projects 2010 Projects -- SuggestionsSuggestionsEvaluate Implementation Approaches: Evaluate Implementation Approaches: –– (1) Use IC(1) Use IC--MVsMVs as part of as part of ““intelligent QC/QAintelligent QC/QA””; ; –– (2) Link IC(2) Link IC--MVsMVs to mechanistic QA to mechanistic QA
parameters in top 1~3 mparameters in top 1~3 mStatistical analysis tools/protocols Statistical analysis tools/protocols –– need need to better understand link to performance!to better understand link to performance!–– Need to start planning some longNeed to start planning some long--term case term case
studiesstudies–– Organize committee to review analysis Organize committee to review analysis
approachapproach