intelligence analysisinfo.publicintelligence.net/usarmy-intelanalysis.pdf · adp 2-0 and adrp 2-0...
TRANSCRIPT

FOR OFFICIAL USE ONLY
ATP 2-33.4
Intelligence Analysis
August 2014
DISTRIBUTION RESTRICTION: Distribution authorized to U.S. Government agencies and their contractors only, because it requires protection as specified by Memorandum, Deputy Chief of Staff, G-3/5/7, DAMO-ODA-A, 30 August 2010, subject: Operations Security Guidance for Counter-Improvised Explosive Device (C-IED) and Improvised Explosive Device Defeat (IEDD). This determination was made on 2 March 2013. Other requests for this document must be referred to ATTN: ATZS-CDI-D, U.S. Army Intelligence Center of Excellence, Fort Huachuca, AZ 85613-7017, or via e-mail at [email protected].
DESTRUCTION NOTICE: Destroy by any method that will prevent disclosure of contents or reconstruction of the document.
Headquarters, Department of the Army

This publication is available at Army Knowledge Online (https://armypubs.us.army.mil/doctrine/index.html). To receive publishing updates, please subscribe at
http://www.apd.army.mil/AdminPubs/new_subscribe.asp.

* ATP 2-33.4
DISTRIBUTION RESTRICTION: Distribution authorized to U.S. Government agencies and their contractors only because it requires protection as specified by Memorandum, Deputy Chief of Staff, G-3/5/7, DAMO-ODA-A, 30 August 2010, subject: Operations Security Guidance for Counter-Improvised Explosive Device (C-IED) and Improvised Explosive Device Defeat (IEDD). This determination was made on 2 March 2013. Other requests for this document must be referred to ATTN-ATZS-CDI-D, U.S. Army Intelligence Center of Excellence, Fort Huachuca, AZ 85613-7017, or via e-mail at [email protected].
DESTRUCTION NOTICE: Destroy by any method that will prevent disclosure of contents or reconstruction of the document.
*This publication supersedes TC 2-33.4, dated 1 July 2009.
i
FOR OFFICIAL USE ONLY
Army Techniques Publication
No. 2-33.4
Headquarters Department of the Army
Washington, DC, 18 August 2014
Intelligence Analysis
Contents Page
PREFACE...............................................................................................................v
INTRODUCTION ..................................................................................................vii
PART ONE ANALYSIS FUNDAMENTALS AND SKILLS
Chapter 1 FUNDAMENTALS OF INTELLIGENCE ANALYSIS ......................................... 1-1 Overview ............................................................................................................. 1-1 The Analytical Process ....................................................................................... 1-3 Single-Source Analysis ....................................................................................... 1-3 All-Source Intelligence ........................................................................................ 1-4 Collaboration ...................................................................................................... 1-4 Collaboration and the Intelligence Warfighting Function .................................... 1-5 Automation Support to Intelligence Analysis ...................................................... 1-5
Chapter 2 ANALYTIC SKILLS ............................................................................................ 2-1 Overview ............................................................................................................. 2-1 Basic Thinking Abilities ....................................................................................... 2-1 Critical and Creative Thinking............................................................................. 2-2 Avoiding Analytical Pitfalls .................................................................................. 2-9
PART TWO FUNDAMENTAL TASK TECHNIQUES
Chapter 3 BASIC STRUCTURED ANALYTIC TECHNIQUES........................................... 3-1 Overview ............................................................................................................. 3-1 Sorting ................................................................................................................ 3-2 Matrices .............................................................................................................. 3-3 Threat Intentions Matrix ...................................................................................... 3-5

Contents
ii ATP 2-33.4 18 August 2014
Event Mapping .................................................................................................... 3-6 Event Trees ......................................................................................................... 3-7 Subjective Probability .......................................................................................... 3-9 Weighted Ranking ............................................................................................. 3-11
Chapter 4 DIAGNOSTIC ANALYTIC TECHNIQUES.......................................................... 4-1 Overview ............................................................................................................. 4-1 Deception Detection ............................................................................................ 4-1 Key Assumptions Check ..................................................................................... 4-2 Quality of Information Check ............................................................................... 4-4 Indicators ............................................................................................................. 4-5 Conducting Studies ............................................................................................. 4-9
Chapter 5 CORE ARMY ANALYTIC TECHNIQUES .......................................................... 5-1 Overview ............................................................................................................. 5-1 Analytic Techniques ............................................................................................ 5-1 Section I – Developing Situational Understanding and Conclusions ......... 5-2 Brainstorming ...................................................................................................... 5-2 Comparison ......................................................................................................... 5-4 Mathematical Analysis ........................................................................................ 5-5 Situational Logic .................................................................................................. 5-8 Section II – Analyzing Complex Networks and Associations ...................... 5-8 Link Analysis ....................................................................................................... 5-8 Network Analysis ............................................................................................... 5-14 Sociometrics or Social Network Analysis .......................................................... 5-24 Section III – Conducting Pattern Analysis .................................................... 5-25 Chronologies ..................................................................................................... 5-26 Pattern Analysis Plot Sheet .............................................................................. 5-28 Incident Overlay ................................................................................................ 5-30 Pattern of Life Analysis ..................................................................................... 5-31
PART THREE CONSIDERATIONS FOR DECISIVE ACTION AND UNIQUE MISSIONS
Chapter 6 ANALYTIC SUPPORT TO DECISIVE ACTION ................................................. 6-1 Overview ............................................................................................................. 6-1 Analytic Support to Unified Land Operations ...................................................... 6-1 Analytic Support to Unique Activities ................................................................ 6-10
Chapter 7 ANALYTIC SUPPORT TO UNIQUE MISSIONS ................................................ 7-1 Overview ............................................................................................................. 7-1 Counterinsurgency .............................................................................................. 7-1 Counter-Improvised Explosive Device ................................................................ 7-2 Site Exploitation .................................................................................................. 7-4
Appendix A EMERGING ANALYTIC TECHNIQUES............................................................ A-1
Appendix B INDICATORS IN DECISIVE ACTION ............................................................... B-1
GLOSSARY .......................................................................................... Glossary-1
REFERENCES .................................................................................. References-1
INDEX ......................................................................................................... Index-1

Contents
18 August 2014 ATP 2-33.4 iii
Figures
Figure 2-1. The elements of thought ...................................................................................... 2-3 Figure 3-1. Matrix example ..................................................................................................... 3-4 Figure 3-2. Threat intention matrix ......................................................................................... 3-5 Figure 3-3. Example of event mapping .................................................................................. 3-6 Figure 3-4. Event tree example .............................................................................................. 3-8 Figure 3-5. Subjective probability example ............................................................................ 3-9 Figure 3-6. Weighted ranking example ................................................................................ 3-13 Figure 5-1. Matrix comparing courses of action ..................................................................... 5-4 Figure 5-2. Comparison of targets .......................................................................................... 5-5 Figure 5-3. Example association matrix ............................................................................... 5-10 Figure 5-4. Example activities matrix ................................................................................... 5-12 Figure 5-5. Example link diagram ......................................................................................... 5-13 Figure 5-6. Nodal linkage example ....................................................................................... 5-16 Figure 5-7. Hierarchical organization ................................................................................... 5-17 Figure 5-8. Networked organization and structural options example ................................... 5-18 Figure 5-9. Network chain .................................................................................................... 5-19 Figure 5-10. Network hub-and-wheel ................................................................................... 5-19 Figure 5-11. All-channel network .......................................................................................... 5-19 Figure 5-12. Affiliated associate network ............................................................................. 5-20 Figure 5-13. Centrality example ........................................................................................... 5-21 Figure 5-14. Network density comparison ............................................................................ 5-23 Figure 5-15. Example to change in tactics based on density shifts ..................................... 5-23 Figure 5-16. Fragmented network ........................................................................................ 5-24 Figure 5-17. Timeline example ............................................................................................. 5-27 Figure 5-18. Time event chart example ................................................................................ 5-28 Figure 5-19. Pattern analysis plot sheet example ................................................................ 5-29 Figure 5-20. Incident overlay example ................................................................................. 5-30 Figure 7-1. Example of an improvised explosive device activity model ................................. 7-3 Figure A-1. Futures wheel example .....................................................................................A-18
Tables
Introductory table 1. Summary of changes ............................................................................... vii Table 2-1. Checklist for reasoning .......................................................................................... 2-5 Table 3-1. Subjective probability table ................................................................................. 3-10 Table 6-1. Use of basic diagnostic analytical techniques ....................................................... 6-5 Table 6-2. Use of core Army analytical techniques ................................................................ 6-6 Table 6-3. Use of emerging and other structured analytical techniques ................................ 6-8 Table 7-1. Possible nodes located in an improvised explosive device network ..................... 7-3

Contents
iv ATP 2-33.4 18 August 2014
Table B-1. Offensive indicators .............................................................................................. B-2 Table B-2. Defensive indicators ............................................................................................. B-3 Table B-3. Delaying indicators ............................................................................................... B-4 Table B-4. Withdrawal indicators ........................................................................................... B-5 Table B-5. Population indicators ............................................................................................ B-5 Table B-6. Propaganda indicators ......................................................................................... B-7 Table B-7. Commodities indicators ........................................................................................ B-8 Table B-8. Environment-related indicators ........................................................................... B-10 Table B-9. Improvised explosive device indicators, observables, and signatures ............... B-10 Table B-10. Threat environment indicators .......................................................................... B-11 Table B-11. Recurrence of same-clan indicators ................................................................. B-11

18 August 2014 ATP 2-33.4 v
Preface
ATP 2-33.4 provides information on how intelligence personnel conduct intelligence analysis in support of unified land operations. It describes approaches used to conduct intelligence analysis and describes how intelligence analysis assists commanders with understanding the complex environments in which Army forces conduct operations. This manual emphasizes the act of intelligence analysis as a collaborative networked activity. This manual complements doctrinal guidance provided in ADP 2-0 and ADRP 2-0.
ATP 2-33.4 provides direction for intelligence personnel at all echelons. The principal audience for ATP 2-33.4 is Army intelligence officers, noncommissioned officers, Soldiers, and civilians. This publication provides guidelines for the conduct of intelligence analysis to commanders and staffs of Army units and is recommended for incorporation into institutional programs of instruction and unit training. Commanders and staffs of Army headquarters serving as joint task force or multinational headquarters should also refer to applicable joint or multinational doctrine concerning the range of military operations and joint or multinational forces. Trainers and educators throughout the Army will also use this manual.
Commanders, staffs, and subordinates ensure their decisions and actions comply with applicable U.S., international, and, in some cases, host-nation laws and regulations. Commanders at all levels ensure their Soldiers operate in accordance with the law of war and the rules of engagement. (See FM 27-10.)
This publication contains copyrighted material.
ATP 2-33.4 uses joint terms where applicable. Selected joint and Army terms and definitions appear in both the glossary and the text. For definitions shown in the text, the term is italicized and the number of the proponent publication follows the definition.
ATP 2-33.4 applies to the Active Army, the Army National Guard/Army National Guard of the United States, and the United States Army Reserve unless otherwise stated.
The proponent of ATP 2-33.4 is the U.S. Army Intelligence Center of Excellence. The preparing agency is the Capabilities Development and Integration Division, U.S. Army Intelligence Center of Excellence, Fort Huachuca, Arizona. Send comments and recommendations on a DA Form 2028 (Recommended Changes to Publications and Blank Forms) to Commander, U.S. Army Intelligence Center of Excellence, ATTN ATZS-CDI-D (ATP 2-33.4), 550 Cibeque Street, Fort Huachuca, AZ 85613-7017; by e-mail to [email protected]; or submit an electronic DA Form 2028.

vi ATP 2-33.4 18 August 2014
Acknowledgements
The critical thinking material has been used with permission from The Foundation for Critical Thinking, www.criticalthinking.org, The Thinker’s Guide to Analytic Thinking, 2012 and The Miniature Guide to Critical Thinking: Concepts and Tools, 2009, by Dr. Linda Elder and Dr. Richard Paul. The copyright owners have granted permission to reproduce material from their works. With their permission, some of the text has been paraphrased and adapted for military purposes.

18 August 2014 ATP 2-33.4 vii
Introduction
ATP 2-33.4 discusses doctrinal techniques: non-prescriptive ways or methods for performing missions, functions, or tasks as they apply to intelligence analysis. The intelligence warfighting function focuses first on the threat network and second on the neutral network. ATP 2-33.4—
• Discusses analysis techniques performed by all intelligence Soldiers and civilians in each of the intelligence disciplines.
• Describes the steps involved in implementing the analytic techniques presented.
• Describes critical thinking in detail.
Note. Critical thinking is a deliberate process of thought used to objectively evaluate data. Critical thinking is the process of analyzing and assessing thinking with a view to improving it. Critical thinking presupposes knowledge of the most basic structures in thinking (the elements of thought) and the most basic intellectual standards for thinking (universal intellectual standards). Critical thinking is key to the analysis conducted to better understand situations.
ATP 2-33.4 does not contain—
• Fundamentals on intelligence and the Army’s intelligence warfighting function. ADP 2-0 and ADRP 2-0 describe this doctrine.
• Techniques used to perform intelligence preparation of the battlefield (IPB). FM 2-01.3 contains this doctrine.
• Information on how tasks specific to individual intelligence disciplines are conducted. Discipline-specific publications contain this doctrine.
• Information on manning documents or intelligence support to the various echelons. This information is contained in publications on intelligence support to brigade combat teams, corps, divisions, and echelons above corps.
Introductory table 1 outlines the changes in ATP 2-33.4.
Introductory table 1. Summary of changes
Chapter 1—Fundamentals of Intelligence Analysis
Chapter 1 is a revision of chapter 1 of the previous manual and provides— • An overview discussion on the intelligence analysis process.
• An introductory discussion of single- and all-source analysis.
• A discussion of collaboration and automation support to intelligence analysis. The redundant material from the previous manual was removed. This included information on the intelligence warfighting function, the intelligence analyst, the intelligence process, intelligence preparation of the battlefield, the intelligence running estimate, and the military decisionmaking process. Chapter 2—Analytic Skills
Chapter 2 is a new chapter that discusses— • Basic thinking abilities.
• Critical and creative thinking.
• How to identify and avoid analytical pitfalls.

Introduction
viii ATP 2-33.4 18 August 2014
Introductory table 1. Summary of changes (continued)
Chapter 3—Basic Structured Analytic Techniques
Chapter 3 is a revision of portions of chapter 5 of the previous manual, which consolidated all the analytical tools and techniques. ATP 2-33.4 subdivides these analytical tools and techniques into three chapters (chapters 3, 4, and 5). Chapter 3—
• Describes the basic structured analytical techniques necessary to support problem solving.
• Discusses techniques that include sorting, matrices, threat intentions matrix, event mapping, event trees, subjective probability, and weighted ranking.
Chapter 4—Diagnostic Analytic Techniques
Chapter 4 is a revision of portions of chapter 5 of the previous manual, which consolidated all the analytical tools and techniques. ATP 2-33.4 subdivides these analytical tools and techniques into three chapters (chapters 3, 4, and 5). Chapter 4—
• Discusses the primary purpose of diagnostic techniques to make analytic arguments, assumptions, and/or intelligence gaps more transparent.
• Discusses techniques that include deception detection, key assumptions check, quality of information check, indicators, and argument mapping.
Chapter 5—Core Army Analytic Techniques
Chapter 5 is a revision of portions of chapter 5 of the previous manual, which consolidated all the analytical tools and techniques. ATP 2-33.4 subdivides these analytical tools and techniques into three chapters (chapters 3, 4, and 5). Chapter 5—
• Discusses the core Army analytic techniques used at the strategic, operation, and tactical levels and are routinely used by Army intelligence personnel conducting intelligence analysis.
• Discusses core Army techniques often incorporated into multiple basic structured analytic techniques in combination with diagnostic techniques.
Chapter 6—Analytic Support to Decisive Action
Chapter 6 is a new chapter that discusses the analytical support to decisive action. It— • Addresses the analytical support process to offensive, defensive, stability, and defense support to
civil authorities tasks.
• Describes analytical support to unique operations, to include building partnership capacity, protection, and synchronizing information-related capabilities.
Chapter 7—Analytic Support to Unique Missions
Chapter 7 is a new chapter which discussed the analytic support required in unique missions. Unique missions discussed in this chapter include—
• Counterinsurgency.
• Counter-Improvised Explosive Devices.
• Site Exploitation.
Appendix A—Emerging Analytic Techniques
Appendix A discusses in detail some of the more common techniques in use at the strategic and operational levels. These techniques discussed are categorized under contrarian techniques, imaginative techniques, and basic structured analytic techniques, although there is often overlap in specific techniques.
Appendix B—Indicators in Decisive Action
Appendix B discusses and provides extensive examples of various indicators. The examples identify the different types of indicators, as well as applicable activities. These tables are exemplary, not all inclusive. The examples are designed to provide a starting point for more in-depth specific analysis for an operation.
Term Changes
Not applicable.

18 August 2014 ATP 2-33.4 1-1
PART ONE
Analysis Fundamentals and Skills
Chapter 1
Fundamentals of Intelligence Analysis
This chapter discusses the fundamentals of intelligence analysis. It defines the intelligence analysis process and describes this process for single-source and all-source analysis. This chapter also addresses collaboration through the intelligence warfighting function and the automation support required to effectively perform the analysis process.
OVERVIEW 1-1. Analysis is the examination of information in detail in order to understand it better and evaluate data in order to develop knowledge or conclusions. Information is processed data of every description which may be used when conducting analysis; information generally provides some of the answers to who, what, where, and when questions. Knowledge is the fact or condition of knowing something with familiarity gained through experience or association derived from information, facts, and descriptions. Knowledge helps ascribe meaning and value to the conditions or events within an operation. Analysis performed by intelligence personnel helps create knowledge in support of decisionmaking.
1-2. Commanders make decisions based on their understanding of the environment in which they are operating; intelligence analysis aids the commander in gaining the situational understanding necessary to decisionmaking. Forming a coherent intelligence picture during the decisionmaking process is difficult. In addition to determining how the physical environment may affect operations, intelligence personnel must assess how the presence and actions of thinking threats and civilian populations can influence situations and affect desired outcomes. Intelligence personnel must often assess extremely complex situations.
1-3. Intelligence personnel must accept and embrace ambiguity in conducting analysis. Training, knowledge, and experience are all critical parts of dealing with uncertainty. Intelligence personnel never have all the information necessary to make an intelligence assessment. To be effective, intelligence personnel must have a detailed awareness of their commander’s requirements and a thorough understanding of the intelligence process and its ability to satisfy those requirements. Combining good analytical techniques with area knowledge and experience is the best combination to provide accurate, meaningful assessments to commanders and leaders. Subject matter expertise alone will not guarantee the development of logical or accurate conclusions. Intelligence personnel must also know how to arrive at logical, well-reasoned, unbiased conclusions based on analysis. To help alleviate the ambiguity, intelligence analysts should identify gaps in their understanding of the operational environment.

Chapter 1
1-2 ATP 2-33.4 18 August 2014
The Complexity of the Intelligence Task From 2003 to 2007 intelligence personnel supporting brigade combat team operations in Ninewa Province, Iraq, had to provide commanders with intelligence assessments for an area over 60,000 square kilometers influenced by three regional powers, 3 internal governorates, 14 urban centers, and a population of over 4 million people comprised of 4 major ethnic groups and 24 individual tribes. In addition to these factors, the area of operations was also affected by an externally supported insurgency comprised of over 5 separate major insurgent groups subdivided into over 70 separate operational cells. Additionally, all indigenous governmental, civil, and security organizations had been infiltrated by threat groups. Essential services were in disarray and security was a constant problem. The attitude of the population toward U.S. forces was mixed and heavily influenced by insurgent organizations. Unit boundaries were porous and not defendable. The complexity of the situation forced intelligence personnel to continually reassess what they thought they knew and continually revise the intelligence estimate in support of operations.
1-4. The goal of analysis is to provide the best possible intelligence, in a timely manner, to commanders and leaders in order to support their decisionmaking. Analysts must gear their efforts to the time available. Employing proven analytical techniques and having a high level of understanding of their area of operations (AO) are a key component in overcoming denial and deception. Operational planning and execution impose time constraints that must be considered. This may require assessments to be provided without all the information analysts would like to form their conclusions but timely enough to affect operations. Analysts should keep in mind that logical conclusions are not necessarily truth. When presenting conclusions, intelligence personnel should state the degree of confidence they have in their conclusions and any significant issues with the analysis. This confidence level is based normally on the capability of the collection asset, evaluative criteria, the confidence in the collected data, and expertise and experience of the analyst.
1-5. The conclusions reached during intelligence analysis should also adhere to the analytic standards established by the Director of National Intelligence in Intelligence Community Directive Number 203 published 21 June 2007. This directive establishes the analytic standards that govern the production and evaluation of national intelligence analysis to meet the highest standards of integrity and rigorous analytic thinking. These standards act as guidelines and goals for analysts and managers throughout the intelligence community who strive for excellence in their analytic work practices and products. Although created for national-level intelligence agencies, these standards are valid at the operational and tactical level as well. The following list identifies these standards. Intelligence analysis should be—
Objective. Timely. Based on all available sources of intelligence. Exhibit proper standards of analytic tradecraft. Properly describe quality and reliability of underlying sources. Properly caveat and express uncertainties or confidence in analytical judgments. Properly distinguish between underlying factual intelligence and the assumptions and judgments
used to form a conclusion. Consider and explain alternative hypotheses. Relevant, providing information and insight on issues important to the intended consumer and/or
provide useful context, warning, or opportunity analysis. Facilitate clear understanding on the information and reasoning underlying analytic judgments
(logical argumentation). Consistent with previous production on the topic or, if the key analytic message has changed,
highlight the change and explain its rationale and implications. Accurate. Intelligence personnel should apply expertise and logic to make the most accurate
judgments and assessments possible given available information and known information gaps.

Fundamentals of Intelligence Analysis
18 August 2014 ATP 2-33.4 1-3
THE ANALYTICAL PROCESS 1-6. Intelligence analysis is the process by which collected information is evaluated and integrated with existing information to produce intelligence. The steps of the all-source intelligence analysis process are evaluate, analyze, and synthesize. This process is dynamic and continuously integrates new and existing data throughout the effort. It also ensures that all data goes through a criterion-based logical process of determining its value prior to updating existing assessments. For the purpose of this process—
Evaluate is when the data of reporting are assigned a value respective to the source and application of the data.
Analyze is when data from information reports is dissected into each subcomponent of the report. Synthesize is when the data is combined with previous holdings to update existing products,
which potentially creates new assessments (or corroborates the existing ones, although new data may change previously accepted assessments).
1-7. Analysis requires the continuous examination of information, intelligence, and knowledge about the threat and significant aspects of the operational environments to build a body of intelligence in order to reach a conclusion. Intelligence analysis is performed by intelligence personnel and other personnel conducting intelligence analytical tasks.
1-8. Intelligence analysis is enabled by the ability to order information, recognize patterns, and reason soundly; the ability to apply critical and creative thinking; and the application of analytic techniques. Each of these abilities is discussed fully in chapter 2. The application of various analytical techniques is designed to aid in the evaluation of specific situations, conditions, entities, areas, devices, or problems. These techniques are described in detail in chapters 3 through 5.
1-9. Unlike IPB or planning requirements and assessing collection—which are processes that follow specific steps and are tied to other larger processes—intelligence analysis is a combination of unique activities that occur within all-source intelligence and each of the Army’s intelligence disciplines. For example, many of the processes, activities, and techniques used by signals intelligence (SIGINT) analysts will differ from those used by human intelligence collectors. Yet, each examines information and intelligence products and builds knowledge about the threat and other significant aspects of the environment.
1-10. Working together, the individual members of each intelligence discipline within an intelligence organization conduct intelligence analysis as part of an integrated and collaborative team focused on providing timely, relevant, and accurate intelligence to the commander. The evaluation of information collected by single-source intelligence collection assets leads to the development of all-source intelligence products and assessments.
SINGLE-SOURCE ANALYSIS 1-11. Army intelligence personnel ensure the best possible intelligence is always available to support the commander. Intelligence personnel do this by integrating the information compiled and analyzed within each intelligence discipline or complementary intelligence capability and by integrating the knowledge, judgment, experience, expertise, and perceptions of members of the intelligence community through collaboration and dialogue.
1-12. U.S. Army intelligence personnel work within seven different intelligence disciplines that are organized to collect, process, produce, and disseminate intelligence: counterintelligence, geospatial intelligence, human intelligence, measurement and signature intelligence, open-source intelligence, SIGINT, and technical intelligence. Each of these intelligence disciplines are integral components of the Army’s multidiscipline intelligence support to operations and routinely use information and intelligence generated within the other disciplines to aid the analytical effort. The intelligence analysis process—evaluate, analyze, synthesize— within each intelligence discipline is the same as the process used in all-source analysis.
1-13. Complementary intelligence capabilities contribute valuable information for all-source intelligence to facilitate the conduct of operations. The complementary intelligence capabilities are specific to the unit and

Chapter 1
1-4 ATP 2-33.4 18 August 2014
circumstances at each echelon and can vary across the intelligence enterprise. These capabilities, further discussed in ADRP 2-0, include but are not limited to—
Biometrics-enabled intelligence. Cyber-enabled intelligence. Document and media exploitation. Forensic-enabled intelligence.
ALL-SOURCE INTELLIGENCE 1-14. All-source intelligence is the integration of intelligence and information from all relevant sources in order to analyze situations or conditions that impact operations (ADRP 2-0). Army forces conduct operations based on all-source intelligence assessments and products developed by the intelligence staff. All-source intelligence is used to develop the intelligence products necessary to aid the commander’s situational understanding and the staff’s situational awareness, as well as to support the development of plans and orders and answer the units’ operational requirements. Although all-source intelligence normally takes longer to produce, it is more reliable and less susceptible to deception than single-source analysis.
1-15. All-source intelligence analysts are responsible for producing intelligence products related to threat and civil considerations based on the analysis of information and intelligence provided by the other intelligence disciplines and reporting by non-intelligence organizations.
COLLABORATION 1-16. Collaboration is communication, cooperation, and coordination. It is a process where two or more individuals or groups work together on a common problem or task to achieve a common goal by sharing knowledge and building consensus. Effective collaboration includes continuous dialogue that leads to increased understanding. Effective collaboration also results in identifying dissent among participants. Collaboration requires the candid exchange of ideas or opinions among participants and encourages frank discussions when disagreement occurs. Decisionmakers should be made aware of dissent among participants and be given the opportunity to review the reasons for that dissent as part of forming an independent judgment. Creating rank barriers is not conducive to collaboration. Rank does not equate to experience, knowledge, or best analytical practice.
1-17. Intelligence professionals must continually strive to improve collaboration. The following actions can help build and maintain collaborative relationships:
Give and receive feedback from participants. Share credit with others for good ideas. Acknowledge others’ skills, experience, and contributions. Listen to, and acknowledge the feelings, concerns, opinions, and ideas of others. Help peers or team members explain their ideas. State personal opinions and areas of disagreement tactfully. Listen patiently to others in conflict situations. Define problems with people or processes in a non-threatening manner. Support group conclusions even if not in total agreement. Give and seek input from others when forming conclusions. Assist others in solving problems and completing individual tasks. Share information, ideas, and suggestions. Ask for help in identifying and achieving goals. Notify others in a timely manner of changes or problems related to a task. Make procedural suggestions to encourage progress toward goals. Hold regular synchronization meetings to foster communication, cooperation, and focus
collection among the various intelligence sections.

Fundamentals of Intelligence Analysis
18 August 2014 ATP 2-33.4 1-5
1-18. Personnel involved in intelligence analysis can be involved in collaboration and dialogue on one or two levels:
First, as part of a commander’s staff, collaboration and dialogue occur as a formal process. Throughout operations, commanders, subordinate commanders, staffs, and other partners collaborate and dialogue actively; sharing and questioning information, perceptions, and ideas to better understand situations and make decisions. (See ADP 5-0 and ADRP 5-0 for more information on collaboration and dialogue as a formal process.)
Second, collaboration and dialogue occur continually as an informal process throughout intelligence analysis that promotes the free-flowing exchange of information and ideas among and with other command posts horizontally and vertically across echelons. This form of collaboration is generally not structured and requires individual effort and a team mentality to be successful. Both of these forms of collaboration are aided by participation within the intelligence warfighting function.
COLLABORATION AND THE INTELLIGENCE WARFIGHTING FUNCTION
1-19. Experiences in contemporary military operations in Iraq and Afghanistan have shown that commanders at all echelons need access to more information than their organic information collection assets can provide and more intelligence than their intelligence staffs can produce. Experiences in these operations have also shown that intelligence staffs that routinely collaborate and share data with higher, adjacent, and subordinate intelligence organizations are more able to provide the information and intelligence commanders need.
1-20. The Defense Intelligence Agency has adopted an enterprise approach to its intelligence operations, creating an integrated and interconnected virtual construct that facilitates information sharing, collaboration, analytical support, and intelligence synchronization. The Defense intelligence enterprise is defined as the Defense intelligence community; essentially, those organizations within the Department of Defense that have an intelligence mission and/or function.
1-21. The Army has also adopted an enterprise approach to intelligence. The intelligence warfighting function is the Army’s contribution to the Defense intelligence enterprise. The intelligence warfighting function operates on a digital information and intelligence architecture that assists intelligence personnel at all levels in producing intelligence and synchronizing intelligence support to commanders. The intelligence warfighting function can leverage support from the Defense intelligence enterprise or partner nations, and non-military members of the intelligence community. An enterprise is a cohesive organization whose structure, governance systems, and culture support a common purpose. An enterprise approach educates and empowers leaders to take a holistic view of organizational objectives and processes. It encourages leaders to act cohesively for the good of the whole to achieve required output with greater efficiency. (See ADRP 2-0, chapter 2, for additional information on the intelligence warfighting function.)
AUTOMATION SUPPORT TO INTELLIGENCE ANALYSIS 1-22. Automation and communications systems are vital to intelligence analysis and facilitate real-time collaboration, detailed operational planning, support to planning requirements, and assessing collection, as well as providing enhanced collection and source exploitation tools. Emerging technology continues to improve the entire intelligence analysis system to operate more effectively. All communication, collaboration, and intelligence analysis within the intelligence warfighting function is facilitated by the Distributed Common Ground System-Army (DCGS-A).
1-23. DCGS-A provides a network-centric, enterprise intelligence, weather, geospatial engineering, and space operations capabilities to maneuver, maneuver support, and sustainment organization at all echelons from battalion to joint task forces. The DCGS-A integrates intelligence tasking, collection, processing, and dissemination across the Army and joint intelligence community. DCGS-A provides Army forces (through all phases of training and deployment) with a fully compatible information collection ground processing system capable of supporting each computing environment.

Chapter 1
1-6 ATP 2-33.4 18 August 2014
1-24. As an element of the Army Mission Command System (MCS), the core functions of DCGS-A are tasking of intelligence sensors, processing of data, exploitation of data, and dissemination of intelligence information about the threat, weather, and terrain at all echelons. DCGS-A facilitates these functions by—
Receiving and processing select Joint and Army intelligence sensor data. Controlling select Army sensor systems. Fusing sensor information. Providing weather-effects data for relevant threat, nonaligned, friendly, and environmental
conditions. Providing a standard and sharable geospatial foundation to all common operational and
computing environments. Aiding intelligence personnel with—
Data mining and research. Collaborating in real time. Conducting link and pattern analysis. Developing threat and other IPB graphic templates. Conducting information collection synchronization. Maintaining intelligence databases and data files. Automatically disseminating information.
1-25. DCGS-A operates across all echelons, all security and network domains (Unclassified, Secret, Top Secret, Joint Worldwide Intelligence Communications Systems [also called JWICS], and National Security Agency Network), to include multinational networks, and within and across all computing environments. DCGS-A network-enabled capability enhances operations by allowing data access down to the battalion level. DCGS-A provides users access to raw sensor data, reports, graphics, and Web services through the DCGS-A Integration Backbone. The DCGS-A Integration Backbone—
Creates the core framework for distributed, network-enabled intelligence enterprise architecture. Enables DCGS-A to task, process, post, and use data from Army, Joint, and National sensors. Provides a metadata catalog that defines how you describe data. The metadata allows DCGS-A
to expose the required data elements to the user.
1-26. As the intelligence component of Army’s MCS, DCGS-A provides unprecedented timely, relevant, and accurate targetable data to the Warfighter. DCGS-A is fully interoperable with the Army’s MCS and provides access to data, information, and intelligence to support the commander’s visualization and information collection. It provides a flattened network enabling information discovery, collaboration, production, and dissemination to combatant commanders and staffs along tactical timelines to enable units the ability to synchronize their maneuver and fires more effectively.
1-27. DCGS-A gives commanders a view of the operational environments by providing two-dimensional and three-dimensional geospatial and weather products. It also provides single-, multi-, and all-source fused information and intelligence on the enemy and nonaligned and friendly forces, including updating the running estimate and view of the common operational picture.
1-28. DCGS-A provides users the capability to access and develop products of information and intelligence continuously from all sources. It also provides the ability to conduct planning requirements and to assess collection and geospatial collection management, content management, database management and synchronization, analysis, production, and standardized dissemination.
1-29. DCGS-A will provide access to many databases that include those managed by the Defense Intelligence Agency, the National Security Agency, the National Geospatial-Intelligence Agency, the National Ground Intelligence Center, and the Army Geospatial Center. DCGS-A will also access nontraditional information sources used by intelligence analysts, such as Army Civil Affairs, Military Information Support Operations, Department of State, Federal Bureau of Investigation, human terrain teams, and Department of Defense Biometrics and Forensics Enterprises.

18 August 2014 ATP 2-33.4 2-1
Chapter 2
Analytic Skills
This chapter discusses the analytical skills required to successfully analyze information. It describes basic thinking abilities, critical and creating thinking, and avoiding analytical pitfalls.
OVERVIEW 2-1. The conclusions reached during intelligence analysis must be objective and supported by facts and reasonable assumptions. When communicating the results of intelligence analysis, the analyst must ensure the commander and the staff understand not just the conclusion reached but how the analyst arrived at the conclusion. This allows the commander and the staff to challenge the analysis based on objective measures. In doing this, the analyst leverages the experience and analytical skill of the organization’s most senior personnel.
BASIC THINKING ABILITIES 2-2. Army intelligence personnel are required to utilize a number of basic abilities and complex skills to analyze information. All of these skills are related to the analyst’s ability to think. As an activity, intelligence analysis is primarily focused on thinking. Intelligence analysts must continually strive to improve the quality of their thinking. There are three basic thinking abilities required for intelligence analysis: information ordering, pattern recognition, and reasoning.
INFORMATION ORDERING
2-3. Information ordering is the ability to follow previously defined rules or sets of rules to arrange data in a meaningful order. In the context of intelligence analysis, this ability allows people, often with the assistance of technology, to arrange information in ways that permit analysis, synthesis, and a higher level of understanding. The arrangement of information according to certain learned rules leads the analyst to make conclusions and disseminate them as intelligence. A danger arises, however, in that such ordering is inherently limiting—the analyst may not look for alternative explanations because the known rules lead to an easy conclusion.
PATTERN RECOGNITION
2-4. Humans detect patterns and impose patterns on apparently random entities and events in order to understand them, often doing this without being aware of it. Intelligence analysts impose or detect patterns to identify relationships, and often to infer what they will do in the future. Pattern recognition lets analysts separate the important from the less important, even the trivial, and to conceptualize a degree of order out of apparent chaos. However, imposing or seeking patterns can introduce bias. Analysts may impose culturally defined patterns on random aggregates rather than recognize inherent patterns, thereby misinterpreting events or situations.
REASONING
2-5. The ability to reason is what permits humans to process information and formulate explanations, to assign meaning to observed actions and events. There are four types of reasoning that guide analysts in transforming information into intelligence: inductive reasoning, analogical reasoning, deductive reasoning, and abductive reasoning.
Chapter 2
2-2 ATP 2-33.4 18 August 2014
Inductive Reasoning
2-6. Inductive reasoning is an approach in which a drawn conclusion is based upon observed facts. It is a process of discovery in which an analyst establishes a relationship between events under observation or study. Induction normally precedes deduction and is the type of reasoning analysts are required to perform most frequently. It requires objectivity and the elimination of prejudices and preconceptions. The first step of inductive reasoning is reaching a conclusion formulated on facts gathered by direct observation.
2-7. Unlike deductive reasoning, inductive reasoning can be a new source of knowledge; however, to be used correctly, the analyst must be wary that their personal bias may skew the results. Inductive reasoning is dependent upon accurate observation and statistics. Tainted data negatively affects inductive reasoning; therefore, this reasoning cannot produce absolute truth, only very high probabilities. For example, if a unit’s patrols are being ambushed along route blue from 0500 to 1800 four to six days a week; inductive reasoning would lead to the conclusion that there is a 57 to 85 percent chance that daily patrols would be attacked.
Analogical Reasoning
2-8. Analogical reasoning is a method of processing information that compares the similarities between new concepts and understood concepts; then those similarities are used to gain an understanding of the new concept. Consider the following two incidents:
First, a patrol diverts around an obstacle and subsequently comes under fire from the roof of an abandoned building.
Second, a convoy diverts around a destroyed section of road, taking an alternate route and subsequently encounters an ambush from surrounding hilltops.
2-9. The analogy that can be drawn from these two incidents is this: when obstacles force us into an unplanned route, beware of ambush from elevation or concealment.
Deductive Reasoning
2-10. Deductive reasoning applies general rules to specific problems to arrive at conclusions. Analysts begin with a set of rules and use them as a basis for interpreting information. A deductive argument is sound if its premises are true. However, sound deductive reasoning does not mean the conclusions are true. For example, an analyst who follows the conduct of improvised explosive device (IED) attacks in an AO might notice that a characteristic series of events preceded the last IED attack. Upon seeing evidence that those same events are recurring, the analyst might deduce that another IED attack may occur. However, this conclusion should be made cautiously, as deduction is not always effective in forecasting human behavior; and, as stated previously, sound reasoning does not guarantee the conclusion is true.
Abductive Reasoning
2-11. Abductive reasoning describes the thought process that accompanies insight or intuition. When the information does not match what is expected, the analyst must determine the reason, thereby generating a new hypothesis that explains why the given evidence does not readily suggest a familiar explanation. For example, a group of people have been aiding U.S. operations in a particular area for several months; that support has now stopped. In fact, reports indicate this group has been supporting insurgent forces. Abductive reasoning will lead to the analyst looking at this situation to ask why this dynamic has changed, as well as to develop and test possible explanations.
2-12. The quality of any type of reasoning is based on how well that individual’s analytical skills have been developed. Skills are developed through practice and application. Each of these skills can be improved through the implementation of individual courses of study and organizational training strategies.
CRITICAL AND CREATIVE THINKING 2-13. Critical thinking is a deliberate process of thought whose purpose is to improve our thought. The elements of thought (the parts of our thinking) and the standards of thought (the quality of our thinking)
Analytic Skills
18 August 2014 ATP 2-33.4 2-3
support critical thinking. Key critical thinking attributes include human traits such as intellectual courage, integrity, and humility. Creative thinking involves creating something new or original.
2-14. Analysts use thinking to transform information into intelligence. Critical thinking can improve many tasks and processes across Army operations, especially the conduct of intelligence analysis. Critical thinking includes the intellectually disciplined activity of actively and skillfully analyzing and synthesizing information. The key distinction in critical thinking is a reflective and self-disciplined approach to thinking.
2-15. For the analyst, the first step in building critical thinking skills is to begin a course of personal study and practice with a goal of improving the ability to reason. This means moving outside the Army body of doctrine and other Army professional writing when beginning this study. The vast majority of the body of thought concerning critical thinking is spread throughout various civilian professions, particularly in academia. The discussion in this publication is intended to be an introduction that serves as a glimpse of what should become a professional endeavor.
2-16. The Army has used many different sources in its doctrinal discussions of critical thinking. Among those most cited, as well as those used in the development of this discussion, are Dr. Richard Paul and Dr. Linda Elder of the Foundation for Critical Thinking. This foundation has developed many products useful to Army leaders and Soldiers in developing critical thinking skills. Of these, the elements of thought, intellectual standards, and intellectual traits are the most useful tools analysts can initially apply to further their critical thinking skills. These skills can also aid in avoiding the common pitfalls of undisciplined thinking. These analytic pitfalls—logic fallacies, biases, and misusing analogies—are discussed beginning at paragraph 2-32.
ELEMENTS OF THOUGHT
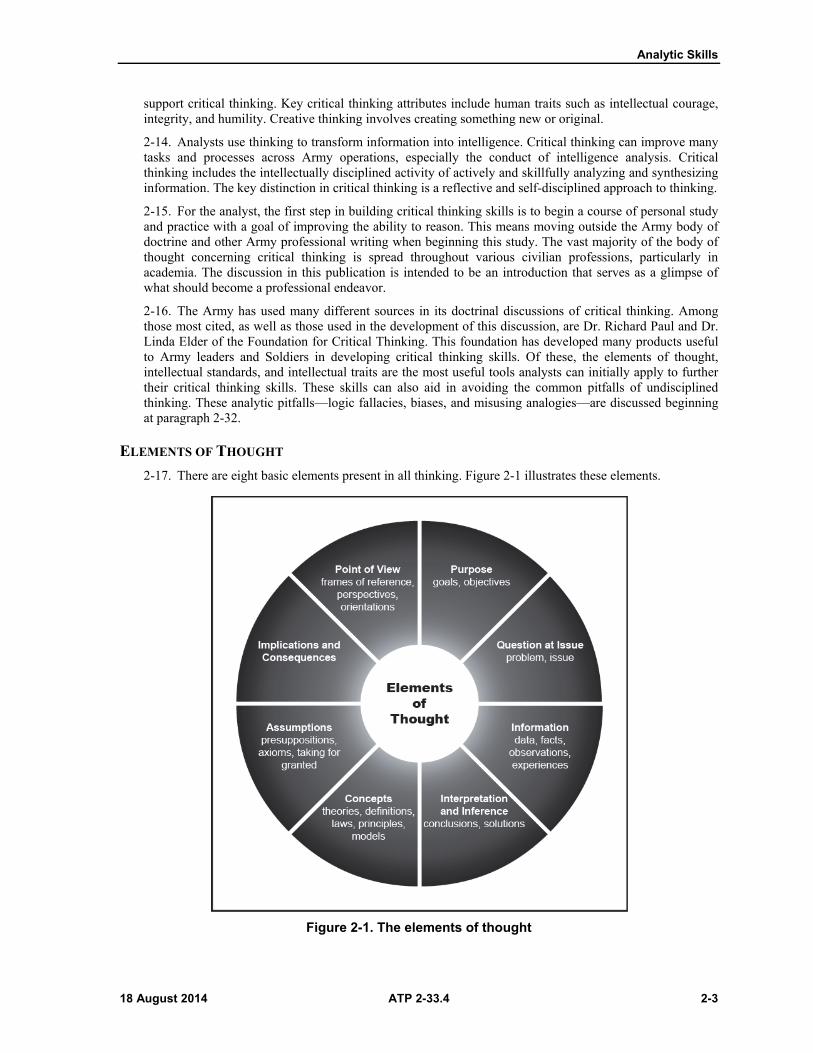
2-17. There are eight basic elements present in all thinking. Figure 2-1 illustrates these elements.
Figure 2-1. The elements of thought

Chapter 2
2-4 ATP 2-33.4 18 August 2014
2-18. Whenever we think, we think for a purpose within a point of view based on assumptions leading to implications and consequences. We use concepts, ideas, and theories to interpret data, facts, and experiences in order to answer questions, solve problems, and resolve issues. These eight elements help describe how critical thinking works:
Element 1—Purpose. All thinking has a purpose. Critical thinkers will state the purpose clearly. Being able to distinguish the purpose from other related purposes is an important skill critical thinkers possess. Checking periodically to ensure staying on target with the purpose is also important.
Element 2—Question at Issue. All thinking is an attempt to figure something out, to settle some question, or to solve some problem. A critical thinker is able to state questions clearly and precisely, express the questions in several ways to clarify their meaning and scope, and break the questions into sub-questions.
Element 3—Information. All thinking is based on data, information, and evidence. Critical thinkers should support their conclusions with relevant information and be open to actively searching for information that supports as well as contradicts a position. All information should be accurate, clear, and relevant to the situation being analyzed.
Element 4—Interpretation and Inference. All thinking contains interpretations and inferences by which to draw conclusions and give meaning to data. Critical thinkers should be careful to infer only what the evidence implies and to crosscheck inferences with each other. They should clearly identify the assumptions and concepts which led to the inferences being made. Alternative inferences or conclusions should be considered. Developing and communicating well-reasoned inferences is the most important part of what intelligence analysts provide because of the role it plays in aiding situational understanding and decisionmaking.
Element 5—Concepts. All thinking is expressed through, and shaped by, concepts. A concept is a generalized idea of a thing or a class of things. People do not always share the same concept of a thing. For example, the concept of happiness means something different to each of us. This is because happiness comes in many different forms. For a star athlete happiness may be winning and for a mother happiness may be seeing her children do well. Critical thinkers identify the meaning they ascribe to the key concepts used in their arguments and determine if others in their group ascribe different meanings to those concepts to ensure effective communication.
Element 6—Assumptions. All thinking is based, in part, on assumption. An assumption is a proposition accepted to be true without the availability of fact to support it. Assumptions are layered throughout our thinking and are a necessary part of critical thinking. The availability of fact determines the amount of assumption an analyst must use in analysis. Critical thinkers clearly identify their assumptions and work to determine if they are justifiable.
Element 7—Implications and Consequences. All thinking leads somewhere or has implications and consequences. Analysts should take the time to think through the implications and consequences that follow from their reasoning. They should search for negative as well as positive implications.
Element 8—Point of View. All thinking is done from some point of view. To think critically analysts must recognize a point of view, seek other points of view, and look at them fair-mindedly for their strengths and weaknesses.
CHECKLIST FOR REASONING
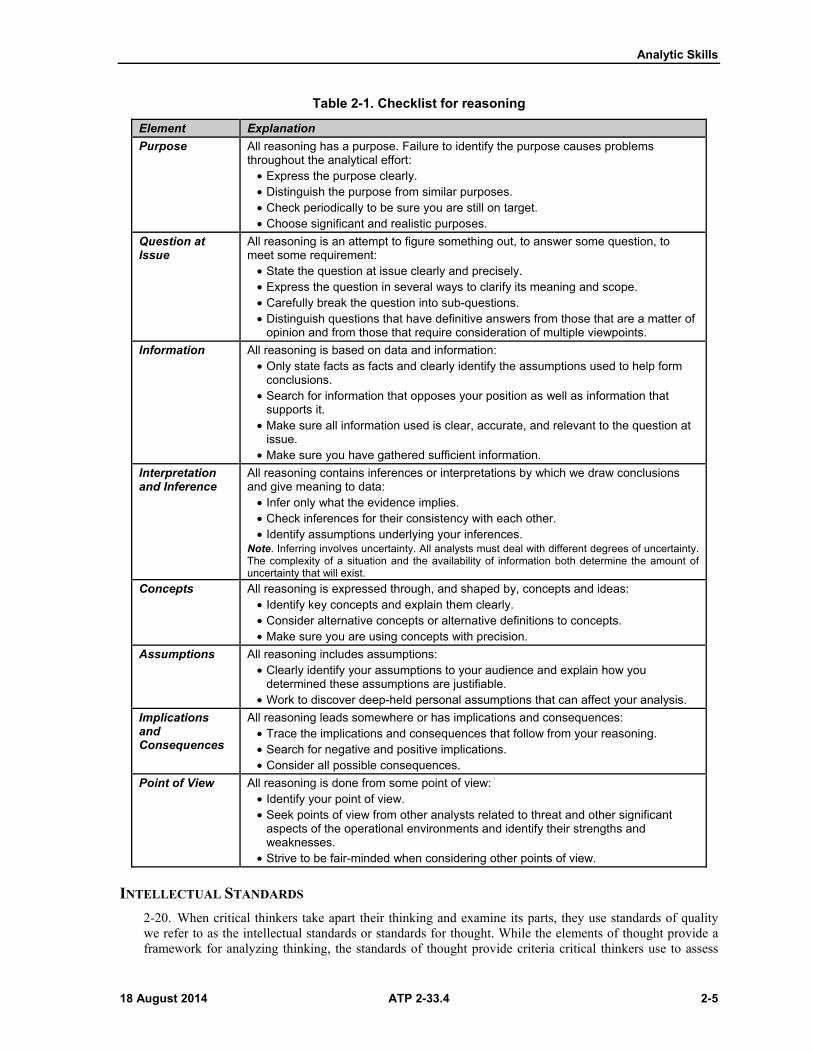
2-19. By applying the eight elements of thought, analysts can develop a checklist for reasoning. Developing and using a checklist, as shown in table 2-1, can help analysts focus their efforts to a specific problem and avoid wasting time on irrelevant issues or distractions.
Analytic Skills
18 August 2014 ATP 2-33.4 2-5
Table 2-1. Checklist for reasoning
Element Explanation
Purpose All reasoning has a purpose. Failure to identify the purpose causes problems throughout the analytical effort:
• Express the purpose clearly. • Distinguish the purpose from similar purposes. • Check periodically to be sure you are still on target. • Choose significant and realistic purposes.
Question at Issue
All reasoning is an attempt to figure something out, to answer some question, to meet some requirement:
• State the question at issue clearly and precisely. • Express the question in several ways to clarify its meaning and scope. • Carefully break the question into sub-questions. • Distinguish questions that have definitive answers from those that are a matter of
opinion and from those that require consideration of multiple viewpoints.
Information All reasoning is based on data and information: • Only state facts as facts and clearly identify the assumptions used to help form
conclusions. • Search for information that opposes your position as well as information that
supports it. • Make sure all information used is clear, accurate, and relevant to the question at
issue. • Make sure you have gathered sufficient information.
Interpretation and Inference
All reasoning contains inferences or interpretations by which we draw conclusions and give meaning to data:
• Infer only what the evidence implies. • Check inferences for their consistency with each other. • Identify assumptions underlying your inferences.
Note. Inferring involves uncertainty. All analysts must deal with different degrees of uncertainty. The complexity of a situation and the availability of information both determine the amount of uncertainty that will exist.
Concepts All reasoning is expressed through, and shaped by, concepts and ideas: • Identify key concepts and explain them clearly. • Consider alternative concepts or alternative definitions to concepts. • Make sure you are using concepts with precision.
Assumptions All reasoning includes assumptions: • Clearly identify your assumptions to your audience and explain how you
determined these assumptions are justifiable. • Work to discover deep-held personal assumptions that can affect your analysis.
Implications and Consequences
All reasoning leads somewhere or has implications and consequences: • Trace the implications and consequences that follow from your reasoning. • Search for negative and positive implications. • Consider all possible consequences.
Point of View All reasoning is done from some point of view: • Identify your point of view. • Seek points of view from other analysts related to threat and other significant
aspects of the operational environments and identify their strengths and weaknesses.
• Strive to be fair-minded when considering other points of view.
INTELLECTUAL STANDARDS
2-20. When critical thinkers take apart their thinking and examine its parts, they use standards of quality we refer to as the intellectual standards or standards for thought. While the elements of thought provide a framework for analyzing thinking, the standards of thought provide criteria critical thinkers use to assess

Chapter 2
2-6 ATP 2-33.4 18 August 2014
the quality of thinking. The effectiveness of intelligence analysis and resulting products can be measured against these nine intellectual standards:
Standard 1—Clarity. Clarity is the gateway standard. If the questions we are trying to answer, the information we are using, the inferences we are making, and the assumptions that guide our thinking are unclear, we cannot determine whether they are accurate, relevant, logical, or justifiable. Analysts should strive, therefore, to provide information in a very clear manner that is understood by the audience.
Standard 2—Accuracy. To be accurate is to represent something in accordance with the way it actually is. People often describe things or events inaccurately. Critical thinkers listen carefully to statements and, when there is reason for skepticism, they question whether what they hear is true or accurate. A statement describing an implication, assumption, inference, or the very question we are trying to answer may be clear but not accurate.
Note. Because we tend to think from an egocentric and/or socio-centric perspective, assessing the accuracy of our own ideas can be difficult. We often tend to believe that our thoughts are accurate just because they are ours; therefore, the thoughts of those that disagree with us are inaccurate. We also often fail to question statements others make that agree with what we already believe.
Standard 3—Precision. To be precise is to give the details needed for someone to understand exactly what is meant. Precise thinking seeks out more details and greater specificity when necessary. You can apply the standard of precision to evaluate how detailed the question is that you are answering, or how detailed it needs to be. Precision is also the standard to determine if assumptions and facts contain enough detail to evaluate them using the standards of relevance, clarity, and accuracy. However, you should never sacrifice clarity for precision.
Standard 4—Relevance. Something is relevant when it is connected with and bears upon the question we are reasoning through. Something is also relevant when it is pertinent or applicable to a problem we are trying to solve. Relevant thinking also encourages us to identify facts, information, questions, assumptions, implications, and points of view that we should set aside as not being pertinent to the main issue. Thinking that is relevant stays on track. People are often irrelevant in their thinking because they lack discipline in their thinking. They wander into side issues that may be intellectually satisfying to discuss but have no bearing on the issue or question.
Standard 5—Depth. We think deeply when we get beneath the surface of an issue or problem. Depth of thinking is also present when we identify its inherent complexities, and then deal with those complexities not superficially but in an intellectually responsible way. Intelligence analysis generally involves the examination of complex situations and requires deep conclusions.
Standard 6—Breadth. When we consider the issue from every relevant viewpoint, we think in a broad way. Multiple points of view that are pertinent to the issue are given due consideration. You think broadly about an issue when you recognize other viewpoints and intellectually empathize with those contrary viewpoints so as to understand them. Breadth of thinking improves the quality of the inferences and recommendations developed during intelligence analysis.
Standard 7—Logic. When we think, we bring together thoughts in some order. When the combined thoughts are mutually supporting and make sense, the thinking is logical. If information, inferences, and so forth, are contradictory, if they do not make sense together, they are illogical.
Standard 8—Significance. When we reason, we want to concentrate on the most important information and take into account the most important ideas or concepts to answer the question. Too often, we fail in our thinking because we do not recognize that although many ideas may be relevant to an issue, they are not equally important.
Standard 9—Fairness. To think fairly is to think in accordance with reason and take into account the views of others. Fairness as a standard helps us deal with our propensity for self-deception. Personal biases and ego creep easily into our thinking. When gauging the fairness of a

Analytic Skills
18 August 2014 ATP 2-33.4 2-7
decision, the critical thinker asks, “Do my selfish interests distort this thinking or is my decision fair to all concerned?” The fairness standard seeks to prevent egocentric thinking. As one’s ego enters the thought process, critical thinking becomes poisoned.
APPLYING THE ELEMENTS AND STANDARDS
2-21. When an analyst exercises self-discipline and thoughtfully analyzes thinking (using the elements of thought) and then assesses the quality of the elements using intellectual standards, the result is a solid foundation for critical thinking. It is important to remember that critical thinking is a deliberate choice. Critical thinking requires self-discipline and a commitment to improve the skills that support this approach. While critical thinking cannot necessarily solve every problem an analyst may face (because some are so complex), it can ensure that every analyst is more effective and efficient while conducting the different intelligence tasks, especially those that are the most complicated or ambiguous.
ESSENTIAL INTELLECTUAL TRAITS
2-22. Intellectual traits are the traits of mind and character necessary to support reasoning. Analysts should repeatedly apply and practice the elements of thought and intellectual standards to help develop intellectual traits. Intellectual traits include, but are not limited to—
Fair-mindedness. Intellectual humility. Intellectual courage. Intellectual empathy. Intellectual integrity. Intellectual perseverance. Confidence in reason. Intellectual autonomy.
2-23. The following are brief descriptions of the essential intellectual traits, along with related questions that foster their development.
Fair-Mindedness
2-24. A fair-minded thinker strives to treat every relevant viewpoint in an unbiased, unprejudiced way. Fair-mindedness entails an awareness that we tend to prejudge the views of others, placing them into favorable (agrees with us) and unfavorable (disagrees with us) categories. We tend to give less weight to a contrary view than to our own. This is especially true when we have selfish reasons for opposing such views. Fair-minded thinkers try to see the strengths and weaknesses of any reasoning they assess. Fair-mindedness entails a conscious effort to treat all viewpoints alike in spite of one’s own feelings or selfish interests, or the feelings of one’s friends, company, community, or social organization. Questions that foster fair-mindedness include—
Am I considering how my behavior might make others feel? Is my reason for doing that fair to everyone?
Intellectual Humility
2-25. Intellectual humility is knowledge of ignorance, sensitivity to what you know and what you do not know. It means being aware of your biases, prejudices, self-deceptive tendencies and the limitations of your viewpoint. Questions that foster intellectual humility include—
What do I really know (about myself, about the situation, about another person, about what is going on in the world)?
To what extent do my prejudices or biases influence my thinking?

Chapter 2
2-8 ATP 2-33.4 18 August 2014
Intellectual Courage
2-26. Intellectual courage is the disposition to question beliefs you feel strongly about. It includes questioning the beliefs of your culture and the groups to which you belong, and a willingness to express your views even when they are unpopular. Questions that foster intellectual courage include—
To what extent have I analyzed and questioned the beliefs I hold? To what extent have I demonstrated a willingness to give up my beliefs when sufficient evidence
is presented against them? To what extent am I willing to stand up against the majority (even though people ridicule me)?
Intellectual Empathy
2-27. Intellectual empathy is awareness of the need to actively entertain views that differ from our own, especially those we strongly disagree with. It is to accurately reconstruct the viewpoints and reasoning of our opponents and to reason from premises, assumptions, and ideas other than our own. Questions that foster intellectual empathy include—
To what extent do I accurately represent viewpoints I disagree with? Can I summarize the views of my opponents to their satisfaction? Can I see insights in the views
of others and prejudices in my own? Do I sympathize with the feelings of others in light of their thinking differently from me?
Intellectual Integrity
2-28. Intellectual integrity consists of holding yourself to the same intellectual standards you expect others to honor (no double standards). Questions that foster intellectual integrity include—
Do I behave in accordance with what I say I believe, or do I tend to say one thing and do another?
To what extent do I expect the same of myself as I expect of others? To what extent are there contradictions or inconsistencies in my views? To what extent do I strive to recognize and eliminate self-deception in my views?
Intellectual Perseverance
2-29. Intellectual perseverance is the disposition to work your way through intellectual complexities despite the frustration inherent in the task. Questions that foster intellectual perseverance include—
Am I willing to work my way through complexities in an issue or do I tend to give up when I experience difficulty?
Can I think of a difficult intellectual problem with which I have demonstrated patience and determination in working through the difficulties?
Confidence in Reason
2-30. Confidence in reason is based on the belief that one’s own higher interests and those of humankind are best served by giving the freest play to reason. It means using standards of reasonability as the fundamental criteria by which to judge whether to accept or reject any belief or position. Questions that foster confidence in reason include—
Am I willing to change my position when the evidence leads to a more reasonable position? Do I adhere to principles of sound reasoning when persuading others of my position or do I
distort matters to support my position? Do I deem it more important to “win” an argument or see the issue from the most reasonable
perspective? Do I encourage others to come to their own conclusions or do I try to force my views on them?

Analytic Skills
18 August 2014 ATP 2-33.4 2-9
Intellectual Autonomy
2-31. Intellectual autonomy is thinking for oneself while adhering to standards of rationality. It means thinking through issues using one’s own thinking rather than uncritically accepting the viewpoints of others. Questions that foster intellectual autonomy include—
To what extent am I a conformist? Do I think through issues on my own or do I merely accept the views of others? Having thought through an issue from a rational perspective, am I willing to stand alone despite
the irrational criticisms of others?
AVOIDING ANALYTICAL PITFALLS 2-32. Critical thinking is a mental process that is subject to numerous influences. Intelligence analysts involved in analyzing complex situations and making conclusions are prone to the influences that shape and mold their view of the world and their ability to reason. These influences are referred to as analytical pitfalls. The elements of thought, intelligence standards, and intellectual traits aid analysts in recognizing these pitfalls in their own analysis and the analysis performed by others. Logic fallacies and biases are two general categories of analytical pitfalls.
LOGIC FALLACIES
2-33. Logic fallacies are errors in the reasoning process caused by the failure to apply sound logic. Although usually committed unintentionally, these fallacies are sometimes used deliberately to persuade, convince, or deceive. An analyst must be able to recognize logic fallacies so a false line of reasoning will not distract them and lead to poor conclusions. This chapter discusses the fallacies of relevance, omission, and assumption.
Fallacies of Relevance
2-34. These fallacies appeal to evidence or examples that are irrelevant to the argument at hand. Appeal to force: (Argumentum ad Baculum, or the “Might-Makes-Right” Fallacy): This
argument uses force, the threat of force, or some other unpleasant backlash to make the audience accept a conclusion. It commonly appears as a last resort when evidence or rational arguments fail to convince. Logically, this consideration has nothing to do with the merits of the points under consideration.
Genetic fallacy: The genetic fallacy is the claim that, because an idea, product, or person must be wrong because of its origin. For example, “That car can't possibly be any good! It was made in Japan!” Or, “Why should I listen to her argument? She comes from California, and we all know those people are flakes.” This type of fallacy is closely related to the fallacy of argumentum ad hominem, below.
Argumentum ad hominem (literally “Argument to the Man”; also called “poisoning the well” and “personal attack”): This fallacy seeks to discount evidence before it is presented, most often by discrediting the source. For example, an ardent spokesman against the value of strategic bombing states: “You can’t trust that man’s testimony regarding the effectiveness of strategic bombing; he’s employed by the Air Force.” The speaker is trying to discredit contrary evidence by creating the specific impression that the testimony is biased because the testifier represents a certain organization. There are two subcategories: Abusive: To argue that proposals, assertions, or arguments must be false or dangerous because
of an irrational psychological transference with the originator (that is, Christians or Muslims). Circumstantial: To argue that opponents should accept or refute an argument only because
of circumstances in their lives is a fallacy. If one’s threat is an imam, suggesting that he should accept a particular argument because not to do so would be incompatible with the Koran is a circumstantial fallacy. The opponent’s special circumstances do not affect the truth or untruth of a specific contention. The speaker or writer must find additional evidence beyond that to make a strong case.

Chapter 2
2-10 ATP 2-33.4 18 August 2014
Argumentum ad populum (“argument to the people"): This fallacy uses an appeal to popular assent, often by arousing the feelings and enthusiasm of the multitude rather than building an argument. It is a favorite device with the propagandist, the demagogue, and the advertiser. There are three basic approaches: Bandwagon approach: “Everybody is doing it.” This argumentum ad populum asserts that,
since the majority of people believes an argument or chooses a particular course of action (COA), the argument must be true or the COA must be the best one. For instance, “Over a million people purchased that phone rather than one with competing software; all those people can’t be wrong. That company must make the best phones.” Popular acceptance of any argument does not prove it to be valid.
Patriotic approach: “Draping oneself in the flag.” This argument asserts that a certain stance is true or correct because it is somehow patriotic, and that those who disagree are somehow unpatriotic. It overlaps with pathos and argumentum ad hominem to a certain extent. The best way to spot it is to look for emotionally charged terms like Americanism, rugged individualism, motherhood, patriotism, or godless communism. A true American would never use this approach: “And a truly free man will exercise his American right to drink beer, since beer belongs in this great country of ours.”
Snob approach: This type of argumentum ad populum does not assert “everybody is doing it,” but rather that “all the best people are doing it.” For instance, “The top analysts at the Central Intelligence Agency agree that my analytic approach is correct.” The implication is that anyone who fails to recognize the truth of the analyst’s assertion is not an equal to the “top analysts of the Central Intelligence Agency,” and thus has no right to question the analytic conclusions.
Appeal to tradition (argumentum ad traditio): This line of thought asserts that a premise must be true because people have always believed it or done it. Alternatively, it may conclude that the premise has always worked in the past and will thus always work in the future.
Fallacies of Omission
2-35. Fallacies of omission occur when an analyst leaves out necessary material in a conclusion or inference. Some fallacies of omission include oversimplification, composition, division, post hoc, false dilemma, hasty generalization, and special pleading.
Oversimplification is a generality that fails to adequately account for all the complex conditions bearing on a problem. Oversimplification results when one or more of the complex conditions pertaining to a certain situation is omitted and includes ignoring facts, using generalities, and/or applying an inadequately qualified generalization to a specific case. For example, an ordnance specialist inspecting a captured, handcarried, surface-to-air missile launcher concludes that the threat has no effective low-level air defense. The assessment is based on the fact that the weapons system is equipped with antiquated guidance mechanisms. The ordnance specialist’s conclusion omits the following considerations: That this piece of equipment may not be the enemy’s only low-level air defense weapon. That the launcher may have been planted by the threat to give a misleading picture of the
threat’s true capabilities and deceive weapons experts. That the threat abandoned the launcher because it was ineffective and more capable systems
were available. Fallacy of composition is committed when a conclusion is drawn about a whole based on the
features of parts of that whole when, in fact, no justification is provided for that conclusion. For example, during a battle with an ethnic militia, a single detainee was captured. This detainee was suffering from malnutrition and low morale. It was noted that the detainee was equipped with a semiautomatic weapon of World War II vintage. After a brief interrogation, the intelligence analyst reported the enemy militia recently engaged was starving, diseased, and poorly armed. The intelligence analyst failed to consider that— The detainee may have been captured because he was too sick to keep up with the rest of the
unit. The weapon of early vintage did not necessarily make it ineffective.
Analytic Skills
18 August 2014 ATP 2-33.4 2-11
Few captured detainees have high morale; in fact, low morale could just as easily result from being captured as it could contribute to being captured.
Fallacy of division is committed when a person infers that what is true of a whole must also be true of the parts of that whole. For example, members of the threat guard’s brigade had never surrendered in previous combat. After a recent engagement, a detainee stated he was a member of the guard brigade. The interrogator doubted the detainee’s statement because personnel from that brigade never surrender.
Fallacy of post hoc ergo propter hoc (after this, therefore because of this) is consideration of other factors that might have accounted for the same result that are omitted. Post hoc fallacies often occur when trying to establish cause and effect. For example, an aircraft equipped with a new jamming pod was not fired on while flying over threat-controlled territory. It was concluded that, since the aircraft was not intercepted or fired upon, the jamming pod was extremely effective in suppressing threat electronic systems. The conclusion may or may not account for the aircraft not being attacked. Other considerations include— The threat was obtaining electronic intelligence on this new pod. The threat recently relocated several surface-to-air missile units and did not want to reveal
their new positions. False dilemma (also known as black-and-white thinking) is a fallacy in which a person omits
consideration of more than two alternatives when in fact there are more than two alternatives. For example, an intelligence staff officer (S-2) reports to the commanding officer that the enemy has only the capability to either defend in place or retreat. The intelligence officer committed the fallacy of false dilemma by failing to anticipate or ignoring that the enemy could— Attack if they were willing to accept high casualties. Withdraw to an alternate defensive position. Conduct a delaying action.
Hasty generalizations are conclusions drawn from samples that are too few or from samples that are not truly representative of the population. For example, after interrogating a detainee, the interrogation officer reports the threat’s morale as extremely low and that surrender is imminent. In this case, the interrogator is making a hasty generalization because the sample population considered, one detainee, is too small.
Special pleading is a fallacy in which the writer creates a universal principle, then insists that the principle does not for some reason apply to the issue at hand. For instance: “Everything must have a source or creator that caused it to come into existence. Except God.” In such an assertion, either God must have His own source or creator, or else the universal principle must be set aside as the person making the argument cannot have it both ways logically.
Fallacies of Assumption
2-36. Fallacies of assumption implicitly or explicitly involve assumptions that may or may not be true. Some fallacies of assumption include begging the question, stating hypotheses contrary to fact, and misusing analogies.
Begging the question (also known as circular reasoning) is a fallacy in which the conclusion occurs as one of the premises. It is an attempt to support a statement by simply repeating the statement in different and
stronger terms. For example, Arab cultures want democracy. America is a democratic nation. Arab cultures will accept American-style democracy.
When asked why the enemy was not pinned down by fire, the platoon leader replied: “Our suppressive fire was inadequate.” The fallacy in this response is that by definition suppressive fire pins down the enemy or is intended to pin him down. Since the platoon failed to pin down the enemy, the inadequacy of this fire was self-evident.
Stating hypotheses contrary to fact occurs when someone states decisively what would have happened had circumstances been different. Such fallacies involve assumptions that are either faulty or simply cannot be proven. For example, the statement, “If we had not supported Castro

Chapter 2
2-12 ATP 2-33.4 18 August 2014
in his revolutionary days, Cuba would be democratic today” is contrary to fact. Besides being a gross oversimplification, the assumption made in the statement cannot be verified.
Misusing analogies occurs when one generalizes indiscriminately from analogy to real world. One method for weakening an analogous argument is by citing a counter-analogy. Analogies are strong tools that can impart understanding in a complex issue. In the absence of other evidence, intelligence analysts may reason from analogy. Such reasoning assumes that the characteristics and circumstances of the object or event being looked at are similar to the object or event in the analogy.
2-37. The strength of a conclusion drawn from similar situations is proportional to the degree of similarity between the situations. The danger in reasoning from analogy is assuming that because objects, events, or situations are alike in certain aspects, they are alike in all aspects. Conclusions drawn from analogies are inappropriately used when they are accepted as evidence of proof. Situations may often be similar in certain aspects, but not in others. A counter-analogy weakens the original analogy by citing other comparisons that can be made on the same basis.
BIASES
2-38. A subjective viewpoint, bias indicates a preconceived notion about someone or something. Biases generally have a detrimental impact on intelligence analysis because they obscure the true nature of the information. Intelligence analysts must be able to recognize cultural, organizational, personal, and cognitive biases and be aware of the potential influence they can have on judgment.
Cultural Bias
2-39. Americans see the world in a certain way. The inability to see things through the eyes of someone from another country or culture is cultural bias. Biases interfere with the analyst’s ability to think the way an enemy commander might think or to give policymakers informed advice on the likely reaction of foreign governments to American policy. Also known as mirror imaging, cultural bias attributes someone else’s intentions, actions, or reactions to the same kind of logic, cultural values, and thought processes as the individual analyzing the situation. Although cultural bias is difficult to avoid, the following measures can lessen its impact:
Locate individuals who understand the culture: Include them in the analytical process. Ask their opinion about likely responses to friendly actions. Take care when using their opinions since they may be subject to biases regarding ethnic
groups or cultures in the region and their knowledge may be dated or inaccurate. Locate regional experts, such as foreign and regional area officers, who have lived or traveled
through the area and are somewhat conversant regarding the culture. Assess the quality of the information provided against the level of knowledge and experience the individual has for that culture or region.
Organizational Bias
2-40. Most organizations have specific policy goals or preconceived ideas. Analyses conducted within these organizations may not be as objective as the same type of analysis done outside the organization. Groupthink and best case are organizational biases that can significantly skew internal analysis.
Groupthink. This bias occurs when a judgment is unconsciously altered because of exposure to selective information and common viewpoints held among individuals. Involving people outside the organization in the analysis can help identify and correct this bias.
Best Case. This bias occurs when an analyst presents good news or bad news in the most optimistic light. The judgment is deliberately altered to provide only the information the commander wants to hear. Analysts can avoid this bias by having the moral courage to tell the commander the whole story, good and bad.

Analytic Skills
18 August 2014 ATP 2-33.4 2-13
A Useful Tool in Logic: Occam's Razor The term "Occam's Razor" comes from a misspelling of the name William of Ockham. Ockham was a brilliant theologian, philosopher, and logician in the medieval period. One of his rules of thumb has become a standard guideline for thinking through issues logically. Occam's Razor is the principle that, if two competing theories explain a single phenomenon, and they both generally reach the same conclusion, and they are both equally persuasive and convincing, and they both explain the problem or situation satisfactorily, the logician should always pick the less complex one. The one with the fewer number of moving parts, so to speak, is most likely to be correct. The idea is always to cut out extra unnecessary bits, hence the name "razor." An example will help illustrate this.
Suppose you come home and discover that your dog has escaped from the kennel and chewed large chunks out of the couch. Two possible theories occur to you: • Theory one is that you forgot to latch the kennel door, and the dog pressed
against it and opened it, and then the dog was free to run around the inside of the house. This explanation requires two entities (you and the dog) and two actions (you forgetting to lock the kennel door and the dog pressing against the door).
• Theory two is that some unknown person skilled at picking locks managed to disable the front door, then came inside the house, set the dog free from the kennel, then snuck out again covering up any sign of his presence and then relocked the door, leaving the dog free inside to run amok in the house. This theory requires three entities (you, the dog, and the lock-picking intruder) and several actions (picking the lock, entering the house, releasing the dog, hiding the evidence, relocking the door). It also requires us to come up with a plausible motivation for the intruder—a motivation that is absent at this point.
Either theory would be an adequate and plausible explanation. Both explain the same phenomenon (the escaped dog) and both employ the same theory of how, for example, that the latch was opened somehow, as opposed to some farfetched theory.
Which theory is most likely correct? If you do not find evidence like strange fingerprints or human footprints or missing possessions to support theory two, William of Ockham would say that the simpler solution (theory one) is most likely to be correct in this case. The first solution only involves two parts—two entities and two actions.
On the other hand, the second theory requires at least five parts—you, the dog, a hypothetical unknown intruder, some plausible motivation, and various actions. It is needlessly complex. Occam's basic rule was: “Thou shalt not multiply extra entities unnecessarily,” or to phrase it in modern terms: “Don't speculate about extra hypothetical components if you can find an explanation that is equally plausible without them.” All things being equal, the simpler theory is more likely to be correct.

Chapter 2
2-14 ATP 2-33.4 18 August 2014
Personal Bias
2-41. Personal bias is the tendency to base assessments on personal beliefs. This can cause the rejection of valid arguments that conflict with these beliefs. A racially or religiously prejudiced person may reject arguments because of the source. A person with strong political views may discount every argument from another political group.
2-42. There are several types of personal bias. Three common biases exhibited by analysts are— Confirmation Bias. This bias causes analysts to undervalue or ignore evidence contradicting an
early judgment and value evidence that tends to confirm already held assessments. Assimilation Bias. This bias involves the modification and elaboration of new information to fit
prior conceptions of hypotheses. The bias is toward confirming a preconceived answer. Anchoring Bias. This bias involves the use, often unwitting, of arbitrary values in
decisionmaking, including the use of conclusions developed by others.
Cognitive Bias
2-43. The intelligence analyst evaluates information from a variety of sources. The degree of reliability, completeness, and consistency varies from source to source and even from report to report. This variance often creates doubt about the reliability of some sources. Cognitive biases that affect the analyst are discussed below:
Vividness. Clear and concise or vivid information has a greater impact on analytical thinking than abstract and vague information. A clear piece of information is held in higher regard than a vague piece of information that may be more accurate. Analysts must consider that an enemy may use deception to portray vivid facts, situations, and capabilities that they want the friendly intelligence effort to believe.
Absence of evidence. Lack of information is the analyst’s most common problem, especially in the tactical environment. Analysts must do their best with limited information and avoid holding back intelligence because it is inconclusive. To avoid this bias, the analyst should— Realize that information will be missing. Identify areas where information is lacking and consider alternative conclusions. Adapt or adjust judgments as more information becomes available. Consider whether a lack of information is normal in those areas or whether the absence of
information itself is an indicator. Oversensitivity to consistency. Consistent evidence is a major factor for confidence in the
analyst’s judgment. Information may be consistent because it is appropriate, or it may be consistent because it is redundant, is from a small or biased sample, or is the result of the enemy’s deception efforts. When making judgments based on consistent evidence, the analyst must— Be receptive to information that comes in from other sources regardless of whether it
supports the hypothesis or not. Be alert for circular reporting, which is intelligence already obtained by the unit that is then
reformatted by other units and intelligence organizations, modified slightly, and disseminated back to the unit. This is a common problem; particularly in digital units, where large volumes of information is being processed. It helps to know, to the degree possible, the original source for all intelligence to ensure that a circular report is not used as evidence to confirm an intelligence estimate or conclusion.
Persistence on impressions. When evidence is received, there is a tendency to think of connections that explain the evidence. Impressions are based on these connections. Although the evidence eventually may be discredited, the connection remains and so do the impressions.
Dependency on memory. The ability to recall past events influences judgment concerning future events. Since memory is more readily available, it is easy to rely on memory instead of seeking new information to support analysis.
Acceptance of new intelligence. Often new intelligence is viewed subjectively; either valued as having more value or less value than current intelligence.

18 August 2014 ATP 2-33.4 3-1
PART TWO
Fundamental Task Techniques
Chapter 3
Basic Structured Analytic Techniques
This chapter describes the basic structured analytical techniques necessary to support problem solving. These techniques include sorting, matrices, threat intentions matrix, event mapping, event trees, subjective probability, and weighted ranking.
OVERVIEW 3-1. A technique is a way of doing something by using special knowledge or skill. An analytic technique is a way of looking at a problem, resulting in a conclusion, an assessment, or both. A technique differs from a tool in that a tool is used as part of the specific analytic technique, but does not provide the conclusions or assessments in and of itself. For example, a link diagram is a tool used to facilitate greater understanding of the relationships between the entities. The diagram is not finished analysis; it helps the analyst break down information into subsets until a hypothesis is found to be either sensible or untrue.
3-2. Structuring one’s analysis is the separating of elements of a problem in an organized manner and reviewing the information in a systematic and efficient way. The structure is the plan, and the analysis is the execution of the plan.
3-3. Basic structured analytic techniques are just that; they are the simplest analytic techniques. Basic structured analytic techniques are the building blocks upon which further analysis is done. They serve as the baseline for using the core Army analytic techniques described in chapter 5.
3-4. The more important the problem or issue, the more important structured analytic techniques become in the development of the best judgment of the response. Structured analytic techniques help the mind remain open and thereby mitigate that inhibit the analyst’s ability to consider alternatives and judge them fairly.
3-5. Structured analytic techniques— Help analysts make sense of complex problems. Let analysts compare and weigh pieces of information against each other. Ensure analysts focus on the issue under study. Force analysts to consider one element at a time in a systematic manner. Aid analysts in overcoming their logic fallacies and biases. Ensure analysts see the elements of information that in turn enhance the identification of
correlations and patterns that would not appear if not depicted outside the mind. Enhance the analyst’s data gathering and review, which in turn facilitate effective thinking with
a better base to derive alternatives and solutions.

Chapter 3
3-2 ATP 2-33.4 18 August 2014
3-6. Basic structured analytic techniques are the starting point for most analysis and are unlikely to provide an answer to intelligence challenges on their own. However, they will provide insight that will support problem solving. The techniques will improve assessments by making them more rigorous, improve the presentation of the finished intelligence in a persuasive manner, and provide ways to measure progress as well as identify what might be missing.
3-7. The following are basic structured analytic techniques: Sorting. Matrices. Threat intentions matrix. Event mapping. Event trees. Subjective probability. Weighted ranking.
SORTING 3-8. Sorting is a basic structuring technique for grouping information to develop insight to facilitate analysis.
FACTS
3-9. Sorting is effective when information elements can be broken out into categories or subcategories for comparison using an automated computer program, such as a spreadsheet. This technique is most useful for reviewing massive data stores that pertain to an intelligence challenge. Sorting also aids in the review of multiple categories of information that when broken down into components can present possible trends, similarities, differences, or other insights not readily identifiable. Sorting can be used at any stage and is particularly effective during initial data gathering and hypothesis generation.
3-10. Sorting massive amounts of data can provide insights into trends or abnormalities that warrant further analysis and that otherwise would go unnoticed. This technique can highlight new or additional analytic insights within an old intelligence problem or a new one. Sorting data before you begin analyzing transactions, such as communications intelligence or transfers of goods, is very helpful.
3-11. Improper sorting can hide valuable insights as easily as illuminating them. Standardizing the data being sorted is imperative. Working with an analyst with experience in sorting can avoid this pitfall in most cases. The following are examples of sorting.
Sorting Examples Example 1: Are local tribal leaders pro-U.S., anti-U.S., or neutral on their attitudes towards U.S. policy in the Middle East? Sort the leaders by factors determined to give insight into the issue, such as birthplace, ethnicity, religion and religious sect, level of professional education, foreign military or civilian or university exchange training (where or when), political influences in life, political decisions made, have U.S. forces negatively or positively affected their tribe. Then review the information to see if any parallels exist between the categories.
Example 2: Data from cell phone communications among five conspirators is reviewed to determine the frequency of calls, the patterns in calls to discover the key communicator, any pattern in the change in frequency of calls prior to a planned activity, and dates and times of calls.

Basic Structured Analytic Techniques
18 August 2014 ATP 2-33.4 3-3
THE METHOD
3-12. The following are steps for this technique: Step 1. Review the categories the information is broken down into to determine which
categories or combination of categories might show the trends or an abnormality that would provide insight into the problem being studied. Place data into a spreadsheet, database, or wheel using as many fields (columns) as necessary to differentiate among the data types (such as dates, times, locations, people, activities, amounts). List each of the facts, pieces of information, or hypotheses involved in the problem that you may want to use in the sorting schema (can use paper, white board, movable piece of stationery with a re-adherable strip of adhesive on the back, or other means).
Step 2. Review the listed facts, information, or hypotheses in the database or spreadsheet to identify key fields that may help uncover possible patterns or groupings. Those patterns or groupings then illustrate the schema categories and can be listed as header categories. For example, if you are examining terrorist activity and notice that most attacks occur in hotels and restaurants but the times of the attacks vary, “location” is the main category; while date and time are secondary categories.
Step 3. Group those items according to the schema in the categories you previously defined in step 1.
Step 4. Chose a category and sort the data within that category. Look for any insights, trends, or oddities.
Step 5. Review (and re-review) the sorted facts, information, or hypotheses to see if there are alternative ways to sort them. List any alternative sorting schema for the problem. One of the most useful applications of this technique is to sort according to multiple schemas and examine results for correlations between data and categories. (For example, you notice that most terrorist attacks that happen in hotels also happen in June.)
3-13. The following can assist when using the sorting technique: Get others to review the sorted information to increase the brainstorming opportunities and for
new ways of sorting the data to gain insight. Remember that correlation is not the same as causation. Return to sorting anytime during the analysis when new insights are gained and sorting can
either support or negate conclusions.
MATRICES 3-14. A matrix is a grid with as many cells as required to sort data and gain insight. Matrices are useful whenever there are more options or more intricate data than can be conceptualized at one time without a visual representation. Whenever information can be reduced to a matrix, it provides analytic insights.
FACTS
3-15. Matrices are exceptionally useful in isolating critical data when there is an abundant amount of overall information relevant to an issue. When used to review data related to options, such as the analysis of competing hypotheses, it enables analytic focus on each option, improving comparison. Matrices allow elements of a problem to be separated and categorized by type, for comparison of different types of information or of pieces of the same type of information. Matrices also help analysts identify patterns or correlations within the information, such as through telephone calls between members of a group, which is an intermediate step in link analysis.
3-16. The two-dimensional design of matrices limits their use for collating data on complex issues. Leaving out pertinent data easily oversimplifies an issue. Figure 3-1 on page 3-4 matrix shows one method of cross-walking the operational variables memory aid PMESII (political, military, economic, social, information, and infrastructure) with the civil considerations memory aid ASCOPE (area, structures, capabilities, organizations, people, and events.)

Chapter 3
3-4 ATP 2-33.4 18 August 2014
Figure 3-1. Matrix example
THE METHOD
3-17. Matrices can be rectangular, square, or triangular depending on the purpose and number of rows and columns required to enter the data. The following are steps for this technique:
Step 1. Draw a matrix with sufficient columns and rows to enter the two sets of data to be compared.
Step 2. Enter the range of data or criteria along the horizontal and vertical axis. Step 3. In the grid squares in between, note the relationships or lack thereof in the cell at the
intersection between the two associated data points. Step 4. Review the hypotheses developed for the issue in light of the relationships shown in the
matrix and, if appropriate, develop new hypotheses based on the insight gained from the matrix.
3-18. The following can assist when using this technique: Develop a template for recurring topics where the data points remain consistent. Color-code results to aid in understanding the results.

Basic Structured Analytic Techniques
18 August 2014 ATP 2-33.4 3-5
THREAT INTENTIONS MATRIX 3-19. The threat intentions matrix is a technique used to efficiently look at information from the threat’s point of view. It is necessary for the analyst using the technique to have knowledge of the motivation, goals, and objectives of the threat making the decision and to assess the criteria in the matrix from the threat’s point of view.
FACTS
3-20. When completed, the threat intentions matrix will help mitigate bias while providing insight into the effect of each of the threat’s different decisionmaking criteria on their different options. The matrix gives the analyst the ability to develop clear indicators for each option under study, permitting specific collection planning.
3-21. With the threat’s decisionmaking criteria already established in the column headings, the analyst only has to enter the alternatives or options being considered. Normally the matrix can be completed in less than an hour. During the input of information into the matrix, new and potentially better options become apparent, increasing the value of the technique.
3-22. The criteria used in the matrix are not as extensive as and quite possibly less relevant than criteria derived during use of the weighted ranking technique. As a result, the insight gained may be less than that gained using other techniques. Figure 3-2 depicts a threat intention matrix.
Figure 3-2. Threat intention matrix
THE METHOD
3-23. Use the column headings entered on the threat intent matrix. It is important to enter the information for every decisionmaking criteria in a column before moving to the next column. That is the manner by which this technique mitigates bias. The following are steps for this technique:
Step 1. Enter the decision options believed to be reasonable from the threat’s viewpoint. Step 2. Fill in the objectives for each option from the threat’s viewpoint in the objectives column. Step 3. Fill in the benefits column from the threat’s viewpoint with the benefits of the threat’s
decision option. Step 4. Fill in the risk column from the threat’s viewpoint with the risks of the threat’s decision
option. Step 5. Fill in the implications column, which transitions the analyst from the threat’s point of
view to the analyst’s point of view. Enter the implications from the threat’s point of view and then add a slash (/) and enter the implications from the analyst’s point of view.
Step 6. Enter the indicators from the analyst’s viewpoint into the indications column. This provides a basis for generating collection to determine which option was selected by the threat as early as possible.
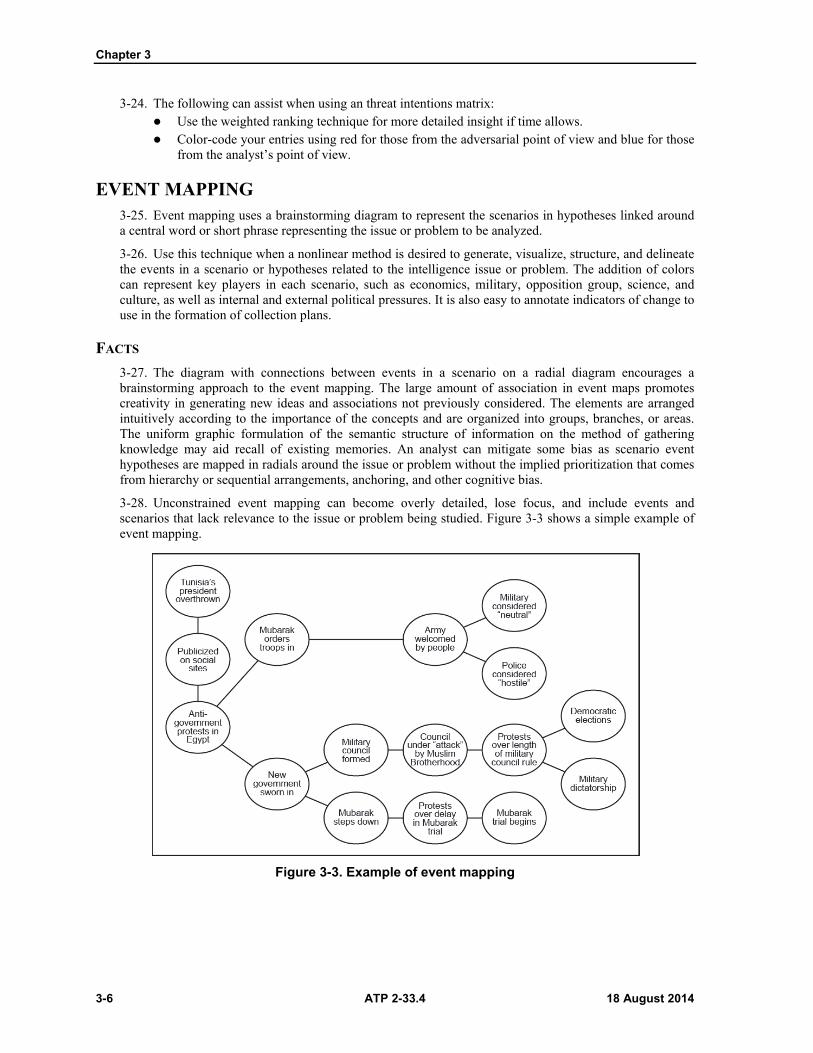
Chapter 3
3-6 ATP 2-33.4 18 August 2014
3-24. The following can assist when using an threat intentions matrix: Use the weighted ranking technique for more detailed insight if time allows. Color-code your entries using red for those from the adversarial point of view and blue for those
from the analyst’s point of view.
EVENT MAPPING 3-25. Event mapping uses a brainstorming diagram to represent the scenarios in hypotheses linked around a central word or short phrase representing the issue or problem to be analyzed.
3-26. Use this technique when a nonlinear method is desired to generate, visualize, structure, and delineate the events in a scenario or hypotheses related to the intelligence issue or problem. The addition of colors can represent key players in each scenario, such as economics, military, opposition group, science, and culture, as well as internal and external political pressures. It is also easy to annotate indicators of change to use in the formation of collection plans.
FACTS
3-27. The diagram with connections between events in a scenario on a radial diagram encourages a brainstorming approach to the event mapping. The large amount of association in event maps promotes creativity in generating new ideas and associations not previously considered. The elements are arranged intuitively according to the importance of the concepts and are organized into groups, branches, or areas. The uniform graphic formulation of the semantic structure of information on the method of gathering knowledge may aid recall of existing memories. An analyst can mitigate some bias as scenario event hypotheses are mapped in radials around the issue or problem without the implied prioritization that comes from hierarchy or sequential arrangements, anchoring, and other cognitive bias.
3-28. Unconstrained event mapping can become overly detailed, lose focus, and include events and scenarios that lack relevance to the issue or problem being studied. Figure 3-3 shows a simple example of event mapping.
Figure 3-3. Example of event mapping

Basic Structured Analytic Techniques
18 August 2014 ATP 2-33.4 3-7
THE METHOD
3-29. The general rules of event mapping are— Start with a blank paper or use a piece of stationery with a re-adherable strip of adhesive on the
back to make notes on a white board. Thinks in terms of key words, phrases, or symbols that represent ideas and words. Put down ideas as they occur, wherever they fit. Do not judge or hold back. Develop in directions the topics take you—not limited by how you are doing the map. As you expand the map, try to become more detailed. Use arrows or other visual aids to show the links between events in the scenario.
3-30. The following are steps for this technique: Step 1. Put the word or symbol representing the issue or problem to be analyzed in the center of
the paper or white board. Take a minute to think about it before continuing. Step 2. Add symbols or words to represent possible actions and outcomes around the central
issue or problem. Step 3. Link the possible actions and outcomes to the central issue or problem. If desired, use
colors to indicate the major influence the link represents. For example, use green for economic links, red for opposition groups, or purple for military forces. Colors may also be used to differentiate paths for ease of reference.
Step 4. Continue working outward, building the scenario of events into branches and sub-branches for each hypothesis in greater detail.
Step 5. Use emphasis such as underlining and stars to show importance or level of influence. Step 6. Do not allow yourself or the group to get stuck on one scenario. If ideas end, move to
another area or another hypothesis. Step 7. When the creativity wanes, stop and take a break. After an hour or so, return and review
the map, and make additions and changes as desired. Step 8. As an option, add a number on links or decision points in each hypothesis and, on a
separate piece of paper, write down the evidence for each number to be collected that would disprove that link or decision being made. Use the lists for each number to develop an integrated collection strategy for the issue or problem.
3-31. The following can assist when using an event map: Think fast. Your brain works best in 5 to 7 minute bursts, so capture that explosion of ideas as
rapidly as possible. Keep moving. If ideas slow down, draw empty lines, and watch your brain automatically find
ideas to put on them. Stand up and use an easel pad or white board to generate even more energy.
Include distractions. If you are mapping and you suddenly remember you need to pick up your cleaning, put down “cleaning” on the side of the map. Otherwise you will become fixated on the cleaning chore.
Write on links. Put key words on lines to give context to the link. Print words. Print rather than write in script. It is easier to read and remember. Lowercase is
more visually distinctive (and easier to remember) than uppercase.
EVENT TREES 3-32. An event tree is a graphic depiction of a possible sequence of events, including potential junctures within the events sequence.

Chapter 3
3-8 ATP 2-33.4 18 August 2014
FACTS
3-33. Use an event tree to clarify alternative event sequences with potential future or at least unknown outcomes related to an intelligence problem. Event trees work best when there are multiple, mutually exclusive options that cover the spectrum of reasonable alternatives available.
3-34. An event tree is a visual tool by which analysts can depict a threat’s options with decision points that gives insight into potential vulnerabilities. It clarifies the presumed sequence of events or decisions between an initiating event and a final outcome. Event trees also provide an excellent method of determining collection requirements for the indications that a decision has been made or events have unfolded in one of the alternative limbs of the tree. Figure 3-4 is an example of an event tree.
Figure 3-4. Event tree example
THE METHOD
3-35. The following are steps for this technique: Step 1. Identify the mutually exclusive and complete set of possibilities that pertain to a given
intelligence issue. Step 2. Decide which events, factors, or decisions (for example, variables) will have the greatest
influence on the alternatives or possibilities identified in step 1. Step 3. Decide on the sequencing in which these factors are expected to occur or impact one
another. Step 4. Determine the event options within each alternative and establish clear definitions for
each event option to ensure collection strategies to monitor events are effective. Step 5. Construct the event tree from left to right. Each alternative is a separate main branch.
Start with the first alternative and have one branch from this node for each realistic path the first event can take. For instance, the purchased equipment could be used for its intended purpose, or it could be reverse-engineered for duplication, or it could be disassembled and sold for scrap.

Basic Structured Analytic Techniques
18 August 2014 ATP 2-33.4 3-9
Proceed down each event option node until the end state for that sub-branch is reached. Then move to the next alternative and repeat the process.
Step 6. Determine what would indicate a decision has been made at each decision point for each option to use in generating an integrated collection plan.
Step 7. Assess the implications or after effects of each alternative on the intelligence problem.
3-36. The following can assist when using an event tree: Use this technique in conjunction with weighted ranking, hypothesis review techniques, and
subjective probability to gain added insights. Leverage the expertise of a group of analysts during the construction of an event tree to ensure
all important events, factors, and decision options are considered.
SUBJECTIVE PROBABILITY 3-37. Subjective probability is a quantitative expression of an analyst’s degree of belief in the truth of a statement relative to all other alternative possibilities. It may be text or graphic. Figure 3-5 shows an example of subjective probability using an event tree.
Figure 3-5. Subjective probability example
FACTS
3-38. Subjective probabilities are used to quantitatively express an analyst’s overall degree of belief in the truth of a statement where the total belief held by an analyst is allocated among the other possibilities in proportion to how likely each answer or event is correct. Subjective probability analysis is useful in comparing the perceived likelihood of hypotheses, supporting event tree or matrix analysis by providing quantitative estimates for each event, and quantitatively evaluating the value of additional information in shaping the conclusions of an analysis.

Chapter 3
3-10 ATP 2-33.4 18 August 2014
3-39. The expression of numerical probabilities can mitigate the imprecision of probability phrases (“very likely” or “improbable”). Moreover, numerical probabilities mitigate the potential for analysts to exploit imprecision in favor of their position. Using numerical probabilities ensures mathematical rules are followed and forces consideration of a complete set of alternatives. This in turn gives the analyst a rational basis to judge whether the probability distribution is an accurate reflection of the analyst’s beliefs.
3-40. Assignments of probability require a complete set of non-overlapping (mutually exclusive) answers, events, scenarios, or COAs. In addition, misuse can feed availability and anchoring biases.
3-41. When using subjective probability, it is essential in defining a numerical score and range to ensure all personnel involved understand the meaning of the terms. Table 3-1 shows an example of subjective probability and the language associated with each score or range.
Table 3-1. Subjective probability table
Subjective Probability Table
Term Score Range (percent)
Highly probable 10 91 to 100
Probable 9 81 to 90
Highly likely 8 71 to 80
Likely 7 61 to 70
Possible 5 to 6 41 to 60
Unlikely 4 31 to 40
Highly unlikely 3 21 to 30
Improbable 2 11 to 20
Highly improbable 1 1 to 10
3-42. While subjective probability looks similar to event mapping, the differences are with subjective probability you are not determining a timeline for any particular events; you are simply attempting to predict an outcome and applying a percentage of probability to each outcome.
THE METHOD
3-43. Subjective probability rules must be followed: The probability assigned to a given hypothesis must be within the range of 0.0 (or 0 percent) to
1.0 (100 percent). A probability of 0.0 means the hypothesis is certainly wrong; whereas a probability of 1.0 means that the hypothesis is certainly correct.
The total probability distributed among all hypotheses is a complete, non-overlapping set must add to 1.0 (100 percent).
3-44. The following are steps for this technique: Step 1. Identify a complete set of high-level, non-overlapping hypotheses that seek to answer a
clearly defined question. Use the technique of defining the issue to ensure that the question is clear.
Step 2. Generate simple chains of events or facts for each hypothesis. Event trees and event mapping are two techniques that aid in this step. The number of scenarios that can be constructed for a given hypothesis depends on the detail desired. Each scenario describes one instance of how the associated hypothesis may come to pass.
Step 3. The probability of a given hypothesis is a function of the probabilities of all the scenarios that would support a hypothesis as being true. The probability of a given scenario is a function of all the events within that scenario occurring. That is, the probabilities (percentages) for each option are multiplied throughout the scenario to determine the probability for the scenario. There are two types of probability events that need to be analyzed:

Basic Structured Analytic Techniques
18 August 2014 ATP 2-33.4 3-11
Mutually Exclusive. The occurrence of one event precludes the occurrence of the others. Either one or another will occur, but not both. For example, for an elections result if one individual wins, another necessarily cannot. The total probability for the total events must equal 100 percent.
Conditionally Dependent. Events are those for which the probability of occurrence of one event depends on whether or not another has occurred. These are the events within a scenario where the probability for each event in the scenario is multiplied to determine the probability of the end result.
3-45. The following can assist when using subjective probability: Draw a circle and allocate slices of the circle or “pie” where the relative size of the slice of pie
for a hypothesis represents how likely the analyst believes it is true. Assign numbers to each hypothesis according how strongly it is believed. Determine the
subjective probability by dividing the points for each hypothesis by the total of the numbers assigned to all hypotheses.
Determine the amount of money you would be willing to bet on a hypothesis being true given that you were to win $1,000,000 if true; the subjective probability in this case would be the ratio of your wager to the total pot (for example, $1,000/$1,000,000 = 0.001 or 0.1 percent).
WEIGHTED RANKING 3-46. Weighted ranking is a technique used by an individual or group to gain confidence in the assessment of available alternatives by weighting criteria in importance from the decisionmaker’s point of view.
3-47. Weighted ranking should be used anytime the topic is important enough to warrant the investment of time and there is a need for transparency in the reasoning used to derive the assessment. In intelligence analysis, each criterion used in the technique must be selected and given a weighted importance from both the technique and the threat decisionmaker’s point of view. The insight gained on how each criterion will affect the final outcome allows for a clear, persuasive presentation and argumentation of the assessment.
FACTS
3-48. Weighted ranking helps mitigate bias and mindset when the analyst using it faithfully follows the method and treats each step as equally important to the outcome. The technique can be used by a group working together as long as a group facilitator keeps the process on track. The validity of the weighting of the criteria can be enhanced by the group through discussions sharing insight into the threat decisionmaker’s purpose and point of view.
3-49. Weighted ranking adds validity to an assessment of alternatives, options, and hypotheses by mitigating bias and mindset in comparison to an analyst’s intuition. Weighted ranking takes more time than other basic analytic techniques. Many analysts avoid this technique because it relies on mathematical computations.
THE METHOD
3-50. There are eight steps to accomplish a weighted ranking review of alternative options being assessed. Figure 3-6 on page 3-13 is a condensed view of weighted ranking options.
Step 1. Take the alternatives, options, or hypothesis generated or another process to fill in the first column of a matrix under the column heading of Options.
Step 2. On a separate sheet of paper or file, develop a comprehensive list of independent criteria the threat would likely use to determine which option to select. List the criteria in a column with one criterion per line. The context of the time, place, and objectives of the action being reviewed should be considered in the development of the criteria.
Step 3. Pair-rank the criteria. Pair-ranking requires each item being ranked to be compared with every other item and the selection of one over the other.

Chapter 3
3-12 ATP 2-33.4 18 August 2014
Start with the first criterion in the list and compare it to the second criterion. Place a mark ( or ) next to the criterion selected as the more important between the two.
Compare the first criterion with the third. Again mark the more important of the two. Once the first criterion has been ranked against all of the others, go to the second criterion and compare it with the third, placing a mark next to the one judged most important.
Rank the second criterion with the fourth, and so on until it has been ranked against the remaining criteria on the list. The second and succeeding criteria are not ranked against criteria on the list shown above them because that was accomplished when those criteria were going through the process.
Count the marks or votes for each criterion on the list and write the total to the right of the criterion and marks.
Review the totals of each criterion and determine how many of the listed criteria to use in the weighted ranking matrix. Mark these criteria with an asterisk. Note that more than five or six criteria rarely provide sufficient difference to be worth the time and expertise.
Continue to rank each criterion with those below it on the list until the list is completed. Step 4. Divide the number of votes received by each selected criterion by the total number of
votes for all selected criteria. (For example, if the total number of votes for the selected criteria is 15 and the first criterion received 5 votes, divide 5 by 15 to get 33 percent; and the second criterion received 4 votes, then divide 4 by 15 to get 27 percent [rounded up 26.7 percent to the next full number], and so on, through the selected criteria. Make sure the total of the percent for the criteria adds up to exactly 100 percent by rounding off the figures as required.)
Step 5. Enter the criteria in the options matrix as column headings starting with the second column. Note that the first column heading is Options. Include the percentage for each criterion with it in the column heading. The order that the criteria are entered is not important, but confusion can be avoided if the criterion with the largest percentage is entered in the first column and the remainder added in descending order.
Step 6. Pair-rank the options based on the first criteria from the point of view of the threat decisionmaker. The pair-ranking is accomplished exactly like the procedure used in step 4 to rank the criteria. Compare the first option with the second option and determine which option most meets the
criteria. Then place a mark (l or X) in the box at the intersection for best option for the criteria. After pair-ranking all the options for the first criterion, move to the second criterion
(column) and pair-rank all of the options against that criterion, and so on, until all criteria are used to pair-rank the options.
Step 7. Count the number of marks (votes) in each square in the matrix under the criteria and write the number in the square. Then multiple the number by the weight of the criteria (the percentage listed with the criterion at the top of the column). Write the product (result of the multiplication) in the square as well.
Step 8. Once all squares with marks have been multiplied by the percentage for that criterion and placed in the appropriate square, add the product (result of the multiplication) in each square for each option (row). That is, add all of the final numbers in each square across the row and place the total in the final column for that option (row). This number can be larger than 1 (for example, 2.58). The row with the largest total is the most likely option.
3-51. End the weighted ranking review by performing a sanity check of the results and review the impact of the weighted criteria on the final result. This review should provide the insight needed to present the results in a clear and persuasive manner to customers.
3-52. The following can assist when using weighted ranking: Use a different color for each criteria and alternative during the pair-ranking to make the choices
transparent (easy to review or recreate). At a minimum, it will provide insight to the analyst on the interaction of the criteria from the
point of view of the threat decisionmaker.

Basic Structured Analytic Techniques
18 August 2014 ATP 2-33.4 3-13
Figure 3-6. Weighted ranking example

This page intentionally left blank.

18 August 2014 ATP 2-33.4 4-1
Chapter 4
Diagnostic Analytic Techniques
This chapter discusses the diagnostic analytic techniques routinely used by intelligence analysts. It discusses in detail the common techniques of deception detection, key assumptions check, quality of information check, indicators, and conducting studies.
OVERVIEW 4-1. The primary purpose of diagnostic techniques is to make analytic arguments, assumptions, and/or intelligence gaps more transparent.
4-2. The following techniques have been used at the strategic, operational, and tactical levels for some time and are routinely used by intelligence personnel conducting intelligence analysis. The following are the diagnostic analytic techniques discussed in this chapter:
Deception detection. Key assumptions check. Quality of information check. Indicators.
4-3. Diagnostic techniques are often used in association with most other analytic techniques discussed in this manual to further strengthen the analytic assessments and conclusions.
DECEPTION DETECTION 4-4. Deception is a threat action to influence the perceptions, decisions, or actions of another to the advantage of the threat. Deception detection is a set of checklists that analysts can use to help them determine when to look for deception, discover whether deception actually is present, and figure out what to do to avoid deception.
4-5. Historically, intelligence analysis has been vulnerable to deception. In reality, analysts seldom check for deception even when there is a well-known history of its use. Experienced analysts realize they cannot assume all collected information is valid, but few know how to factor such concerns effectively into their daily work practices. If an analyst accepts that some of the information may be deliberately deceptive, this puts a significant cognitive burden on the analyst.
FACTS
4-6. Although deception detection is time consuming, analysts should be concerned about the use of deception when the threat would have a lot to gain by denying or manipulating information collection systems and analysts. Deception detection is an effective tool to assist in validating information collected as well as other conclusions and assessments drawn using other techniques.
4-7. When trying to evaluate the information that is present to derive intentions or COAs, analysts have to consider if this information is real or if it is a deception campaign to redirect the collection efforts or push to other conclusions.
4-8. Attempting deception detection can strengthen analysis and reinforce effectiveness of other analytic techniques. There may be times when analysts will place too much confidence in the effectiveness of other techniques if they have not considered the possibility of deception.

Chapter 4
4-2 ATP 2-33.4 18 August 2014
THE METHOD
4-9. Analyst should routinely consider that their information base is susceptible to deception. The possibility cannot be rejected simply because there is no evidence of deception; if done well, the analyst should not expect to see any evidence upon first examination.
4-10. The analyst should assess key reporting based on four sets of criteria: Does the threat have the motive, opportunity, and means?
Motive. (What are the threat’s goals?) Channels. (What means are available?) Risks. (What are the risks of discovery?) Costs. (Can deception be accomplished?) Feedback. (Can the threat monitor its use?)
Would this potential deception be consistent with past opposition practices? Does the threat have a history of deception? Does this deception fit past patterns? If not, are there other historical precedents? If not, are there changed circumstances that would explain this form of deception?
Do we have cause for concern regarding the susceptibility of manipulation of the threat? Is the source reliable? Does the source have access? Is the source vulnerable to control or manipulation by the threat?
What can be learned from the evaluation of evidence? How accurate is the source’s reporting? Is the whole chain of evidence available? Does critical evidence check out? Does evidence from one source conflict with others? Do other sources of information provide corroborating evidence? Is the absence of evidence unusual?
4-11. Analyst have found the following rules helpful in dealing with deception: Avoid over-reliance on a single source of information. Seek and heed the opinions of those closest to the reporting. Be suspicious of human sources or sub-sources who have not been met with personally or for
whom it is unclear how or from whom they obtained the information. Be suspicious of information that appears to be too easy to collect and is too perfect of a picture. Always look for material evidence (documents, reports, imagery) rather than relying exclusively
upon what someone says. Look for a pattern where a source’s information has seemed correct and accurate initially, but
then proven to be false. Generate and evaluate a full set of hypotheses at the outset of a task. Know the limitations as well as the capabilities of collection assets, sources, and potential
deceivers.
4-12. In addition to using the deception detection technique, analysts can also employ the technique of Analysis of Competing Hypotheses (ACH) discussed in appendix A. In this case, analysts would explicitly pose deception as one of the multiple explanations for the presence or absence of information.
KEY ASSUMPTIONS CHECK 4-13. A key assumption is any hypothesis that analysts have accepted to be true and which forms the basis of the assessment. For example, military analysis may focus exclusively on analyzing key technical and

Diagnostic Analytic Techniques
18 August 2014 ATP 2-33.4 4-3
military variables of military force and assume that these forces will be operated in a particular environment (desert, open plains, arctic conditions).
FACTS
4-14. Postulating other conditions or assumptions, however, could dramatically impact the assessment. Historically, U.S. analysis of Soviet-Warsaw Pact operations against the North Atlantic Treaty Organization had to “assume” a level of non-Soviet-Warsaw Pact reliability (such as would these forces actually fight).
In this case there was high uncertainty; depending on what level of reliability one assumed, the analyst could arrive at very different conclusions about a potential Soviet offensive operation.
Or when economists assess the prospects for foreign economic reforms, they may consciously, or not, assume a degree of political stability in those countries or the region that may or may not exist in the future.
Likewise, political analysts reviewing a developing country’s domestic stability might unconsciously assume stable oil prices, when this likely determinant of economic performance and underlying social peace might fluctuate.
4-15. All of the above examples indicate that analysts often rely on stated and unstated assumptions to conduct their analysis. The goal is not to undermine or abandon key assumptions; rather it is to make them explicit and identify what information or developments would demand reconsidering them.
4-16. A key assumptions check is most useful at the beginning of an analytic project. Rechecking assumptions also can be valuable at any time prior to finalizing judgments. Identifying hidden assumptions can be difficult because they are ideas held by you to be true, albeit often subconsciously, and therefore are seldom examined and almost never challenged.
4-17. Explicitly identifying working assumptions during an analytic project helps the analyst understand the key factors shaping the issue and stimulates thinking. Additionally, this technique aids in explaining a logical argument while exposing potentially flawed thinking. Key assumption checks should be collaborative because one cannot effectively self-check.
THE METHOD
4-18. Checking for key assumptions requires analysts to consider how their analysis depends on the validity of certain premises. The following four-step process will help analysts:
Review what the current analytic line of thinking on the issue appears to be. What do you think you know? What key details aid in accepting that the assumption is true? Write it down for analytic review.
Articulate all the premises, both stated and implied in finished intelligence, which are accepted as true.
Challenge the assumption, asking why it must be true and is it valid under all conditions. What is the degree of confidence in those initial answers?
Refine the list of key assumptions to contain only those that “must be true” in order to sustain your analytic line. Consider under what conditions or in the face of what information these assumptions might not hold true.
4-19. Ask the following questions during this process: How much confidence exists that this assumption is correct? What explains the degree of confidence in the assumption? What circumstances or information might undermine this assumption? Is a key assumption more likely a key uncertainty or key factor? If the assumption proves to be wrong, would it significantly alter the analytic line and how?
Chapter 4
4-4 ATP 2-33.4 18 August 2014
QUALITY OF INFORMATION CHECK 4-20. The quality of information check technique evaluates the completeness and soundness of available information, both independently and in conjunction with sources. If a major analytic assessment is planned, analysts should individually or collectively review the quality of their information and refresh their understanding of the strengths and weaknesses of past reporting on which an analytic line of thinking rests. Without understanding the context and conditions under which critical information has been provided, it will be difficult for analysts to assess the information’s validity and establish a confidence level in an intelligence assessment.
4-21. Periodic reviews of the quality of the information should be conducted after the initial check to prevent assumptions or weak judgments from becoming fact over time.
FACTS
4-22. Weighing the validity of sources is a key feature of any critical thinking. Moreover, establishing how much confidence one puts in analytic judgments ultimately rests on how accurate and reliable the information base is. Analysts essentially must judge the accuracy and reliability of the information. Thus, checking the relative quality of information should be a continuous process.
4-23. Determining the quality of information independently of the source of the information is important to ensure that neither unduly compromises nor supports the other. That is, an excellent source can knowingly and admittedly pass third- or fourth-hand information that may be of low quality. It is important to keep the two reviews separate. This check can—
Provide the most important basis of determining confidence of the assessment and judgments. Provide an opportunity to mitigate assimilation or confirmation bias based on the source. Provide an opportunity to catch errors of interpretation. Identify intelligence gaps. Help identify areas of concern of denial and deception. Give the analyst an opportunity to clearly convey to the customers a better understanding of the
analyst’s confidence in the aspects of the problem.
4-24. Analysts can become susceptible to circular reporting and source-based bias when reviewing the quality of information. Critical information can occasionally be found in reports from sources judged to have low access or a poor record. To ignore the information on the basis of quality independent of the source could cause the information to be unduly dismissed. Where one analyst works the same subject or area for extended periods, the analyst may miss the significance of incremental changes. The use of indicators can mitigate this possibility.
THE METHOD
4-25. For the information review to be fully effective, analysts will need as much background information on sources as is possible. Knowing the circumstances in which reporting was obtained is often critical to understanding its validity. With this information the analysts should then, at a minimum—
Review all sources of information for accuracy; identify any of those sources more critical or compelling.
Determine if they have sufficient and/or strong collaboration between the information sources. Reexamine previously dismissed information in light of new facts or circumstances. Ensure any circular reporting is identified and properly flagged for other analysts; analysis based
on circular reporting should also be reviewed to determine if the reporting was essential to the judgments made.
Consider whether ambiguous information has been interpreted and qualified properly. Indicate a level of confidence they can place in sources, which are likely to figure in future
analytic assessments.

Diagnostic Analytic Techniques
18 August 2014 ATP 2-33.4 4-5
4-26. Analysts should consciously avoid relating the source to the information until the quality of information check is complete. If relating the source to the quality of the information changes the opinion of the information, the analysts must ensure they can articulate why. Analysts should develop and employ a spreadsheet to track the information and record their confidence in the quality of information as a constant reminder of the findings.
INDICATORS 4-27. Identifying and monitoring indicators are fundamental tasks of intelligence analysis, as they are the principal means of avoiding surprise. Indicators are often described as forward looking of predictive indicators.
FACTS
4-28. Indicators are the basis for situation development. An indicator, in intelligence usage, is an item of information which reflects the intention or capability of an adversary to adopt or reject a course of action (JP 2-0). An indicator is positive or negative evidence of threat activity or any characteristic of the AO that points toward threat vulnerabilities, the adoption or rejection by the threat of a particular activity, or that may influence the commander’s selection of a COA. Indicators may result from previous actions or from threat failure to take action. The all-source intelligence analyst integrates information from all sources to confirm indications of threat activities. Detection and confirmation of indicators enable analysts to answer priority intelligence requirements (PIRs).
4-29. If an indicator is a ploy (part of a deception plan), then conclusions based on it may be incorrect. Although indicators are clues that point toward threat activities, capabilities, vulnerabilities, or intentions, they may be deceptive and lead analysts to develop an incorrect intelligence estimate. Remember, an estimate is not certain, but is an opinion based on facts and the analysis of a particular situation.
4-30. Analysts should avoid acting on a single indicator. Integration of multiple indicators and other factors is essential before analysts can detect patterns and threat intentions. Other staff elements assist intelligence analysts in developing indicators, which is instrumental in answering commander’s PIRs and information requirements. Indicators serve as a means of prediction across all levels—strategic, operational, and tactical. (See levels of war in ADRP 3-0.)
4-31. A threat may attempt to create false or misleading patterns of intentions by providing friendly forces with false indicators. Analysts detect these false indicators, and then analyze them to determine what actual COA the threat is attempting to initiate. Analysts discover deception by comparing indicators, intelligence, and combat information from all sources to create an accurate picture of the AO. Because the use of indicators is such an important part of determining threat COAs, it is imperative that analysts carefully weigh all indicators.
4-32. Analysts should avoid making an assessment based on a single indicator. Integrating multiple indicators, reviewing high-value targets and the most likely enemy COA, and considering the enemy center of gravity will lead analysts to true threat intentions and capabilities.
4-33. Analysts— Connect a series of occurrences or alarms to point to a higher indicator. Use indicators to evaluate particular events or activities with probable threat COAs. Use indicators to determine what events or activities will likely occur for a threat force to follow
a particular COA.
4-34. Analysts use the following steps to determine the mission-dependent indicators: Develop indicators. Weigh indicators. Analyze indicators. Use indicators.

Chapter 4
4-6 ATP 2-33.4 18 August 2014
Step 1: Develop Indicators
4-35. When developing indicators, intelligence analysts start from the event, work backwards, and include as many indicators as possible. Analysts can remove some indicators later if decided that they are unnecessary.
4-36. Each indicator must meet five criteria: Be observable and collectible. There must be some reasonable expectation that, if present, the
indicator will be observed and reported by a reliable source. If an indicator is to monitor change over time, it must be collectible over time.
Be valid. An indicator must be clearly relevant to the end state the analyst is trying to predict or assess, and it must be inconsistent with all or at least some of the alternative explanations or outcomes. It must accurately measure the concept or phenomenon at issue.
Be reliable. Data collection must be consistent when comparable methods are used. Those observing and collecting data must observe the same things. Reliability requires precise definition of indicators.
Be stable. An indicator must be useful over time to allow comparisons and to track events. Ideally, the indicator should be observable early in the evolution of development so that the analysts and decisionmakers have time to react accordingly.
Be unique. An indicator should measure only one thing and, in combination with other indicators, point only to the phenomenon being studied. Valuable indicators are those that not only are consistent with a specified scenario or hypothesis but also are inconsistent with all other alternative scenarios.
4-37. Are the indicators mutually exclusive and comprehensive? Have a sufficient number of high-quality indicators been generated for each scenario to enable an effective analysis? Can the indicators be used to help detect a planned attack or deter a possible enemy COA?
4-38. Common knowledge and understanding of threat characteristics and the various operational environments are essential to ensure all avenues are covered. This can be as simple as using threat characteristic factors in a more conventional scenario. If presented with a PIR, indicator development may include—
Threat characteristics—particularly composition, disposition, tactics, training, sustainment, and combat effectiveness.
Electronic characteristics, which are the identification of threat digital and analog communications links, systems, and associated units.
Personalities. The location in the AO to expect a particular threat activity.
Note. In stability tasks or defense support of civil authorities (DSCA) missions, it might be more applicable to use queries such as who, what, when, where, why, how, and in what strength. See appendix A for indicator development.
Step 2: Weigh Indicators
4-39. Analysts weigh indicators to help resolve uncertainty. Intelligence analysts often encounter conflicting indicators, resulting from—
Deliberate deception. Poor mission execution. Temporary indecision (hesitation in making a decision). Transition between missions. Random activity. Incomplete or inaccurate information. Uncertainty or doubt of the indicator itself.

Diagnostic Analytic Techniques
18 August 2014 ATP 2-33.4 4-7
4-40. When confronted with doubtful or conflicting indicators, analysts weigh some indicators more heavily than others to determine the threat’s actual intent. This is not easily accomplished; it takes time and experience to become proficient in associating indicators with COAs.
4-41. The assistant chief of staff, intelligence (G-2) staff develops a list of indicators and places a priority on each. This prioritization establishes the relative weight of one indicator compared to another. Despite the weight, or value placed on the indicators, it is dangerous to draw conclusions from a single indicator. The analyst integrates each indicator with other indicators and factors and then defines patterns and establishes threat intentions. The analyst may develop standing or specific indicators to answer the commander’s PIRs and information requirements. The information collected and intelligence provided through the indications and warning effort drive operational-level planning and long-term PIRs and information requirements. The analyst uses these indicators to cross-reference specific events and activities with probable threat trends and COAs.
4-42. The most obvious indicators are not necessarily the best depiction of a particular enemy COA. The obvious indicators may actually serve as elements of a deception plan. The successful analysis of indicators can assist in confirming or denying enemy COAs, and is therefore essential in supporting the commander. However, it is important not to search for indicators of an expected COA or to expect a certain COA at all. Leaders use indicators as a tip-off that something is occurring but demand that intelligence analysts dig deeper into the why or what of the situation and develop an indicator list specific to the situation.
4-43. In combat, the analyst is usually confronted with conflicting indicators. An enemy force will go to great efforts to deceive us by portraying indications which point to the adoption of a COA that the enemy does not intend to adopt. Enemy forces may use patterns associated with attack, defense, and delay simultaneously. These conflicting patterns may result from intentional deception, imprecise execution, temporary indecision, random activity, or incomplete or inaccurate information.
4-44. The analyst requires a thorough knowledge of the threat and of the characteristics of the operational environment that can affect military operations. Detailed knowledge of enemy organization, equipment, tactical doctrine, and logistical methods is valuable. Also valuable is the probable enemy knowledge of the area under friendly control and the personalities of the enemy commanders and the past performance of the opposing enemy units. The analyst must develop a way to identify those indicators that are most indicative of a COA. There are several techniques which may be used individually or in combination.
4-45. One technique of determining the enemy's intent is to consider the origin or source of the indicator, or why the enemy presents a certain pattern. Indicators stem from military logic, doctrinal training, organizational constraints, bureaucratic constraints, or the personality of the enemy commander.
4-46. The event matrix and information collection plan serve as important tools for analysts to document developing events. By developing these products in a logical, progressive, or step-by-step manner, they often provide easy answers for the G-2/S-2 during the initial phases of an event; however, there may be a tendency to over rely on them. Indicators also tend to discourage analytical thinking because a broad view of the event is more readily apparent.
4-47. While it is important to understand and look for indicators of military activity, analysts cannot ignore specific indicators that might not fit a military category. All-source intelligence analysts at the operational and strategic levels consider the availability of resources such as funding, fuel, and the ability of a country to sustain its military.
Fiscal Resources
4-48. A fiscal resource is one of the very best indicators of an organization’s or country’s ability to support a limited or protracted military mission or its willingness to militarily, overtly, or covertly support another country’s military or terrorist action. Fiscal resources underline the main indicators of a terrorist group’s COAs, intentions, and capabilities.
4-49. Countries that are not fiscally independent may be willing to allow the use of their territory as a training or holding area and use their military in a mercenary role in return for monies, equipment, or advanced technology. When a country undertakes an action or program requiring a significant commitment of fiscal resources, it is a strong indication of a serious intent, capability, and commitment to that action or

Chapter 4
4-8 ATP 2-33.4 18 August 2014
program. Fiscal resources can support the analyst’s theory of a country’s commitment, intent, or ability to commit to a military action. Fiscal independence also adds credence to a country’s verbal threats and political and economic influence.
Other Resources
4-50. If a country commits a scarce resource to support a military action, it may indicate the country’s intent to project a false commitment to achieve a military solution while attempting to force another country to seek a peaceful solution (which usually involves forcing the other country to make some concessions). A country that has scarce resources may place such a high value on the resources that it may not use them unless it is forced. Countries with a scarce resource (technology, military equipment, military experts) may be willing to employ a resource they have in abundance (military personnel, training areas, raw minerals) to acquire more of the scarce resources. These types of indicators should be analyzed to correctly answer commander’s critical information requirements and PIRs and to help facilitate situational understanding for the commander.
4-51. If a threat element makes a preparation that is not reversible by inexpensive and efficient means, it may be unintentionally signaling intent. If an artillery brigade dumps more ammunition at its gun locations than it has the organic transport to carry in one lift, then there is a problem if the unit moves. This may indicate that the unit does not anticipate moving with the ammunition, which could mean it plans to fire the ammunition or leave it in place.
Step 3: Analyze Indicators
4-52. Analysis of indicators requires a number of actions. All-source intelligence analysts— Examine collected information and intelligence. Ensure any information pertaining to indicators has footnotes that include details of the event. Look for the development of patterns. All-source intelligence analysts notice one set of
indicators is satisfied, and identify if another is not. Watch closely to detect deception operations. Recheck the validity of the indicators and verify the staff did not miss any relevant information.
If the indicators are valid, analysts report the findings. The commander needs to know whether the threat is conducting an actual combat operation or a deception operation.
Look for indicators based on the principle of mass. The enemy can be expected to conduct deception operations. However, deception operations are normally conducted as inexpensively as possible, attempting to deceive us with the least expenditure of resources. Indicators based on a major confirmed commitment of forces are most likely to reflect the true situation.
Step 4: Use Indicators
4-53. Indicators provide an objective baseline for tracking events, instilling rigor in the analytic process, and enhancing the credibility of the final product. Descriptive indicators are best used to help the analyst assess whether there are sufficient grounds to believe that a specific action is taking place. They provide analysts with a systematic way to validate a hypothesis or help substantiate an emerging viewpoint.
4-54. A classic application of indicators is to seek early warning of an enemy attack or a nuclear test by a foreign country. Indicators are often paired with scenarios to identify which of several possible scenarios are developing. They can also be used to measure change such a political instability or a humanitarian crisis.
4-55. Defining explicit criteria for tracking and judging the course of events makes the analytic process more visible and available for scrutiny by others, thus enhancing the credibility of analytic judgments. Including an indicators list in the finished analytical product helps decisionmakers track future developments and build a more concrete case for the analytic conclusions.
4-56. The indicator list becomes the basis for directing collection efforts and for routing relevant information to all interested parties. It can also serve as the basis for the analyst’s filing system to track these indicators.

Diagnostic Analytic Techniques
18 August 2014 ATP 2-33.4 4-9
4-57. Analysts must periodically review the validity and relevance of their indictors. Intelligence analysts develop indicators by placing them in a logical order and at different levels or stages. In this methodology, there is often a logical sequence or order of indicators. In some cases, it may be more advantageous to develop indicators as a series of milestones leading to a sequential action or event. All-source intelligence analysts consider probability and priority when describing these indicators. (See appendix A for more information on indications and warnings.)
CONDUCTING STUDIES 4-58. Intelligence analysts complete products such as studies in order to provide the requesting command or organization with detailed information, assessments, and conclusions about the AO and area of interest. A study can be a systems or functional analysis product. It should be as detailed and in-depth as time allows. For example, studies can provide knowledge that supports an understanding of—
Local populations. Cultures and caste system. Societal systems or organizations. Political systems and structures. Religions practiced and their impacts. Moral beliefs and their impacts. Civil authority considerations. Military organizations, structure, and equipment. Attitudes toward U.S., multinational, or host-nation forces.
4-59. When all-source intelligence analysts are given the task to complete a study, they conduct the following steps sequentially:
Step 1. Verify the details of the task assigned. Step 2. Request clarification of the task if it is required. Step 3. Identify existing information and intelligence which applies to the task. Step 4. Compile existing information into the determined format. Step 5. Identify gaps in information and intelligence that needs to be researched. Step 6. Begin researching material. Step 7. Combine the sets of information into a complete study.
4-60. Studies can also include the views and attitudes of multinational and host-nation forces towards these factors. Complete studies include two tasks:
Conduct area, regional, or country study. Conduct specified study.
CONDUCT AREA, REGIONAL, OR COUNTRY STUDY
4-61. All-source intelligence analysts study and provide mission-focused knowledge of the terrain and weather, civil considerations, and threat characteristics for a specified area or region of a foreign country—including the attitudes of the populace and leaders toward joint, multinational, or host-nation forces—to assist in achieving goals and objectives. Studies can also include the views and attitudes of multinational and host-nation forces. Human terrain teams are part of the Army human terrain system that can also support area and regional studies. These teams develop, train, and integrate social science based on research and analysis to support operationally relevant decisionmaking.
CONDUCT SPECIFIED STUDY
4-62. All-source intelligence analysts provide focused knowledge of the terrain and weather, civil considerations, and threat characteristics for a specified topic or requirement. Studies provide the requesting command or organization with detailed information, assessments, and conclusions on the area of interest.

This page intentionally left blank.

18 August 2014 ATP 2-33.4 5-1
Chapter 5
Core Army Analytic Techniques
This chapter discusses the core Army analytic techniques used by intelligence analysts. It also discusses the core analytic techniques used to develop situational understanding and conclusions, analyze complex networks and associations, and conduct pattern analysis.
OVERVIEW 5-1. The ability to order information, recognize patterns, reason, think critically, and think creatively aids all aspects of intelligence analysis. Depending on the situation being analyzed, there are various techniques that can aid in the analysis as well. Forming an accurate conclusion is made more probable by the selection of an appropriate technique to use when conducting intelligence analysis. The following techniques are commonly used in both the academic and intelligence communities. Analysts should know how to reach conclusions. While there is no right way to reason, analysts can apply analytical techniques to augment reasoning skills.
ANALYTIC TECHNIQUES 5-2. Analytic techniques have been used at the strategic, operational, and tactical level for some time and are routinely used by intelligence personnel conducting intelligence analysis. The techniques often incorporate multiple basic structured analytic techniques in combination with diagnostic techniques. Each of these core techniques has its own merits:
Developing situational understanding and conclusions. Brainstorming. Comparison. Mathematical analysis. Situational logic.
Analyzing complex networks and associations. Link analysis. Network analysis. Sociometrics or social network analysis.
Conducting pattern analysis. Chronologies. Pattern analysis plot sheet. Incident overlay. Pattern of life analysis.
Note. The analytic techniques of center of gravity analysis, functional analysis, and modeling are valuable techniques Army intelligence analysts employ; however, they are not discussed in this publication. See FM 2-01.3 for discussions on these methodologies.
Chapter 5
5-2 ATP 2-33.4 18 August 2014
SECTION I – DEVELOPING SITUATIONAL UNDERSTANDING AND CONCLUSIONS
5-3. These techniques aid in developing new ideas and analogical reasoning, determining capabilities and limitations, increasing understanding of a situation, and forming conclusions in support of mission command. A group or team using these analytic techniques is usually more effective than a single analyst because this technique stimulates learning and new ideas.
BRAINSTORMING 5-4. Brainstorming is a widely used technique for stimulating new thinking, and it can be applied to virtually all the other structured analysis techniques as an aid to thinking. Typically, analysts will brainstorm when they begin a project to help generate a range of hypotheses about their issue.
FACTS
5-5. Brainstorming, almost by definition, involves a group of analysts meeting to discuss a common challenge. A modest investment of time at the beginning or critical points of a project can take advantage of the group’s different perspectives to help structure a problem. This group process allows others to build on an initial idea suggested by a member of the brainstorming session.
5-6. An individual analyst also can brainstorm to produce a wider range of ideas than a group might generate, without regard for other analysts’ egos, opinions, or objections. However, an individual will not have the benefit of others’ perspectives to help develop the ideas as fully. Moreover, an individual may have difficulty breaking free of personal cognitive biases without the benefit of a diverse group.
5-7. This technique can maximize creativity in the thinking process, force analysts to step outside their normal analytic mindsets, and suspend their limited perspectives about the practicality of ideas or approaches. Generally, brainstorming allows analysts to see a wider range of factors that might bear on the topic than they would otherwise consider. Analysts typically censor ideas that seem farfetched, poorly sourced, or seemingly irrelevant to the question at hand.
5-8. Brainstorming gives permission to think more radically or “outside the box.” In particular, brainstorming can spark new ideas, ensure a comprehensive look at a problem or issues, raise unknowns, and prevent premature consensus around a single hypothesis.
THE METHOD
5-9. Brainstorming should be a very structured process to be most productive. An unconstrained, informal discussion might produce some interesting ideas, but usually a more systematic process is the most effective way to break down mindsets and produce new insights. In particular, the process involves a divergent thinking phase to generate and collect new ideas and insights, followed by a convergent phase in which ideas are grouped and organized around key concepts. Some of the simple rules to be followed include—
Never censor an analyst’s ideas no matter how unconventional they might sound. Find out what prompted the thought, as it might contain the seeds of an important connection
between the topic and an unstated assumption. Allow enough time to do brainstorming correctly. It usually takes one hour to set the “rules of
the game,” get the group comfortable, and exhaust the conventional wisdom on the topic. Only then will the truly creative ideas begin to emerge.
Involve at least one outsider in the process; that is, someone who does not share the same educational background, culture, technical knowledge, or mindset as the core group but is familiar with the topic.

Core Army Analytic Techniques
18 August 2014 ATP 2-33.4 5-3
5-10. A two-phase, eleven-step structured process is often used to elicit the most information from the brainstorming sessions. This process is described below:
Phase 1—Divergent Thinking Phase: Step 1. Distribute a piece of stationery with a re-adherable strip of adhesive on the back,
and pens or markers to all participants. Typically, 10 to 12 people work best. Step 2. Pose the problem in terms of a focal question. Display it in one sentence on a large
easel or whiteboard. Step 3. Ask the group to write down responses to the question, using key words that will fit
on the small piece of stationery. Step 4. Stick all the notes on a wall for all to see—treat all ideas the same. Step 5. When a pause follows the initial flow of ideas, the group is reaching the end of their
collective conventional thinking and the new divergent ideas are then likely to emerge. End the “collection stage” of the brainstorming after two or three pauses.
Phase 2—Convergent Thinking Phase: Step 6. Ask the participants as a group to rearrange the notes on the wall according to their
commonalities or similar concepts. Talking is discouraged. Some notes may be moved several times as notes begin to cluster. Copying some notes is permitted to allow ideas to be included in more than one group.
Step 7. Select a word or phrase that characterizes each grouping or cluster once all the notes have been arranged.
Step 8. Identify any notes that do not easily fit with others and consider them either isolated thoughts or the beginning of an idea that deserves further attention.
Step 9. Assess what the group has accomplished in terms of new ideas or concepts identified or new areas that need more work or further brainstorming.
Step 10. Instruct each participant to select one or two areas that deserve the most attention. Tabulate the votes.
Step 11. Set the brainstorming group’s priorities based on the voting and decide on the next steps for analysis.
5-11. Brainstorming can be used in developing threat COAs and in anticipating the actions of other types of threats (state and non-state as well as organizations, groups, and individuals) that can influence the commander’s area of interest. Brainstorming is also effective in developing recommendations for information collection and targeting strategies. (For example, an analytical team in Afghanistan may conduct a brainstorming session to develop observables and indicators for Taliban shadow government activities in Kabul province.)
5-12. Brainstorming is one of the most widely used group idea generation tools today, capitalizing on the idea that grouping people together is more effective than letting participants work alone. Conducting a structured brainstorming session is most effective if we recognize and avoid the common brainstorming pitfalls: blocking, evaluation apprehension, and personality faceoff.
Blocking refers to the human inability to effectively develop new ideas while keeping old ideas in active storage in short-term memory. When people cannot immediately input their ideas because they have to wait for someone else to describe theirs, they often end up judging or editing them, or even forgetting them altogether. Even when people do get a chance to describe an idea during brainstorming, they may get to offer only one or two comments before someone else breaks in. The larger the brainstorming group, the bigger the amount of blocked participants, and the fewer the ideas produced compared to an equal number of people generating ideas independently.
Evaluation apprehension refers to the experience of being anxious about being negatively evaluated or not positively evaluated. In other words, it is the concern for how others are evaluating us.
Personality faceoff refers to the clash of personalities between people. Overpowering people try to dominate the activity. Passive people try to get by unnoticed. Stubborn people get

Chapter 5
5-4 ATP 2-33.4 18 August 2014
overprotective about their ideas and do not accept the ideas of others. Fearful people are reticent and evasive, only presenting safe ideas.
COMPARISON 5-13. Comparison is used to understand current events by comparing them with historical precedents in the same country or with similar events in other countries. It differs from applying theory in that conclusions are drawn from a small number of cases, whereas applying theory is generated from examining a large number of cases. This approach is useful when faced with ambiguous situations because it looks at how the country handled similar situations in the past or how similar countries handled similar situations.
5-14. Comparison analysis helps to work out the importance of a number of options relative to each other. It is very useful when the analyst lacks objective data to base this on.
5-15. Comparison makes it easy to choose the most important problem to solve, or select the solution that will give the greatest advantage. Paired comparison analysis helps to set priorities where there are conflicting demands on the resources. Figure 5-1 shows a simple matrix for comparing COAs.
Figure 5-1. Matrix comparing courses of action
FACTS
5-16. Figure 5-2 uses the criticality, accessibility, recuperability, vulnerability, effect, and recognizibility (CARVER) targeting method to compare potential enemy targets on an overseas force. In this method, lower scores indicate less desirable outcomes, with higher numbers indicating a more desirable outcome. Employing the CARVER matrix—
In the offensive can help identify targets that are vulnerable to attack. In the defensive can identify high-risk targets that require additional security assets for
protection.
5-17. See ATP 3-05.1 for more information on unconventional warfare. The example in figure 5-2 compares the value of a potential target against the risk of neutralizing the target.

Core Army Analytic Techniques
18 August 2014 ATP 2-33.4 5-5
Figure 5-2. Comparison of targets
THE METHOD
5-18. The following steps are one method to use the CARVER technique: Step 1. List the variable to be compared. It may be useful to use brainstorming to get an initial
list and then refine it for a final list of variables. Step 2. Mark the variables as row headings on a matrix. Step 3. Place the events being compared as column headings. Step 4. Move across each row and determine the importance of each variable to that event’s
occurrence by assigning it a weighted rank. Each variable must be considered in relation to the country, culture, and specific circumstances of the events.
Step 5. After weighting each variable, consolidate each event’s weight by adding up the columns. If the numbers are similar, the analyst may assess the event is likely to occur in a manner similar to the event used as a comparison.
5-19. Comparison analysis is an effective way of weighing the relative likelihood of different COAs based on facts and assumptions. It is useful where COAs are ambiguous or are of similar likelihood. The CARVER technique provides a framework for comparing each COA against all others and helps to show the difference in importance between factors.
MATHEMATICAL ANALYSIS 5-20. Mathematical analysis is effective in determining the capabilities and limitations of an organization based on an evaluation of tangibles and intangibles. Mathematical analysis aids the analyst calculating the overall combat effectiveness of an organization. Mathematical analysis is the use of simple mathematical ratios to answer intelligence questions. This normally includes the use of ratios or the comparison of gross numbers. The following scenarios show examples of ratio comparisons.

Chapter 5
5-6 ATP 2-33.4 18 August 2014
Examples of Ratios There were 45 reports this month—15 more than last month. The force ratio is 3:1; 25% of route 1 has been cleared of improvised explosive devices by engineer reconnaissance units.
A ratio is a comparison of 2 numbers. The numbers may be separated by a colon (:) or slash (/) (a ratio of 8 to 13 may be written 8:13 or 8/13). Example: A supply convoy consists of 15 supply trucks, 2 Strykers, and 4 mine-resistant ambush protected (also called MRAP) vehicles. The ratio of MRAP vehicles to supply trucks is 4:15; It may also be expressed as 4/15 or 4 to 15. The order matters. A ratio of 1:7 is not the same as a ratio of 7:1.
5-21. Mathematical analysis uses both tangible and intangible facts. Tangible facts are those items that may be counted, physically, by the analyst. Intangible facts are difficult to quantify (such as, leadership, combat experience, training, and area knowledge).
Step 1. Evaluate the enemy situation including the number of personnel, numbers and types of equipment the enemy uses, the tactics employed, combat experience, training, leadership, and area knowledge.
Step 2. Evaluate the friendly situation including the number of personnel, the numbers and types of equipment friendly forces uses, the tactics employed, combat experience, training, leadership, area knowledge, and the mission.
Step 3. Write a short paragraph explaining both the intangible facts (tactics employed, combat experience, training, leadership, and area knowledge).
Step 4. List the tangible facts below the paragraph for each force (number of personnel, numbers and types of equipment).
Step 5. Evaluate both the intangible and tangible facts, comparing them using mathematical ratios to show strengths and weaknesses of enemy and friendly forces.
Step 6. Draw conclusions based on the mathematical ratios in combination with the intangible facts.
5-22. The following vignette shows how mathematical analysis can be used to support mission command.

Core Army Analytic Techniques
18 August 2014 ATP 2-33.4 5-7
Mathematical Analysis Enemy Situation: There is an insurgent cell of approximately 11 seasoned fighters operating in and around the town of Tuc. The cell leader is known among the local populace, local police, and the Afghan Army in the area. He grew up in the area and is familiar with the local terrain. The cell has conducted several successful attacks against Afghan military forces in the last 12 months. Their most common method of attack is using an “L” shaped ambush in complex terrain. Intelligence analysis indicates this type of cell is generally equipped as follows: • 11 x AK-47s. • 2 x 9-mm pistols. • 1 x RPD light machinegun. • 3 x RPG-7V. • 8 x fragmentation grenades. • 4 x ICOM radios. • 11 x personal cell phones. • 6 x command-detonated improvised explosive devices. Friendly Situation: The mission is to conduct a foot reconnaissance of route to village used for commerce. The patrol leader has been to the village on three occasions (once by helicopter and twice as a patrol member). This is his first time as the patrol leader. Prior to departure, patrol was briefed that the area had no indicators of enemy presence or activities. The patrol consists of 16 x personnel: • 12 x U.S. Soldiers (including a public affairs office team of 2). • 2 x Interpreters and translators (also called I/Ts). • 2 x Afghan soldiers (both speak Basic English). The patrol is equipped with— • 10 x M4s (2 with grenade launchers). • 2 x surface acoustic waves. • 5 x AK-47s. • 4 x 9-mm pistols. • 2 x antitank weapons. • 40 x fragmentation grenades. • 2 x manpacked satellite communications radios. • 15 x personal cell phones.
A quick mathematical analysis reveals the following: When considering total numbers, force ratio favors friendly forces by a factor of 1.4 to 1. However, when considering just combat troops, the ratio is about 1:1. Additionally, there are intangibles that must be factored in: • Combat experience and leadership favor the enemy. • Area knowledge favors the enemy. When evaluating firepower, the results are as follows: • Crew-served weapons: force ratio favors friendly forces at 2:1. • Assault rifles: force ratio favors friendly forces at 5:4. • Pistols: force ratio favors friendly forces at 2:1. • Grenade launchers: force ratio favors friendly forces at 1:5. • Antitank weapons: force ratio favors enemy forces at 2:0. • Grenades: force ratio favors friendly forces at 5:1. • Demolitions: force ratio favors enemy forces at 6:0. Intangibles: • Type and amount of ammunition are even. • Fields of fire and cover and concealment favor the enemy.
Conclusion: Based on aggregate force ratios, U.S. force would most likely be defeated by an undetected enemy ambush. Recommend additional reconnaissance to mitigate enemy advantages and ensure the security of the patrol.

Chapter 5
5-8 ATP 2-33.4 18 August 2014
SITUATIONAL LOGIC 5-23. Situational logic is an analytical methodology employed by intelligence analysts when a situation is regarded as one of a kind and analysis will not benefit from broad or specific comparison with other events. Situational logic is normally used to trace cause-effect relationships or, when dealing with purposeful behavior, means-end relationships. For example, an analyst identifies the goals being pursued and explains why an enemy believes certain means will achieve these goals. There are two weaknesses in this methodology to be aware of: it is difficult for an analyst to see problems as an enemy may see them; and the process does not incorporate theoretical data from other areas or events that may assist in the analysis.
5-24. Situational logic is the most common method of intelligence analysis and is sometimes called the area studies approach. This involves generating different hypotheses on the basis of considering concrete elements of the current situation. Broad, global generalizations are avoided. Even though most analysts know this to be untrue, every situation is treated as one-of-a-kind, to be understood in terms of its own unique logic.
5-25. Situational logic is cause-and-effect logic, based on the assumption of rational, purposive behavior. The analyst identifies the goals being pursued by the enemy and explains why the enemy believes certain means will achieve certain goals. One of the major risks with this approach is projecting personal values onto an enemy. The three-step process includes—
Step 1. A single entity (such as a country or province, organization, military, or political group) is examined, although on multiple interrelated issues. The analyst conducts in-depth research and builds a base of knowledge on the target entity.
Step 2. Next, the analyst seeks to identify the logical antecedents of the situation. This is called building a scenario. The analyst draws upon the knowledge base developed during the first step to develop a deeper understanding of the situation and how it came about.
Step 3. Using the knowledge base and the understanding of the situation, the analyst works backwards to explain the origins of the current situation; the analyst then identifies logical consequences of the situation to estimate the future outcome.
SECTION II – ANALYZING COMPLEX NETWORKS AND ASSOCIATIONS
5-26. Analyzing complex networks and associations is the review, compilation, and interpretation of data to determine the presence of associations among individuals, groups (military units, insurgent and terrorist groups, criminal organizations), businesses, or other entities; the meaning of those associations to the people involved; and the degrees and ways in which those associations can be strengthened or weakened.
5-27. There are three related methods used to analyze complex networks and associations: Link analysis. Network analysis. Sociometrics or social network analysis.
Note. It is common for analysts to blend all three of these methods, in spite of their different approaches. Experience with a problem set and familiarity with the use of these analytic techniques encourages a blended approach analyzing complex networks and associations.
LINK ANALYSIS 5-28. Link analysis is a technique used to evaluate relationships (connections) between various types of objects including organizations and individuals that use visualization tools to organize and display data.
5-29. Link analysis, along with network analysis, is a method used to identify, analyze, and visualize patterns in data. These methods all involve the collection, processing, visualization, and analysis of information. Although these processes can be done manually, link analysis in the U.S. military has largely become automated. This is because the vast amount of information intelligence personnel process on a regular basis results in information overload that negatively affects the ability of intelligence personnel to

Core Army Analytic Techniques
18 August 2014 ATP 2-33.4 5-9
complete intelligence assessments in a timely and accurate manner. Link analysis software programs are standard components on the Army’s intelligence processors from theater down to the company level.
5-30. Having seen its success in aiding law enforcement agencies in analyzing criminal organizations, the U.S. military now uses link analysis in analyzing terrorist and other complex networks. Link analysis is used by intelligence personnel to identify connections between individuals, organizations, and activities in order to determine associations.
5-31. There are three types of visualization tools used in link analysis to record and visualize information: the association matrix, the activities matrix, and the link diagram.
Link Analysis Done Without Automation Although most link analysis is done using automation, a different approach to link analysis is to use small sticky notes of paper on a white board. The analyst labels the notes and places them on the white board. Connections are drawn on the board between different entities and nodes, using markers. This method has several benefits: • A potentially larger picture can be seen on a white board than what may be seen
on a computer monitor; many automated systems present limited views. • It allows movement of the entities, quick redrawing of links, and color coding using
different markers. • It allows for a team of analysts to work together to develop analysis.
5-32. Link analysis generally follows the order shown. Analysts must understand that steps 1 and 2 are often interchanged and/or done concurrently. Each of these steps is discussed below:
Step 1. Construct an association matrix. Step 2. Construct an activities matrix. Step 3. Construct a link diagram.
ASSOCIATION MATRIX
5-33. An association matrix is used to identify the existence and type of relationships that exist between individuals as determined by direct contact. Direct contact is determined by a number of factors, including but not limited to—
Face-to-face meetings. Telephonic conversation. Membership in a group or organization.
Note. It is important to know that using the association matrix without modification will show only the existence of relationships not the nature, degree, or duration of those relationships.
Facts
5-34. A known association between individuals is depicted on the matrix by a dot or filled-in circle. Suspected associations are depicted on the association matrix by an open circle. The rationale for depicting suspected associations is to get as close as possible to an objective analytic solution while staying as close as possible to known or confirmed facts. If a suspected association is later confirmed, the appropriate adjustment may be made on the association matrix simply by filling in the open circle. A secondary reason for depicting suspected associations is that it may give the analyst a focus for requesting to task limited intelligence collections assets in order to confirm the suspected association. Suspected associations between persons of interest are considered to be associations which are possible or even probable, but cannot be confirmed using the above criteria. Examples might be—
A known party calling a known telephone number. (The analyst knows to whom the telephone number is listed, but it cannot be determined with certainty who answered the call.)
A face-to-face meeting where one party can be identified, but the other party can only be tentatively identified.

Chapter 5
5-10 ATP 2-33.4 18 August 2014
5-35. An association matrix is constructed in the form of a right triangle having the same number of rows and columns. Figure 5-3 is an example of an association matrix.
Figure 5-3. Example association matrix
The Method
5-36. Creating an association matrix involves four steps: Step 1. Construct a triangular matrix with multiple columns and rows in a table. This may be
done using software analysis tools, a spreadsheet, or by hand. Step 2. Extract entities and the information about their relationships from imagery, SIGINT
intercepts, message traffic, or whatever other source is available to the analyst. The analyst should not limit information sources, so long as they provide valid and pertinent information.
Step 3. Place names of individuals and organizations along the angled side of the triangle; one individual or organization corresponds to a single row and a single column. Personalities must be listed in exactly the same order in the association matrix and the activities matrix to ensure that all possible associations are correct.
Step 4. Analyze the entities and associations in the matrix. Place a solid circle in boxes where entities in columns and rows meet that have an association. Circles are colored in solidly for known associations and left un-colored for suspected associations.
Note. Analysts may add additional symbols and/or colors to an association matrix to clarify relationships between entities. For example, the analyst could use half-colored circles to denote a greater probability of association (using subjective probability; see chapter 3); or the analyst could color association circles green to denote the association involves money.

Core Army Analytic Techniques
18 August 2014 ATP 2-33.4 5-11
ACTIVITIES MATRIX
5-37. An activities matrix is used to determine connections between an individual and organizations, events, locations, or activities (excluding other individuals).
Facts
5-38. The activities matrix is a rectangular array of personalities compared against activities, locations, events, or other appropriate information. The kind and quantity of data that is available to the analyst determines the number of rows and columns and their content. The analyst may tailor the matrix to fit the needs of the problem at hand or may add to it as the problem expands in scope.
5-39. The activities matrix normally is constructed with personalities arranged in a vertical listing on the side of the matrix with events, activities, organizations, addresses, or any other common denominator arranged along the bottom or top of the matrix. The activities matrix is critical for the study of a group’s internal and external activities, external ties and linkages, and even modus operandi.
The Method
5-40. Creating the activities matrix involves four steps: Step 1. Construct a rectangular matrix with multiple columns and rows in a table. This may be
done using software analysis tools, a spreadsheet, or by hand. Step 2. Extract entities and the information about their relationships from imagery, SIGINT
intercepts, message traffic, or whatever other source available to the analyst. The analyst should not limit information sources, so long as they provide valid and pertinent information.
Step 3. Place names of individuals and organizations along one side; one individual or organization corresponds to a single row. Personalities must be listed in exactly the same order in the association matrix and the activities matrix to ensure that all possible associations are correctly identified. Place activities, locations, buildings, and facilities along the top or bottom; one place, activity, location, building, or facility corresponds to a single column.
Step 4. Analyze the entities and associations in the matrix. Place a solid circle in boxes where entities in columns and rows meet that have an association. Circles are colored in solidly for known associations and left un-colored for suspected associations.
Note. Analysts may add additional symbols and/or colors to an activities matrix to clarify relationships between entities. For example, the analyst could use half-colored circles to denote a greater probability of association (using subjective probability; see chapter 3). Figure 5-4 on page 5-12 is an example of an activities matrix.
5-41. Similar to the association matrix, confirmed or “strong” associations between individuals and non-personal entities are shown with a solid circle or dot, while suspected or “weak” associations are illustrated by an open circle. Using matrices, the analyst can pinpoint the optimal targets for further intelligence collection, identify key personalities within an organization, and considerably increase the analyst’s understanding of an organization and its structure. Matrices can be used to present briefings, evidence, or to store information in a concise and understandable manner within a database. Matrices do not replace standard reporting procedures or standard database files.
Note. It is possible, and sometimes productive, to use one matrix for all associations, personal and non-personal; this is done routinely using automated systems. However, when an analytical problem includes more than approximately fifty entities (persons and other things), experience has shown the use of one manual matrix to be cumbersome and difficult to comprehend and manage.

Chapter 5
5-12 ATP 2-33.4 18 August 2014
Figure 5-4. Example activities matrix
LINK DIAGRAM
5-42. A link diagram graphically displays connections between individuals, organizations, and activities. Link diagrams are created from information contained in a unit’s historical files and from information that is currently being reported. Analysts should use a link diagram whenever individuals, groups, group activities, or process networks are being reviewed for insight. The need for link diagrams increases with the increase in data and network complexity.
Facts
5-43. A link diagram is a living document in that it is never finished. Link analysis provides a freeze-frame look at activity and seldom conveys change over time unless paired with a timeline or other multidimensional approach. To remain relevant and effective, link diagrams must be continually updated to include all relevant reported information. Link diagrams can be created manually or by using software applications on some intelligence systems. For example, the DCGS-A has Analyst Notebook programmed on it.
5-44. Link diagrams can clarify what is known and what may be missing about the network being charted. Key nodes and hubs can be identified for social, organizational, and infrastructure networks, giving insight into relationships and potential vulnerabilities. The charts greatly aid collection planning. Analysts could assume a central figure in a network is the leader because of the number of connections to that individual. However, analysts should be aware that link diagrams do not depict time relationships.
The Method
5-45. Creating a link diagram involves five steps: Step 1. Extract entities and the information about their relationships from association and
activities matrices, imagery, SIGINT intercepts, message traffic. Step 2. Place entity associations into a link diagram by using a software link analysis tool or
spreadsheet or drawing it by hand. Step 3. Analyze the entities and links in the link diagram.

Core Army Analytic Techniques
18 August 2014 ATP 2-33.4 5-13
Note. Link diagrams are comprised of symbols. Circles denote individuals or organizations; squares denote activities; triangles or rectangles may denote buildings and facilities. Solid lines between symbols denote association. Dashed lines between symbols denote possible association. The analyst may use colored and varying types of lines to show different activities (for example, green solid lines for money transfer, blue dotted lines for communications, solid black lines for activity).
Step 4. Review the diagram for gaps, significant relationships, and meaning of the relationships based on the activity occurring. Ask critical questions of the data, such as— Which entity is central or key to the network? Who or what is the initiator of interactions? What role is each entity playing in the network? Who or what forms a bridge or liaison between groups or subgroups? How have the interactions changed over time? Which nodes should be targeted for collection or defeated?
Step 5. Summarize what is seen in the diagram and draw interim hypotheses regarding the relationships.
5-46. The following can assist when using link diagrams: Watch for clutter. Charts may become cluttered by too much data; peripheral data may be set
aside. Use simple charts. Large complex charts can be broken into smaller charts. Eliminate crossing lines to increase clarity. Use computerized software. The charting portion of link analysis may be greatly aided by the
use of computerized software such as Analyst Notebook because it allows one to instantly redraw the chart as new information becomes available.
5-47. Figure 5-5 is an example of a manually constructed link diagram using some of the information from the association matrix (see figure 5-3 on page 5-10) and the activities matrix (see figure 5-4).
Figure 5-5. Example link diagram

Chapter 5
5-14 ATP 2-33.4 18 August 2014
NETWORK ANALYSIS 5-48. As performed by intelligence analysts, network analysis is the examination of dynamic, multi-link human networks characterized by varying degrees of uncertainty, such as terrorist and other irregular threat organizations usually encountered in a counterinsurgency mission. Unlike conventional hierarchical military organizations, these types of organizations are cellular and distributed. Part of the difficulty in countering these types of organizations is to understand how they evolve, change, adapt, and can be destabilized. Network analysis involves knowledge management, research, and modeling techniques to extrapolate the structure, locations, members, goals and objectives, activities, and the defeat mechanism for these types of organizations.
LINK ANALYSIS OR NETWORK ANALYSIS
5-49. These two analytic techniques are very close and often the names are used interchangeably.
Facts
5-50. Both techniques use visualization tools to depict enemy networks; superficially, they may look very similar. But there are some differences the analyst should understand.
Link analysis is a quicker, more superficial look at the connections and associations between individuals, organizations, events, and activities. Link analysis is the technique most often employed at the tactical level, especially at brigade and battalion analytic elements.
Network analysis takes the analytic effort to the next level. Network analysis examines the structure and types of associations, the centrality of entities within a network, and the organization of the network. It is more time and resource intensive than link analysis. Network analysis is the technique employed at the operational and strategic levels.
5-51. This is not to imply both techniques cannot be used at all levels of intelligence operations. Analysts understand the limitations of their intelligence elements and choose the best analytic technique or techniques to meet the commander’s requirements.
The Method
5-52. Conducting network analysis involves eight steps: Step 1. Construct a network chart or diagram. Extract entities and the information about their
relationships from association and activities matrices, imagery, SIGINT intercepts, and message traffic. Place entity associations into a network diagram by using a software tool or spreadsheet. Each element is represented by an icon (such as a picture, figure of a person, figure of a building). The more accurate the icon, the more informative the network diagram will be to analysts. Draw connections between elements.
Step 2. Identify, combine, or separate nodal components. List each node in a database or software program. Delineate each node and interaction by criteria meaningful to your analysis. These criteria may include frequency of contact, type of contact, type of activity, and source of information. The network diagram may be made more informative by re-coloring connections to present each criterion in a different color or style.
Step 3. Identify the functions of each node, as possible. Determine centrality; examine network density and distance: What is the centrality of each node within the network? What role is each entity involved in the network? Who or what forms a bridge or liaison between groups or subgroups? How have the interactions changed over time? Which nodes should be targeted for collection or defeated?
Note. Organizational structure, centrality, and network density and distance are fundamental concepts to network analysis. These concepts are explained beginning at paragraph 5-62.

Core Army Analytic Techniques
18 August 2014 ATP 2-33.4 5-15
Step 4. Cluster the nodes. Look for dense areas of the diagram. Draw shapes around the dense areas using a variety of shapes, colors, and line styles to denote different types of clusters, relative confidence in the cluster, or any other criteria deemed important.
Step 5. Review the clusters in the diagram for gaps, significant relationships, meanings of relationships, network structure, centrality, and network density and distance. Identify the clusters’ functions in the larger network.
Step 6. Chart the flow of activities between nodes and clusters. Analyze the flow to assess the resiliency of the network. Ask the following questions to identify activities, indicators, and lines of authority: Which node is the initiator of interactions? Does it always go in one direction or in multiple directions? Are the same or different elements and/or nodes involved? What are the pathways? If one node or pathway were removed, would there be alternatives already built in?
Step 7. Group the clusters into larger clusters to identify larger organizational networks. Identify network structure of nodes in relation to other nodes within the larger cluster. Determine centrality of nodes in relation to other nodes within the larger cluster. Examine network density and distance of the nodal cluster.
Step 8. Summarize what is depicted in the diagram and draw hypotheses regarding the network. Continually update and revise the network diagram as nodes or links change or are added.
FUNDAMENTAL CONCEPTS OF NETWORK ANALYSIS
5-53. Analysts must understand the linkage or connection between components of a system or group performing identical, similar, related, or complementary activities or functions. Viewed as a system, a network is an interconnected or interrelated group, or chain—a functionally, physically, and/or behaviorally related group of regularly interacting or interdependent elements—that forms a unified whole. Analysts identify critical nodes or points in order to exploit the network.
5-54. A network consists of individuals and other elements and connections between them. Individuals in a network are called nodes. A node may also be a non-person point at which subsidiary parts of the system originate or center (such as the intelligence node or the logistics node of a terrorist cell). A critical node is an element, position, or command and control entity whose disruption or destruction immediately degrades the ability of a force to command, control, or effectively conduct operations. Network analysis is the analysis of how the nodes of a designated system function in relation to one another. Network analysis assists in identifying critical nodes of the system. Network analysis is comprised of identifying a system or network, identifying the system’s subsystems, and identifying the critical nodes of the subsystems for potential targeting.
5-55. Network analysis can be conducted at the strategic, operational, and tactical levels, and may be conducted across strategic, operational, and tactical levels.
5-56. Analysts conducting network analysis will spend a great deal of time working with various pieces of information to assist them in understanding relationships. Relationships can exist between people, organizations, entities, locations, or any combination of the above, and can be represented using a link diagram. How the various groups interact is as important as knowing who knows (or should know) whom. Relationships are also present within a network itself. A network is a complex, interconnected group or system which, in some manner, concerns itself with a specific operation or mission, such as air defense or mortar fire or IEDs.
5-57. A system consists of interconnected nodes and links. Nodes represent the tangible elements within a system that can be targeted for action, such as
people, places, or things (for example, materiel or facilities). Links are the behavioral or functional relationships between nodes, such as the command or
supervisory arrangements that connect a superior to a subordinate; the relationship of a vehicle to a fuel source; and the ideology that connects a propagandist to a group of terrorists. Links help

Chapter 5
5-16 ATP 2-33.4 18 August 2014
commanders and staffs visualize how various systems work internally and interact with each other. They establish the interconnectivity between nodes that allows them to work together as a system—to behave in a specific way (accomplish a task or perform a function).
5-58. Both nodes and links are symbolic representations meant to simplify the complexity of the real world; they are useful in identifying centers of gravity, critical nodes, and other lines of effort the command may wish to influence or change during an operation.
5-59. Enemy networks do not exist in a vacuum. They interact with each other, their supporters in the population, and, less directly, with their supporters obscured in the power structure. They also interact with political, security, economic, and real estate key leaders as well as the general population. Networks are notably resistant to the loss of any one or even several nodes, so the focus of targeting is to identify not just who or what to target but, if targeted, what loss will cause the most damage to the network. The ultimate success is to remove sufficient critical nodes simultaneously or nearly, so the network cannot automatically re-route linkages but suffers catastrophic failure.
5-60. Figure 5-6 shows a simple example of nodes and links in a threat’s air defense system. The air defense system (a node in the military system) and its radars and missiles (nodes in the air defense system) are linked to each other and to the maneuver divisions and corps headquarters by their role and ability to protect these nodes from air attack. Identifying vulnerabilities and using this advantage to attack and destroy the air defense radars eliminates the link between the radars and air defense missile, degrading the air defense system’s ability to function effectively. This reduces the level of air defense protection for the maneuver divisions and makes them more susceptible to friendly forces’ attack. In other words, it could be unnecessary to attack all nodes in the air defense system in order to degrade its primary function. In figure 5-6, the analyst determined the air defense radars were a key node because it is a node that is critical to the functioning of the air defense system.
5-61. Networks are analyzed by examining the organizational structure, centrality of nodes within the network, and organizational-level analysis.
Figure 5-6. Nodal linkage example
Organizational Structure
5-62. The cell is the smallest element of organizations. Cell members, usually three to ten people, comprise a cell and act as the basic component for the organization. A cell could, however, be a lone member. One of the primary reasons for a cellular configuration is security. The compromise or loss of one cell should not

Core Army Analytic Techniques
18 August 2014 ATP 2-33.4 5-17
compromise the identity, location, or actions of other cells. Compartmenting functions within organizational structure makes it difficult to penetrate the entire organization. Personnel within one cell are often unaware of the existence of other cells and cannot provide sensitive information to infiltrators or captors.
5-63. Cells may be based on family or employment relationships, on a geographic basis, or by specific functions such as direct action or intelligence. The organization may also form multifunctional cells. Cell members remain in close contact with each other, given allowance and guidance by a directing authority, in order to provide motivational support and enhance security procedures. The cell leader is normally the only person who communicates and coordinates with higher levels and other cells. Organizations may form only one cell or may form several cells that operate in local or regional areas, across national borders, or among several countries in transnational operations.
5-64. There are two basic ways for organizations to be structured: organizations may use hierarchical or networked structures. A group may also employ either type or a combination of the two models; and the structure may change at different levels of the organization.
Hierarchical structure: Hierarchical structure organizations are those that have a well-defined vertical chain of
command, control, and responsibility. Data and intelligence flows up and down organizational channels that correspond to these vertical chains, but may not necessarily move horizontally through the organization. Figure 5-7 illustrates hierarchically structured organizations; both military and terrorist organization may use this structure.
Hierarchical organizations feature specialization of functions in their subordinate cells, such as support, operations, and intelligence. Usually, only the cell leader has knowledge of other cells or contacts, and only senior leaders have visibility of the organization at large.
Figure 5-7. Hierarchical organization

Chapter 5
5-18 ATP 2-33.4 18 August 2014
Note. Military organizations’ order of battle is a type of hierarchical network in which the cell leaders are military commanders and leaders. Unlike insurgent or terrorist cell organization, military organization and leadership is generally known by all members of the organization.
Networked structure: The analyst will encounter increasingly broader systems of networks as groups become
more experienced. Groups based on religious or single-issue motives may lack a specific political or nationalistic agenda. They have less need for a hierarchical structure to coordinate plans and actions. Instead, they can depend and even thrive on loose affiliation with groups or individuals from a variety of locations. General goals and targets are announced and individuals or cells are expected to use flexibility and initiative to conduct action in support of these guidelines.
The effectiveness of a networked organization is dependent on several considerations. The network achieves long-term organizational effectiveness when cells share a unifying ideology, common goals, or mutual interests. A difficulty for network organizations not sharing a unifying ideology is cells can pursue objectives or take actions that do not meet the goals of the organization, or are counterproductive. In this instance, the independence of cells fails to develop synergy between their activities and limits their contribution to common or selective objectives.
Networks distribute the responsibility for operations and plan for redundancies of key functions. Cells do not contact or coordinate with other cells except for coordination essential to a particular operation or function. Avoiding unnecessary coordination or command approval for action provides ability for terrorist leaders to deny responsibility of specified acts of terror, as well as to enhance operational security.
Figure 5-8 shows an example of a network organization and structural options.
Figure 5-8. Networked organization and structural options example
5-65. Networks are not necessarily dependent on modern information technology for effective command and control. The organizational structure and the flow of information and guidance inside the organization are defining aspects of networks. While information technology can make networks more effective, low technology means (such as couriers, paper messages, and landline telephones) can enable networks to avoid detection and operate effectively in certain circumstances.

Core Army Analytic Techniques
18 August 2014 ATP 2-33.4 5-19
5-66. While each network’s organization varies based on the requirements of each individual network, there are some common network structural options seen throughout networks. These common structures within networks include the chain, hub-and-wheel, all-channel, affiliate associate, and independent confederate.
Chain
5-67. In a chain configuration, each cell links to the node next in sequence. Communication between the nodes is by passing information along the line. This organization is common among networks that smuggle goods and people or launder money. Sever one node or link and the chain is disrupted until a link is reestablished. This is shown in figure 5-9.
Figure 5-9. Network chain
Hub-and-Wheel
5-68. In a network hub structure, cells communicate with one central element. The central cell need not be the leader or decisionmaker for the network. A variation of the hub is a wheel design where the outer nodes communicate with one or two other outer cells in addition to the hub. A wheel configuration is a common feature of a financial or economic network. Identifying a central node may be the desired target, or isolating a particular cell from other nodes may be preferred depending on the intended purpose (see figure 5-10).
Figure 5-10. Network hub-and-wheel
All-Channel
5-69. In an all-channel structured network, all nodes are connected to each other. The network is organizationally flat indicating there is no hierarchical command structure above it. Command and control is distributed within the network. This is communication intensive and can be a security problem if the linkages can be identified or tracked (see figure 5-11).
Figure 5-11. All-channel network
5-70. Despite their differences, the three basic types will be encountered together in networked organizations. A transnational terrorist organization might use chain networks for its money-laundering activities, tied to a wheel network handling financial matters, tied in turn to an all-channel leadership

Chapter 5
5-20 ATP 2-33.4 18 August 2014
network to direct the use of the funds into the operational activities of a hub network conducting preliminary targeting surveillance and reconnaissance.
5-71. Whatever the means of command, control, and coordination, the selection of critical nodes or linkages between and among nodes is dependent on what outcome is required. Task sets may include surveillance, disruption, destruction, or insertion of misinformation and corrupted technology as part of a larger mission set. Structures can be configured in domains such as key leaders and people, communication means, or supporting materiel infrastructure systems.
Affiliate Associate
5-72. A variation on network structure is a loosely affiliated method which depends more on an ideological intent rather than on any formalized command and control or support structure. These semi-independent or independent cells plan and act within their own means to promote a common ideological position. Irregular forces may use a combination of functional structures and support from organizations and individuals with varied local, regional, international, or transnational reach.
5-73. Individuals may interpret a theology, social cause, or perceived grievance to an extreme viewpoint and commit to collective violent acts with personal action. Cells may form from a general inspiration, such as Al Qaeda or similar ideological announcements. Other agendas may emerge from a distinctly individual assessment of purpose and conduct operations as an individual or small cell. Examples include terrorism that spotlights an agenda, such as individuals who use arson or rioting against immigrant business owners as a means to intimate. Figure 5-12 shows an example of an affiliated associate network. In this example, all connections outside the center are unconfirmed associations represented by dotted lines.
Figure 5-12. Affiliated associate network
Independent Confederate
5-74. An individual may have some direct contact with a terrorist cell or irregular force, and align belief in an extremist agenda, philosophy, or theology that promotes violent acts with personal action. An individual may also develop extremist viewpoints with no apparent external support system and decide to commit acts of violence as an individual commitment to action.
5-75. Another type of individual may be a delusional individual with psychological or physical ailments. These medical conditions are not related to functional structures and organization whose actions could be mistaken as deliberate terrorism or other criminal activity.

Core Army Analytic Techniques
18 August 2014 ATP 2-33.4 5-21
Centrality
5-76. Although largely influenced by subjective judgment, the identification of a potential key element or node may be facilitated through an analysis of centrality (for example, how elements and nodes fit in the system’s network). Centrality can highlight possible positions of importance, influence, or prominence, and patterns of connections. Relative centrality is determined by analyzing four measurable characteristics: degree centrality, closeness, betweenness, and core-periphery. Figure 5-13 is an example network to determine centrality.
Figure 5-13. Centrality example
Degree Centrality
5-77. Degree centrality describes how active an individual is in the network. Network activity for a node is measured using the concept of degrees—the number of direct connections a node has. Nodes with the most direct connections are the most active in their networks. Common wisdom in organizations is “the more connections, the better.” This is not always so. What really matters is where those connections lead and how they connect the otherwise unconnected. If a node has many ties, it is often said to be either prominent or influential. As shown in figure 5-13, node D has the highest measure of degree centrality in that it has the most number of direct links with other nodes. Node D is also an example of a hub. Degree centrality answers the question: “How many people can this person contact directly?”
Closeness
5-78. Closeness examines a node’s overall position in a network (for example, its global position). The difference between degree and closeness is an important distinction because an individual entity may have many direct contacts, but those contacts may not be well connected to the network as a whole. Consequently, although an individual may have a high level of degree centrality, power and influence might only be exerted locally, not throughout the entire network. Closeness is calculated by adding the number of hops between a node and all others in a network (for example, adding the number of hops from node A to node B, node A to node C, and node A to node D). A lower score indicates that an individual needs fewer hops to reach others in the network, and is therefore closer to others in the network. For example, nodes F and G in figure 5-13 have fewer direct links than node D, but have shorter paths to the other nodes. Nodes with high closeness centrality are in excellent positions to monitor the overall activity flow within the network. Closeness answers the question: “How fast can this person reach everyone in the network.”
Betweenness
5-79. Betweenness measures the number of times a node lies along the shortest path between two others. For exchange of information or services, a node with high betweenness may play an important brokerage or intermediary role. For example, in figure 5-13 node H would occupy one of the most important locations in

Chapter 5
5-22 ATP 2-33.4 18 August 2014
the network by serving as the only link between nodes I and J, and the remainder of the network. Node H is an example of a broker node and (assuming nodes I and J were sufficiently important to the network as a whole) it might also be designated as a key node. The elimination of a broker node can fragment a network into several subcomponents. Betweenness answers the question: “How likely is this person to be the most direct route between two people in the network?”
Core-Periphery
5-80. Core-periphery is a statement of how close to the core an organization is versus how much on the periphery of an organization is a particular node. It is determined by the centrality of a node.
5-81. Nodes on the periphery receive very low centrality scores. However, peripheral nodes are often connected to networks that are not currently mapped. The peripheral nodes may be resource gatherers or individuals with their own network outside the group. These characteristics make them important resources for fresh information not available inside their group. In figure 5-13 on page 5-21, nodes I and J are on the periphery of the group.
Organizational-Level Analysis
5-82. Organizational-level analysis provides insight about the enemy organization’s form, efficiency, and cohesion. For example, a regional insurgency may consist of large numbers of disconnected subinsurgencies. As a result, each group should be analyzed based on its capacities as compared to the other groups. Organizational-level capacities can be described in terms of network density and network distance. Each measure describes a characteristic of a networked organization’s structure. Different network structures can support or hinder an organization’s capabilities. Therefore, each organizational measure supports the analyst’s assessment of subgroup capabilities.
5-83. Systems network analysis facilitates the identification of significant information about a group of entities that might otherwise go unnoticed. For example, network analysis can uncover positions of power within a network, show the basic subgroups that account for a network’s structure, find individuals or groups whose removal would greatly alter the network, and measure network change over time. The impact of a system’s network should be evaluated in terms of network density and distance.
Network Density
5-84. Network density examines how well connected a node is by comparing the number of ties actually present in a network to the total number of ties possible. Network density can indicate many things. When a network is highly interconnected, fewer constraints exist for the individuals within it: they may be less likely to rely on others as brokers of information, be in a better position to participate in activities, or be closer to leaders and therefore able to exert more influence upon them.
5-85. A network with low interconnectivity may indicate that there are clear divisions within a network (for example, along clan or political lines), or that the distribution of power or information is highly uneven and tightly controlled. Comparing densities between enemy subgroups provides commanders with an indication of which group is most capable of a coordinated attack and which group is the most difficult to disrupt. Figure 5-14 shows three networks with different densities. Network B has the highest network density; network C the lowest.
5-86. Most network measures, including network density, can be mapped out to evaluate performance over time. Based on changes in network density over time, a commander can—
Monitor enemy capabilities. Monitor the effects of recent operations. Develop tactics to further fragment the insurgency.

Core Army Analytic Techniques
18 August 2014 ATP 2-33.4 5-23
Figure 5-14. Network density comparison
5-87. An increase in network density indicates the likelihood that the group can conduct coordinated attacks. A decrease in network density means the group is reduced to fragmented or individual-level attacks. A well-executed counterinsurgency eventually results in only low network-density subgroups. This is because high network-density subgroups require only the capture of one highly connected member to lead police or military forces to the rest of the group. Therefore, while high network-density groups are the most dangerous, they are also the easiest to defeat and disrupt. Figure 5-15 is an example of how tactics and activities can change based on network density.
Figure 5-15. Example to change in tactics based on density shifts

Chapter 5
5-24 ATP 2-33.4 18 August 2014
5-88. Network density does not consider how distributed the connections are between the nodes in a network. Better metrics of group and organizational performance would be network centrality and core-periphery. A few nodes with a high number of connections can push up the group network density, even though the majority of the people nodes are only marginally linked to the group. In the case of a highly centralized network dominated by one or a few very connected nodes, these nodes can be removed or damaged to fragment the group further into sub-networks.
5-89. Sometimes a region may actually contain multiple subinsurgencies that are either unaware of, or even competing with, other subgroups. In this case, the group resembles a fragmented network (see figure 5-16).
Figure 5-16. Fragmented network
Network Distance
5-90. Network distance measures the number of hops between any two nodes in a network. For example, there is one hop between two nodes that are directly connected; there are two hops between nodes that are separated by one intermediary node. Evaluating network distance aids in understanding how information and influence flow through a network and determining a network’s cohesiveness. Larger distances can inhibit the dissemination of information because each hop diminishes the probability of successful interaction. In political, social, and possibly military networks, larger distances may also decrease the ability of individuals to influence others.
SOCIOMETRICS OR SOCIAL NETWORK ANALYSIS 5-91. Social network analysis (SNA) is another tool for understanding the organizational dynamics of an insurgency and/or terrorist network and how best to exploit it. It is the mathematical measuring of variables related to the distance between nodes and the types of associations in order to derive meaning from the network diagram, especially about the degree and type of influence one node has on another. SNA—
Allows analysts to identify and portray the details of a network structure. Shows how a networked organization behaves and how that connectivity affects its behavior. Allows analysts to assess the network’s design, how its member may or may not act
autonomously, where the leadership resides or how it is distributed among members, and how hierarchical dynamics may mix or not mix with network dynamics.
Is most effective when employing a specialized software application. The basic processes and measures can be conducted, however, using centrality and network density and distance detailed above.

Core Army Analytic Techniques
18 August 2014 ATP 2-33.4 5-25
Differs from network analysis in that it focuses on the individual and interpersonal relations within the network.
Supports a commander’s requirement to describe, estimate, and predict the dynamic structure of an enemy organization.
Provides commanders a useful tool to gauge their operations’ effectiveness. Allows analysts to assess the insurgency’s adaptation to operational environments and friendly
operations.
5-92. Analyzing the social networks of an individual includes identifying family members and looking at relationships both inside and outside the organization (for example, other network members, local leaders not in the organization, police contacts, sympathizers, or facilitators). Used in parallel with pattern analysis, SNA allows linking of the WHO to the WHERE and WHEN. Using the organizational model, we can apply SNA to build a picture of WHO in the area is involved, HOW they are involved, and WHAT their part is in the network.
5-93. Analysts use SNA to assess organizational behavior based on links between individuals and systems within the decisionmaking context of the organization. It can be applied to all facets of the organization or network, including but not limited to support mechanisms, information operations, political aspects, violent activities, and logistics operations in order to better understand the function of the organization or network.
5-94. SNA allows analysts to identify individuals and/or systems that drive networks and to identify vulnerabilities within these systems. Analysts can then understand how to most effectively reinforce or destabilize systems within a network or organization.
5-95. As an example, an analyst can apply SNA to the logistical support activities of a network and determine that a particular criminal enterprise was necessary for the operation of the logistics system. The analyst may also determine that a particular individual drove the decisionmaking within a logistics cell. Once identified, these vulnerabilities can be targeted.
5-96. Additionally, SNA assists in the targeting process by identifying individuals, such as family members and community contacts, for potential targeting to locate the high-value individual (HVI). For example, if the location or phone number of the HVI is unknown, but the analyst knows the location and phone number of the HVI’s spouse or known business contact, these social contacts of the HVI can be targeted in order to identify the unknown location and number. The targeting of the HVI’s social network can provide intelligence in identifying and locating the HVI themselves.
5-97. Social networks may be an important aspect of a social structure as well as within the enemy organization. Common types of networks include elite networks, prison networks, worldwide ethnic and religious communities, and neighborhood networks. Networks can have many purposes, such as economic, criminal, and emotional. Effective SNA considers the structure of a network and the nature of interactions between network members.
5-98. Leaders should strive to cultivate relationships with social node influencers. Social nodes in present and future theaters of operation might include tribal, religious, civic, and other leaders. Leaders should seek to develop and sustain personal relationships with these and other social nodes and cull their opinions on policy and operations. For instance, contracts awarded to one tribe may enflame resentment of another that may then fuel insurgent or criminal activity.
SECTION III – CONDUCTING PATTERN ANALYSIS
5-99. Conducting pattern analysis is an analytical technique that aids intelligence personnel in determining possible enemy future actions when there is little or no near real-time information available concerning enemy location, disposition, movement, or objectives. For example, conventional threats may use tactics that mask them from collection assets in order to avoid detection. Unconventional forces may be largely invisible to collection assets. When either of these is the case, intelligence personnel analyze how the enemy has operated in the past to predict how the enemy may operate in the future. There are three basic activities involved in conducting pattern analysis: determine what is known about the enemy, conduct a pattern analysis of the enemy’s recent activity, and determine possible enemy actions. (See FM 2-01.3 for more information on IPB.)

Chapter 5
5-26 ATP 2-33.4 18 August 2014
5-100. Conducting pattern analysis aids intelligence personnel in determining when, where, and what type of enemy activity may occur in the future by determining when, where, and what type of enemy activity occurred in the past. There are four basic activities associated with pattern analysis: chronologies are the basic method of tracking events in time (including timelines and time event charts); plotting enemy activity on a pattern analysis plot sheet; plotting enemy activity on an incident overlay; and conducting a pattern of life analysis.
5-101. All four of these visualization aids are effective when conducting pattern analysis in order to visualize patterns in time, space, and activity. All four are effective when analyzing conventional military forces and unconventional, complex, adaptive threat networks. Through pattern analysis, intelligence personnel may anticipate future enemy attacks and identify high-payoff targets. Pattern analysis can also be used to refine assessments related to threat characteristics.
5-102. The following four pattern analysis tools may be used concurrently or separately, as the analyst deems appropriate:
Chronologies. Timelines. Time event charts.
Pattern analysis plot sheet. Incident overlay. Pattern of life analysis.
CHRONOLOGIES 5-103. A chronology is a list placing events or actions into the order in which they occurred; a timeline is a graphic depiction of those events. Both are used to identify trends or relationships between the events or actions and, in the case of a timeline, between the events and actions as well as other events or actions in the context of the overarching intelligence problem.
5-104. Analysts use two types of chronologies: timelines and time event charts. Timelines are a basic tool to aid in organizing events or actions. Time event charts are visualization tools that may be manipulated to aid in determining patterns. These techniques can be used whenever it is important to understand the timing and sequence of relevant events as well as to identify key events and gaps. These events may have a cause-and-effect relationship, or they may not.
TIMELINES
5-105. Timelines aid in the identification of patterns and correlations between events. The tool allows the analyst to relate seemingly random events to the big picture to highlight or identify significant changes or assist in the discovery of trends, developing issues, or anomalies.
Facts
5-106. Timelines are linear and are related to a single situation or COAs. Multiple-level timelines allow analysts to track concurrent COAs that may have an impact on each other. While timelines may be developed at the onset of an analytic task to ascertain the context of the activity to be analyzed, timelines also may be used to assist analysts in postmortem intelligence studies to break down intelligence and find the causes for intelligence failures and highlight significant events after an intelligence surprise. The activities on a timeline also can lead the analyst to hypothesize that particular events occurred between known events in order for them to flow correctly. The analyst can then be aware of indicators to look for so the missing events are found and charted. Timelines organize information in a format that can be easily understood in a briefing. This technique also can support the use of other structured analytic methods, such as event trees and techniques, for analyzing complex networks and associations.
5-107. The analyst must be careful not to assume that events following earlier events are caused by the earlier events; there may be no causal relationship involved. The value of this tool can be reduced if the analyst using it lacks creativity in finding contextual events that relate to the information in the chronology

Core Army Analytic Techniques
18 August 2014 ATP 2-33.4 5-27
or timeline. The analyst must consider factors that may influence the timing; for example, the chronological time of attacks may vary by several hours, but be driven by the lunar cycle (moonset), religious events, or friendly patrol patterns. Figure 5-17 shows a simple timeline.
Figure 5-17. Timeline example
The Method
5-108. Creating a chronology, or timeline, involves three steps: Step 1. As you research the problem, ensure the relevant information is listed with the date or
order in which it occurred. Analysts should ensure they properly reference the data. Step 2. Review the chronology, or timeline, by asking the following questions:
What are the temporal distances between key events? If lengthy, what caused the delay? Are there missing pieces of data that may fill those gaps that should be collected?
Did the analyst overlook pieces of intelligence information that may have had an impact on the events?
Conversely, if events seem to happen more rapidly than expected, is it possible that the analyst has information related to multiple event timelines?
Are all critical events necessary and shown for the outcome to occur? What are the intelligence gaps? What are the vulnerabilities in the timeline for collection activities? What events outside this timeline could have influenced the activities?
Step 3. If preparing a timeline, summarize the data along a line, usually horizontal or vertical. The sides of the line can be used to distinguish between types of data. If more than one person is involved, multiple lines can be used, showing how and where they converge.
5-109. The following can assist when using this technique: Consider chronologies and timelines; they are effective, yet simple, ways for analysts to order
incoming information on a daily basis as they go through their daily message traffic. Use tools such as Excel (drawing function) or Analyst Notebook to draw the timeline.
TIME EVENT CHART
5-110. A time event chart is a method for visualizing individual or group actions chronologically. They are designed to store and display large amounts of information in a small space. Analysts can use time event charts to help analyze larger scale patterns of such things as activities and relationships. It uses symbols to represent events, dates, and the flow of time. Triangles are used to depict the beginning or end of the chart. Rectangles are used to store administrative data and indicate events or activities. An “X” through an event highlights a significant event or activity. Each event (rectangle) contains a sequence number and date. An incident description is written below the event symbol providing a brief explanation of the event.

Chapter 5
5-28 ATP 2-33.4 18 August 2014
Facts
5-111. Figure 5-18 is an example of a time event chart. In this example, two months after being organized, members of a group received demolitions training to include a substantial amount of money from drug smugglers. Three weeks later three members (narcotics traffickers) drove to Kabul and four-to-five days after their arrival, there was a bombing at the Kabul Airport for which they claimed responsibility. Several months later, four members drove to Kandahar and shortly afterwards (four days) another bombing occurred, this time at police headquarters.
Figure 5-18. Time event chart example
5-112. Using the information from this example intelligence personnel can determine several details regarding future attacks:
The group operates in teams of three-to-four personnel. Seven members of the group received demolitions training in Pakistan, giving the team an
operational capability of conducting multiple attacks. Attacks occur 4 to 5 days after a team arrives at a target area. This delay is likely to allow the
team to reconnoiter both the target and target area. The pattern indicates the group will conduct an attack in Herat on 21 or 22 January 2015.
The Method
5-113. There is great latitude in preparing time event charts. The methodology is the same as chronologies and timelines, with the following specific techniques employed for time event charts:
The beginning of the chart is shown with triangles. Other events are shown with squares. Noteworthy events have an X drawn across the square. The date is always on the symbol. A description is below the symbol. The flow is from left to right for each row.
PATTERN ANALYSIS PLOT SHEET 5-114. The pattern analysis plot sheet, as shown in figure 5-19, depicts patterns in time and activity. It aids intelligence personnel in identifying when the threat tends to conduct specific types of activities. The pattern analysis plot sheet is a circular matrix and a calendar. The matrix is divided into sections based on time; generally divided by hour and subdivided into concentric rings that identify days.

Core Army Analytic Techniques
18 August 2014 ATP 2-33.4 5-29
Figure 5-19. Pattern analysis plot sheet example
FACTS
5-115. In the example shown in figure 5-19, six enemy ambushes occurred in the first part of the month between 1800 and 1900. However, later in the month, two ambushes occurred between 1900 and 2000. This could indicate a shift in threat tactics, techniques, and procedures. Further analysis is needed to determine if that is correct. For example, a change in friendly operations may be the cause for the shift. The pattern analysis plot sheet is an effective tool in visualizing timeframes and types of enemy activity, but it must be used in conjunction with other intelligence to aid logical conclusions.

Chapter 5
5-30 ATP 2-33.4 18 August 2014
THE METHOD
5-116. There is some latitude in preparing pattern analysis plot sheets. The methodology is the same as chronologies and timelines, with the following specific techniques employed for the pattern analysis plot wheel:
Different symbols are used for each type of incident. All symbols are tracked in a legend. All incidents are marked on the time-wheel matrix and the calendar. Noteworthy events may be annotated with footnotes. If the analyst uses this method, the symbol
must be marked on both the time-wheel matrix and the calendar; the footnote is then described separately below the calendar or in a location near the pattern analysis plot sheet.
INCIDENT OVERLAY 5-117. Incident overlays, as shown in figure 5-20, are similar to the situation map. It displays activities spatially. It is useful in visualizing spatial patterns; however, it does not provide visual representation of temporal patterns. Just as the situation map cannot stand alone without further intelligence products or written reports to fill in the details, the incident overlay can only illustrate on a map or image what and where an event took place. It is critical to include a legend on the incident overlay and a time period covered.
Figure 5-20. Incident overlay example
FACTS
5-118. The incident overlay is constructed by plotting specific activities on the map using appropriate symbols. Counterinsurgency and other stability-dominated environments may require using many unfamiliar symbols, so it is critical to have a legend in the margin of the map. Symbols listed in ADRP 1-02 should be used as much as possible. Maps can either be imagery or standard military maps. Use whichever map the commander prefers. Incident overlays are excellent briefing tools to update the enemy situation within a unit’s AO.

Core Army Analytic Techniques
18 August 2014 ATP 2-33.4 5-31
THE METHOD
5-119. Creating an incident overlay involved three steps: Step 1. Select the type of incidents to display. The overlay may be used to display a particular
type of incident, incidents by a particular cell, or other incidents at the analyst’s discretion. As you research the problem, ensure the relevant information is listed with the date or order in which it occurred. Make sure the data are properly referenced.
Step 2. Plot the incidents on an overlay to show activity spatially. The analyst examines the incident overlay asking the following questions at a minimum: What are the spatial distances between events? How near are the events? If spatially close,
what terrain or circumstances may have caused the grouping? Are there missing pieces of data that may fill those gaps that should be collected?
Did the analyst overlook pieces of intelligence information that may have affected the events? Conversely, if events seem to happen more spatially distant from one another, is there a reason for
the remoteness? Is it possible that the analyst has information related to multiple groups or cells? What are the intelligence gaps? Are there changes in tactics, techniques, or procedures
spatially apparent on the incident overlay? What are the vulnerabilities in the incident overlay for collection activities? What events outside this overlay could have influenced the activities?
Step 3. Display multiple incident overlays, using color coding of specific events or cells. Analyze the multiple incident overlays for any patterns, asking the same questions as above. Summarize the data in the incident overlay.
PATTERN OF LIFE ANALYSIS 5-120. Pattern of life analysis is a focused analysis ofwhere and when a target has been with the intent to predict where the target will be. This analysis aids operational planning directly. Pattern of life analysis uses network diagrams and timelines to display a target’s historical movement patterns in time and space.
FACTS
5-121. Pattern of life analysis should be as in-depth as possible. It should include potential refuge locations, work locations, travel patterns, known vehicles, and social activities. Pattern of life factors can and should be developed from as many sources as possible. This will require routine contact with local operational management teams, human intelligence collection teams, and the supporting SIGINT section. Higher echelon collection assets are also used to corroborate the patterns of life.
5-122. Used in concert with network analysis and/or link analysis, pattern of life analysis is useful in the targeting process to determine the location the HVI will be at, and when the HVI will be there. For example, if the analyst identifies that an HVI visits a particular restaurant, the location can be monitored as an anticipated future location of the HVI for time-sensitive targeting.
THE METHOD
5-123. Pattern of life analysis is a combination of multiple techniques: Step 1. Select pattern analysis tools to be used and focus on the target as you construct it. Step 2. Construct a pattern of life network diagram, visually linking events, people, objects, and places
in time and space to the target. The diagram is constructed so the flow of events is from left to right. Step 3. Review the pattern of life network diagram and pattern analysis tools; analyze the target
to determine any patterns that may predict future events or places where the target may be. Ask the following questions at a minimum: What are the temporal distances between key events? If lengthy, what caused the delay?
Are there missing pieces of data that may fill those gaps that should be collected? Did the analyst overlook pieces of intelligence information that may have had an impact on
the events?

Chapter 5
5-32 ATP 2-33.4 18 August 2014
Conversely, if events seem to happen more rapidly than expected, is it possible that the analyst has information related to multiple targets?
Are certain critical events necessary for the predicted location of the target to occur? What are the intelligence gaps? What collection may fill those gaps? What are the vulnerabilities in the target’s timeline for collection activities? What events outside this timeline could have influenced the activities?

18 August 2014 ATP 2-33.4 6-1
PART THREE
Considerations for Decisive Action and Unique Missions
Chapter 6
Analytic Support to Decisive Action
This chapter describes the analytical support to decisive action. It addresses the analytical support process to offensive, defensive, stability, and DSCA operations. The analytical techniques used in decisive action are also discussed. Additionally, analytical support to unique operations, including building partnership capacity, protection, and synchronizing information-related capabilities, are addressed.
OVERVIEW 6-1. The overarching concept that directs the Army is unified land operations. ADP 3-0 establishes the principles of unified land operations and discusses how the Army seizes, retains, and exploits the initiative through simultaneous offensive, defensive, and stability tasks. The analytical process does not drastically differ whether in the offense, defense, or stability tasks. The difference lies in the tempo in which offensive and defensive tasks are conducted versus the tempo in which stability tasks are conducted.
ANALYTIC SUPPORT TO UNIFIED LAND OPERATIONS 6-2. In offensive and defensive tasks, the actions that occur within the operations process and commander’s decisionmaking are accelerated to match the quickly changing conditions within the AO. In stability tasks, success is measured in far different terms from offense and defense. Time may be the ultimate arbiter of success: time to bring safety and security to an embattled populace; time to provide for the essential, immediate humanitarian needs of the people; time to restore basic public order and a semblance of normalcy to life; and time to rebuild the institutions of government and market economy that provide the foundations for enduring peace and stability. Regardless of the type of operation, all-source intelligence is the primary capability within the intelligence warfighting function that aids commanders understanding of their operational environment.
ANALYTIC SUPPORT TO OFFENSIVE OPERATIONS
6-3. An offensive task is a task conducted to defeat or destroy enemy forces and seize terrain, resources, and population centers (ADRP 3-0). The overall purpose of offensive operations is to defeat, destroy, or neutralize the enemy force. A commander may also conduct offensive operations to deprive the enemy of resources, seize decisive terrain, deceive or divert the enemy, develop intelligence, or hold an enemy in position. (See ADRP 3-90.)
6-4. The principal difference between offensive and defensive or stability operations is the focus and degree of detail of analysis required for determining the enemy’s defensive framework and the effects of

Chapter 6
6-2 ATP 2-33.4 18 August 2014
terrain on friendly maneuver. Intelligence requirements generally associated with offensive operations are—
Determine what type of defense the enemy is employing. Determine location, disposition, and orientation of enemy defense. Determine enemy commander’s end state, objectives, decision points, and centers of gravity. Determine enemy commander’s intent. Identify terrain and weather that supports enemy defensive operations. Identify terrain and weather that supports friendly movement and maneuver. Determine the impact of civil considerations and displaced civilians on friendly and enemy
operations. Identify the enemy’s disruption zone, to include counterreconnaissance forces, artillery, and
electronic warfare assets. Identify the enemy battle zone. Identify the enemy support zone, to include logistics and administrative elements, counterattack
forces, and reserve forces.
ANALYTIC SUPPORT TO DEFENSIVE OPERATIONS
6-5. A defensive task is a task conducted to defeat an enemy attack, gain time, economize forces, and develop conditions favorable for offensive or stability tasks (ADRP 3-0). Defensive operations retain decisive terrain or deny the enemy access to a vital area, attrite or fix the enemy as a prelude to offensive operations, counter a surprise action by the enemy, or increase the enemy’s vulnerability by forcing the enemy to concentrate his forces. (See ADRP 3-90).
6-6. The principal difference between defensive operations and other decisive action is the focus and degree of detail of analysis required for determining the enemy’s offensive framework and the effects of terrain on friendly defensive operations. Intelligence requirements generally associated with defensive operations are—
Determine, locate, and/or track the enemy’s main and supporting efforts and likely enemy avenues of approach and mobility corridors.
Locate and/or track enemy reserves. Locate and/or track enemy reconnaissance assets. Identify enemy’s use of special munitions. Locate and/or track enemy close air support. Identify enemy deception operations. Determine enemy commander’s end state, objectives, decision points, and centers of gravity. Determine enemy commander’s intent. Identify defensible terrain. Determine the impact of civil considerations and displaced civilians on friendly and enemy
operations.
6-7. Offensive operations are either force oriented or terrain oriented. Force-oriented operations focus on the threat. Terrain-oriented operations focus on seizing and retaining control of the terrain and facilities. Detailed IPB products, such as a modified combined obstacle overlay with intervisibility lines or an event template, must be developed. (See FM 2-01.3 and FM 3-55 for more information on conducting IPB, information collection, and the role of all-source in defensive operations.)
6-8. Analysts are involved in all aspects of the military decisionmaking process and IPB. Several analytic techniques support activities and information requirements associated with defensive operations.
ANALYTIC SUPPORT TO STABILITY OPERATIONS
6-9. Stability operations is an overarching term encompassing various military missions, tasks, and activities conducted outside the United States in coordination with other instruments of national power to

Analytic Support to Decisive Action
18 August 2014 ATP 2-33.4 6-3
maintain or reestablish a safe and secure environment, provide essential governmental services, emergency infrastructure reconstruction, and humanitarian relief (JP 3-0).
6-10. The principal difference between stability operations and other decisive action is the focus and degree of detail of analysis required for the civil aspects of the environment. Unlike major combat, an environment dominated by offensive and defensive operations directed against an enemy force, stability operations encompass various military missions, tasks, and activities that are not enemy-centric.
6-11. FM 3-07 constitutes the Army’s current doctrine on stability operations. In order to conduct the analysis required for this type of operation, leaders, staffs, and Soldiers must understand the nature of stability operations and the intelligence requirements associated with it.
6-12. Constant awareness and shared understanding of civil considerations about the environment are crucial to long-term operational success in stability operations. Analysts should classify civil considerations (ASCOPE) into logical groups (tribal, political, religious, ethnic, and governmental). Intelligence analysis during operations that focus on the civil population as a center of gravity requires a different mindset and different techniques than an effort that focuses on defeating an adversary militarily.
6-13. Some situations (particularly crisis-response operations) may require analysts to focus primarily upon the effects of terrain and weather, as in the case of natural disasters or upon the resulting human catastrophe after a natural disaster. Disasters (such as wind storms, hurricanes, typhoons, floods, tsunamis, wild fires, landslides, avalanches, earthquakes, and volcanic eruptions) may occur without warning. Human-caused catastrophes (such as civil conflict, acts of terrorism, sabotage, or industrial accidents) may develop over time. The speed at which an event occurs will dictate how analysts will conduct their assessments and with whom they will share their intelligence. (See FM 2-01.3 and FM 3-55 for more information on conducting IPB, information collection, and the role of all-source in stability operations.)
ANALYTIC SUPPORT TO DEFENSE SUPPORT OF CIVIL AUTHORITIES
6-14. DSCA is support provided by U.S. Federal military forces, Army civilians, contract personnel and component assets, and National Guard forces (when the Secretary of Defense, in coordination with the Governors of the affected states, elects and requests to use those forces in Title 32, U.S. Code, status). This support is in response to requests for assistance from civil authorities for domestic emergencies, law enforcement support, and other domestic activities, or from qualifying entities for special events. (See JP 3-28 for more information on DSCA support.)
6-15. DSCA is a task that takes place only inside the United States. Some DSCA tasks are similar to stability tasks. DSCA is always conducted in support of another primary or lead Federal agency and consists of four tasks:
Provide support for domestic disasters. Provide support for domestic civilian law enforcement. Provide support for domestic chemical, biological, radiological, or nuclear incidents. Provide other designated domestic support.
6-16. The Attorney General of the United States has lead responsibility for criminal investigations of terrorist acts or terrorist threats by individuals or groups inside the United States. The Attorney General typically acts through the Federal Bureau of Investigation and cooperates with other Federal departments and agencies engaged in activities to protect national security. The Attorney General and these departments and agencies coordinate the activities of other members of the law enforcement community to detect, prevent, preempt, and disrupt terrorist attacks against the United States.
6-17. The types of intelligence support required for successful DSCA operations are the same as those required for successful offense, defense, and stability operations. Analysts support the commander’s decisionmaking process by answering pertinent commander’s critical information requirements and PIRs. Analysts supporting DSCA leverage traditional Department of Defense and other government information capabilities while assuring strict adherence to all legal frameworks. One major difference that an analyst must consider is that only unclassified information can be exchanged between Department of Defense and law enforcement.

Chapter 6
6-4 ATP 2-33.4 18 August 2014
6-18. In DSCA, analysts are expected to provide an analysis of the physical environment, weather impacts, terrorist threats, and chemical, biological, radiological, or nuclear hazards. Instead of conducting IPB, analysts conduct a modified intelligence preparation of the operational environment or situation assessment whereby the analyst continuously analyzes information regarding terrain, weather, and civil considerations. This is critical in the development of an event template or event matrix.
6-19. It is also important that analysts assigned to support a DSCA mission understand the roles and responsibilities of interagency partners, National Guard personnel, and Federal government intelligence personnel, as well as the intelligence assets, platforms, and analytical capabilities provided by these organizations. All collection must be done in coordination with the Attorney General’s designated lead.
ANALYTIC TECHNIQUES IN DECISIVE ACTION
6-20. Intelligence analysis in the Army is not usually conducted as an individual effort; it is done as a team or analytic element. Different situations require the application of different and often multiple techniques. Although no two analysts may employ the same techniques to reach a conclusion, experience has shown there are preferred techniques. The most significant factors when conducting intelligence analysis during any decisive action are time and whether or not the intelligence element is equipped to conduct the appropriate analytic techniques. Although there are other factors, both the accuracy and resolution of intelligence analysis are dependent upon time.
6-21. Analysts may find some techniques more or less useful for certain operations. Tables 6-1, 6-2, and 6-3 on pages 6-5 through 6-8 provide a quick reference guide to how each of the basic structured analytic techniques (see chapter 3) and diagnostic analytic techniques (see chapter 4) may be employed and the operation in which they are most often used. These tables are to be used as a guide and not intended to limit an analyst’s creativity in choosing appropriate techniques.

Analytic Support to Decisive Action
18 August 2014 ATP 2-33.4 6-5
Table 6-1. Use of basic diagnostic analytical techniques
Technique Used for: Often used with: Offensive/ Defensive
Stability DSCA
Sorting • Review of large amounts of data.
• Review of multiple categories of information.
• Any stage.
• Generating hypotheses (brainstorming, ACH).
• Functional analysis.
• Situational logic.
X X X
Matrices • Isolating critical data.
• Enabling analytic focus.
• ACH.
• Link analysis.
• Various pattern analysis.
X X
Threat Intentions Matrix
Reviewing most likely and reasonable alternatives.
• Indicators.
• ACH.
• Functional analysis.
• Situational logic.
X X X
Event Mapping
Visualizing structure, delineating events in a scenario.
• Indicators.
• Brainstorming.
X X
Event Trees Clarifying alternative event sequences with potential future outcomes.
• Chronologies and timelines.
• Indicators.
• ACH.
• Various pattern analyses.
X X
Subjective Probability
Identifying potential actions of threat, neutral, and friendly entities.
• Bayesian analysis.
• Rules of verification.
X X X
Weighted Ranking
Identifying potential actions of threat, neutral, and friendly entities.
• Bayesian analysis.
• Subjective probability.
• Rules of verification.
X X X
Deception Detection
Helping to determine when to look for deception.
• All other analytic techniques.
X X X
Key Assumptions Check
Making assumptions explicit and understood.
• All other analytic techniques.
X X X
Quality of Information Check
Evaluating the completeness of available information.
• All other analytic techniques.
X X X
Indicators Identifying potential actions of threat, neutral, and friendly entities.
• All other analytic techniques.
X X X
ACH analysis of competing hypotheses DSCA defense support of civil authorities

Chapter 6
6-6 ATP 2-33.4 18 August 2014
6-22. Table 6-2 provides a quick reference guide to how each of the core analytic techniques (see chapter 5) may be employed and the operations in which they are most often used.
Table 6-2. Use of core Army analytical techniques
Technique Used for: Often used with: Offensive/ Defensive
Stability DSCA
Brainstorming • Identifying potential actions of threat, neutral, and friendly entities.
• Developing information collection strategies.
• Developing targeting strategies.
Delphi techniques. X X
Comparison Identifying potential actions of threat, neutral, and friendly entities.
• Modeling. • Scientific method
X X X
Mathematical Analysis
Determining the capabilities and limitations of an organization.
Functional analysis. X X X
Situational Logic
Identifying potential actions of threat, neutral, and friendly entities.
Generation of alternative futures.
X X X
Analyzing Complex Networks and Associations
Link Analysis Evaluating relationships between organizations and individuals.
• Various pattern analyses.
• Network analysis. • Social network
analysis.
X X X
Network Analysis
Developing high-payoff targets and high-value targets.
• Various pattern analyses.
• Network analysis. • Social network
analysis.
X X X
Sociometrics/ Social Network Analysis
Evaluating the effect of civil considerations.
• Various pattern analyses.
• Network analysis. • Social network
analysis.
X X X
Pattern Analysis
Chronologies and Timelines
Organizing events or actions.
• Event trees. • Link analysis. • Indicators. • Pattern analysis. • Network analysis • Situational logic. • Pattern of life
analysis.
X X X

Analytic Support to Decisive Action
18 August 2014 ATP 2-33.4 6-7
Table 6-2. Use of core Army analytical techniques (continued)
Technique Used for: Often used with: Offensive/ Defensive
Stability DSCA
Pattern Analysis Plot Sheet
Analyzing threat, neutral, and friendly entity patterns of behavior.
• Event trees. • Link analysis. • Indicators. • Pattern analysis. • Network analysis. • Situational logic. • Pattern of life
analysis.
X X X
Incident Overlay
Analyzing threat, neutral and friendly entity patterns of behavior.
• Event trees. • Link analysis. • Indicators. • Pattern analysis. • Network analysis. • Situational logic. • Pattern of life
analysis.
X X X
Time Event Chart
Analyzing threat, neutral and friendly entity patterns of behavior.
• Event trees. • Link analysis. • Indicators. • Pattern analysis. • Network analysis. • Pattern of life
analysis.
X X X
Pattern of Life Analysis
Analyzing threat, neutral and friendly entity patterns of behavior.
• Event trees. • Link analysis. • Indicators. • Various pattern
analysis. • Link analysis. • Network analysis. • Social network
analysis.
X X X
6-23. Appendix A discusses emerging analytic techniques in the Army. These emerging techniques include contrarian, imaginative, and structured analytic techniques. Additionally, center of gravity analysis, functional analysis, and modeling techniques are described more fully in FM 2-01.3.
6-24. Table 6-3 on page 6-8 provides a quick reference guide to how each of the contrarian, imaginative, structured analytic techniques, and analytic techniques discussed in FM 2-01.3 may be employed and the operations in which they are most often used.
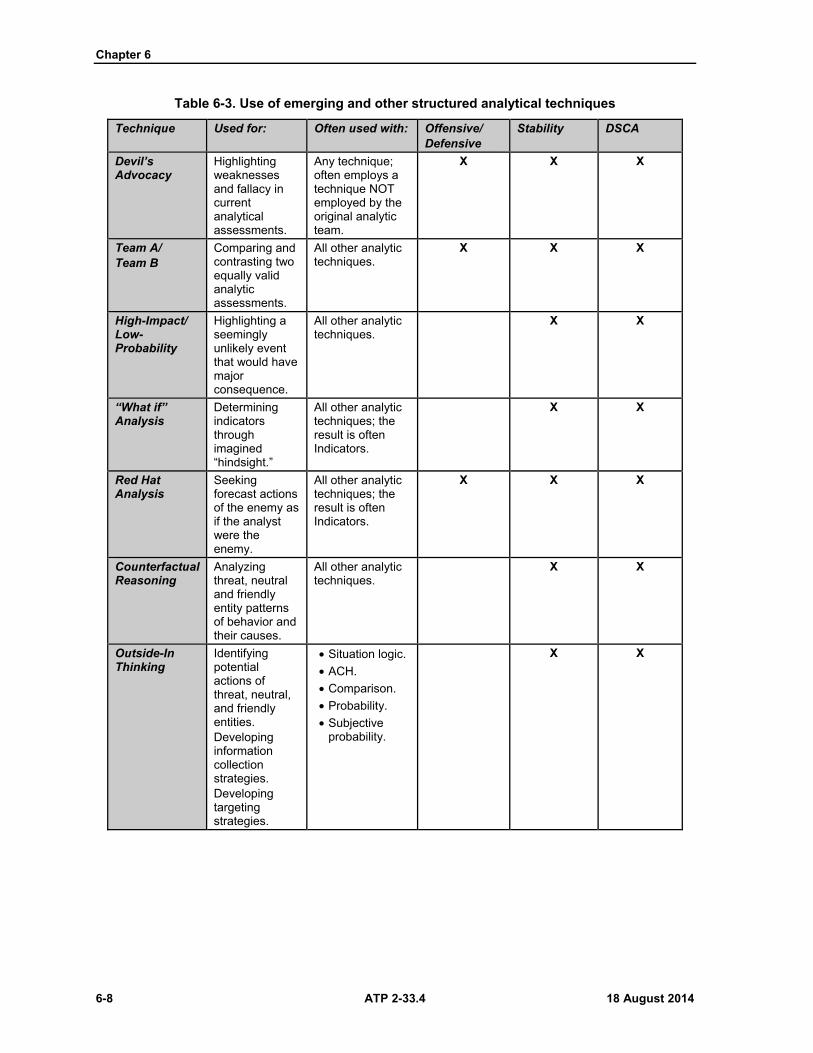
Chapter 6
6-8 ATP 2-33.4 18 August 2014
Table 6-3. Use of emerging and other structured analytical techniques
Technique Used for: Often used with: Offensive/ Defensive
Stability DSCA
Devil’s Advocacy
Highlighting weaknesses and fallacy in current analytical assessments.
Any technique; often employs a technique NOT employed by the original analytic team.
X X X
Team A/ Team B
Comparing and contrasting two equally valid analytic assessments.
All other analytic techniques.
X X X
High-Impact/ Low-Probability
Highlighting a seemingly unlikely event that would have major consequence.
All other analytic techniques.
X X
“What if” Analysis
Determining indicators through imagined “hindsight.”
All other analytic techniques; the result is often Indicators.
X X
Red Hat Analysis
Seeking forecast actions of the enemy as if the analyst were the enemy.
All other analytic techniques; the result is often Indicators.
X X X
Counterfactual Reasoning
Analyzing threat, neutral and friendly entity patterns of behavior and their causes.
All other analytic techniques.
X X
Outside-In Thinking
Identifying potential actions of threat, neutral, and friendly entities. Developing information collection strategies. Developing targeting strategies.
• Situation logic.
• ACH.
• Comparison.
• Probability.
• Subjective probability.
X X

Analytic Support to Decisive Action
18 August 2014 ATP 2-33.4 6-9
Table 6-3. Use of emerging and other structured analytical techniques (continued)
Technique Used for: Often used with: Offensive/ Defensive
Stability DSCA
Threat Emulation Red Team
A dedicated team with specialized training seeking to forecast actions of the enemy.
All other analytic techniques; the result is often Indicators.
X X
Red Team A decision support group designed to ensure alternative perspectives are considered in decisionmaking.
All other structured analytic techniques and more.
X X
Alternative Future Analysis
Identifying potential actions of threat, neutral, and friendly entities.
Situational logic. X X
Morphological Analysis with Multiple Scenarios Generation
Identifying potential actions of threat, neutral, and friendly entities.
Situational logic. X X
Analysis of Competing Hypotheses
Identifying potential actions of threat, neutral, and friendly entities.
• Applying theory.
• Comparison.
• Generation of alternative futures.
X X X
Applying Theory
Analyzing threat, neutral, and friendly entity patterns of behavior.
• ACH.
• Comparison.
• Bayesian analysis.
X
Delphi Techniques
Determining second- and third-order effects of threat, neutral, and friendly actions.
Brainstorming. X X
Futures Wheel Determining second- and third-order effects of threat, neutral, and friendly actions.
• Situational logic.
• Brainstorming.
X X X

Chapter 6
6-10 ATP 2-33.4 18 August 2014
Table 6-3. Use of emerging and other structured analytical techniques (continued)
Technique Used for: Often used with: Offensive/ Defensive
Stability DSCA
Knowledge Planning
Developing information collection strategies.
• Systemology.
• Network analysis.
X X X
Rules for Verification
Identifying potential actions of threat, neutral, and friendly entities.
• Bayesian analysis.
• Probability.
• Subjective.
X X X
Systemology Developing high-value targets and high-payoff targets.
• Knowledge planning.
• Network analysis.
X X
Center of Gravity Analysis
Developing threat characteristics and threat models.
• Network analysis.
• Mathematical analysis.
X X X
Functional Analysis
Developing threat charac-teristics and threat models.
Mathematical analysis.
X X X
Modeling Identifying potential actions of threat, neutral, and friendly entities.
• Comparison.
• Scientific method.
X X X
ACH analysis of competing hypotheses DSCA defense support of civil authorities
ANALYTIC SUPPORT TO UNIQUE ACTIVITIES 6-25. The Army engages in a variety of unique activities which may lend themselves to specific analytic techniques. These unique activities do not alter how analytic techniques are employed; only the information considered in the analytic processes changes.
BUILDING PARTNERSHIP CAPACITY
6-26. Unified action may require inter-organizational efforts to build the capacity of partners to secure populations, protect infrastructure, and strengthen institutions as a means of protecting common security interests. Building partner capacity is the outcome of comprehensive inter-organizational activities, programs, and engagements that enhance the ability of partners for security, governance, economic development, essential services, rule of law, and other critical Government functions. Army security cooperation activities enable other inter-organizational coordination to build partner capacity for governance, economic development, essential services, rule of law, and other critical government functions. Through its presence along the range of military operations, the Army is involved in many of these activities during military engagement, limited interventions, peace operations, irregular warfare, and major combat operations.
6-27. Army security cooperation activities foster the development of information and intelligence- sharing agreements, enable a common understanding of the threat environment, support information sharing on disaster response issues, and establish procedures necessary to prevent the compromise of sensitive information. (See FM 3-22 for more information on Army security cooperation activities.)

Analytic Support to Decisive Action
18 August 2014 ATP 2-33.4 6-11
6-28. Analysts involved in security cooperation activities must be prepared to teach analysis to their counterparts and encourage them to participate in analyzing, preparing, and briefing the analysis to the foreign unit commander. This instruction could involve any number of analytical techniques and should be gauged to complement the foreign partner’s intelligence capability and capacity.
PROTECTION
6-29. Protection relates to those actions taken by the commander to preserve the force in order to apply maximum combat power. Preserving the force includes protecting personnel (combatants and noncombatants), physical assets, and information of the U.S. and multinational military and civilian partners. The protection warfighting function facilitates the commander’s ability to maintain the force’s integrity and combat power. Protection is a continuing activity; it integrates all protection capabilities to safeguard bases, secure routes, and protect forces. Protection actions considered by the analyst include antiterrorism, operations security, information protection, area security, air and missile defense, and personnel recovery.
6-30. Protection can be achieved through knowledge and understanding. An intelligence summary may provide Soldiers with indicators or warnings of a specific threat tactic. This knowledge may result in force preservation if actions are taken that prevent or reduce the probability of the enemy’s actions. Analysts use mission variables and assessments of environmental threats and hazards to determine when and where protection can be achieved through reinforcing action and application or through complementary effect.
6-31. Analysts must evaluate the situation and determine the most appropriate analytic techniques to employ analysis in support of the protection warfighting function.
SYNCHRONIZE INFORMATION-RELATED CAPABILITIES
6-32. Synchronize information-related capabilities (formerly known as inform and influence activities) is defined as the integrating activities within the mission command warfighting function that ensure themes and messages designed to inform domestic audiences and influence foreign friendly, neutral, threat, and enemy populations are synchronized with actions to support unified land operations. Synchronize information-related capabilities incorporates components and enablers expanding the commander’s ability to use other resources. (See ADP 6-0 for more information on synchronizing information-related capabilities.)
6-33. Components of synchronize information-related capabilities are military capabilities or activities specifically designed to influence and inform select leaders, decisionmakers, and audiences whose behaviors and perceptions are deemed integral to mission success. Commanders are not restricted to just these components when synchronizing information-related capabilities. Commanders may add or subtract enablers as the situation dictates. The components of synchronize information-related capabilities are—
Public affairs. Military information support operations. Soldier and leader engagement. Military deception.
6-34. Enablers of synchronize information-related capabilities refers to military capabilities or activities whose primary purpose can be used to conduct information-related operations. Common enablers include operations security, civil affairs operations, combat camera, and cyber/electromagnetic activities.
6-35. Planning functions for synchronizing information-related capabilities depend on the intelligence warfighting function for three reasons:
The intelligence warfighting function plans much of the Army’s information collection that helps define the information environment and identifies potential audiences or physical targets for consideration.
Intelligence provides real-time insight into the adversary’s synchronization of information-related capabilities.
Intelligence provides capabilities that support the collection of metrics for effects-based assessment.

Chapter 6
6-12 ATP 2-33.4 18 August 2014
6-36. Intelligence analysis may be conducted in support of all the components and enablers of synchronizing information-related capabilities, as designated by the commander. Analysts must evaluate the situation and their commander’s objective and intent and determine the most appropriate analytic techniques to employ in support of synchronizing information-related capabilities.

18 August 2014 ATP 2-33.4 7-1
Chapter 7
Analytic Support to Unique Missions
This chapter describes the analytic support required in the unique missions of counterinsurgency, counter-improvised explosive devices, and site exploitation.
OVERVIEW 7-1. The Army engages in a variety of unique operations that may lend themselves to specific analytic techniques. As with analytic support to decisive action, analytic techniques do not change; only the information considered in the analytic processes changes.
7-2. Intelligence analysis support to any operation involves separating useful information from misleading information, using experience and reasoning, and reaching an assessment or conclusion based on fact and/or sound judgment. The conclusion is based on the intelligence analyst’s experience, skill, knowledge, and understanding of the operation; knowledge of the various intelligence disciplines; information collection; an understanding of all the threats within an operational environment; and an in-depth understanding of the threat’s military and political structure. Intelligence analysis must support the commander, staff, and targeting.
7-3. As discussed in chapter chapters 3 through 7, analysts must evaluate the circumstances and choose an appropriate analytic technique. (See FM 3-55 for doctrine on information collection and FM 2-01.3 for information on IPB. See also intelligence doctrine on planning requirements and assessing collection.)
7-4. As with any analysis, the most significant factor effecting analysis is time. Time includes both the span of time the analyst has to conduct analysis of a problem and how timely the final analytic assessment is to the decisionmakers. The unique operations are often especially time constrained for the decisionmakers and the analyst. Therefore, care must be taken to ensure quality analytic assessments are provided in a timely manner.
COUNTERINSURGENCY 7-5. Analytic support to counterinsurgency operations must facilitate understanding of the operational environments, placing emphasis on the populace, host nation, and insurgents. The memory aid of ASCOPE refers to the six categories of civil considerations (see figure 3-1 on page 3-4). Analytic techniques successfully employed are functional analysis, link analysis, modeling, pattern analysis, situational logic, and network analysis. Counterinsurgency may involve highly organized paramilitary groups, loosely structured nodes, or both.
7-6. Using activities and association matrices, analysts can pinpoint the optimal targets for further intelligence collection, identify key personalities within an organization, and considerably increase the understanding of an organization and its structure. While producing an assessment in a counterinsurgency environment is primarily an intelligence responsibility, it requires close coordination with operations, civil affairs, public affairs, and military information support operations to be effective.
7-7. Intelligence analysis in a counterinsurgency environment must include consideration of the AO’s distinguishing attributes—terrain, society, infrastructure, and the threat. Analysts should identify and understand the environmental characteristics from a counterinsurgent, insurgent, and host-nation population’s perspective to facilitate understanding of the operational environment.

Chapter 7
7-2 ATP 2-33.4 18 August 2014
FOR OFFICIAL USE ONLY
COUNTER-IMPROVISED EXPLOSIVE DEVICE 7-8. (FOUO) Analytic support to counter-improvised explosives device (CIED) operations must facilitate the development of IED networks and nodes and support to targeting those networks. Conducting predictive intelligence in asymmetrical operations has truly proven to be a difficult task. It is improbable, if not impossible, to determine with any degree of certainty that an IED will certainly be detonated at a precise location at a given time; this is regardless of the amount of available data, collection asset, or other information.
7-9. Intelligence analysis is the mental process of receiving and interpreting old and new information (raw data) from designated collection assets as well as from open sources (civilians, Soldiers on the battlefield, or civil affairs), and integrating that information into the overall view of the operational environment.
7-10. (FOUO) Two of the basic types of analysis used at all echelons in CIED operations are individual component analysis and nodal component analysis. Both types of analysis can be subdivided into near-, intermediate-, and long-term analysis.
Individual component analysis actions focus on what the individual (the one) is doing near, intermediate, and long term.
Nodal component analysis actions focus on multiple people of importance in an AO; this analysis develops an understanding of interrelationships between them and the ideas and beliefs driving their actions.
7-11. (FOUO) Both types of analysis differ in that individual component analysis information provides threat warning and metrics of enemy capabilities, while nodal component analysis provides intelligence for network targeting.
7-12. (FOUO) Once the analyst has determined how the IED network is constructed, it is also important to understand how the various activity nodes interact with one another. The goal is to produce a model of the threat IED operations that captures the processes present in the threat IED network. Intelligence briefs on threat activity within each node should be analyzed to produce signatures and vulnerabilities. This mapping will produce a list of capability gaps that will be the basis for funding priorities.
7-13. (FOUO) Figure 7-1 is an example of an IED activity model. For purposes of this illustration, analytic techniques successfully employed are functional analysis, link analysis, modeling, pattern analysis, situational logic, and network analysis. Table 7-1, which is not all-inclusive, lists possible nodes located in an IED network. Some IED networks will contain each node listed; others may have more nodes or not include nodes. Analysts must understand each node will be structured differently.
7-14. An analyst must determine what is moving between elements and nodes; how actions are executed; and how much materiel is being transferred. (Refer to chapter 5 for a discussion on link analysis, pattern analysis, situational logic, and network analysis. See FM 2-01.3 for more information on functional analysis and modeling.)
7-15. Once modeling has taken place, the result should assist in understanding a specific AO for a specific snapshot in time. The models are constantly evolving and can be adapted by the analyst to assist in understanding any operational environment.

Analytic Support to Unique Missions
18 August 2014 ATP 2-33.4 7-3
FOR OFFICIAL USE ONLY
Figure 7-1. Example of an improvised explosive device activity model
Table 7-1. Possible nodes located in an improvised explosive device network
FOUO
LEADERSHIP FUNCTION—When determining what type of activities may take place, consider:
International Support and Leadership:
Emir or front commander level leader of a country, a stateless leader, or a transnational influence directing the political agenda, directing information operations directing funds to the nodes.
Local Leadership: Leadership of a cell that carries out processes contained in the other nodes. Facilitation of the factory to make improvised explosive devices (IEDs) includes training grounds, money transfers, and/or messengers. Target selection to produce the desired effects for the information campaign.
National and/or Regional Leadership:
Emir or front commander level leader of a region directing the political agenda, directing of information operations, directing funds to the nodes. Knowledge of the respective populations and terrain providing efficient use of resources. Local target type selection for the information campaign.
PLANNING FUNCTION—When determining what type of activities may take place, consider:
Adaptation and/or Research and Development
Take ideas from the assessment node and try out the concepts. Research and development will include adapting to effective multinational force countermeasures.
Recruiting People at all levels that recruit willingly, or force coerced people, into performing tasks in the other nodes. Looking for all skill levels. Finding and smuggling militants into the joint operations area who are willing to be messengers, emplacers, or suicide bombers.
Surveillance Watching multinational and U.S. forces for target selection opportunities and viability of locations. Surveillance also verifies or denies timelines, friendly and enemy tactics, techniques, and procedures.
Training Willing or coerced people are evaluated and trained to act in other nodes.
FOUO

Chapter 7
7-4 ATP 2-33.4 18 August 2014
FOR OFFICIAL USE ONLY
Table 7-1. Possible nodes located in an IED network (continued)
FOUO
LOGISTICS FUNCTION—When determining what type of activities may take place. Consider:
Inventory Storage and maintenance of completed IEDs while waiting for orders to ingress and emplace.
Manufacture Bombmakers take raw materials from storage and construct the desired type of IED and deliver it to the inventory node.
Procurement Acquisition and production of bomb components, purchased or stolen. Local support that is directly related to construction, emplacement, detonation, and expertise on new bombmaking techniques.
Storage Secure storage of components before they are used to build an IED.
EXECUTE FUNCTION—When determining what type of activities may take place, consider:
Assessment Use the cataloged effects collected in the observation node to quantify the performance of the device type. Generate ideas on how to make the device better and provide it to the adaptation and/or research and development node.
Detonation Initiation of the IED using arming signals from monitoring node and fusing signals from victim. Output is the physical effect on the victim.
Egress After detonation, and/or after friendly forces arrive, removal of evidence and personnel to a secure location. Movement post-detonation of the personnel who carried out the detonation includes anyone who was there to observe the attack and report combat assessment.
Emplace Burying or disguising the IED, running the wires for arming switches, placing the antenna for reception from the monitoring point. For vehicle-borne improvised explosive devices, parking or driving the car next to the target. For suicide bomber, walking the IED to the target.
Ingress Moving the IED from the inventory location to the detonation point using a secure transport mechanism and using care not to detonate IED.
Monitor Observation of IED location from a secure vantage point. Output is the arming signal to the IED. Performed to keep the IED secure and protect assets until target is present.
Observe Observation and cataloging of the effect on the target, simply data collection, no assessment or analysis.
SUPPORT FUNCTION—When determining what type of activities may take place, consider:
Domestic Support Local populace support and supporting infrastructure that are involved with dual use items. Noncombatant support in the form of food, shelter, and water that supports activities in other nodes.
Post-Detonation Information Activities
Use of media images to engender support for international fundraising and local support. Any use of the media to lend support to the local threat. Use of speeches by international leaders, footage from recent attacks, and/or interviews with citizens.
FOUO
SITE EXPLOITATION 7-16. Site exploitation is a series of activities to recognize, collect, process, preserve, and analyze information, personnel, and/or materiel found during the conduct of operations (JP 3-31). Site exploitation contributes to exploitation, defined as taking full advantage of any information that has come to hand for tactical, operational, or strategic purposes.
7-17. A sensitive site is described as a geographically limited area with special diplomatic, informational, military, or economic sensitivity to the United States. The S-2 has additional planning and support considerations for a sensitive site due to national and strategic implications. (See ATTP 3-90.15 and JP 3-31 for additional information on sensitive site exploitation.)

Analytic Support to Unique Missions
18 August 2014 ATP 2-33.4 7-5
7-18. Complementary enablers and capabilities that support intelligence analysis for site exploitation are— Collaboration and the intelligence warfighting function. Biometrics and biometrics-enabled intelligence. Law enforcement. Defense Forensics Enterprise and forensic-enabled intelligence. Chemical, biological, radiological, and nuclear. Explosive ordnance disposal assets. Joint Improvised Explosive Device Defeat Organization (also called JIEDDO) capabilities. Joint Improvised Explosive Device Defeat Organization Knowledge Information Fusion
Exchange (also called JKNIFE). Expeditionary forensic laboratories. Military Intelligence companies’ multifunctional teams. Counterinsurgency Targeting Program. Counter Radio-Controlled IED Electronic Warfare. Counter-IED Operations Integration Center. International CIED teams.
7-19. The collection and analysis of items of forensic value have become vital to the intelligence and targeting efforts, but are only useful if the value of the materiel is recognized. Exploitation depends on individuals who have a fundamental awareness of the importance of the information potential of items available for collection onsite. The decision regarding what materiel to collect and exploit should primarily be based on the contextual significance of the items.
7-20. Site exploitation provides information that allows the commander and staff to identify and engage friendly, neutral, and hostile networks that influence the operational environment. The information provided by site exploitation can be used to build a detailed knowledge of a network’s relational dynamics and to do so within the context of a dynamic operational environment. Techniques successfully employed in analysis of information derived from site exploitation include—
Association matrix, which portrays the existence of an association (known or suspected) between individuals.
Activities matrix analysis, which shows the relationships in large datasets by establishing the similarities between the nodes and links in a network of people.
Pattern analysis, which is used to show the location of the results of a site exploitation and the time. This tool supports site exploitation targeting to answer the question of where and when certain materiel is detected and collected.
7-21. When supporting site exploitation, intelligence analysts should share data, information, and intelligence through proper channels with other intelligence organizations. These intelligence organizations will assist the analyst in analyzing the information, material, and persons gathered through site exploitation and produce intelligence.
7-22. Archived data can be a valuable source of information and may aid future targeting, intelligence analysis, and/or support to legal proceedings. In addition, archived data can provide historical context to current and future operations and enhanced opportunities to respond to critical requests for information.
7-23. Units must establish connectivity with intelligence organizations, explosive ordnance disposal, theater laboratories, and other organizations to access the appropriate archived data. Harmony is the primary archive database. It is the national intelligence database for foreign document and media exploitation and translations management. It is the single, comprehensive bibliographic reference for all available primary source foreign technical and military documents and their translations. Harmony supports tactical through strategic users. It is available to all units with access to SECRET Internet Protocol Router Network, Joint Worldwide Intelligence Communications Systems (also called JWICS), and StoneGhost networks.

This page intentionally left blank.

18 August 2014 ATP 2-33.4 A-1
Appendix A
Emerging Analytic Techniques
This appendix discusses some of the more common techniques in use at the strategic and operational levels. The techniques often incorporate multiple basic structured analytic techniques in combination with diagnostic techniques. These techniques discussed are categorized under contrarian techniques, imaginative techniques, and structured analytic techniques although there is often overlap in specific techniques.
OVERVIEW A-1. Emerging analytic techniques are not new. As discussed in this publication, emerging techniques are those that are beginning to be used in the Army but are not so common as to be used regularly at all echelons. These techniques may originate in the Defense Intelligence Agency, the Central Intelligence Agency, business, academics, and other organizations, and areas of expertise. Army analysts are finding some of the techniques, often in a modified format, to bring value to analytic assessments.
CONTRARIAN TECHNIQUES A-2. Contrarian techniques challenge ongoing assumptions and broaden possible outcomes. They help the analyst to understand intentions of adversaries especially when not clearly stated or known. Contrarian techniques look at the problem from different (often multiple) perspectives, and in so doing allow analysts to better accept analytic critique and grant greater avenue to explore and challenge analytical arguments and mindsets. Proper technique application helps analysts ensure preconceptions and assumptions are thoroughly examined and tested for relevance, implication, and consequence.
A-3. There are many contrarian techniques; however, this manual discusses only the following: Devil’s advocacy. Team A/Team B. High impact/Low probability analysis. “What If” analysis. Red Hat analysis. Counterfactual reasoning.
DEVIL’S ADVOCACY
A-4. Devil’s advocacy is a process for critiquing a proposed analytic assessment, judgment, plan, or decision, usually by a single analyst not previously involved in the deliberations that led to the proposed assessment.
Facts
A-5. Devil’s advocacy is most effective when used to challenge an analytic consensus or a key assumption regarding a critically important intelligence question. On those issues that one cannot afford to get wrong, devil’s advocacy can provide further confidence that the current analytic line will hold up to close scrutiny. Individual analysts can often assume the role of the devil’s advocate if they have some doubts about a widely held view; or a leader might designate an analyst to challenge the prevailing wisdom in order to reaffirm the group’s confidence in those assessments.

Appendix A
A-2 ATP 2-33.4 18 August 2014
A-6. In some cases, the analyst or a team can review a key assumption of a critical judgment in the course of their work, or a separate analytic product can be generated that arrays all the arguments and data that support a contrary assessment or hypothesis.
A-7. The devil’s advocacy process can highlight weaknesses in a current analytic judgment or help to reaffirm the analyst’s confidence in the assessment by—
Explicitly challenging key assumptions to see if they will not hold up under some circumstances. Identifying any faulty logic or information that would undermine the key analytic judgments. Presenting alternative hypotheses that would explain the current body of information available to
analysts.
A-8. Successful application of devil’s advocacy could result in— Determining the current analytic line was sound. Determining the argument is still the strongest, but there are areas where further analysis is
needed. Determining some serious flaws in logic or supporting evidence that suggests the analytic line
needs to be changed.
A-9. Devil’s advocacy challenges a single strongly held view by building the best possible case for an alternate explanation. The analyst would apply it to challenge an analytic consensus or a key assumption regarding a critical intelligence question, and the value added in using this specific technique is that it highlights weaknesses in current analytic judgment or helps to reaffirm one’s confidence in that current analytic judgment.
The Method
A-10. The devil’s advocate is charged with challenging the proposed assessment by building the strongest possible case against it. There is no prescribed procedure, but the following steps should be followed at a minimum:
Outline the main points and key assumptions and characterize the evidence supporting current analytic view.
Select one or more assumptions that appear the most susceptible to challenge. Review the data used to determine questionable validity, possible deception, and the existence of
gaps. Highlight evidence that supports an alternative hypothesis or contradicts current thinking. Present findings that demonstrate flawed assumptions, poor evidence, or possible deception.
Devil’s Advocacy Tips
A-11. The devil’s advocate should keep the following in mind as the problem set or assessment is examined:
What were the analytic processes used to create this assessment? What are the sources of uncertainty within the assessment? What are the critical assumptions within the assessment? What is the diagnosticity of the evidence provided or cited within the assessment? Does any of the evidence appear anomalous? Where perhaps does it deviate from the norm of
what we would expect to see? Were there any changes in the broad environment in which events are happening (or have
happened)? Was an alternative decision model used within the assessment? If so, can you see why and where
it was applied? Perhaps we cannot clearly see how a conclusion or finding was reached nor understand the assessment’s rational process.
Availability of cultural expertise.

Emerging Analytic Techniques
18 August 2014 ATP 2-33.4 A-3
Are there indicators of possible deception that the assessment failed to address or provide suitable explanation?
Are there any remaining information gaps present (within the assessment) that hinder analytic ability to bring the assessment to a decisive conclusion? Do those information gaps still exist or do we now possess more relevant data?
A-12. The devil’s advocate should consider drafting a separate contrarian paper and/or assessment that lays out the arguments for a different analytic conclusion if the review uncovers major analytic flaws. The devil’s advocate must be sure any products generated clearly lay out the conventional wisdom and are identified as an explicitly devil’s advocate project to avoid confusion with the current accepted analytic assessment.
TEAM A/TEAM B
A-13. Team A/Team B is a process for comparing, contrasting, and clarifying two or more equally valid analytic assessments. This is done by multiple teams of analysts, each working along different lines of analysis. Team A/Team B involves separate analytic teams that contrast two (or more) views or competing hypotheses.
Facts
A-14. If there are at least two competing views within an analytic office, then Team A/Team B analysis can be the appropriate technique to use to clarify the issue. Analysts or the analytic team leader applies this technique to challenge (if not clarify) two or more competing views or opinions. The value added in using this specific technique is that its usage can help opposing groups see merit in the other groups’ perspective. This reduces friction and helps narrow the differences so everyone gets their say.
Note. If opposing positions are well established, it can be useful to place analysts on teams that will advocate positions they normally do not support; forcing analysts to argue the other side tends to make them more aware of their own mindset.
A-15. Developing a full-blown Team A/Team B requires a significant commitment of analytic time and resources. Consider carefully if the analytic issue merits the attention.
The Method
A-16. There are two distinct phases within the method: analytic phase and debate phase. The steps within the analytic phase are—
Step 1. Identify the two or more competing hypotheses. Step 2. Form teams and designate individuals to develop the best case for each hypothesis. Step 3. Review information that supports each respective position. Step 4. Identify missing information that would support or bolster their hypotheses. Step 5. Prepare structured argument with an explicit discussion of—
Key assumptions. Key piece of evidence. Articulation of the logic behind the argument.
A-17. The debate phase is an oral presentation of the alternative arguments and rebuttals in parallel fashion. The steps within the debate phase are—
Step 1. Set aside the time for a formal debate or an informal brainstorming session. Step 2. Have an independent jury of peers listen to the oral presentation and be prepared to
question the teams regarding their assumptions, evidence, and/or logic. Step 3. Allow each team to present its case, challenge the other team’s arguments, and rebut the
opponent’s critique of its case. Step 4. The jury considers the strength of each presentation and recommends possible next steps
for further research and collection efforts.

Appendix A
A-4 ATP 2-33.4 18 August 2014
HIGH IMPACT/LOW PROBABILITY
A-18. High impact/low probability analysis highlights a seemingly unlikely event that would have a major consequence if it occurred. Conducting high impact/low probability analysis sensitizes analysts to the potential impact of seemingly low probability events that would have major repercussions.
Facts
A-19. Mapping out the course of an unlikely, yet plausible, event can uncover hidden relationships between key factors and assumptions; it can also alert analysts to oversights in the mainstream analytic line. High impact/low probability allows analysts to explore the consequences of an event not deemed likely by conventional wisdom without having to challenge the mainline analytic judgment or to argue with others about how likely an event is to occur. This technique provides a tactful method of communicating a viewpoint some might prefer not to hear.
A-20. An examination of the unthinkable allows an analyst to develop indicators that may provide early warning of a shift in the situation. By periodically reviewing these indicators, an analyst is more likely to counter any prevailing mindset that such a development is highly unlikely.
The Method
A-21. An effective high impact/low probability analysis involves the following steps: Step 1. Define the high-impact outcome clearly. This process is what will justify examining
what may be deemed a very unlikely development. Step 2. Devise one or more plausible pathways to the low probability outcome. Be as precise as
possible, as it may aid in developing indicators for later monitoring. Step 3. Insert possible triggers or changes in momentum if appropriate (such as natural disasters,
economic or political shocks). Step 4. Brainstorm plausible but unpredictable triggers of sudden change. Step 5. Identify for each pathway a set of indicators or observables that helps anticipate that
events are playing out a specific way. Step 6. Identify factors that would deflect a bad outcome or encourage a positive one.
A-22. Once the list of indicators has been developed, the analyst must review it periodically.
“WHAT IF” ANALYSIS
A-23. “What if” analysis imagines that an unexpected event has occurred with potential major impact. Then, with the benefit of hindsight, the analyst figures out how this event could have come about and what the consequences might be.
Facts
A-24. “What if” is similar to high impact/low probability analysis, but it does not dwell on the consequences of the event as much as it accepts the significance and moves directly to explaining how it might come about. It also creates an awareness that prepares the analyst to recognize early signs of a significant change.
A-25. Using this technique is important when a judgment rests on limited information or unproven assumptions. It can also shift focus from asking whether an event will occur, to working from the premise that it has occurred, and letting the analyst determine how it might have happened. This opens the mind to think in different ways and allows the analyst to develop indicators that may be monitored.
The Method
A-26. Like other contrarian methods, “what if” analysis must begin by stating the conventional analytic line and then stepping back to consider what alternative outcomes are too important to dismiss, no matter how unlikely.

Emerging Analytic Techniques
18 August 2014 ATP 2-33.4 A-5
A-27. The steps within “what if” analysis look similar to the steps within the high impact/low probability analytic technique once the analyst has established the event itself:
Step 1. Assume the event has happened or is already happening. Step 2. Select some triggering events that permitted the scenario to unfold to help make the
“what if” more plausible (for example, the death of a leader, a natural disaster, an economic event that might start a chain of other events).
Step 3. Develop a chain of reasoning based on as much on logic as on evidence to explain how this outcome could have come about.
Step 4. Think backwards from the event in concrete ways, specifying what must actually occur at each stage of the scenario.
Step 5. Identify one or more plausible pathways to the event; it is likely that more than one will appear possible.
Step 6. Generate a list of indicators or signposts in order to detect the beginnings of the event. Step 7. Consider the scope of positive and negative consequences and their relative impact. Step 8. Monitor the indicators you have developed on a periodic basis.
RED HAT ANALYSIS
A-28. Analysts seek to forecast the actions of a threat or a competitor. In doing so, they need to avoid the common error of mirror imaging, the natural tendency to assume that others think and perceive the world in the same way as they do. Red hat analysis is a useful technique for trying to perceive threats and opportunities as others see them, but this technique alone is of limited value without significant cultural understanding of the threat involved.
Facts
A-29. The chances of a red hat analysis being accurate are better when one is trying to foresee the behavior of a specific person who has the authority to make decisions. Authoritarian leaders as well as small, cohesive groups (such as terrorist cells) are obvious candidates for this type of analysis.
A-30. Red hat analysis is a reframing technique that requires the analyst to adopt—and make decisions consistent with—the culture of a foreign leader or group. This conscious effort to imagine the situation as the target perceives it helps the analyst gain a different and usually more accurate perspective on a problem or issue. Reframing the problem typically changes the analyst’s perspective from that of an analyst observing and assessing, to that of a leader who must make decisions within the operational culture.
The Method
A-31. On issues that lend themselves to red hat analysis, gather a team of analysts with in-depth knowledge of the operating environments, the target’s personality, and the style of thinking used. The team should consist of people who might have experienced the culture, shared the ethnic background, or have worked in a similar environment. It is desirable, although not absolutely necessary, to include those who understand the target’s language. Once established, the team members should—
Present the team members with a situation and ask them how they would respond were they the threat.
Emphasize the need to avoid mirror imaging. The question is not, “What would you do if you were in the threat’s place?” but, “How would this person or group in that culture and circumstance most likely think, behave, and respond to the situation?”
In presenting the results, describe the alternative considered and the rationale for selecting the path the person or group is most likely to take.
A-32. Red hat analysis is usually organized and done by any analyst or analyst team that needs to understand or forecast threat behavior and that has or can gain access to the required cultural experience. Red hat analysis exploits the available resources to develop the best possible analysis of a threat’s intent.

Appendix A
A-6 ATP 2-33.4 18 August 2014
COUNTERFACTUAL REASONING
A-33. Counterfactual reasoning is an analytic method that is useful for discovering the relationships between possible events and their most plausible outcomes. It essentially combines two of the contrarian techniques already discussed:
High impact/low probability analysis, which discusses what could occur and the resultant consequences.
“What if” analysis, which reframes the question, assuming that the surprise event has occurred and then looks backward to identify those key actions, that taken in a timely manner might possibly prevent it from happening in the first place.
Facts
A-34. Counterfactual reasoning is conducted for several purposes: Facilitate causal analysis. Many scenarios rely upon causal events as indicators. An
understanding of the most significant causal forces leads to more relevant analysis and assessments.
Overcome deterministic biases. Analysts can reduce the possibility of hindsight bias by proactively determining potential futures as if they had already happened, determining how they might have occurred, and looking for indicators.
Incorporate creativity into the analytic process. Analysts can avoid a lack of imagination or openness to other possibilities.
Ground strategic assessment. Many strategies, and analyses of them, are grounded in a series of counterfactual claims about alternate possibilities, their consequences, and the relationships between them.
The Method
A-35. Counterfactual reasoning is performed through four stages: zero through three.
Stage Zero—Establish Event Context
A-36. Stage zero begins with the determination or arrival at the focal question driving the analysis. Essentially the focal question contains or alludes to an issue’s primary driver that may have either near- or long-term application towards an intelligence problem. The analyst should have an understanding of the context for the possible event, to include the causal background. When thinking causal background, think of it within the context of the relationship between cause and effect. The overriding purpose and objective of stage zero is estimating the (typically) ten most critical causal forces influencing the topic at present.
A-37. The key steps of stage zero are— Ask, “What affects the question?” Determine focal question to drive analysis. Ensure the analyst understands the context for the possible event. Think in context of the relationship between cause and effect. Determine approximately ten most critical causal forces. Determine causal history. What elements or drivers affect the question?
Stage One—Establish Antecedent Scenario
A-38. In stage one the analyst constructs the antecedent scenario or “what if” back story that sets the potential event in motion. The analyst thinks in terms of likely or required precursor events that point towards and/or generates the possible event. The purpose is to identify two to three deviations from the original ten casual forces that could combine to bring about the possible event.

Emerging Analytic Techniques
18 August 2014 ATP 2-33.4 A-7
A-39. The key steps of stage one are— Ask: “How can the event occur?” Examine causal history. Key on a small number of causal forces in the causal history and their
potential deviations. Re-engage current trends and understand what change is required for the event to occur.
Determine which trends would have to decrease, continue, or increase to facilitate the event. Consider alternative ways in which the event could occur. Determine other antecedent scenarios.
Stage Two—Determine Event Compatibility
A-40. In stage two, the analyst determines if there is any ripple effect of the possible event upon any remaining casual forces. This is to determine if there is any dramatic shift of those remaining casual forces. Also, those shifts potentially serve as either a primary indicator or as a signpost of change dynamic that has impact on the probability of the possible events as well as potential after-event consequences.
A-41. In stage two, the analyst looks for those items or trends that are compatible with the possible event and thinks in terms of intermediate states (or that intermediate period between the time of the antecedent event and the time of the possible consequences).
A-42. The key steps of stage two are— Select intermediate states. Evaluate the secondary effects, tertiary effects, and beyond of the possible event on the causal
forces not considered. What new events and/or trends may emerge as a result of the event occurring? What are the
secondary and tertiary effects of these?
Stage Three—Drawing Consequent Scenarios
A-43. In stage three, the analyst transitions to the ultimate objective of the process—to draw potential or likely conclusions from the possible event. Specifically, the analyst drafts several follow-on scenarios or aftermath-related events that could potentially emerge if or once the possible events become a reality.
A-44. The purpose of this stage is to explore three-to-five scenarios consistent with the antecedent scenario (and intermediate states) as well as the outcomes common to multiple scenarios.
A-45. The key steps of stage three are— Generate several scenarios derived from the possible consequences of the event occurring. It is
recommended the analyst develop three possible scenarios or COAs. Determine possible consequences of each of the scenarios generated. Determine commonalities between the consequences for each scenario to determine possible
trends.
IMAGINATIVE TECHNIQUES A-46. Imaginative thinking techniques aim at developing new insight, different perspectives, and/or alternative outcomes. They aid the analyst in generating new ideas, broaden possible outcomes, and reduce the chance of unforeseen outcomes. Imaginative techniques look at the problem from different (often even multiple) perspectives and allow the analyst to better forecast and assess potential COAs. Additionally, proper application of imaginative techniques can help identify differences in perspective and different assumptions among analytic team members.
A-47. There are many imaginative techniques; however, this publication discusses only the following: Brainstorming. Outside-In Thinking. Red Team Analysis. Alternative Future Analysis. Morphological Analysis with Multiple Scenarios Generation.

Appendix A
A-8 ATP 2-33.4 18 August 2014
BRAINSTORMING
A-48. Analysts use the brainstorming technique in the same manner as it is used for developing situational understanding and conclusions as discussed in chapter 5.
Facts
A-49. Brainstorming should be a very structured process to be most productive. An unconstrained, informal discussion might produce some interesting ideas, but usually a more systematic process is the most effective way to break down mindsets and produce new insights.
The Method
A-50. In particular, the process involves a divergent thinking phase to generate and collect new ideas and insights, followed by a convergent phase in which ideas are grouped and organized around key concepts. The following are some of the simple rules to follow:
Never censor an analyst’s ideas no matter how unconventional they might sound. Find out what prompted the thought, as it might contain the seeds of an important connection
between the topic and an unstated assumption. Take the time to brainstorm correctly. It usually takes one hour to establish the method used to
ensure the group is comfortable and able to exhaust the conventional wisdom on the topic. Only then will the truly creative ideas begin to emerge.
Involve someone outside the group who does not share the same educational background, culture, technical knowledge, or mindset as the core group but who is familiar with the topic. This fosters creative ideas.
OUTSIDE-IN THINKING
A-51. Analysts find this technique most useful at the conceptualization of an analytic project, when the goal is to identify all the critical, external factors that could influence how a particular situation will develop. It works well for a group of analysts responsible for a range of functional and/or regional issues. When assembling a large database that must identify a number of information categories or database fields, this technique can aid in visualizing the entire set of categories that might be needed in a research effort. Often analysts realize too late that some additional information categories will be needed and then must go back and review all previous files and recode the data. With a modest amount of effort, outside-in thinking can reduce the risk of missing important variables early in the analytic process.
Facts
A-52. Most analysts spend their time concentrating on familiar factors within their field or analytic issues; that is, they think from the inside—namely, what they control—out to the broader world. Conversely, thinking from the outside-in begins by considering the external changes that might, over time, profoundly affect the analysts’ own field or issue. This technique encourages analysts to get away from their immediate analytic tasks (the so-called inbox) and think about their issues in a wider conceptual and contextual framework. By recasting the problem in much broader and basic terms, analysts are more likely to uncover additional factors, an important dynamic, or a relevant alternative hypothesis.
The Method
A-53. The process begins by developing a generic description of the problem or the phenomenon under study. Then, analysts should—
List all the key forces (social, technological, economic, environmental, and political) that could have an impact on the topic, but over which one can exert little influence (such as globalization, social stress, the Internet, or the global economy).
Focus next on key factors over which an individual or policymaker can exert some influence. In the business world this might be the market size, customers, the competition, suppliers or

Emerging Analytic Techniques
18 August 2014 ATP 2-33.4 A-9
partners; in the government domain it might include the policy actions or the behavior of allies or adversaries.
Assess how each of these forces could affect the analytic problem. Determine whether these forces actually do have an impact on the particular issue based on the
available evidence.
RED TEAM ANALYSIS
A-54. Frequently, analysts face the challenge of forecasting how a foreign leader or decisionmaking group may behave when it is clear there is a risk of falling into a “mirror-image” problem. That is, analysts can sometimes believe a foreign leader has the same motives, values, or understanding of an issue that they hold. Traditional analysis sometimes assumes that foreign leaders or groups will behave rationally and act as the analysts would if faced with the same threats or opportunities. History has shown that foreign leaders often respond differently to events because of different cultural, organizational, or personal experiences.
Facts
A-55. Red Team analysis tries to consciously place analysts in the same cultural, organizational, and personal setting (“putting them in their shoes”) in which the target individual or group operates. Whereas analysts normally work from the position of the blue (friendly forces), a red team of analysts attempts to work in the environment of the hostile forces.
A-56. Like devil’s advocacy and Team A/Team B techniques, Red Team analysis is aimed at freeing the analyst from the prison of a well-developed mindset; in this case, the analyst’s own sense of rationality, cultural norms, and personal values. Whereas analysts usually operate as observers of a foreign threat, the Red Team technique transforms the analyst into an enemy operating within the threat’s culture and political milieu. This form of role-playing is useful when trying to replicate the mindset of authoritarian leaders, terrorist cells, or other nonwestern groups that operate under very different codes of behavior or motivations.
A-57. Often this technique can introduce new or different stimuli that might not have been factored into traditional analysis, such as the target’s familial ties or the international political, economic, and military pressures felt by the individual. For example, Red Team participants might ask themselves: “What would my peers, family, or tribe expect me to do? Alternatively, a Red Team analyst might pose the question to his colleagues: “How do we perceive the external threats and opportunities?” Finally, the Red Team technique can factor into its analysis the way in which personal power and status might influence a target’s behavior.
The Method
A-58. Red Team analysis is not easy to conduct. It requires significant time to develop a team of qualified experts who can think like the threat. The team has to distance itself from the normal analysis and work as though living in the target’s world. Without sophisticated understanding of the culture, operational environments, and personal histories of the foreign group, analysts will not be able to behave or think like the enemy. Analysts can never truly escape their own experiences and mindsets, but this technique can at least prevent them from falling subconsciously into mirror-imaging.
A-59. On issues that lend themselves to Red Team analysis, a manager needs to build a team of experts with in-depth knowledge of the operational environments, the target’s personality, and the style of thinking used. The team should be populated with people who might have experienced the culture, shared the ethnic background, or have worked in similar operational environments. It is desirable, although not absolutely necessary, to include those who understand the target’s language. Once established and separated from traditional analysis, the team members should—
Put themselves in the threat’s circumstances and react to foreign stimuli as the target would. Develop a set of first-person questions that the threat would ask, such as: “How would I perceive
incoming information; what would be my personal concerns; or to whom would I look for an opinion?”
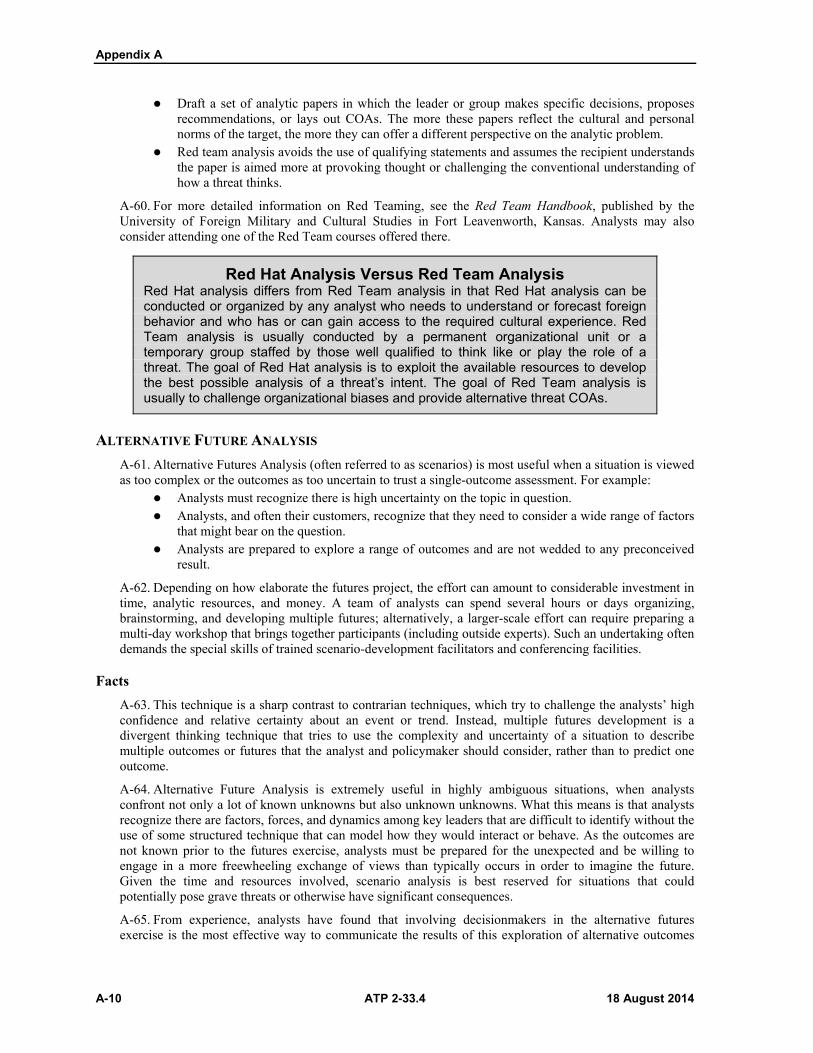
Appendix A
A-10 ATP 2-33.4 18 August 2014
Draft a set of analytic papers in which the leader or group makes specific decisions, proposes recommendations, or lays out COAs. The more these papers reflect the cultural and personal norms of the target, the more they can offer a different perspective on the analytic problem.
Red team analysis avoids the use of qualifying statements and assumes the recipient understands the paper is aimed more at provoking thought or challenging the conventional understanding of how a threat thinks.
A-60. For more detailed information on Red Teaming, see the Red Team Handbook, published by the University of Foreign Military and Cultural Studies in Fort Leavenworth, Kansas. Analysts may also consider attending one of the Red Team courses offered there.
Red Hat Analysis Versus Red Team Analysis Red Hat analysis differs from Red Team analysis in that Red Hat analysis can be conducted or organized by any analyst who needs to understand or forecast foreign behavior and who has or can gain access to the required cultural experience. Red Team analysis is usually conducted by a permanent organizational unit or a temporary group staffed by those well qualified to think like or play the role of a threat. The goal of Red Hat analysis is to exploit the available resources to develop the best possible analysis of a threat’s intent. The goal of Red Team analysis is usually to challenge organizational biases and provide alternative threat COAs.
ALTERNATIVE FUTURE ANALYSIS
A-61. Alternative Futures Analysis (often referred to as scenarios) is most useful when a situation is viewed as too complex or the outcomes as too uncertain to trust a single-outcome assessment. For example:
Analysts must recognize there is high uncertainty on the topic in question. Analysts, and often their customers, recognize that they need to consider a wide range of factors
that might bear on the question. Analysts are prepared to explore a range of outcomes and are not wedded to any preconceived
result.
A-62. Depending on how elaborate the futures project, the effort can amount to considerable investment in time, analytic resources, and money. A team of analysts can spend several hours or days organizing, brainstorming, and developing multiple futures; alternatively, a larger-scale effort can require preparing a multi-day workshop that brings together participants (including outside experts). Such an undertaking often demands the special skills of trained scenario-development facilitators and conferencing facilities.
Facts
A-63. This technique is a sharp contrast to contrarian techniques, which try to challenge the analysts’ high confidence and relative certainty about an event or trend. Instead, multiple futures development is a divergent thinking technique that tries to use the complexity and uncertainty of a situation to describe multiple outcomes or futures that the analyst and policymaker should consider, rather than to predict one outcome.
A-64. Alternative Future Analysis is extremely useful in highly ambiguous situations, when analysts confront not only a lot of known unknowns but also unknown unknowns. What this means is that analysts recognize there are factors, forces, and dynamics among key leaders that are difficult to identify without the use of some structured technique that can model how they would interact or behave. As the outcomes are not known prior to the futures exercise, analysts must be prepared for the unexpected and be willing to engage in a more freewheeling exchange of views than typically occurs in order to imagine the future. Given the time and resources involved, scenario analysis is best reserved for situations that could potentially pose grave threats or otherwise have significant consequences.
A-65. From experience, analysts have found that involving decisionmakers in the alternative futures exercise is the most effective way to communicate the results of this exploration of alternative outcomes

Emerging Analytic Techniques
18 August 2014 ATP 2-33.4 A-11
and sensitize them to key uncertainties. Most participants find the process of developing such scenarios as useful as any finished product that attempts to capture the results of the exercise. Analysts and decisionmakers can benefit from this technique in several ways:
It provides an effective means of weighing multiple unknown or unknowable factors and presenting a set of plausible outcomes.
It can help to bind a problem by identifying plausible combinations of uncertain factors. It provides a broader analytic framework for calculating the costs, risks, and opportunities
presented to policymakers by different outcomes. It aids analysts and policymakers in anticipating what otherwise would be surprising
developments by forcing them to challenge assumptions and consider possible wild cards or discontinuous events.
It generates indicators to monitor for signs that a particular future is becoming more or less likely, so that policies can be reassessed.
The Method
A-66. Although there are a variety of ways to develop alternative futures, the most common approach used in both the public and private sectors involves the following steps:
Develop the focal issue by systematically interviewing experts and officials who are examining the general topic.
Convene a group of experts (both internal and external) to brainstorm about the forces and factors that could affect the focal issue.
Select by consensus the two most critical and uncertain forces and convert these into axes or continuums with the most relevant endpoints assigned.
Establish the most relevant endpoints for each factor; for example, if economic growth were the most critical, uncertain force, the endpoints could be fast and slow or transformative and stabilizing, depending on the type of issue addressed.
Form a futures matrix by crossing the two chosen axes. The four resulting quadrants provide the basis for characterizing alternative future worlds.
Generate colorful stories that describe these futures and how they could plausibly come about. Indicators can then be developed.
A-67. Participants, especially decisionmakers, can then consider how current decisions or strategies would fare in each of the four worlds—fast, slow, transformative, stabilizing—and identify alternative policies that might work better either across all the futures or in specific ones. By anticipating alternative outcomes, policymakers have a better chance of either devising strategies flexible enough to accommodate multiple outcomes or of being prepared and agile in the face of change.
MORPHOLOGICAL ANALYSIS WITH MULTIPLE SCENARIOS GENERATION
A-68. Morphological Analysis is a method for structuring and examining all the possible relationships within an unproven, dynamic, and potentially complex environment. It is best used when—
There is little to no information available and surprise conditions are ripe. There is a need to identify that threat variations exists. The analyst needs to specifically understand the potential crisis conditions, to ascertain any
driving force interactions, and to understand the range of potential scenario outcomes.
Facts
A-69. Applying Morphological Analysis, specifically using the Multiple Scenarios Generation technique, better enables the analyst to forecast multiple scenarios, not just the worst case or nightmare ones but also those scenarios that represent favorable conditions or circumstances for U.S. forces.I

Appendix A
A-12 ATP 2-33.4 18 August 2014
A-70. n addition, usage of the Multiple Scenarios Generation technique offers ancillary benefits, such as— Enabling the analyst to potentially see when and how a specific scenario is coming to fruition. Aiding in the process of creating key indicator lists so that the command team can set the right
conditions to make the most favorable scenarios become reality. Setting conditions to deny the threat the ability to create those scenarios or circumstances that
may give the threat a decisive edge within the analyst’s AO.
A-71. Morphological Analysis— Aids significantly in both generating a laundry list of potential outcomes and enabling the
analyst to clearly identify and select those outcomes that are more credible or warrant greater attention.
Focuses both analysts and leaders on those key actions necessary in order to prepare for future events so the right prevention or risk migration orientation is achieved or satisfied.
Broadens the analyst’s view of low probability/high impact developments and, in turn, often forces a more objective viewpoint, thus lessening the chances the analyst dismisses or discounts a scenario or key driver based at face value.
A-72. Multiple Scenarios Generation— Identifies all the possible scenarios and combination of driving forces at play for a given
problem. The analyst’s primary objective through application of this technique is to reduce the unforeseen potential regarding the intelligence challenge or issue at hand.
Aids in identifying the extreme cases of interaction between an issue’s drivers. Is similar to the Alternative Future Analysis technique; however, the significant difference is that
Multiple Scenarios Generation involves more than one matrix. Uses multiple two-by-two matrices and pairs combinations of multiple key drivers. Each two-
by-two matrix generates four scenarios, thus multiple matrices provide multiple potential scenarios that may emerge from the focal question.
Reduces the tendency for the analyst to potentially miss an outcome. Once the analyst generates the scenarios in this format, the analyst is able to revisit the issue via quick screen snapshots. This minimizes the potential to labor over a scenario individually looking for more detailed analysis. Additionally, the analyst is more likely to pay attention to driver or indicator impacts on events if or when they are unfolding in a manner not previously anticipated.
The Method
A-73. Morphological Analysis works through the two principles of decomposition and forced association. Analysts should start by decomposing the problem, defining a set of key parameters or dimensions of the problem, and then breaking down each of those dimensions further into relevant forms or states the dimension can assume.
A-74. The principle of forced association then requires every element be paired with and considered in connection with every other element in the morphological space. This serves to narrow the possibilities and allows the analyst to focus on those combinations within the realm of possibility.
A-75. When applied using Multiple Scenarios Generation, the process is as follows: First the analyst should define the issue at hand. Next the analyst should identify all the key factors, forces, or events influencing the issue; this is
referred to as the drivers. The analyst should define the ends of the spectrum for each driver (less versus most extreme circumstances) and pair the drivers in two-by-two matrices.
Once the analyst identifies all the driver variations, the analyst should establish scenarios for each combination; that is, within each quadrant in the matrix.
The analyst then selects those scenarios that portray a compelling or challenging future that has not been considered and develops indicators to track whether one of the scenarios is developing.

Emerging Analytic Techniques
18 August 2014 ATP 2-33.4 A-13
Note. Remember that as indicators are developed to aid in scenario tracking, the analysts may see synergy between certain drivers that may be indicative of extreme cases of interaction between drivers of an issue. The Multiple Scenarios Generation technique proves extremely useful when used in conjunction with the counterfactual reasoning method.
A-76. Morphological Analysis is a method for structuring and examining all the possible relationships within an unproven, dynamic, and potentially complex environment. Using Morphological Analysis in combination with Multiple Scenarios Generation aids in reducing unforeseen potential and identifying extreme cases of interaction between an issue’s drivers. Generating multiple scenarios in this format gives the analyst the advantage of revisiting a given scenario via quick screen snapshots, minimizing the potential to labor over each individually looking for more detailed analysis. This technique is extremely useful in concert with other analytic techniques, particularly counterfactual reasoning.
STRUCTURED ANALYTIC TECHNIQUES A-77. The following techniques have been used by intelligence personnel at strategic levels for some time and are being employed to some degree at operational and tactical levels. Each of the techniques may provide additional insight into an intelligence problem. Analysts may find it useful to combine these techniques with others discussed in this publication. Although some of these techniques discussed below do not have a specific methodology, each has its own merits:
Analysis of competing hypotheses. Applying theory. Delphi technique. Futures wheel. Knowledge planning. Rules for verification.
ANALYSIS OF COMPETING HYPOTHESES
A-78. The Central Intelligence Agency developed ACH in the 1970s as an intelligence methodology to evaluate multiple competing hypotheses and to foster unbiased conclusions. It is currently still in use by national-level intelligence analysts in various fields who are required to make judgments on areas where there is a high risk of error when drawing conclusions. ACH is emerging as a tool that may be effective at the operational and tactical levels in aiding Army commanders and staffs in analyzing complex problems such as those found in stability operations.
A-79. The goal of ACH is to produce the best possible conclusion when analyzing uncertain data. As an emerging intelligence methodology relative to the operational and tactical Army, there is conflicting data available on how well it can be integrated into Army operations. (For more information on ACH, see Richard Heuer’s Psychology of Intelligence Analysis. This resource can be accessed on the Central Intelligence Agency Web site on Nonsecure Internet Protocol Router Network [also called NIPRNET].)
Facts
A-80. ACH is an eight-step procedure grounded in basic insights from cognitive psychology, decision analysis, and the scientific method. The steps are discussed in paragraph A-83. It is a surprisingly effective, proven process that helps an analyst to avoid common analytic pitfalls. Because of its thoroughness, it is particularly appropriate for controversial issues when analysts want to leave an audit trail to show what they considered and how they arrived at their judgment. When working on difficult intelligence issues, analysts are, in effect, choosing among several alternative hypotheses:
Which of several possible explanations is the correct one? Which of several possible outcomes is the most likely one?
A-81. This publication uses the term “hypothesis” in its broadest sense as a potential explanation or conclusion that is to be tested by collecting and presenting evidence. ACH requires an analyst to explicitly

Appendix A
A-14 ATP 2-33.4 18 August 2014
identify all the reasonable alternatives and evaluate them against each rather than evaluate their plausibility one at a time.
A-82. The way most analysts begin analysis is to pick out what they suspect intuitively is the most likely answer, then look at the available information from the point of view of whether or not it supports this answer. If the evidence seems to support the favorite hypothesis, analysts become confidant in their decision and look no further. If it does not, they either reject the evidence as misleading or develop another hypothesis and go through the same procedure again. Intelligence analysts call this a “satisficing” strategy. Satisficing means picking the first solution that seems satisfactory, rather than going through all the possibilities to identify the very best solution. There may be several seemingly satisfactory solutions, but there is only one best solution. The principal concern here is that if analysts focus mainly on trying to confirm one hypothesis they think is probably true, they can easily be led astray when there is so much evidence to support their point of view. They fail to recognize that most of this evidence is also consistent with other explanations or conclusions, and these other alternatives have not been explored.
The Method
A-83. Simultaneous evaluation of multiple, competing hypotheses is difficult to do. To retain three to five or even seven hypotheses in working memory and note how each item of information fits into each hypothesis is beyond the mental capabilities of most people. It takes far greater mental agility than listing evidence supporting a single hypothesis that was pre-judged as the most likely answer. It can be accomplished, though, with the help of the simple procedures discussed here:
Step 1. Identify the possible hypotheses to be considered. Use a group of analysts with different perspectives to brainstorm the possibilities. Psychological research into how people go about generating hypotheses shows that people are actually rather poor at thinking of all the possibilities. If individuals do not even generate the correct hypothesis for consideration, obviously they will not get the correct answer.
Step 2. Make a list of significant evidence and arguments for and against each hypothesis. In assembling the list of relevant evidence and arguments, these terms should be interpreted broadly. They refer to all the factors that have an impact on judgments about the hypotheses. Do not limit yourself to concrete evidence in the current intelligence reporting. Also include your own assumptions or logical deductions about another people or groups or country's intentions, goals, or standard procedures. These assumptions may generate strong preconceptions as to which hypothesis is most likely. Such assumptions often drive the final judgment, so it is important to include them in the list of evidence.
Step 3. Prepare a matrix with hypotheses across the top and evidence down the side. Analyze the diagnosticity of the evidence and arguments; that is, identify which items are most helpful in judging the relative likelihood of alternative hypotheses. Step 3 is perhaps the most important element of this analytical procedure. It is also the step that differs most from the natural, intuitive approach to analysis, and, therefore, the step an analyst is most likely to overlook or misunderstand. The procedure for step 3 is to take the hypotheses from step 1 and the evidence and arguments from step 2 and put this information into a matrix format, with the hypotheses across the top and evidence and arguments down the side. This gives an overview of all the significant components of the analytical problem.
Step 4. Refine the matrix. Reconsider the hypotheses and delete evidence and arguments that have no diagnostic value. The exact wording of the hypotheses is obviously critical to the conclusions one can draw from the analysis. By this point, you will have seen how the evidence breaks out under each hypothesis, and it will often be appropriate to reconsider and reword the hypotheses. For example: Are there hypotheses that need to be added or finer distinctions that need to be made in
order to consider all the significant alternatives? If there is little or no evidence that helps distinguish between two hypotheses, should they
be combined into one? Step 5. Draw tentative conclusions about the relative likelihood of each hypothesis. Proceed
by trying to disprove hypotheses rather than prove them. In step 3, you worked across the

Emerging Analytic Techniques
18 August 2014 ATP 2-33.4 A-15
matrix, focusing on a single item of evidence or argument and examining how it relates to each hypothesis. Now, work down the matrix, looking at each hypothesis as a whole. The matrix format gives an overview of all the evidence for and against all the hypotheses, so you can examine all the hypotheses together and have them compete against each other for your approval.
Step 6. Analyze how sensitive your conclusion is to a few critical items of evidence. Consider the consequences for your analysis if that evidence were wrong, misleading, or subject to a different interpretation. In step 3 you identified the evidence and arguments that were most diagnostic, and in step 5 you used these findings to make tentative judgments about the hypotheses. Now, go back and question the few linchpin assumptions or items of evidence that really drive the outcome of your analysis in one direction or the other. For example: Are there questionable assumptions that underlie your understanding and interpretation? Are there alternative explanations or interpretations? Could the evidence be incomplete and, therefore, misleading?
Step 7. Report conclusions. Discuss the relative likelihood of all the hypotheses, not just the most likely one. If your report is to be used as the basis for decisionmaking, it will be helpful for the decisionmaker to know the relative likelihood of all the alternative possibilities. Analytical judgments are never certain. There is always a good possibility of their being wrong. Decisionmakers need to make decisions on the basis of a full set of alternative possibilities, not just the single most likely alternative. Contingency or fallback plans may be needed in case one of the less likely alternatives turns out to be true.
Step 8. Identify milestones for future observation that may indicate events are taking a different course than expected. Analytical conclusions should always be regarded as tentative. The situation may change, or it may remain unchanged while you receive new information that alters your appraisal. It is always helpful to specify in advance things one should look for or be alert to that, if observed, would suggest a significant change in the probabilities. This is useful for intelligence consumers who are following the situation on a continuing basis. Specifying in advance what would cause you to change your mind will also make it more difficult for you to rationalize such developments, if they occur, as not really requiring any modification of your judgment.
A-84. Three key elements distinguish analysis of competing hypotheses from conventional intuitive analysis:
Analysis starts with a full set of alternative possibilities, rather than with a most likely alternative for which the analyst seeks confirmation. This ensures that alternative hypotheses receive equal and fair treatment.
Analysis identifies and emphasizes the few items of evidence or assumptions that have the greatest diagnostic value in judging the relative likelihood of the alternative hypotheses. In conventional intuitive analysis, key evidence may also be consistent with alternative hypotheses; it is rarely considered explicitly and is often ignored.
Analysis of competing hypotheses involves seeking evidence to refute hypotheses. The most probable hypothesis is usually the one with the least evidence against it, not the one with the most evidence for it. Conventional analysis generally entails looking for evidence to confirm a favored hypothesis.

Appendix A
A-16 ATP 2-33.4 18 August 2014
Example of Analytical Effectiveness of Analysis of Competing Hypotheses
The analytical effectiveness of Analysis of Competing Hypotheses (ACH) becomes apparent when considering the Indian nuclear weapons testing in 1998. According to Admiral Jeremiah, the intelligence community had reported: “There was no indication the Indians would test in the near term.” Such a conclusion by the community would fail to distinguish an unproven hypothesis from a disproved hypothesis. The intelligence communities’ conclusion that because the Indians were not testing nuclear weapons now does not disprove the hypothesis India may test nuclear weapons in the future. If the ACH procedure had been used, one of the hypotheses would certainly have been that India is planning to test in the near term but will conceal preparations for the testing to forestall international pressure to halt such preparations. Careful consideration of this alternative hypothesis would have required evaluating India’s motive, opportunity, and means for concealing its intention until it was too late for the United States and others to intervene. It would also have required assessing the ability of U.S. intelligence to see through Indian denial and deception if it were being employed. It is hard to imagine that this would not have elevated awareness of the possibility of successful Indian deception.
A-85. A principal lesson in the above scenario is whenever an intelligence analyst is tempted to write the phrase, "there is no evidence that ...," the analyst should ask this question: If this hypothesis is true, can I realistically expect to see evidence of it? In other words, if India were planning nuclear tests while deliberately concealing its intentions, could the analyst realistically expect to see evidence of test planning? The ACH procedure leads the analyst to identify and face these kinds of questions.
A-86. Once an analyst has gained practice in applying ACH, it is quite possible to integrate the basic concepts of this procedure into the normal analytical thought process. In that case, the entire eight-step procedure may be unnecessary except on highly controversial issues.
A-87. There is no guarantee that ACH or any other procedure will produce a correct answer. The result still depends on fallible intuitive judgment applied to incomplete and ambiguous information. ACH does, however, guarantee an appropriate process of analysis. This procedure leads the analyst through a rational, systematic process that avoids some common analytical pitfalls. It increases the odds of getting the right answer, and it leaves an audit trail showing the evidence used in the analysis and how this evidence was interpreted. If others disagree with the analyst’s judgment, the matrix can be used to highlight the precise area of disagreement. Subsequent discussion can then focus productively on the ultimate source of the differences.
A-88. A common experience is that ACH attributes greater likelihood to alternative hypotheses than would conventional analysis. People become less confident of what they thought they knew. In focusing more attention on alternative explanations, the procedure brings out the full uncertainty inherent in any situation that is poor in data but rich in possibilities. Although such uncertainty is frustrating, it may be an accurate reflection of the true situation. The ACH procedure has the offsetting advantage of focusing attention on the few items of critical evidence that cause the uncertainty or which, if they were available, would alleviate it. This can guide future collection, research, and analysis to resolve the uncertainty and produce a more accurate judgment.
APPLYING THEORY
A-89. Applying theory begins with the formulation of a theory based on the evaluation of other examples of the same phenomenon. This technique is based on the supposition that when a given set of conditions arise, certain other conditions will follow. One of the advantages of this methodology when applied to intelligence analysis is that it economizes thought. By identifying the key elements of a problem, applying theory enables an analyst to sort through a mass of less significant detail. Applying theory enables the analyst to see beyond transient developments, to recognize which trends are superficial and which are

Emerging Analytic Techniques
18 August 2014 ATP 2-33.4 A-17
significant, and to foresee future developments for which there may be little concrete evidence at the moment.
A-90. Applying theory can be used to analyze threat, neutral, and friendly entity patterns of behavior when a large quantity of data is available on an entity going back over time. Applying theory is effective in situations where analysts are attempting to predict how large constructs such as nations, religions, or ethnic groups may act or react. (For example, an insurgency begins to develop in Turkey. Analysts apply what they know about other countries that have experienced and dealt with the same problem to predict how Turkey will react militarily and politically.)
DELPHI TECHNIQUE
A-91. The Delphi technique is a systematic, interactive forecasting method that relies on a panel of independent analysts. The analysts answer questionnaires in two or more rounds. After each round, a facilitator provides an anonymous summary of the analysts’ conclusions from the previous round as well as the reasons they came to those conclusions. Analysts are encouraged to revise their earlier answers in light of the replies of other analysts on the panel. The goal is to decrease division and converge towards a commonly agreed upon answer. Finally, the process is stopped after a predefined stop criterion (for example, number of rounds, achievement of consensus, and stability of results). The mean or median scores of the final rounds determine the results.
Facts
A-92. Usually participants maintain anonymity. Their identity is not revealed even after the completion of the final report. This stops individuals from dominating others in the process by using their authority or personality. It frees individuals, to some extent, from their personal biases and minimizes the "bandwagon effect" or "halo effect." The Delphi Technique also allows individuals to freely express opinions and encourages open critique and admission of errors to revise earlier judgments.
The Method
A-93. An analyst, serving as the moderator, sends a questionnaire to a panel of experts who may be in different locations. The experts respond and are usually asked to explain their responses briefly. The moderator collates the results from this first questionnaire, identifying common and conflicting viewpoints. The moderator then sends the collated responses back to all panel members, requesting them to reconsider their responses based on what they see and learn from the other experts’ responses and explanations. Panel members may also be asked to answer another set of questions, which may or may not be based on the collated answers. If consensus is not reached, the process continues through thesis and antithesis, gradually working towards synthesis and building consensus.
A-94. Like ACH, Delphi is effective when dealing with complex problems such as those found in counterinsurgency. For example, given a list of Afghanistan provinces, with a generalized indicator list for Taliban use of criminal enterprises, the analyst can determine which provinces (in prioritized order with rationale) are most dangerous to the Afghan government.
FUTURES WHEEL
A-95. A Futures Wheel is a method used by analysts to identify second- and third-order effects of a potential COA. Analysts are regularly tasked to explore the impact of a proposed operation or COA. In order to avoid compiling a list that is shallow and incomplete, a Futures Wheel provides a structured method and visual tool to aid in the analysis. Originally developed in the 1970s to identify the potential consequences of trends and events, it is also a useful tool to aid in decisionmaking and analyzing the impact of operations.
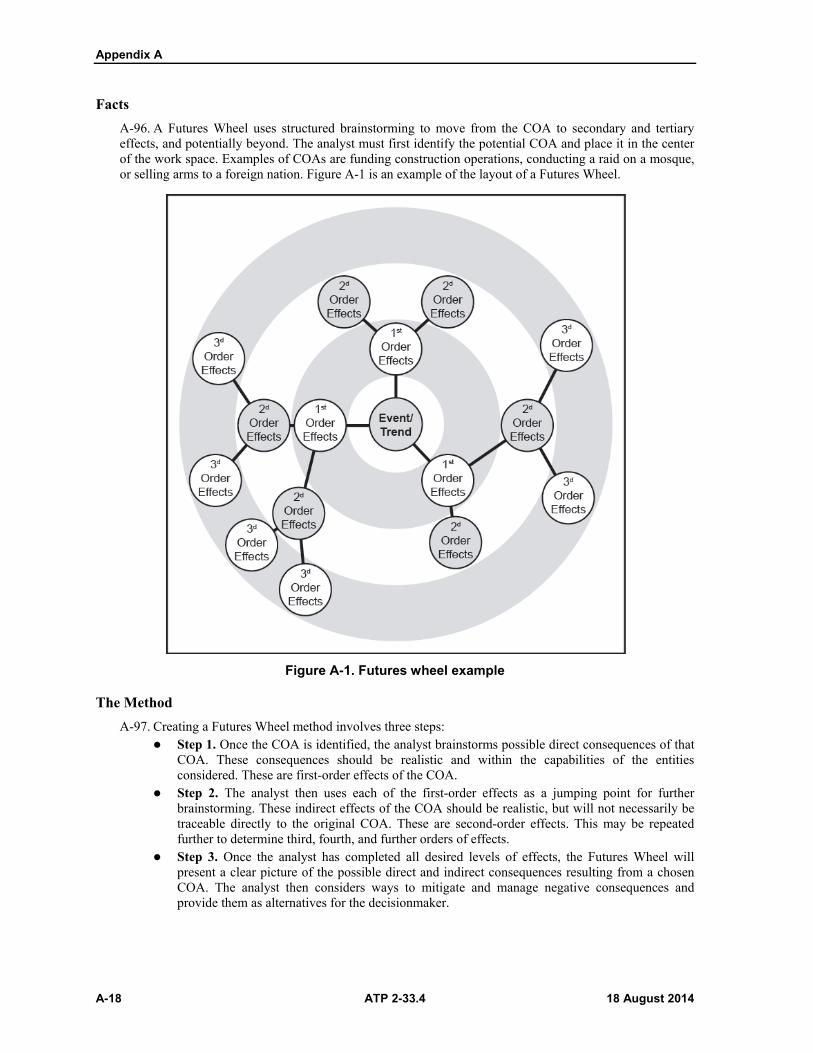
Appendix A
A-18 ATP 2-33.4 18 August 2014
Facts
A-96. A Futures Wheel uses structured brainstorming to move from the COA to secondary and tertiary effects, and potentially beyond. The analyst must first identify the potential COA and place it in the center of the work space. Examples of COAs are funding construction operations, conducting a raid on a mosque, or selling arms to a foreign nation. Figure A-1 is an example of the layout of a Futures Wheel.
Figure A-1. Futures wheel example
The Method
A-97. Creating a Futures Wheel method involves three steps: Step 1. Once the COA is identified, the analyst brainstorms possible direct consequences of that
COA. These consequences should be realistic and within the capabilities of the entities considered. These are first-order effects of the COA.
Step 2. The analyst then uses each of the first-order effects as a jumping point for further brainstorming. These indirect effects of the COA should be realistic, but will not necessarily be traceable directly to the original COA. These are second-order effects. This may be repeated further to determine third, fourth, and further orders of effects.
Step 3. Once the analyst has completed all desired levels of effects, the Futures Wheel will present a clear picture of the possible direct and indirect consequences resulting from a chosen COA. The analyst then considers ways to mitigate and manage negative consequences and provide them as alternatives for the decisionmaker.

Emerging Analytic Techniques
18 August 2014 ATP 2-33.4 A-19
KNOWLEDGE PLANNING
A-98. Knowledge planning is a dynamic and collaborative methodology for the identification and satisfaction of critical information needs.
Facts
A-99. Knowledge planning provides a mechanism for linking operational requirements with information collection strategies and capabilities; that is, linking critical information needs with—
Relevant knowledge centers (Defense intelligence enterprise, intelligence warfighting function). Collection assets. Specific target areas. Operational parametric (time-accuracy-resolution). Standing collection requirements.
The Method
A-100. Knowledge planning is comprised of the following steps: Step 1. Review and refine critical information needs (decisionmaker and operations). Step 2. Determine priorities (decisionmaker and operations). Step 3. Determine target areas (decisionmaker and operations). Step 4. Determine critical information needs priority and time, accuracy, resolution parametrics
(decisionmaker and operations). Step 5. Review and refine information and intelligence requirements (intelligence). Step 6. Determine requirements (decisionmaker and operations). Step 7. Determine sensor requirements (intelligence). Step 8. Determine knowledge center requirements (intelligence). Step 9. Determine processing and dissemination requirements (intelligence).
A-101. An example of knowledge planning would be the development of a knowledge plan for a brigade combat team scheduled to deploy to a foreign country.
RULES FOR VERIFICATION
A-102. Rules for Verification is a problem-solving methodology designed to establish likelihoods, not certainty, of hypotheses.
Facts
A-103. Rules for Verification can be applied to situation development (updating intelligence assessments), developing collection strategies, and conducting assessment.
The Method
A-104. There are seven Rules for Verification commonly used by intelligence personnel: Rule 1. A hypothesis is more believable when a consequence of that hypothesis is verified.
When a piece of evidence is verified that is supportive of the hypothesis, the hypothesis becomes more believable.
Rule 2. The credibility of a hypothesis increases as the different means used to test the hypothesis support it. Hypothesis becomes more creditable when different collection disciplines verify supporting evidence, or different sources within the same discipline.
Rule 3. Confidence in a hypothesis increases as the observable bits of evidence that support the hypothesis bear some proximity to each other.

Appendix A
A-20 ATP 2-33.4 18 August 2014
Rule 4. The credibility of a hypothesis is directly proportional to the number of instances in which the hypothesis was supported. Simply put, the more verifiable evidence, the greater the possibility of truth in the hypothesis.
Rule 5. Confidence in a hypothesis increases when an incompatible and rival conjecture is refuted. Very rarely is just one hypothesis considered.
Rule 6. Confidence in a hypothesis increases to the extent that it is consistent with another hypothesis that is highly credible.
Rule 7. In instances in which observables support two different hypotheses, the simpler hypothesis stands a better chance of being true.

18 August 2014 ATP 2-33.4 B-1
Appendix B
Indicators in Decisive Action
This appendix provides examples of indicators used in decisive action. While not an all-inclusive list of indicators, this appendix assists the analyst in confirming or denying an action or event in offensive, defensive, and stability operations.
OVERVIEW B-1. The activities that reveal the intended threat COA are called indicators. (See FM 2-01.3 for more information on indicators.) An indicator is an activity or lack of activity that confirms or denies the action or event specified in an intelligence requirement. Intelligence analysts develop indicators. Because the use of indicators is such an important part of determining threat COAs, it is imperative that all-source intelligence analysts carefully review all indicators. The tables in this appendix, although exemplary and not all inclusive, identify the different types of indicators, as well as applicable activities. The examples are designed to provide a starting point for more in-depth specific analysis for an operation. Development and refinement of indicators is an important activity that links all-source analysis to planning requirements and assessing collection.
INDICATOR EXAMPLES B-2. The following tables in this appendix list various activities and explanations of indicators:
Table B-1 on page B-2—Offensive indicators. Table B-2 on page B-3—Defensive indicators. Table B-3 on page B-4—Delaying indicators. Table B-4 on page B-5—Withdrawal indicators. Table B-5 on page B-5—Population indicators. Table B-6 on page B-7—Propaganda indicators. Table B-7 on page B-8—Commodities indicators. Table B-8 on page B-10—Environment-related indicators. Table B-9 on page B-10—IED indicators, observables, and signatures. Table B-10 on page B-11—Threat environment indicators. Table B-11 on page B-11—Recurrance of same-clan indicators.

Appendix B
B-2 ATP 2-33.4 18 August 2014
Table B-1. Offensive indicators
Activity Explanation
Massing of maneuver elements, armor, artillery, and logistic support.
May indicate the main effort by weakening areas of secondary importance.
Deployment of combat elements on a relatively narrow frontage (not forced by terrain).
May provide maximum combat power at the point of attack by reducing frontages. Likely threat decisive effort.
Massing of indirect fire support assets.
May indicate initiation of main effort.
Extensive artillery preparation of up to 50 minutes in duration or longer.
Initiates preparation preceding an attack.
Dispersal of tanks and self-propelled artillery to forward units.
Can indicate formation of combined arms assault formations with tanks accompanying the leading maneuver elements and artillery following in bounds.
Surface-to-surface missile units located forward.
Provides depth to threat offensive tasks; places friendly support and unassigned areas in range. May also indicate, when employed alone, harassing or special weapons (chemical) delivery.
Antiaircraft artillery and mobile surface-to-surface missiles located well forward with maneuver elements.
Provides increased protection to massed forces before attack; extends air defense umbrella forward as units advance.
Demonstrations and feints. May precede an attack; may deceive actual point of attack.
Establishment and strengthening of counterreconnaissance screen.
Protects assembly areas and forces as they prepare for attack. May be effort to prevent friendly forces from seeing attack preparations.
Concentration of mass toward one or both flanks within the forward area.
May indicate intent for single or double envelopment, particularly if massing units are armor heavy.
Increased patrolling or ground reconnaissance.
May indicate efforts to gather detailed intelligence regarding friendly dispositions prior to attack.
Command posts located well forward; mobile command posts identified.
Indicates preparation to command an offensive task from as far forward as possible.
Movement of noncombatants from the area of operations.
Indicates preparation for rapid forward advance of troops and follow-on forces.
Extensive conduct of drills and rehearsals in unassigned areas.
Often indicates major attacks, particularly against fortified positions or strongly defended natural or manmade barriers, which require rehearsal of specialized tactics and skills.
Cessation of drills and rehearsals. Rehearsals are completed and the unit is preparing for offensive tasks.
Increased activity in supply, maintenance, and motor transport areas.
May indicate movement of additional forces to the front to sustain a major attack. Stocking of sustainment items, such as ammunition and medical supplies, before an attack.
Increased aerial reconnaissance (including unmanned aircraft systems).
Threat effort to collect further intelligence on friendly dispositions or defensive positions.
Establishment of forward arming and refueling points, auxiliary airfields, or activation of inactive airfields.
Preparation for increased sorties for aircraft and faster turnaround time and aviation sustainment. Indicates preparation to support offensive tasks with aircraft as far forward as possible.
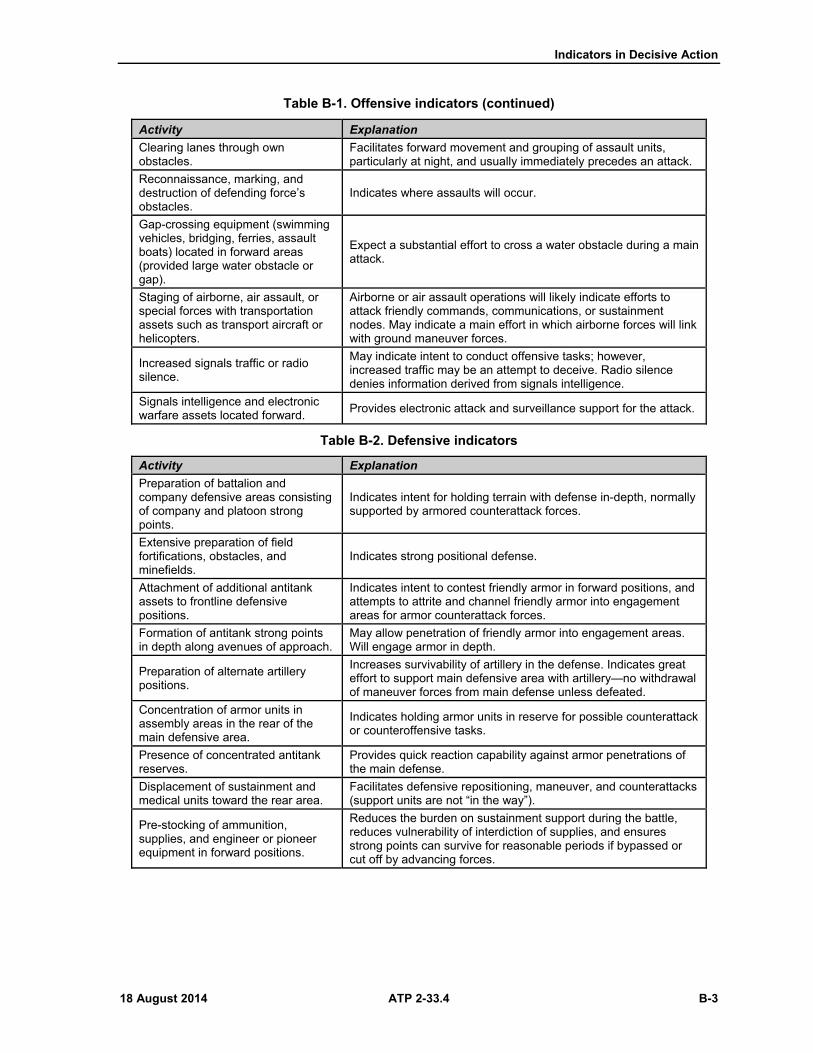
Indicators in Decisive Action
18 August 2014 ATP 2-33.4 B-3
Table B-1. Offensive indicators (continued)
Activity Explanation
Clearing lanes through own obstacles.
Facilitates forward movement and grouping of assault units, particularly at night, and usually immediately precedes an attack.
Reconnaissance, marking, and destruction of defending force’s obstacles.
Indicates where assaults will occur.
Gap-crossing equipment (swimming vehicles, bridging, ferries, assault boats) located in forward areas (provided large water obstacle or gap).
Expect a substantial effort to cross a water obstacle during a main attack.
Staging of airborne, air assault, or special forces with transportation assets such as transport aircraft or helicopters.
Airborne or air assault operations will likely indicate efforts to attack friendly commands, communications, or sustainment nodes. May indicate a main effort in which airborne forces will link with ground maneuver forces.
Increased signals traffic or radio silence.
May indicate intent to conduct offensive tasks; however, increased traffic may be an attempt to deceive. Radio silence denies information derived from signals intelligence.
Signals intelligence and electronic warfare assets located forward.
Provides electronic attack and surveillance support for the attack.
Table B-2. Defensive indicators
Activity Explanation
Preparation of battalion and company defensive areas consisting of company and platoon strong points.
Indicates intent for holding terrain with defense in-depth, normally supported by armored counterattack forces.
Extensive preparation of field fortifications, obstacles, and minefields.
Indicates strong positional defense.
Attachment of additional antitank assets to frontline defensive positions.
Indicates intent to contest friendly armor in forward positions, and attempts to attrite and channel friendly armor into engagement areas for armor counterattack forces.
Formation of antitank strong points in depth along avenues of approach.
May allow penetration of friendly armor into engagement areas. Will engage armor in depth.
Preparation of alternate artillery positions.
Increases survivability of artillery in the defense. Indicates great effort to support main defensive area with artillery—no withdrawal of maneuver forces from main defense unless defeated.
Concentration of armor units in assembly areas in the rear of the main defensive area.
Indicates holding armor units in reserve for possible counterattack or counteroffensive tasks.
Presence of concentrated antitank reserves.
Provides quick reaction capability against armor penetrations of the main defense.
Displacement of sustainment and medical units toward the rear area.
Facilitates defensive repositioning, maneuver, and counterattacks (support units are not “in the way”).
Pre-stocking of ammunition, supplies, and engineer or pioneer equipment in forward positions.
Reduces the burden on sustainment support during the battle, reduces vulnerability of interdiction of supplies, and ensures strong points can survive for reasonable periods if bypassed or cut off by advancing forces.

Appendix B
B-4 ATP 2-33.4 18 August 2014
Table B-2. Defensive indicators (continued)
Activity Explanation
Increased depth from the forward line of troops of artillery and surface-to-surface missile units.
Allows continued employment of artillery during maneuver defense without significant rearward displacement.
Increased use of land-line communications—often with corresponding decrease in radio traffic.
Implies intent to remain in position because landlines are less vulnerable to electronic warfare and provide more secure communications.
Presence of dummy positions, command posts, and weapons.
Complicates friendly targeting and analysis. Deceives attacking force of actual defensive positions and strength.
Air defense more concentrated in one particular area.
Indicates location of numerous high-value targets, such as armor, sustainment, artillery, or command posts.
Table B-3. Delaying indicators
Activity Explanation
Withdrawal from defensive positions before becoming heavily engaged.
Indicates delaying action to avoid decisive engagements.
Numerous local counterattacks with limited objectives; counterattacks broken off before position is restored.
Assists disengaging units in contact, rather than an attack to restore position.
Units bounding rearward to new defensive positions, while another force begins or continues to engage.
Indicates units conducting local withdrawals to new positions. Usually an effort to preserve the defending force and trade space for time.
Maximum firepower located forward, firing initiated at long ranges.
Intent to inflict casualties thus slowing advance of attacking force and provide sufficient volume of fire to avoid decisive engagements. Allows for time to disengage and reposition defending forces.
Extremely large unit frontages compared to usual defensive positions.
Indicates delaying action to economize force, allowing larger formations to withdraw.
Chemical or biological weapons in forward areas. Reports of threat in chemical protective clothing while handling munitions.
Indicates possible chemical munitions use. Chemically contaminated areas cause significant delays to attacking forces.
Identification of dummy positions and minefields.
Indicates defending force using economy of force. Causes advancing force to determine if mines are live or inert.

Indicators in Decisive Action
18 August 2014 ATP 2-33.4 B-5
Table B-4. Withdrawal indicators
Activity Explanation
Systematic destruction of bridges, communication facilities, and other assets.
Denies advancing force the use of infrastructure and installations in withdrawal areas.
Establishment of a covering force or rear guard.
Covers withdrawal of main body; usually consists of a sub-element of the main force; usually only the rear guard element engages attacking forces.
Increased rearward movement at night, particularly during inclement weather.
Attempt to avoid contact with the attacking unit in order to preserve the force and its combat power.
Minimal presence of sustainment and medical units.
Withdrawal of nonessential sustainment and medical assets. It may also indicate the inability to move depots and dumps.
Establishing and marking withdrawal routes and traffic control points.
Facilitates rapid movement of forces to the rear. Indicates attempt to preserve force by conducting an organized and rapid withdrawal.
Preparation of new defensive positions beyond supporting range of present positions.
Indicates an attempt to establish new positions along suitable terrain before the arrival of deliberately withdrawn forces.
Increased engineer activity and stockpiling of explosives in threat rear area near bridges, tunnels, or built-up areas.
Mobility operations facilitate a withdrawal by maintaining lines of communications for own forces. Demolition preparation indicates likely destruction of infrastructure in front of attacking force.
Rearward movement of long-range artillery.
Positions long-range artillery in subsequent defensive positions in order to support withdrawal with indirect fire.
Activation of command posts well removed (beyond usual norms) from the present battle area. Positioning of command posts along route of withdrawal.
Establishes command nodes in the new position and along route of march in order to control movement and arrival of forces.
Table B-5. Population indicators
Indicators of Aggressive Behavior Within the Population
Identification of agitators, insurgents, and militias or criminal organizations, as well as their supporters and sympathizers, who suddenly appear in, or move from, an area.
New faces or unknown people in a rural community.
Unusual gatherings among the population.
Disruption of normal social patterns.
Mass migration from urban to rural locations or from rural to urban locations.
Massing of combatants of competing power groups.
Increase in the size of embassy or consulate staffs from a country or countries that support indigenous disaffected groups, particularly those hostile to the United States or the current intervention.
Increase in neighboring countries of staff and activities at embassies or consulates of countries associated with supporting indigenous disaffected groups.
Lack of children playing outside in neighborhoods.
Increased travel by suspected subversives or leaders of competing power bases to countries hostile to the United States or opposed to the current intervention.
Influx of opposition, resident, and expatriate leaders into the area of operations.
Reports of opposition or disaffected indigenous population receiving military training in foreign countries.
Increase of visitors—such as tourists, technicians, business persons, religious leaders, officials—from groups or countries hostile to the United States or opposed to the current intervention.

Appendix B
B-6 ATP 2-33.4 18 August 2014
Table B-5. Population indicators (continued)
Indicators of Aggressive Behavior Within the Population (continued)
Close connections between diplomatic personnel of hostile countries and local opposition groups.
Communications between opposition groups and external supporters.
Increase of disaffected youth gatherings, such as student protests or demonstrations.
Establishment of organizations of unexplained origin and with unclear or nebulous aims.
Establishment of new organizations that replace an existing organizational structure with identical aims.
Appearance of many new members in existing organizations, such as labor unions.
Infiltration of student organizations by known agitators.
Appearance of new organizations stressing grievances or interests of repressed or minority groups.
Reports of large donations to new or revamped organizations.
Reports of payment to locals for engaging in subversive or hostile activities.
Reports of the formation of opposition paramilitary or militia organizations.
Reports of lists of targets for planned opposition attacks.
Appearance of “professional” agitators in gatherings or demonstrations that result in violence.
Evidence of paid and armed demonstrators’ participation in riots or violent protests.
Significant increase in thefts, armed robberies, and violent crime in rural areas; increase in bank robberies in urban areas.
Opposition-Directed Aggressive Behavior Within the Population
Refusal of population to pay, or unusual difficulty in collecting rent, taxes, or loan payments.
Trends of demonstrated hostility toward government forces or the mission force.
Unexplained disappearance of the population or avoidance of certain areas.
Unexplained disappearance or relocation of children and adolescents.
Reported incidents of attempted recruitment to join new movements or underground organizations.
Criminals and disaffected youth who appear to be acting with and for the opposition.
Reports of extortion and other coercion by opposition elements to obtain financial support.
Use of fear tactics to coerce, control, or influence the local population.
Surveillance of host-nation government or mission force facilities and personnel.
Activities Directed Against the Government or Mission Force Within the Population
Failure of police and informer nets to report accurate information, which may indicate sources are actively supporting opposition elements or the sources are intimidated.
Decreasing success of government law enforcement or military infiltration of opposition or disaffected organizations.
Assassination or disappearance of government intelligence sources.
Reports of attempts to bribe or blackmail government officials, law enforcement employees, or mission personnel.
Classified information leaked to the media.
Sudden affluence of certain government and law enforcement personnel.
Recurring failure of government or mission force raids on suspected opposition organizations or illegal activities apparently due to forewarning.
Increased hostile or illegal activity against the government, its law enforcement and military organizations, foreigners, minority groups, or competing political, ethnic, linguistic, or religious groups.
Demonstrations against government forces, minority groups, or foreigners designed to instigate violent confrontations with government or mission forces.
Increased antigovernment or mission force rhetoric in local media.

Indicators in Decisive Action
18 August 2014 ATP 2-33.4 B-7
Table B-5. Population indicators (continued)
Activities Directed Against the Government or Mission Force Within the Population (continued)
Occurrence of strikes or work force walkouts in critical industries or geographic areas intended to cast doubt on the government’s ability to maintain order and provide security and services to the people.
Unexplained loss, destruction, or forgery of government identification cards and passports.
Recurring unexplained disruption of public utilities.
Reports of terrorist acts or extortion attempts against local government leaders and business persons.
Murder or kidnapping of government, military, and law enforcement officials or mission force personnel.
Closing of schools.
Reports of attempts to obtain classified information from government officials, government offices, or mission personnel.
Table B-6. Propaganda indicators
General Indicators of Negative Propaganda
Dissident propaganda from unidentified sources.
Increase in the number of entertainers with a political message.
Increase of political themes in religious services.
Increase in appeals directed at intensifying general ethnic or religious unrest in countries where ethnic or religious competition exists.
Increase of agitation on issues for which there is no identified movement or organization.
Renewed activity by dissident or opposition organizations thought to be defunct or dormant.
Circulation of petitions advocating opposition or dissident demands.
Appearance of opposition slogans and pronouncements by word-of-mouth, graffiti, posters, leaflets, and other means.
Propaganda linking local ethnic groups with those in neighboring countries or regions.
Clandestine radio broadcasts intended to appeal to those with special grievances or to underprivileged ethnic groups.
Use of bullhorns, truck-mounted loudspeakers, and other public address equipment in “spontaneous” demonstrations.
Presence of non-media photographers among demonstrators.
Dissident propaganda from unidentified sources.
Propaganda Activities Directed Against the Established Government
Attempts to discredit or ridicule national or public officials.
Attempts to discredit the judicial and law enforcement system.
Characterization of government projects and plans.
Radio and Internet propaganda from foreign countries that is aimed at the target country’s population and accuses the target country’s government of failure to meet the people’s needs.

Appendix B
B-8 ATP 2-33.4 18 August 2014
Table B-6. Propaganda indicators (continued)
Propaganda Activities Directed Against the Mission Force and Host-Nation Military and Law Enforcement
Spreading accusations that the host-nation military and police are corrupt and out of touch with the people.
Spreading accusations that mission force personnel will introduce customs or attitudes that are in opposition to local cultural or religious beliefs.
Character assassinations of mission, military, and law enforcement officials.
Demands to remove strong anti-position or anti-crime military and law enforcement leaders from office.
Calls for the population to cease cooperating with the mission force or host-nation military and law enforcement.
Widespread hostile media coverage of even minor criminal violations or incidents involving mission force personnel.
Accusations of brutality or ineffectiveness, or claims that mission or government forces initiated violence following confrontations.
Publication of photographs portraying repressive and violent acts by mission force or government forces.
Refusal of business persons and shop owners to conduct business with mission force personnel.
Propaganda Activities Directed Against the Education System
Appearance of questionable doctrine and teachings in the educational system.
Creation of ethnic, tribal, religious, or other interest group schools outside the government educational system, which propagate opposition themes and teachings.
Charges that the educational system is only training youth to do the government’s bidding.
Student unrest manifested by new organizations, proclamations, demonstrations, and strikes against authority.
Table B-7. Commodities indicators
Indicators of Negative Food-Related Activities
Diversion of crops or meat from markets.
Unexplained shortages of food supplies when there are no reports of natural causes.
Increased reports of foodstuffs pilfering.
Sudden increase in food prices, possibly indicating an opposition-levied tax.
Spot shortages of foodstuffs in regions or neighborhoods associated with a minority group or weaker competing interest group, while food supplies are generally plentiful in other areas. Conversely, sudden local shortages of foodstuffs in rural areas may indicate the existence of an armed opposition group in that region.
Sudden increase of meat in markets, possibly indicating slaughtered livestock because of a lack of fodder to sustain them.
Appearance of emergency relief supplies for sale in black markets possibly indicating diversion from starving population.
Appearance of relief supplies for sale in normal markets in a country or region recently suffering from large-scale hunger, which may indicate the severity of the food crisis, is diminishing.
Indicators of Negative Arms and Ammunition-Related Activities
Increased loss or theft of weapons from military and police forces.
Discovery of arms, ammunition, and explosives being clandestinely manufactured, transported, or cached.
Attacks on patrols resulting in the loss of weapons and ammunition.
Increased purchase of surplus military goods.
Sudden increase in prices for arms and ammunitions on the open market.
Reports of large arms shipments destined for neighboring countries, but not intended for that government.
Reports of known arms traffickers establishing contacts with opposition elements.

Indicators in Decisive Action
18 August 2014 ATP 2-33.4 B-9
Table B-7. Commodities indicators (continued)
Indicators of Negative Arms and Ammunition-Related Activities (continued)
Increase in armed robberies.
Reports of thefts or sudden shortages of chemicals, which could be used in the clandestine manufacture of explosives.
Reports of large open-market purchases of explosives-related chemicals without an identifiable industrial use.
Appearance of manufactured or smuggled arms from noncontiguous foreign countries.
Indicators of Negative Clothing-Related Activities
Unusual, systematic purchase or theft of clothing materials that could be used for the manufacture of uniforms or footwear.
Unusual scarcity of clothing or material used in the manufacture of clothing or footwear.
Distribution of clothing to underprivileged or minority classes by organizations of recent or suspect origin.
Discovery of caches of uniforms and footwear or materials that could be used to manufacture uniforms and footwear.
Increase of males in the streets wearing military style clothing or distinctive markings.
Indicators of Negative Medicine-Related Activities
Large-scale purchasing or theft of drugs and medicines or the herbs used to manufacture local remedies.
Scarcity of drugs and medicinal supplies on the open or black markets.
Diversion of medical aid donations.
Discovery of caches or medical supplies.
Indicators of Negative Communications-Related Activities
Increase in the purchase and use of radios.
Discovery of caches of communication equipment.
Unusual increase in amateur radio or cellular telephone communications traffic.

Appendix B
B-10 ATP 2-33.4 18 August 2014
Table B-8. Environment-related indicators
Indicators of Suspicious Rural Activities
Evidence of increased foot traffic in the area.
Increased travel within and into remote or isolated areas.
Unexplained trails and cold campsites.
Establishment of new, unexplained agricultural areas or recently cleared fields.
Unusual smoke, possibly indicating the presence of a campsite or a form of communication.
Concentration of dead foliage in an area, possibly indicating use of camouflage.
Presence of foot traps, spikes, booby traps, or improvised mines along routes and trails.
Indicators of Suspicious Urban Activities
Apartments, houses, or buildings being rented, but not lived in as homes.
Slogans written on walls, bridges, and streets.
Defacement of government and mission force information signs.
Sabotage of electrical power network, pollution of urban area’s water supply.
Terrorist acts against physical targets such as bridges, dams, airfields, or buildings.
Change of residence of suspected agitators or opposition leaders.
Discovery of message dead drops.
Increased smuggling of currency, gold, gems, narcotics, medical supplies, and arms into urban centers.
Appearance of abnormal amounts of counterfeit currency.
Increase in bank robberies.
Work stoppages or slowdowns in essential industries.
Marked decline in product quality in essential industries.
Marked increase in equipment failures in essential industries.
Unexplained explosions in essential utilities and industries.
Establishment of roadblocks or barricades around neighborhoods associated with opposition elements.
Attempts to disrupt public transport through sabotage.
Malicious damage to industrial products or factory machinery.
Table B-9. Improvised explosive device indicators, observables, and signatures
Indicators of Basic Improvised Explosive Device (IED) Indicators, Observables, and Signatures
Vehicles following convoys for a long distance and then pulling off to the side of the road.
Dead animals along the roadways.
Freshly dug holes along the roadway (possible future IED report).
New dirt or gravel piles.
Obstacles in roadway used to channel the convoy.
Personnel on overpasses.
Signal with flares or city lights (turned off or on) as convoy approaches.
Absence of the ordinary children in the area, merchants at a market.
Key Indicators, Observables, and Signatures (Indicating Something is About to Happen)
Dramatic changes in population from one block to the next.
Dramatic changes in illumination (lights) from one area to the next during hour of limited visibility.
Absence of children when normally present.
Identification of markings indicated in intelligence reports of an IED site.
New dirt or gravel piles.

Indicators in Decisive Action
18 August 2014 ATP 2-33.4 B-11
Table B-10. Threat environment indicators
Indicator Information Objective
Local Conflict Casualty
What groups (tribes, clans) are local rivals?
How intense is the rivalry?
What are the relative strengths or external alliances of rival groups?
U.S. presence or host government?
Do locals normally carry arms?
Does group rivalry parallel rivalry within the host government?
Table B-11. Recurrence of same-clan indicators
Indicator Information Objective
Recurrence of Same Clan Name Among Detainees
Is clan native to the area? If so, where does clan reside, in which villages?
How big is the clan, how many male adults?
Who is the acknowledged chief?
Do or did any members of clan have positions in former regime? Who are they? Do any of them have access to arms or ammunition? Where is their cache or source?
Do any of them provide training to other relatives?
What are the usual economics of the clan?
Can the clan exploit these activities to gain arms or facilitate or conceal their operations?
Has any relative been killed by U.S. or multinational forces? If so, is there a current mood of blood vengeance within the clan?
Which mosques do clan members attend? Do the imams follow a particular doctrine? Is that doctrine radical or moderate? If radical, do the imams encourage hostility to the U.S. presence?
Has the clan offered protection to any strangers or foreigners? Are these people recent arrivals or long-term residents? What is the identity and agenda or business of such people?

This page intentionally left blank.

18 August 2014 ATP 2-33.4 Glossary-1
Glossary
SECTION I – ACRONYMS AND ABBREVIATIONS
ACH Analysis of Competing Hypotheses
ADP Army doctrine publication
ADRP Army doctrine reference publication
AO area of operations
ASCOPE area, structures, capabilities, organizations, people, and events
ATP Army techniques publication
ATTP Army tactics, techniques, and procedures
CARVER criticality, accessibility, recuperability, vulnerability, effect, and recognizibility
CIED counter-improvised explosive device
COA course of action
DA Department of the Army
DCGS-A Distributed Common Ground System-Army
DOD Department of Defense
DSCA defense support of civil authorities
FM field manual
FOUO For Official Use Only
G-2 assistant chief of staff, intelligence
HVI high-value individual
IED improvised explosive device
IPB intelligence preparation of the battlefield
JP joint publication
MCS Mission Command System
PIR priority intelligence requirement
PMESII political, military, economic, social, information, and infrastructure
S-2 intelligence staff officer
SIGINT signals intelligence
SNA social network analysis
TC training circular
U.S. United States

Glossary
Glossary-2 ATP 2-33.4 18 August 2014
SECTION II – TERMS
all-source intelligence
(Army) The integration of intelligence and information from all relevant sources in order to analyze situations or conditions that impact operations. (ADRP 2-0)
defensive task
A task conducted to defeat an enemy attack, gain time, economize force, and develop conditions favorable for offensive or stability tasks. (ADRP 3-0)
indications
(joint) In intelligence usage, information in various degrees of evaluation, all of which bear on the intention of a potential enemy to adopt or reject a course of action. (JP 2-0)
offensive task
A task conducted to defeat and destroy enemy forces and seize terrain, resources, and population centers. (ADRP 3-0)
site exploitation
(joint) A series of activities to recognize, collect, process, preserve, and analyze information, personnel, and/or materiel found during the conduct of operations. (JP 3-31)
stability operations
(joint) An overarching term encompassing various military missions, tasks, and activities conducted outside the United States in coordination with other instruments of national power to maintain or reestablish a safe and secure environment, provide essential governmental services, emergency infrastructure reconstruction, and humanitarian relief. (JP 3-0)

18 August 2014 ATP 2-33.4 References-1
References
REQUIRED PUBLICATIONS These sources must be available to intended users of this publication.
JOINT AND DEPARTMENT OF DEFENSE PUBLICATIONS JP 1-02. Department of Defense Dictionary of Military and Associated Terms. 8 November 2010.
ARMY PUBLICATIONS ADP 2-0. Intelligence. 31 August 2012.
ADP 3-0. Unified Land Operations. 10 October 2011.
ADP 5-0. The Operations Process. 17 May 2012.
ADRP 1-02. Terms and Military Symbols. 24 September 2013.
ADRP 2-0. Intelligence. 31 August 2012.
ADRP 3-0. Unified Land Operations. 16 May 2012.
ADRP 5-0. The Operations Process. 17 May 2012.
RELATED PUBLICATIONS These documents are cited in this manual.
JOINT AND DEPARTMENT OF DEFENSE PUBLICATIONS Most joint publications are available online at http://www.dtic.mil/doctrine/new_pubs/jointpub.htm. DOD publications are available at the DOD Issuances Web site: www.dtic.mil/whs/directives.
JP 2-0. Joint Intelligence. 22 October 2013.
JP 3-0. Joint Operations. 11 August 2011.
JP 3-28. Defense Support of Civil Authorities. 31 July 2013.
JP 3-31. Command and Control for Joint Land Operations. 24 February 2014.
ARMY PUBLICATIONS Most Army doctrinal publications are available online at www.apd.army.mil.
ADP 6-0. Mission Command. 17 May 2012.
ADRP 3-90. Offense and Defense. 31 August 2012.
ATP 3-05.1. Unconventional Warfare. 6 September 2013.
ATTP 3-90.15. Site Exploitation Operations. 8 July 2010.
FM 2-01.3. Intelligence Preparation of the Battlefield/Battlespace. 15 October 2009.
FM 3-07. Stability. 2 June 2014.
FM 3-22. Army Support to Security Cooperation. 22 January 2013.
FM 3-55. Information Collection. 3 May 2013.
FM 27-10. The Law of Land Warfare. 18 July 1956.

References
References-2 ATP 2-33.4 18 August 2014
OTHER PUBLICATIONS Heuer, Richards J., Jr. Psychology of Intelligence Analysis. Central Intelligence Agency: Center for the
Study of Intelligence, 1999. Available online at https://www.cia.gov/library/center-for-the-study-of-intelligence/csi-publications/books-and-monographs/psychology-of-intelligence-analysis/, accessed 15 July 2014.
Intelligence Community Directive Number 203. Analytic Standards. 21 June 2007. Available online at http://www.dni.gov/index.php, accessed 23 July 2014. Select Intelligence Community>IC Policies and Reports.
Red Team Handbook. Fort Leavenworth, KS: University of Foreign Military and Cultural Studies. April 2012. Available online at http://usacac.army.mil/organizations/ufmcs-red-teaming, accessed 23 July 2014. Select Schedules and Handbooks.
Title 32, United States Code. National Guard. Available online at the U.S. House of Representatives Office of the Law Revision Counsel Web site at http://uscode.house.gov/, accessed 23 July 2014.
WEB SITES Central Intelligence Agency. https://www.cia.gov, accessed 15 July 2014.
The Foundation for Critical Thinking. www.criticalthinking.org, accessed 15 July 2014.
RECOMMENDED READINGS These documents contain relevant supplemental information.
FM 2-0. Intelligence Operations. 15 April 2014.
FM 7-15. The Army Universal Task List. 27 February 2009.
Paul, Richard and Linda Elder. A Guide for Educators to Critical Thinking Competency Standards. 2005. Tomales, CA: Foundation for Critical Thinking. 2005. Available online at www.criticalthinking.org, accessed 15 July 2014.
U.S. Army Combined Arms Center. http://usacac.army.mil/cac2/CADD/, accessed 15 July 2014.
SOURCES USED AR 380-5. Department of the Army Information Security Program. 29 September 2000.
Elder, Linda and Richard Paul. The Thinker’s Guide to Analytic Thinking: How to Take Thinking Apart and What to Look for When You Do. Tomales, CA: Foundation for Critical Thinking. 2012. Available online at www.criticalthinking.org, accessed 15 July 2014.
Memorandum, Deputy Chief of Staff, G-3/5/7, DAMO-ODA-A, 30 August 2010, subject: Operations Security (OPSEC) Guidance for Counter-Improvised Explosive Device (C-IED) and Improvised Explosive Device Defeat (IEDD). Available online: www.ikn.army.mil, accessed 23 July 2014. Select Applications>IKN Applications>Document Management System (DMS)>Doctrine (folder)>Policy Memoranda (folder)>OPSEC Guidance.
Paul, Richard and Linda Elder. The Miniature Guide to Critical Thinking: Concepts and Tools. 2009. Tomales, CA: Foundation for Critical Thinking. 2012. Available online at www.criticalthinking.org, accessed 15 July 2014.
PRESCRIBED FORMS None.
REFERENCED FORMS Unless otherwise indicated, DA forms are available on the Army Publishing Directorate Web site (www.apd.army.mil).
DA Form 2028. Recommended Changes to Publications and Blank Forms.

18 August 2014 ATP 2-33.4 Index-1
Index
Entries are by paragraph number unless indicated otherwise.
A ACH, 4-10, 4-12, A-78−88
8-step procedure, A-80 diagnostic analytical technique,
6-22 example, A-84
all-source intelligence, 1-9 analyst responsibilities, 4-28,
4-59, B-1 definition, 1-14 steps, 1-6
Analysis of Competing Hypotheses. See ACH.
analytic support to unified land operations, 6-2 techniques in decisive action,
6-20 to defensive operations, 6-5 to defensive operations, 6-8 to DSCA, 6-14 to offensive operations, 6-4 to stability operations, 6-10
analytic support to unique activities, 6-25 building partnership capacity,
6-26 protection, 6-29-6-31 synchronize
information-related capabilities, 6-32−6-36
analytic support to unique missions, 7-1 CIED. 7-8−7-15 counterinsurgency, 7-5−7-7 site exploitation, 7-17−7-23
analytic techniques, 1-8 basic structured, 3-3, 3-6−3-51 core Army, 3-3, 5-2 diagnostic, 4-1, 4-3, 5-2, 6-21,
table 6-1 emerging, A-1 in decisive actions, 6-2, 6-6,
6-20, 7-1 in unique missions, 7-2, 7-5,
7-8, 7-16 to support problem solving, 3-1
analytical pitfalls, 2-32, 3-4, A-87 biases, 2-38 logic pitfalls, 2-33
analyzing networks and associations, 5-26 methods
link analysis, 5-27, 5-28, 5-49 network analysis, 5-48 sociometrics or social
network analysis, 5-91
Army Mission Command System and DCGS-A functions,
1-24−1-26
automation support to intelligence analysis, 1-22 and DCGS-A, 1-23
B basic structured analytic
techniques, 3-7 event mapping, 3-25-3-31 event trees, 3-32-3-35 matrices, 3-14−3-18
use of ASCOPE and PMESII, 3-16
sorting, 3-8-3-13 subjective probability,
3-36−3-44 threat intentions matrix,
3-19−3-24 weighted ranking, 3-45−3-51
basic thinking abilities information ordering, 2-2, 2-3 pattern recognition, 2-2, 2-4 reasoning, 2-2, 2-5
C CIED
analytical support, 7-8
collaboration. See also intelligence warfighting function. and automation support, 1-22 and DIA, 1-20 and dialogue, 1-11 and the intelligence warfighting
function, 1-19, 7-18
collaboration, 1-16, 4-25
conducting studies steps, 4-58, 4-59 tasks, 4-60-4-62
contrarian techniques, A-2, A-3 Counterfactual Reasoning,
A-33−A-45 Devil’s Advocacy, A-4−A-12
High Impact/Low Probability, A-18−A-22
Red Hat Analysis, A-28−A-32 Team A/Team B
A-13−A-17 What If Analysis, A-23−A-27
core Army analytic techniques, 3-3, 5-2 analyzing complete networks
and associations, 5-2 brainstorming, 5-4 comparison, 5-13
use of CARVER techniques, 5-16
conducting pattern analysis, 5-2, 5-99
developing situational understanding and conclusions, 5-2
mathematical analysis, 5-20 situational logic, 5-23
counter-improvised explosive device. See CIED.
critical and creative thinking, 1-8, 2-13
critical thinking skills, 2-15, 2-16
D DCGS-A
role in automation support to intelligence analysis, 1-22-1-29
deception rules, 4-11
Defense intelligence enterprise, 1-21
defense support of civil authorities analytic support process,
6-14−6-19
defensive operations, 6-5
defensive tasks definition, 6-5
diagnostic analytic techniques, 4-2, 6-21 deception detection, 4-4−4-12 indicators, 4-27 key assumptions check, 4-13 quality of information check,
4-20
Director of National Intelligence role in analytic thinking, 1-5

Index
Entries are by paragraph number unless indicated otherwise.
Index-2 ATP 2-33.4 18 August 2014
Distributed Common Ground System-Army. See DCGS-A.
E elements of thought, 2-17−2-21
and intellectual standards, 2-22
in critical thinking, 2-13, 2-16
emerging analytic techniques, 6-23
emerging analytic techniques, A-1
G G-2 role in developing indicators,
4-41
I IED
activity model, 7-12, 7-13 network, 7-8, 7-12, 7-13
imaginative techniques, A-46, A-47 alternative future analysis,
A-61−A-67 brainstorming, A-48−A-50 morphological analysis,
A-68−A-76 outside-in thinking, A-51–A-53 Red Team analysis, A-54−A-60
iimprovised explosive device. See IED.
indications definition, 4-28
indicator types commodities, table B-7 defensive, table B-2 delaying, table B-3 environment related, table B-8 IED, observables, and
signatures, table B-9 offensive, table B-1 population, table B-5 propaganda, table B-6 recurrence of same clan, table
B-11
threat environment, table B-10 withdrawal, table B-4
intellectual standards, 2-20
intellectual traits confidence in reason, 2-22,
2-30 fair-mindedness, 2-22, 2-24 intellectual auatonomy, 2-22,
2-31 intellectual courage, 2-22, 2-26 intellectual empathy, 2-22,
2-27 intellectual humility, 2-22, 2-25 intellectual integrity, 2-22, 2-28 intellectual perseverance,
2-22, 2-29
intelligence analysis steps
evaluate, 1-6 analyze, 1-6, 1-12 synthesize, 1-6
intelligence disciplines in support of analytical efforts,
1-12
intelligence warfighting function, 1-21, 1-22 and collaboration, 1-19-1-21 and DCGS-A, 1-24-1-29
K key reporting criteria, 4-10
O offensive operations, 6-3
offensive tasks, definition, 6-3
P pattern analysis tools, 5-102
chronologies timelines, 5-103−5-113
incident overlay, 5-117−5-119 pattern of life analysis,
5-120−5-123 plot sheet, 5-114−5-116
R reasoning checklist, 2-19
reasoning types, 2-5 abductive reasoning, 2-11,
2-12 analogical reasoning, 2-8, 2-9 deductive reasoning, 2-10 inductive reasoning, 2-6, 2-7
S single-source analysis, 1-14
site exploitation definition, 7-16
SNA purpose, 5-91 used in logistical support
activities, 5-95 used in targeting process, 5-96 used with pattern analysis,
5-92
social network analysis. See SNA.
stability operations definition, 6-9
structured analytic techniques ACH, A-78−A-88 applying theory, A-89, A-90, Delphi technique, A-91 future wheel, A-95−A-97 knowledge planning,
A-98−A-101 rules for verification,
A-102−A-104
structured analytic techniques, A-77
T threat intentions matrix, 3-19
types of analysis in CIED operations
individual, 7-10 nodal, 7-10
U unified land operations, 6-2

ATP 2-33.4 18 AUGUST 2014
By order of the Secretary of the Army:
RAYMOND T. ODIERNO General, United States Army
Chief of Staff
Official:
GERALD B. O’KEEFE Administrative Assistant to the Secretary of the Army 1421314 DISTRIBUTION: Active Army, Army National Guard, and United States Army Reserve: Distributed in electronic media only (EMO).

This page intentionally left blank.


PIN: 104503-000
FOR OFFICIAL USE ONLY