intellectual property rights and international trade · pdf fileromania bangladesh china egypt...
TRANSCRIPT
Intellectual Property Rights and International Trade: Theory and Evidence
International Symposium “ Intellectual Property and East Asian Renaissance”
January 28, 2008
KIER and RIETIRyuhei Wakasugi

Outline(1) How actually the protection of IPR is dispersed
among countries?(2) Why the harmonization of IPR protection is so
difficult?(3) Stronger IPR will be better: evidences from the
export, the local production and the offshore R&D of Japanese firms.
(4) New paradigm of international trade: importance of IPR enforcement in East Asian countries
(5) Policy suggestion: importance of international coordination and cooperation

How actually the protection of IPR is dispersed among countries?

Dispersion of patent protection system
0.00
0.50
1.00
1.50
2.00
2.50
3.00
3.50
4.00
4.50
5.00
Unite
d State
sA
ustria
Germ
any
Neth
erlan
dsS
wede
nItalyA
ustralia
Denm
arkJapan
Kore
aU
nite
d Kin
gdom
Belgiu
mFran
ce
Israel
Sin
gapore
South
Afric
aS
painS
wizte
rland
Irelan
dN
ew
Zealan
d C
anada
Norw
ayEcuado
rH
ungary
Sri L
anka
Cze
ch R
epu
blicR
ussia
Chile
Arge
ntin
aB
ulgaria
Colo
mbia
Polan
dZim
babwe
Gre
ece
Chad
Kenya
Brazil
Jordan
Madagasc
arH
ongK
ong
Senegal
Togo
Venezu
ela
Mexic
oT
urke
yP
eru
Rom
ania
Ban
gladesh
Chin
aEgypt
Gre
nada
Indo
nesia
Som
aliaB
otsw
ana
Thailan
dT
unisia
India
Pakistan
Guyan
aG
uate
mala
Nic
aragua
Eth
iopia
Mozam
bique
1960-75
1975-90
1995
2000
Source: Park and Wagh (2002)
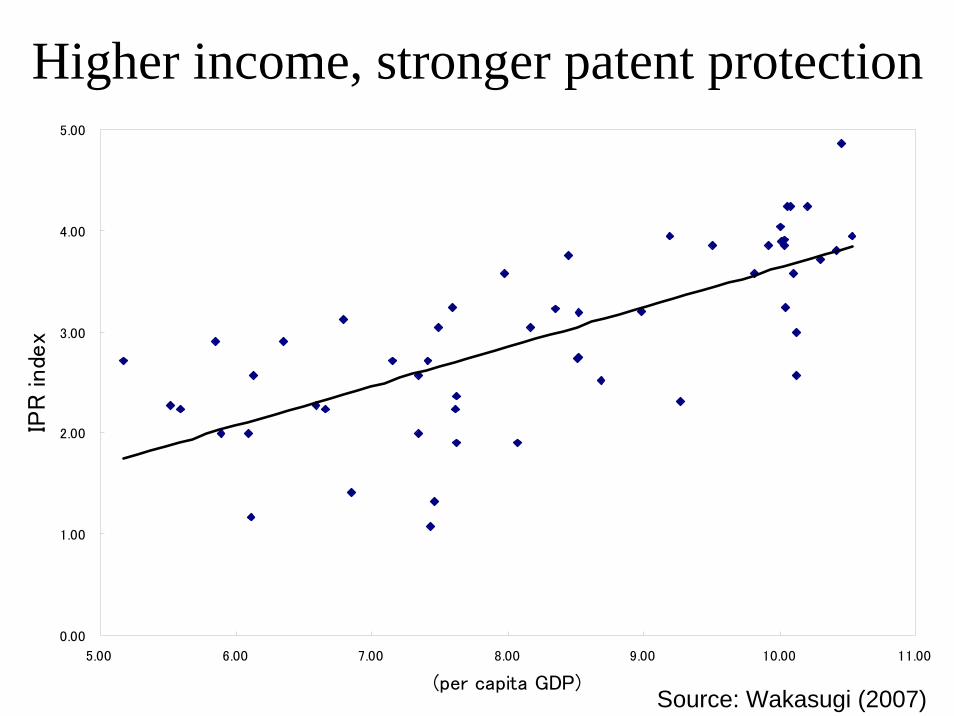
Higher income, stronger patent protection
0.00
1.00
2.00
3.00
4.00
5.00
5.00 6.00 7.00 8.00 9.00 10.00 11.00
(per capita GDP)
IPR
inde
x
Source: Wakasugi (2007)

Why the harmonization of IPR protection is so difficult: theoretical aspects

Conflicts of national interests• Suppose a country maximizes the total welfare of its
own country (consumer’s surplus and innovators profit)– The country wants the strongest protection of patent in
foreign countries, and weakest protection in its own domestic markets.
• The smaller or more innovative country prefers longer-than-optimal protection, while the larger country prefers shorter-than-optimal protection.
• Countries disagree on the harmonized protection.

Is IPR protection consistent with innovation and growth?
• The case for weak protection– IPR protection guarantees the monopoly power in
market and may not stimulus to innovation in the closed and less competitive market.
– Strong IPR protection limits the dissemination of new ideas and opportunities for economic growth.
– In the innovation-consuming countries, the cost of monopolization offsets the contribution of stronger IPR protection.

• The case for strong protection– In open trade, weak IPR protection impedes the
efforts of technology-importing countries because innovating firms refuse to license or lease new technology, deter FDI and joint venture in R&D. This limits the dissemination of new knowledge.

Dynamic Equilibrium of Innovation and Growth between “North” and “South”
North (innovators)
South (users)
New knowledge
TechnologyTransfer
Technology import
ImitationOld knowledge
Production
Innovation
Production
Export
Export
IPR protection
• long run– in open trade, North produces more old-technology
goods, which takes resources away from innovation because the stronger protection limits the imitation which enables South to develop the production of new goods.
– The rate of innovation falls in the world.– Better market access to North promotes the
production by South, then mitigates the deficiency of the stronger IPR.
Is IPR protection consistent with innovation and growth?
No clear-cut relation between IPR, trade and economic growth

Stronger IPR will be better: some empirical evidences of Japanese firms
• Export and local production of Japanese MNC: asymmetry• Offshore R&D• Modes of offshore R&D• Intra-firm technology transfer
Many studies using US and European firm data by Keith Maskus.

Effects of IPR on Japanese export and local production: asymmetry between high and low income countries
Export Local Production1995-98 1995-98
Constant 17.5842 *** 2.8657(4.3976) (0.3995)
North country -7.5422 *** -2.7817(-4.6466) (-0.9554)
GDP 0.2022 * 0.6258 ***
(1.8034) (3.1117)Per capita GDP 0.8369 *** 0.5047
(2.9360) (0.9870)Distance -1.1496 *** -0.9008 **
(-5.4939) (-2.3999)Patent Index*South country dummy -0.1462 1.3497
(-0.3138) (1.6265)Patent Index*North country dummy 1.7013 *** 1.5872 ***
(6.0068) (3.1242)N 40 40
R2 0.7703 0.5829
Source: Wakasugi (2007)

Positive effect on offshore R&DConstant -8.904 **
(2.33700)
per caita GDP -2.033 **
(0.30000)
Infrastructe 1.347 **
(0.35300)
IPR 8.807 **
(0.51100)
Export 0.151 **
(0.00800)
Operating period 0.21 **
(0.06800)
Industry dummy **
Year dummy **
R2 0.094236
N 10578Source: Wakasugi (2007)
Dependent variable: R&D/Local sales

IPR and modes of offshore R&DVariable No, R&D No, Lab Yes, Lab
1998 Marginal Effects
SalesEx -0.0006 0.0002 0.0005
Age -0.0021 0.0002 0.0019
Sales -0.0010 0.0007 0.0004
P_R&D -0.018 0.008 0.010
P_Sales -0.000004 0.000002 0.000002
Researchers -0.360 0.134 0.226
-0.159 0.073 0.086
Tech -0.047 0.002 0.045
R_IPR
Source: Ito and Wakasugi (2007)

Technology transfer of Japanese MNCDependent Variable: ln TF (Royalty Payments from Subsidiaries to Their Parent Firm)
[1]Random [2]Tobit
0.536 0.727 ln(IPR: "Index of Patent Rights" in the host country)
[0.135]** [0.231]**
0.084 0.120 ln(P_R&D: R&D expenditures of Japanese parent firms)
[0.016]** [0.028]**
0.633 1.157 ln(EMP: the number of affiliate's employee)
[0.028]** [0.053]**
-0.163 -0.282 ln(MSIZE: total industrial value added in the host country)
[0.036]** [0.062]**
0.025 0.047 TAX: the corporate tax rate in host country minus the one in Japan
[0.007]** [0.012]**
Industry dummy variables Yes Yes
2.255 1.278 Constant
[0.986]* [1.681]
the number of observations 2,269 2,269
Source: Wakasugi and Ito (2007)
New paradigm of international trade: importance of IPR enforcement in East Asian countries
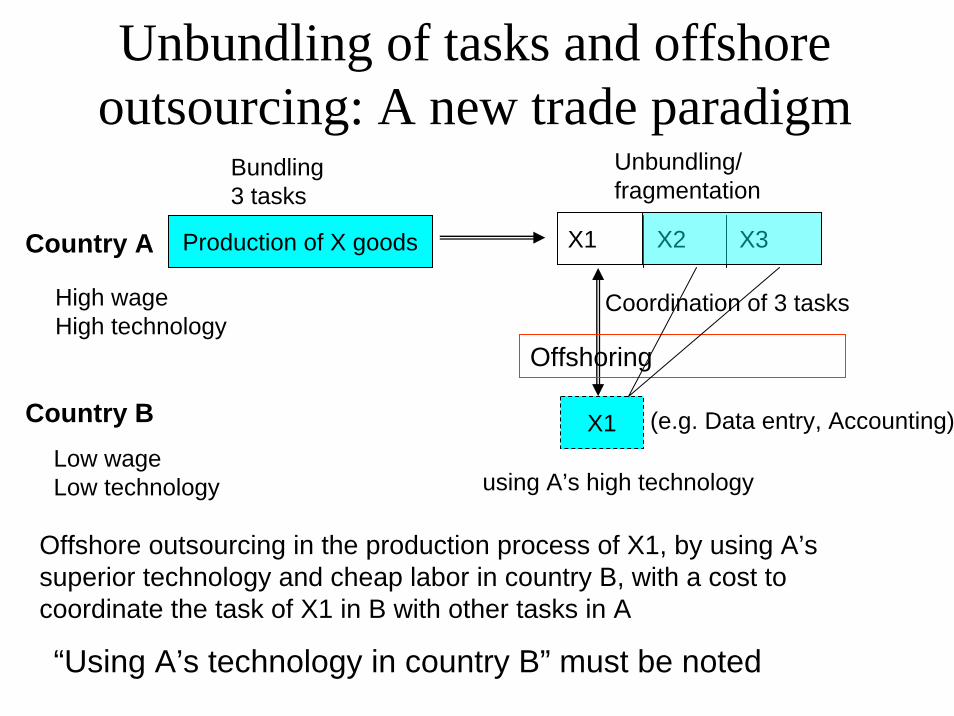
Unbundling of tasks and offshore outsourcing: A new trade paradigm
Bundling3 tasks
Country A
Country B
Production of X goods X1 X2 X3
X1
Offshoring
High wageHigh technology
Low wageLow technology
Unbundling/fragmentation
Offshore outsourcing in the production process of X1, by using A’s superior technology and cheap labor in country B, with a cost tocoordinate the task of X1 in B with other tasks in A
“Using A’s technology in country B” must be noted
using A’s high technology
Coordination of 3 tasks
(e.g. Data entry, Accounting)

Japanese firms outsourcing offshore5 years ago Currently
0.8%(Exit)
14.7% 6.0%(New entry)
15.5% 20.7%
Ito, Tomiura and Wakasugi (2007)

China and East Asia: major destination
52.8
21.9
11.6
11.52.2
China
ASEAN
Other Asia
US and Europe
ROW
China
ASEAN
Other Asia
US and Europe
Ito, Tomiura and Wakasugi (2007)
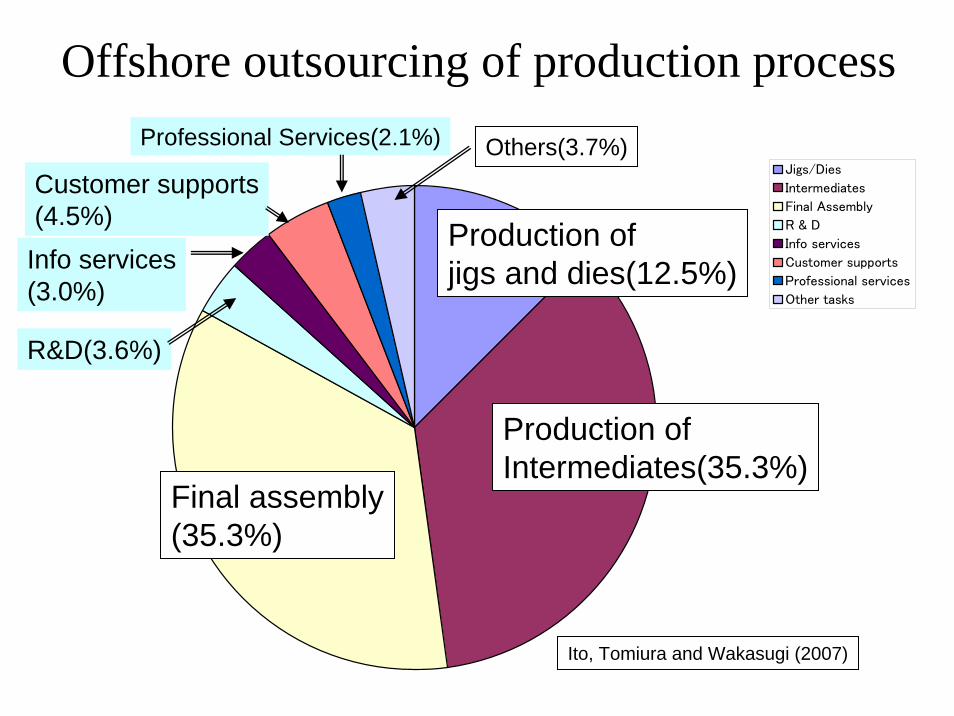
Offshore outsourcing of production process
Jigs/Dies
Intermediates
Final Assembly
R & D
Info services
Customer supports
Professional services
Other tasks
Production of Intermediates(35.3%)
Production of jigs and dies(12.5%)
Final assembly(35.3%)
R&D(3.6%)
Info services(3.0%)
Customer supports(4.5%)
Professional Services(2.1%) Others(3.7%)
Ito, Tomiura and Wakasugi (2007)

IPR and offshoring: A key role for trade and growth in East Asia
• Offshoring is a key for increasing trade and growth in East Asia.
• Technology transfer is crucial for unbundling the tasks and offshoring.
• Stronger IPR protection will raise the contractibility and provides a favorable market condition for technology transfer.
• Stronger IPR protection will be a key for trade and growth in East Asia under a new paradigm of international trade.

Policy suggestion: importance of international coordination and cooperation between
advanced and emerging countries
Policy suggestions• Importance of the harmonization of IPR protection
among trade partners, in particular East Asian countries which absorb FDI/foreign technology and are incorporated in global outsourcing.
• Capacity building for creating innovation and absorbing foreign technology is important as well as support for establishing IPR protection and enforcement
• Trade liberalization is important for stronger IPR enforcement.
• Multilateral agreement among not only advanced countries but also emerging countries including China is crucial for the effective enforcement of IPR.

Thanks!
To achieve these policy goals, (1) Establishment of APO (Asian Patent
Office), like EPO (European Patent Office) (2) Trilateral network among UPO, EPO an
APO toward WPO (World Patent Office, like WTO)
are considerable for trade and economic development of the world.