integrating passenger and freight transportation : model ... · integrating passenger and freight...
TRANSCRIPT

Integrating passenger and freight transportation : modelformulation and insightsGhilas, V.; Demir, E.; van Woensel, T.
Published: 01/01/2013
Document VersionPublisher’s PDF, also known as Version of Record (includes final page, issue and volume numbers)
Please check the document version of this publication:
• A submitted manuscript is the author's version of the article upon submission and before peer-review. There can be important differencesbetween the submitted version and the official published version of record. People interested in the research are advised to contact theauthor for the final version of the publication, or visit the DOI to the publisher's website.• The final author version and the galley proof are versions of the publication after peer review.• The final published version features the final layout of the paper including the volume, issue and page numbers.
Link to publication
General rightsCopyright and moral rights for the publications made accessible in the public portal are retained by the authors and/or other copyright ownersand it is a condition of accessing publications that users recognise and abide by the legal requirements associated with these rights.
• Users may download and print one copy of any publication from the public portal for the purpose of private study or research. • You may not further distribute the material or use it for any profit-making activity or commercial gain • You may freely distribute the URL identifying the publication in the public portal ?
Take down policyIf you believe that this document breaches copyright please contact us providing details, and we will remove access to the work immediatelyand investigate your claim.
Download date: 12. Jul. 2018

Integrating passenger and freight transportation: Model formulation and insights
Veaceslav Ghilas, Emrah Demir and Tom Van Woensel
Beta Working Paper series 441
BETA publicatie WP 441 (working paper)
ISBN ISSN NUR
804
Eindhoven December 2013

Integrating passenger and freight transportation:
Model formulation and insights
Veaceslav Ghilas*, Emrah Demir and Tom Van Woensel
School of Industrial Engineering,Operations, Planning, Accounting and Control (OPAC),
Eindhoven University of Technology,Eindhoven, 5600 MB, The Netherlands
Abstract
Integrating passenger and freight flows creates attractive business opportunities because thesame transportation needs can be met with fewer vehicles and emissions. This paper seeks anintegrated solution for the transportation of passenger and freight simultaneously, so that fewervehicles are required. The newly introduced problem concerns scheduling a set of vehicles toserve the requests such that a part of the journey can be carried out on a scheduled passengertransportation service. We propose an arc-based mixed integer programming formulation forthe integrated transportation system. Computational results on a set of instances provide aclear understanding on the benefits of integrating passenger and freight transportation in thecurrent networks, considering multi-modality of traditional passenger-oriented transportationmodes, such as taxi, bus, train or tram.
Keywords: Integrated passenger and parcel transport networks, routing & scheduling,multi-modal transportation, pickup and delivery problems.
1. Introduction
A successful integration of passenger and freight transportation creates a seamless move-ment for the people and parcels. This integration achieves socially desirable transport optionseconomically viable in urban areas as it reduces congestion and air pollution. Actual integrationis being already observed in long-haul freight transportation: passenger aircrafts and ferries,such as Norwegian Hurtigruten carry freight and people at the same time (Levin et al., 2012;Hurtigruten, 2013). In short-haul transportation, however, people and freight rarely share trans-portation modes although they largely share the same infrastructure, indicating the potentialefficiency gains for an integrated approach (Lindholm and Behrends, 2012). To our knowledge,an integrated transport solution to short-haul transportation has not been sufficiently takeninto consideration in the literature.
In this paper, we propose novel conceptual and mathematical models for the integratedtransport solution of passenger and freight transportation networks. Note that this integrated
Email address: [email protected], [email protected], [email protected] (Veaceslav Ghilas*, EmrahDemir and Tom Van Woensel)
* Corresponding author, Tel. +31 40 247 4984

solution has various potentials for regions with shrinking population sizes as well. Usage ofpublic transport in these areas has significantly decreased (Santos et al., 2010) and deliveryroutes to individual consumers and retailers consist of fewer stops over longer distances (Harmset al., 2010). Integrating passenger and freight transport increases the capacity utilization andgives opportunity to public transportation companies. Various stakeholders (e.g., public trans-port companies, shippers, etc.) are consulted and actively participate in this line of research,highlighting the potential benefits for real-life applications.
This paper particularly investigates the opportunity to make use of available public trans-portation as a part of the freight journey, which operates according to predetermined routesand schedules. Generally during off-peak hours, the capacity utilization of fixed scheduled line(FSL) vehicles is relatively low. Transferring freight requests to fixed scheduled lines could thenbe beneficial for the whole transportation system. Therefore, such a request can be picked upby a pickup and delivery (PD) vehicle and transported to a station-hub, which is assumed tobe located nearby. From there, the request continues its journey on a scheduled public trans-portation system. Afterwards, the same request can be picked up again by another PD vehicleto be delivered to its destination point.
A successful synchronization of PD vehicles with scheduled public transportation is directlyrelated to both coordination (timing) and consolidation (volume). The coordination is the keyfactor that makes each leg’s movement precise, well-timed, and well organized. The latter oneis also required to make a whole system more efficient. In order to minimize the number of indi-vidual packages handled at the station-hubs, bundling of parcel requests should be considered.In this sense, each station-hub can be seen as a consolidation point for packages. Specifically,we consider an extension of the pick-up and delivery problem with time windows in whichtransfers of any request to a fixed line is permitted. A part of the request’s journey can thusbe carried out on a public scheduled transportation. In addition, two types of requests areconsidered: passengers and packages. These two types of requests should be treated differentlyaccording to their specific customer requirements. For example, a total trip time of a passengerrequest is usually more crucial, whereas packages can be more flexible. In the proximity of eachstation-hub, both direct and indirect flows are considered. Direct flows represent cases wherea request uses only door-to-door transportation (by using a PD vehicle). The latter representsa situation where a request is transported by a fixed line as a part of the total trip. In thispaper, we denote this specidic transportation problem as Pickup and Delivery Problem withFixed Scheduled Lines (PDP-FSL). A schematic overview of the considered network is shownin Figure 1.
Assume a request has its pick-up and destination points close to two different station-hubs(e.g., requests in Figure 1). It would make sense to use a fixed line service that connects thesetwo transfer points, instead of using one PD vehicle. Hence, a reasonably less travel time ofPD vehicles can be expected and consequently reduction can be achieved in operating costs,the level of congestion and the amount of CO2e emissions.
The contributions of this paper are the following: (i) we introduce a mixed-integer formu-lation for the PDP-FSL, (ii) we analyze the benefits of using fixed scheduled lines in a PDenvironment by comparing and testing different coordination scenarios amongst various actors.
The remainder of the paper is structured as follows. Section 2 provides a brief review of theexisting works. Section 3 presents an illustrative example for the proposed environment. Section4 formally introduces a mixed-integer programming formulation of the PDP-FSL. Section 5presents three families of valid inequalities for the proposed model. Section 6 reports the
2

T1
2
d1
2
1
Origin of passenger x
Destination of passenger x
Origin of package x
Destination of package x
Depot
1
Station-hub x
o1
x
x
ox
dx
PDP service
Fixed line service
T2
Tx
Figure 1 An illustration of the integrated transport network
results obtained from an extensive computational experiments. Section 7 presents simulatedcoordination and cooperation scenarios. Conclusions are stated in Section 8.
2. Literature review
This section reviews pick-up and delivery problems (PDPs), dial-a-ride problems (DARPs)and ride-sharing problems. To the best of our knowledge, a limited literature exists on theproblem discussed in this paper, particularly on transfer options to fixed line services. Moreover,a research on integration of passenger and freight transportation systems is quite new. Thus, ourpaper is one of the first attempts to investigate integrated passenger and freight transportationfrom an operational level of planning perspective.
We refer to Berbeglia et al. (2007) for a survey on the solution methodologies for staticPDPs, where static planning concerns the environment with all the information assumed tobe known in advance. The authors describe three main groups of the PDPs based on originsand destinations of the requests. The first group, many-to-many, is characterized by the factthat each commodity is associated with several origins and destinations. The second group,one-to-many-to-one, is characterized by some requests that need to be transported to the depotand others originate from the depot. Finally, the last group, one-to-one, considers each requestis described by one origin and one destination point (see, for example, Qu and Bard (2012)). Ina related work of Berbeglia et al. (2010), dynamic one-to-one PDPs are reviewed. The authorsfocus on the dynamic nature of the problems, meaning that some of the information is revealedover time.
A special case of PDPs where users need to be transported from their origin to their des-tination is called a dial-a-ride problem (DARP). The transportation of elderly and disabledpeople can be seen as a main application area of the DARP. More extensive information relatedto the DARP can be found in Cordeau and Laporte (2007). The authors provide an overviewon models and solution methodologies for single as well as multiple vehicles. Parragh (2010)investigated heterogeneity in vehicles and passengers along with waiting time of passengers inthe context of DARP. Branch & Cut (B & C) and variable neighborhood search algorithms are
3

proposed to solve the DARP. Computational results show that a reasonable reduction in totalwaiting times are possible without increasing the total operating costs by more than 6 %.
One of the PDP extensions considers transfer opportunity between PD vehicles at station-hubs (PDP-T). Hence, a request can be picked up by one vehicle and delivered by another one.Shang and Cuff (1996) is one of the earliest studies on PDP with transfers in health sector, witha special focus on patients’ records transportation. The authors propose an insertion heuristicalgorithm which lead to an improvement of up to 37%, compared to the manual plans. Corteset al. (2010) proposed an exact decomposition method, namely B & C for solving PDP-T.Their proposed algorithm proved savings of up to 90% in terms of CPU time, compared totraditional Branch & Bound (B & B). In another work, Masson et al. (2012) introduced anadaptive large neighborhood search (ALNS) to solve the PDP-T. Their results proved savingsof up to 9% in terms of travel time by using intermediate transfers. In addition, Masson et al.(2014) proposed an ALNS for the dial-a-ride problem with transfers (DARPT), with transfer-node-related neighborhoods. They argued that using transfers between vehicles may lead tosignificant savings in terms of operating costs, specifically up to 8%.
Public transportation vehicles operate strictly according to fixed routes and timetables. Anintegration of PDP with such transportation systems has been studied to some extent. One ofthe first attempts to integrate fixed line services with DARP was done by Liaw et al. (1996).The authors formulate the problem where transshipments to public scheduled transportationare allowed for passengers and wheel-chaired persons and proposed two types of heuristics:online and offline. Their computational results show that improvements of up to 9% in terms ofnumber of serviced requests can be obtained using static planning and up to 7% with the helpof online decision support, compared to manual plans. Hall et al. (2009) introduced a mixed-integer program to solve an integrated dial-a-ride problem (IDARP). The authors considertransfers to fixed lines without modeling the schedule of the public transportation. Trentiniet al. (2012) investigated a two-echelon VRP with transshipments in the context of passengerand freight integrated system. The authors propose to use public transportation to ship thegoods from a central distribution center to predefined stations (transshipment points). Fromthere, a number of tricycles are used to deliver products to their final destinations. The authorspropose ALNS along with MIP formulation for the solution. Based on their results, proposedsystem proved the use of tricycles instead of trucks to serve the customers, hence be moreenvironmentally friendly.
Ride-sharing (pooling) is another concept used in passenger transportation to improve trans-port’s efficiency (Cepolina and Farina, 2012). Deakin et al. (2010) investigated a case of Berke-ley, California in ride-sharing under different circumstances. The authors conducted a statis-tical analysis on the data obtained from surveys. Their results suggest that ride-sharing is anattractive option for people living in Berkeley. In a work of Agatz et al. (2012), the authorsinvestigated the dynamic aspects of the ride-sharing such that a part of information is known inadvance. They showed the challenges in developing decision support systems for such environ-ments, as well as the potential societal and environmental benefits. Li et al. (2013) proposed amodel which considers integrated package and passenger transportation in the context of DARP.The computational results show that customer satisfaction and number of served parcels are ina trade-off. According to their results, a taxi-sharing option proved to be promising in termsof cost benefits for urban areas.
Tretinni and Mahlene (2010) studied an overview of solutions for combining freight andpassenger transportation used in practice. The authors divide solutions in three categories:
4

shared road capacities (multi-use lanes, night deliveries, etc.), shared public transport services(buses, subway, etc.) and finally shared consolidation facilities (delivery bays, lockers, etc.).
Table 1 provides an overview of the related literature. Note that all papers consider timewindows.
Table 1Overview of related literature
Research Multi- Hetero- Transfers Transfers to More Dyna- Solutiondepots geneous among fixed lines types mics3 approach
fleet vehicles No sched.4 Sched.5 req.6
Shang and Cuff (1996) - - X - - - - HeuristicsCortes et al. (2010) X X X - - - - B&CMasson et al. (2012) - - X - - - - ALNSMasson et al. (2014) X - X - - - - ALNS
Liaw et al. (1996) - - - - X X X HeuristicsHall et al. (2009) - - - X - - - B&B
Trentini et al. (2012) - - - - X - - ALNSLi et al. (2013) X - - - - X - B&B
This paper X X - - X X - B&B
3. dynamic aspects of the problem considered, 4. no schedule of the fixed lines is considered, 5. schedule of the fixed lines is considered, 6. differenttypes of requests considered, “X” the aspect is considered, “-” the aspect is not considered.
3. An illustrative example
Consider a 6-node network (see Figure 2) with a length of each arc shown (in kilometers).We assume two depots (g1 and g2) are operated with one PD vehicle each. Moreover, weconsider one request with its origin o and destination d. Time windows at every node areneglected in this example, along with a schedule of the fixed line (T1 – T2). Thus, we assumea request is transported by fixed line services as soon as it arrives to a station-hub (T1 or T2).In this example, our objective is to minimize the total traveled distance by all PD vehicles.
o
g2
g1
50
40
3030 30
40
10
10
10
10
o
d
T1 T2
depot x (x = 1, 2)
origin
destination
station-hub x (x = 1, 2)
gx
d
Tx
Figure 2 A sample 6-node instance
In a standard PDP, there are two optimal routes shown in the first row of the Table 2. Anoptimal solution using PDP-FSL would be the one shown in row PDP-FSL. Basically, bothPD vehicles are used such that one picks up the request and transfers it to a fixed line andthe second PD vehicle picks the request from the end of the fixed line and delivers it to itsdestination. The request flows as follows (o, T1, T2, d), such that first part of the journey (o,T1) is carried by a PD vehicle, then fixed line between T1 and T2, and finally another PD vehiclecompletes the route ending at d.
Table 2 shows that using fixed lines yields an outcome of up to 16.6% savings in terms oftotal traveled distance (100 km), compared to the original PDP (120 km). In addition, savings
5

Table 2Solutions to PDP and PDP-FSL
Problem Route Distance CO2ekm kg
PDP [g1 − o− d− g1] or 120 28.8[g2 − o− d− g2]
PDP-FSL [g1 − o− T1 − g1] and 100 26.0[g2 − T2 − d− g2]
of 9.89% with regards to CO2e emissions are achieved, where PD vehicles are considered to betaxis. Used CO2e factors are obtained from Milieubarometer (2011).
Note that in the aforementioned example, PDP-FSL solution leads to more used vehiclesthan as in PDP solution. This is explained by fact that only one request is considered, wherespecifically no integration takes place. For cases with more than one request (of both types),the number of used PD vehicles in PDP solution can be used as an upper bound for the numberof used PD vehicles in the PDP-FSL.
4. Mathematical model for the PDP-FSL
In this section, we introduce a mixed-integer programming formulation for the PDP-FSL.In this environment, all information (demands, travel time, etc.) is assumed to be known inadvance. Thus, an initial plan for the whole planning horizon (e.g., one day) is generated.There are two types of requests, namely passenger and package requests. A solution to ourmodel is a routing plan for the PD vehicles, such that each request is served. Additionally, atime schedule for the PD vehicles and requests to be served is produced. The objective functionis the total operating costs. These include: (i) operating costs of the PD vehicles, and (ii) thenumber of bundles of package requests carried out by fixed line services. First, we describe useddefinitions and assumptions and afterwards we introduce the PDP-FSL model.
4.1. Definitions and assumptions
Request. A request r has an origin, or, and a destination, dr. Each request is associatedwith two desired time windows: one for the origin ([lor , uor ]), and one for the delivery point([ldr , udr ]). A set of all requests is given by P , such that request (r), has destination node(r + n), where n is the number of requests. Moreover, two types of requests are considered:passengers and packages, such that P is composed of P1 - a subset of passenger requests andP2 - a subset of package requests (P1 ∪ P2 ≡ P and P1 ∩ P2 ≡ ∅). Furthermore, demandquantity (hr) is known for each request.
Vehicle. A set of vehicles is given by V . In addition, each vehicle v has the information ofpassenger carrying capacity (e1
v), parcel capacity (e2v) and its origin (gv).
Travel and service time. Travel and service times are known before-hand and remain un-changed during a planning horizon. The travel time between nodes i and j is denoted by cijand service time at node i is represented as si.
Fixed line. A set of all physical fixed lines is given as E , which is defined by the arc betweenstart and end of the line (i, j). In addition, each fixed line has a set of departure times Kijfrom i (the start of fixed line), such that departure is given as pwij, ∀ w ∈ Kij, (i, j) ∈ E . Notethat each fixed line may have different frequencies than other lines, thus a size of the Kij maydiffer. Furthermore, it is assumed that FSL vehicles are designed to carry a limited amount ofpackages, thus implying a finite carrying capacity kij, ∀ (i, j) ∈ E .
6
Note that each station-hub is considered as a coordination and consolidation point forpackages (e.g., DHL-Packstation (2013)). In other words, a storage space for packages thatneed to be shipped on a fixed line is available. Packages can be stored until their departuretime at these stations. In addition, some passengers transferred to/from a fixed line may waita reasonable time at a station-hub.
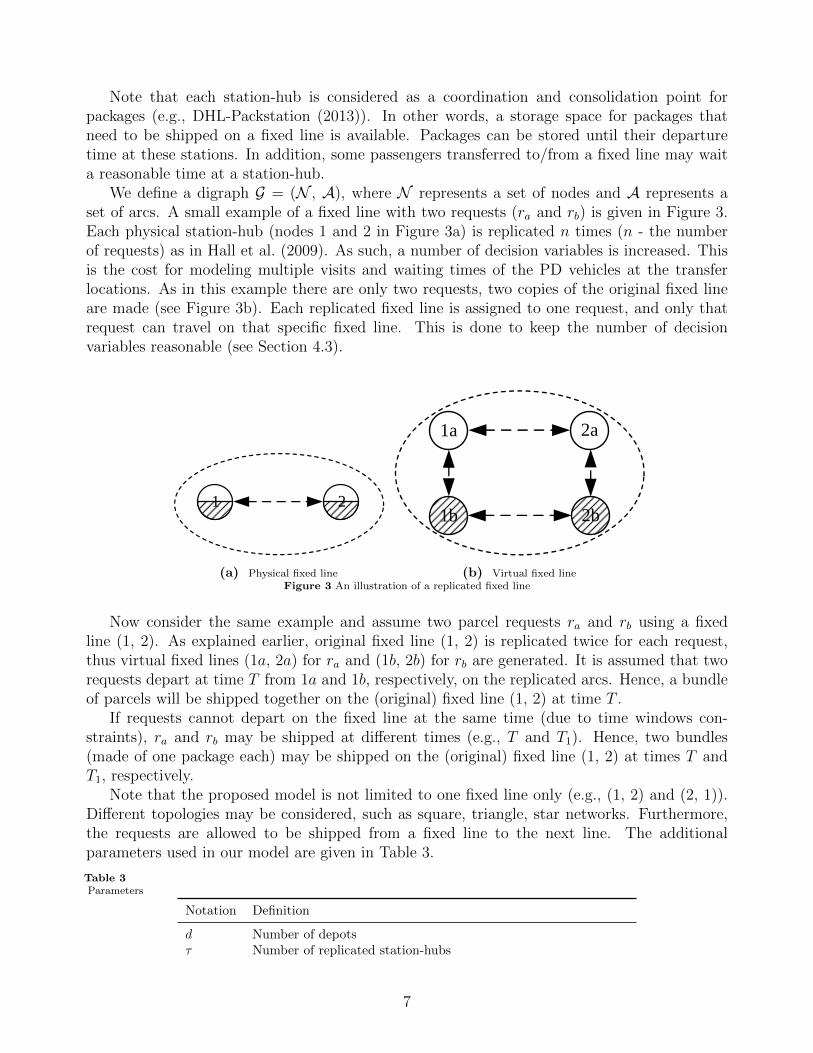
We define a digraph G = (N , A), where N represents a set of nodes and A represents aset of arcs. A small example of a fixed line with two requests (ra and rb) is given in Figure 3.Each physical station-hub (nodes 1 and 2 in Figure 3a) is replicated n times (n - the numberof requests) as in Hall et al. (2009). As such, a number of decision variables is increased. Thisis the cost for modeling multiple visits and waiting times of the PD vehicles at the transferlocations. As in this example there are only two requests, two copies of the original fixed lineare made (see Figure 3b). Each replicated fixed line is assigned to one request, and only thatrequest can travel on that specific fixed line. This is done to keep the number of decisionvariables reasonable (see Section 4.3).
1 2
(a) Physical fixed line
1a
1b
2a
2b
(b) Virtual fixed lineFigure 3 An illustration of a replicated fixed line
Now consider the same example and assume two parcel requests ra and rb using a fixedline (1, 2). As explained earlier, original fixed line (1, 2) is replicated twice for each request,thus virtual fixed lines (1a, 2a) for ra and (1b, 2b) for rb are generated. It is assumed that tworequests depart at time T from 1a and 1b, respectively, on the replicated arcs. Hence, a bundleof parcels will be shipped together on the (original) fixed line (1, 2) at time T .
If requests cannot depart on the fixed line at the same time (due to time windows con-straints), ra and rb may be shipped at different times (e.g., T and T1). Hence, two bundles(made of one package each) may be shipped on the (original) fixed line (1, 2) at times T andT1, respectively.
Note that the proposed model is not limited to one fixed line only (e.g., (1, 2) and (2, 1)).Different topologies may be considered, such as square, triangle, star networks. Furthermore,the requests are allowed to be shipped from a fixed line to the next line. The additionalparameters used in our model are given in Table 3.
Table 3Parameters
Notation Definition
d Number of depotsτ Number of replicated station-hubs
7

fri
1 if node i is destination node of request r,0 if node i is intermediate node,−1 if node i is the origin of r.
θr Maximum ride time of the passenger rφ Weight in the objective function of PDP routingη Weight in the objective function of the number of parcel bundles
sent on fixed lines
Using the aforementioned parameters, sets can be represented as in Table 4.
Table 4Sets
Notation Definition
P Set of pick-up nodes, P ≡ [d+ 1, ..., d+ n]D Set of drop-off nodes, D ≡ [d+ n+ 1, ..., d+ 2n]Q Set of depots, Q ≡ [1, ..., d]T Set of transfer nodes (station-hubs), T ≡ [d+ 2n+ 1, · · · , d+ 2n+ nτ ]
(see nodes 1a, 1b, 2a and 2b in Figure 3b)N Set of nodes in the graph G; P ∪ D ∪ Q ∪ T ≡ NOt Set of replicated transfer nodes associated with transfer node t
(e.g., in Figure 3b, O2a = {2b}, O1a = {1b}, etc.)R1 Set of nodes which represents requests (P ∪ D)R2 Set of nodes which represents requests and depots (P ∪ D ∪ Q)R3 Set of nodes which represents requests and station-hubs (P ∪ D ∪ T )A1 Set of arcs (i, j) in G, ∀ i, j in R1
A2 Set of arcs (i, j) in G, ∀ i in R1 and ∀ j in TA3 Set of arcs (i, j) in G, ∀ i in T and ∀ j in R1
A4 Set of arcs (i, j) in G, ∀ i in T and ∀ j in Oi
A5 ≡ A1 ∪ A2 ∪ A3 ∪ A4
A Set of arcs in G defined by arc (i, j), ∀ i, j ∈ N ,(note that A \ A5 ≡ F ∪i∈Q,j∈R3(i, j)∪i∈R3,j∈Q(i, j))
F Set of replicated fixed lines which is defined as (i, j), with associated Lij
Lij Set of departure times from replicated station-hub ion fixed line (i, j) ∈ F
Fr Set of replicated fixed lines associated with a request r(e.g., in Figure 3 Fa = {(1a, 2a), (1b, 2b)}, etc.)
F t Set of replicated fixed lines connected to a station-hub t(e.g., in Figure 3, F1a = {(1a, 2a), (2a, 1a)}, etc.)
F ij Set of replicated fixed lines associated with a physical fixed line (i, j) ∈ E(e.g., in Figure 3, F1,2 = {(1a, 2a), (1b, 2b)}, F2,1 = {(2a, 1a), (2b, 1b)}
The decision variables used to handle routing and scheduling of the PD vehicles, along withthe flow and the timing of the requests are given in Table 5.
Table 5Decision variables
Notation Definition
xvij A binary variable equal to 1 if arc (i, j) is used by PD vehicle v,0 otherwise, ∀ (i, j) ∈ A, v ∈ V
αv A continuous variable which shows a time at whichvehicle v returns to its depot, ∀ v ∈ V
βi A continuous variable which shows a departure timeof a vehicle from node i, ∀ i ∈ N
yrij A binary variable equal to 1 if arc (i, j) is used by request r,
8

0 otherwise, ∀ i, j ∈ R3, r ∈ Pγri A continuous variable which shows a time request r
departs from node i, ∀ i ∈ R3, r ∈ Pqrwij A binary variable equal to 1 if replicated fixed line (i, j) is used by
request r and departs from i at time pwij , 0 otherwise,∀ r ∈ P, (i, j) ∈ Fr, w ∈ Lij
zwij A binary variable equal to 1 if original fixed line (i, j) is used by at leastone freight request at time pwij , 0 otherwise, ∀ (i, j) ∈ E , w ∈ Kij
4.2. Mathematical formulation
The PDP-FSL can be formalized as the following mixed-integer formulation:
min φ∑
(i,j)∈A
∑v∈V
cijxvij + η
∑(i,j)∈E
∑w∈Kij
zwij (1)
Term (1) minimizes the total traveled time of the PD vehicles and the number of bundlesof parcel requests sent on the fixed lines.
subject to
Routing and flow constraints∑i∈N
∑v∈V
xvij = 1 ∀j ∈ R1 (2)∑i∈R3
xvgv ,i ≤ 1 ∀v ∈ V (3)∑i∈N
∑v∈V
xvit ≤ 1 ∀t ∈ T (4)∑j∈N
xvij −∑j∈N
xvji = 0 ∀i ∈ N , v ∈ V (5)∑j∈R3
yrij −∑j∈R3
yrji = f ri ∀r ∈ P , i ∈ R3 (6)
∑i∈N
∑v∈V
xvit ≤∑r∈P
∑(i,j)∈Ft
yrij ∀t ∈ T (7)
∑r∈P1
hryrij ≤
∑v∈V
e1vx
vij ∀(i, j) ∈ A5 (8)∑
r∈P2
hryrij ≤
∑v∈V
e2vx
vij ∀(i, j) ∈ A5 (9)
In the first block of constraints, constraints (2) assure that all nodes related to the requests(pick-up and drop-off nodes) are visited exactly once. Constraints (3) make sure that eachvehicle leaves its depot at most once and (4) assure that each transfer node is visited only once.Flow conservation for PD vehicles is considered in constraints (5). Constraints (6) assure flowconservation for the paths of each request. Constraints (7) assure that if a request uses a fixedline, a PD vehicle should pick it up/drop it off at a station-hub related to that specific fixed
9
line. Constraints (8) and (9) force the capacity of each PD vehicle is not exceeded for bothtypes of requests.
The scheduling constraints
γrj ≥ γri + cij + sj −M ij1 (1− yrij) ∀r ∈ P , i, j ∈ R3 (10)
βj ≥ βi + cij + sj −M ij1 (1−
∑v∈V
xvij) ∀i ∈ N , j ∈ R3 (11)
αv ≥ βi + cij + sj −M ij1 (1− xvij) ∀i ∈ R3, j ∈ Q, v ∈ V (12)
βi + ci,i+n + si+n ≤ βi+n ∀i ∈ P (13)
li ≤ βi − si ≤ ui ∀i ∈ R1 (14)
lgv ≤ αv − sgv ≤ ugv ∀v ∈ V (15)∑w∈Lij
qrwij = yrij ∀r ∈ P , (i, j) ∈ F r (16)
γri − pwij ≤M i2(2− qrwij − yrij) ∀r ∈ P , (i, j) ∈ F r, w ∈ Lij (17)
γri − pwij ≥ −M i2(2− qrwij − yrij) ∀r ∈ P , (i, j) ∈ F r, w ∈ Lij (18)∑
r∈P2
∑(a,b)∈Fij
qrwab ≤ kijzwij ∀(i, j) ∈ E , w ∈ Kij (19)
γrr+n − γrr ≤ θr ∀r ∈ P1 (20)
Timing for each request is considered in constraints (10). Similarly for PD vehicles, schedul-ing is updated in constraints (11) and (12). Constraints (13) assure that pick-up node is visitedbefore drop-off nodes of each request and (14), (15) force the time windows to be respected.Constraints (16) – (18) assure that if a request uses a fixed line, it departs at a scheduleddeparture time. Constraints (19) update the variable which states whether a parcel request issent by fixed lines or not and make sure that the package carrying capacity on the fixed line isnot exceeded. Constraints (20) assure that maximum ride constraint for passenger requests isnot violated. θr is assumed to be dependent on the direct trip time for each passenger request(sr + cr,r+n + sr+n) multiplied by a factor σ ≥ 1. M ij
1 can be substituted by (ui + si + sj +cij) and (ui + si) can be used instead of M i
2.
The synchronization constraints
γri − βi ≤M i2(1−
∑j∈R1
yrij) ∀r ∈ P , i ∈ T (21)
γri − βi ≥ −M i2(1−
∑j∈R1
yrij) ∀r ∈ P , i ∈ T (22)
γri − βi ≤M i2(1−
∑j∈R3
yrij) ∀r ∈ P , i ∈ R1 (23)
γri − βi ≥ −M i2(1−
∑j∈R3
yrij) ∀r ∈ P , i ∈ R1 (24)
10

γrr+n − βr+n ≤M r+n2 (1−
∑i∈R3
yri,r+n) ∀r ∈ P (25)
γrr+n − βr+n ≥ −M r+n2 (1−
∑i∈R3
yri,r+n) ∀r ∈ P (26)
γrt − βt ≤M t2(1− yrtj) ∀r ∈ P , t ∈ T , j ∈ Ot (27)
γrt − βt ≥ −M t2(1− yrtj) ∀r ∈ P , t ∈ T , j ∈ Ot (28)
Set of constraints (21) – (28) assure the synchronization between requests’ and vehicles’scheduling. Constraints (21) and (22) force departure times of requests and vehicles from atransfer node to be equal if there is a request flow from that node towards a pick-up/deliverynode. Constraints (23) and (24) force departure times of requests and vehicles from a pick-up/drop-off node to be equal if there is a request flow from that node. Constraints (25) and(26) force arrival time at the destination node of a request be equal to departure time of avehicle from that node. Constraints (27) and (28) assure time synchronization between vehiclesand requests within each transfer node, with regards to flow between replications of the originalstation-hub.
Decision variable domains
xvij ∈ {0, 1} ∀(i, j) ∈ A, v ∈ V (29)
yrij ∈ {0, 1} ∀i, j ∈ R3, r ∈ P (30)
αv ∈ R+ ∀v ∈ V (31)
γri ∈ R+ ∀i ∈ R3, r ∈ P (32)
βi ∈ R+ ∀i ∈ N (33)
qrwij ∈ {0, 1} ∀r ∈ P , (i, j) ∈ F r, w ∈ Lij (34)
zwij ∈ {0, 1} ∀(i, j) ∈ E , w ∈ Kij (35)
Since PDP-FSL is an extension of the PDP with time windows (PDP-TW), it is clearly anNP-hard problem. Considering the explosion in complexity along with instance size, a certainpreprocessing needs to be implemented in order to reduce graph size. Thus, next section willintroduce several elimination rules.
4.3. Preliminaries
Preprocessing was implemented in order to reduce the number of decision variables. Hence,some of the infeasible arcs in graph G are removed.
• A vehicle can leave from and return to its own depot.
• No vehicle can travel from the destination to the origin of same request.
• No PD vehicle can travel between node i and j, if (i, j) ∈ F .
• No request r can travel between origin and destination of a fixed line, other than arc (i,j) ∈ F r.
• No request r can travel from the destination to the origin of any request.
11

• No request is allowed to travel to/from any depot.
• No flow is allowed between node i and j, if li + si + cij > uj.
• No request can travel from its dropoff node to any other node.
• No request can travel to its pickup node from any other node.
Cordeau (2006) proposed elimination rules for DARP with time windows and some of themcan be used for PDP-FSL to reduce the number of binary variables.
• No flow can be performed on arcs (i, j) and (j, i + n) with i ∈ P , j ∈ R3 if si + cij +sj + cj,i+n + si+n > θi;
• No flow is possible on (i, j + n) if path {j, i, n+ i, n+ j} is infeasible;
• Arc (i+ n, j) is infeasible if path {i, i+ n, j, n+ j} is infeasible;
In addition, some elimination rules related to transfer nodes can be applied.
• No flow can be performed to a transfer node t, respectively from transfer node t1 forpassenger request i if si + cit + st + ct,t1 + st1 + ct1,i+n + si+n > θi, ∀ i ∈ P1, (t, t1) ∈F i;
• An arc (t, t1) is infeasible if si + cit + st + ct,t1 + st1 + ct1,i+n > ui+n, ∀ i ∈ P2, (t, t1)∈ F i;
A number of departure times on the fixed lines for each request can be reduced by consideringtime windows. Thus, no request r can depart at a time earlier than (lr + sr + crt + st) on thefixed line (t, t1), ∀ r ∈ P , (t, t1) ∈ F r. Similarly, no request r can depart at a time later than(ur+n – sr+n – ct,r+n – st – ct1,t – st1) on a fixed line (t1, t), ∀ r ∈ P , (t1, t) ∈ F r;
5. Model tightening
As the proposed model grows very rapidly in size with the number of requests, number offixed lines and departure times on each line, some more additional constraints (valid inequalities)may be added to improve computation time. This section introduces three cuts to improvemodel’s computational efficiency.
5.1. Vehicle-request flow constraints
We state Proposition 5.1 as follows:
Proposition 5.1. The following inequality is valid for the PDP-FSL:
∑v∈V
xvij ≥ yrij ∀(i, j) ∈ A5, r ∈ P (36)
12

Proof. Let (i, j) ∈ A5. In addition, let xvij, ∀ v ∈ V , (i, j) ∈ A and yrij, ∀ r ∈ P , i, j ∈ R3
be binary variables. We consider two cases: (i) PD vehicle does not traverse (i, j) ∈ A5 (i.e.∑v∈V x
vij = 0) and (ii) PD vehicle travels on (i, j) ∈ A5 (i.e.
∑v∈V x
vij = 1).
In case (i), due to capacity constriants (8) and (9), no request can travel on (i, j) (i.e.yrij = 0, ∀ r ∈ P). In case (ii), any request may travel on (i, j) as long as constriants (8) and(9) are satisfied. Therefore, yrij ∈ {0, 1}, ∀ r ∈ P ensures that
∑v∈V x
vij ≥ yrij, ∀ r ∈ P . �
Example. Let there be a flow between i and j traversed by a vehicle v of capacity two. Inaddition, two requests of the same type, r1 and r2, each having demand one travel on the samearc. Assume an LP solution with following values: xvij = 0.2, yr1ij = 0.3 and yr2ij = 0.1. Hence,constraints (8) and (9) are satisfied (0.3 + 0.1 ≤ 2 × 0.2). By using constraints (36), xvij isrestricted to be at least 0.3 and yr1ij = 0.3 and yr2ij = 0.1, respectively. The resulting inequalityis valid (0.3 + 0.1 ≤ 2 × 0.3) and is illustrated in Figure 4.
i jxv
ij = 0.2
yr2ij = 0.1
yr1ij = 0.3
(a) Without cut
i jxv
ij = 0.3
yr2ij = 0.1
yr1ij = 0.3
(b) With cutFigure 4 An illustration on the constraints (36)
5.2. Vehicle pickup strengthening
A second proposition is given in Proposition 5.2.
Proposition 5.2. The following inequalities are valid for the PDP-FSL:
∑i∈N
xvir −∑i∈N
xvr+n,i ≤∑
(i,j)∈Fr
yrij ∀r ∈ P , v ∈ V (37)
∑i∈N
xvir −∑i∈N
xvr+n,i ≥ −∑
(i,j)∈Fr
yrij ∀r ∈ P , v ∈ V (38)
Proof. Let r ∈ P and v ∈ V . In addition, let xvij, ∀ v ∈ V , (i, j) ∈ A and yrij, ∀ r ∈ P , i, j∈ R3 be binary variables. We consider three cases: (i) r is served by PD vehicle v; (ii) r isserved by two different PD vehicles, v and e.g., v1 ∈ V ; (iii) r is served by other PD vehicle(s)v1 and/or v2 ∈ V ;
In case (i), due to constraints (2), pickup (∑
i∈N xvir = 1) and dropoff nodes (
∑i∈N x
vr+n,i =
1) of r are visited by v, hence the left-hand side (LHS) of the constraints (37) and (38) take avalue of zero. Furthermore,
∑(i,j)∈Fr yrij ≥ 0 ensures that even request r is served by v, it may
still use a fixed line as part of its journey.In case (ii), the pickup or the dropoff node of r is visited by v. Hence, LHS of constraints
(37) and (38) may take two values: -1 and 1. In order to satisfy constraints (7),∑
(i,j)∈Fr yrij >0, which implies that r must use a fixed line as part of its journey.
In case (iii), PD vehicle v does not visit pickup or dropoff nodes of r, thus LHS gets zero.Hence,
∑(i,j)∈Fr yrij ≥ 0 guarantees that r can use a fixed line, as it may be served by one or
two other PD vehicles. The result follows from these cases. �
13
5.3. Depot strengthening
A depot related valid inequality is given in Proposition 5.3.
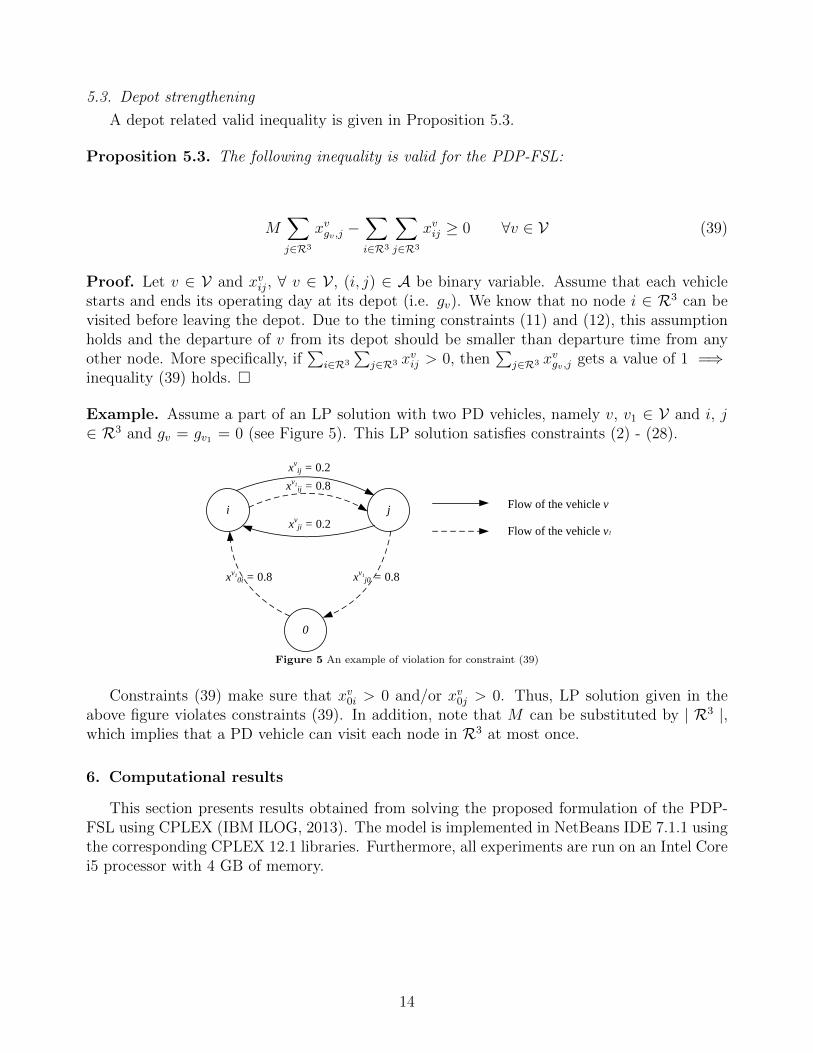
Proposition 5.3. The following inequality is valid for the PDP-FSL:
M∑j∈R3
xvgv ,j −∑i∈R3
∑j∈R3
xvij ≥ 0 ∀v ∈ V (39)
Proof. Let v ∈ V and xvij, ∀ v ∈ V , (i, j) ∈ A be binary variable. Assume that each vehiclestarts and ends its operating day at its depot (i.e. gv). We know that no node i ∈ R3 can bevisited before leaving the depot. Due to the timing constraints (11) and (12), this assumptionholds and the departure of v from its depot should be smaller than departure time from anyother node. More specifically, if
∑i∈R3
∑j∈R3 xvij > 0, then
∑j∈R3 xvgv ,j gets a value of 1 =⇒
inequality (39) holds. �
Example. Assume a part of an LP solution with two PD vehicles, namely v, v1 ∈ V and i, j∈ R3 and gv = gv1 = 0 (see Figure 5). This LP solution satisfies constraints (2) - (28).
i j
0
xvij = 0.2
xvji = 0.2
xv1ij = 0.8
xv10i = 0.8 xv1
j0 = 0.8
Flow of the vehicle v
Flow of the vehicle v1
Figure 5 An example of violation for constraint (39)
Constraints (39) make sure that xv0i > 0 and/or xv0j > 0. Thus, LP solution given in theabove figure violates constraints (39). In addition, note that M can be substituted by | R3 |,which implies that a PD vehicle can visit each node in R3 at most once.
6. Computational results
This section presents results obtained from solving the proposed formulation of the PDP-FSL using CPLEX (IBM ILOG, 2013). The model is implemented in NetBeans IDE 7.1.1 usingthe corresponding CPLEX 12.1 libraries. Furthermore, all experiments are run on an Intel Corei5 processor with 4 GB of memory.
14
6.1. Instance description
Three instance sets are generated based on realistic asymmetric driving times between lo-cations in The Netherlands (LLC, 2013). The planning horizon covers 10 working hours (600minutes) and a minute is set to be one unit of time. Each set contains six instances with fiveto ten requests and each request has a demand of one unit. Each set represents a scenario andstarts with a 5-request instance. We iteratively add one more request at a time, until we get 10requests. Furthermore, two types of requests have different setting in terms of time windows atthe pickup and dropoff nodes. Table 6 illustrate the logic of time window setting for passengerrequests.
Table 6Time window setting for passenger request r
Pickup node of r Dropoff node of rlr ur lr+n ur+n
lr lr+30 lr+sr+cr,r+n+sr+n ur+σ(sr+cr,r+n+sr+n)
The time windows of the package requests are set to be relatively wider than passengerrequests’ time windows (i.e. must be picked up in the first part of the planning horizon anddelivered until the end of the day). In addition, each instance has two depots with one het-erogeneous vehicle each. A fixed line between two station-hubs is considered, (i, j) and (j, i)∈ E . A FSL vehicle departs from each station once in half an hour (30, 60, ..., 540). Laterdepartures are not taken into consideration because PD vehicle needs to be back at its depotbefore the end of the planning horizon. This leaves a reasonable time for the PD vehicle to goback to depots.
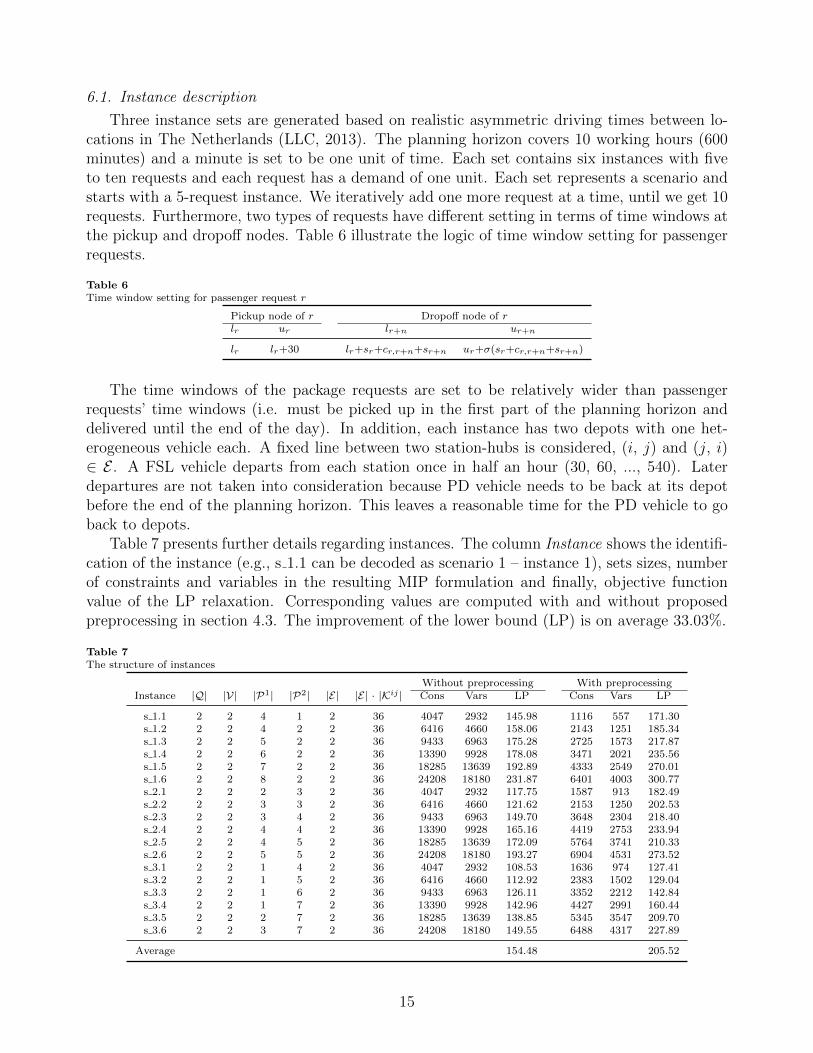
Table 7 presents further details regarding instances. The column Instance shows the identifi-cation of the instance (e.g., s 1.1 can be decoded as scenario 1 – instance 1), sets sizes, numberof constraints and variables in the resulting MIP formulation and finally, objective functionvalue of the LP relaxation. Corresponding values are computed with and without proposedpreprocessing in section 4.3. The improvement of the lower bound (LP) is on average 33.03%.
Table 7The structure of instances
Without preprocessing With preprocessingInstance |Q| |V| |P1| |P2| |E| |E| · |Kij | Cons Vars LP Cons Vars LP
s 1.1 2 2 4 1 2 36 4047 2932 145.98 1116 557 171.30s 1.2 2 2 4 2 2 36 6416 4660 158.06 2143 1251 185.34s 1.3 2 2 5 2 2 36 9433 6963 175.28 2725 1573 217.87s 1.4 2 2 6 2 2 36 13390 9928 178.08 3471 2021 235.56s 1.5 2 2 7 2 2 36 18285 13639 192.89 4333 2549 270.01s 1.6 2 2 8 2 2 36 24208 18180 231.87 6401 4003 300.77s 2.1 2 2 2 3 2 36 4047 2932 117.75 1587 913 182.49s 2.2 2 2 3 3 2 36 6416 4660 121.62 2153 1250 202.53s 2.3 2 2 3 4 2 36 9433 6963 149.70 3648 2304 218.40s 2.4 2 2 4 4 2 36 13390 9928 165.16 4419 2753 233.94s 2.5 2 2 4 5 2 36 18285 13639 172.09 5764 3741 210.33s 2.6 2 2 5 5 2 36 24208 18180 193.27 6904 4531 273.52s 3.1 2 2 1 4 2 36 4047 2932 108.53 1636 974 127.41s 3.2 2 2 1 5 2 36 6416 4660 112.92 2383 1502 129.04s 3.3 2 2 1 6 2 36 9433 6963 126.11 3352 2212 142.84s 3.4 2 2 1 7 2 36 13390 9928 142.96 4427 2991 160.44s 3.5 2 2 2 7 2 36 18285 13639 138.85 5345 3547 209.70s 3.6 2 2 3 7 2 36 24208 18180 149.55 6488 4317 227.89
Average 154.48 205.52
15
A driving minute of a PD vehicle is assumed to be 0.5 e. It seems reasonable consideringoperational costs such as fuel consumption, driver wage, insurance, tax, etc. Each bundle ofpackage requests shipped on a fixed line is set to 0.5 e. At first glance, these numbers may notbe seen as being very accurate. To shed light on this question, we have conducted on extensivestudy to verify these numbers and we believe that the numbers actually should be the same, forboth operational costs and number of bundles. Finally, σ is assumed to be 1.15, meaning thateach passenger accepts to spend 15% more travel time than its possible direct trip duration.The test instances are available at SmartLogisticLab (2013).
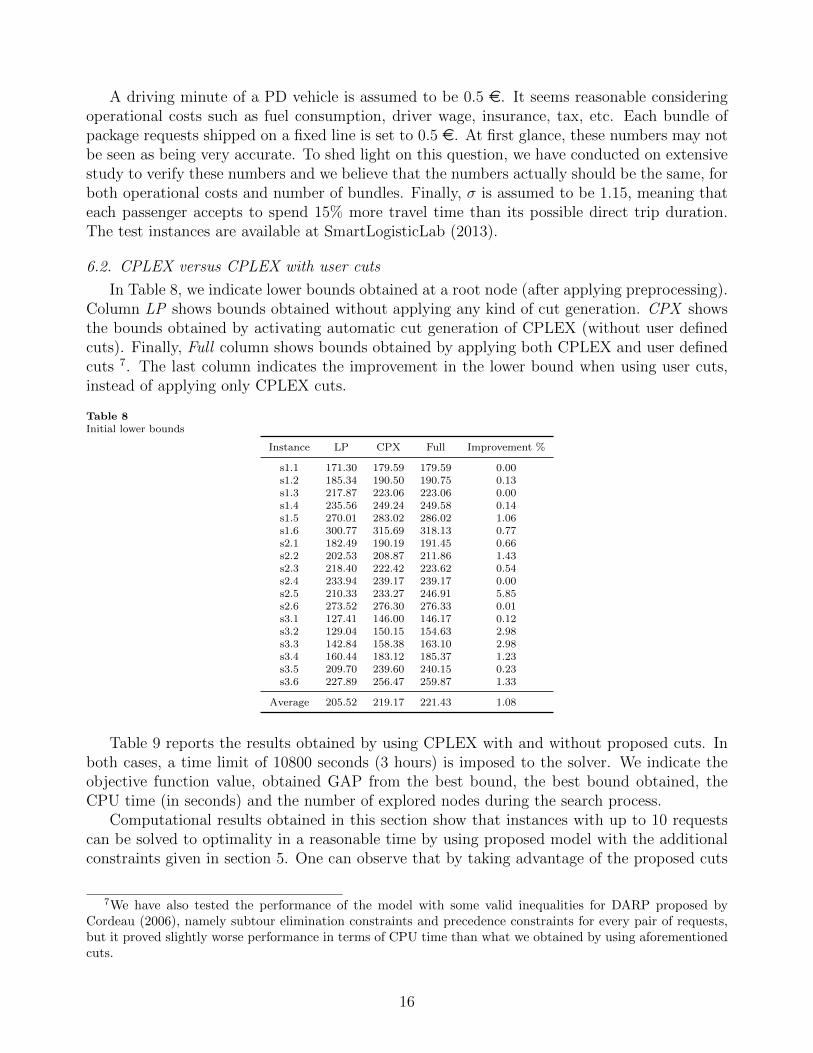
6.2. CPLEX versus CPLEX with user cuts
In Table 8, we indicate lower bounds obtained at a root node (after applying preprocessing).Column LP shows bounds obtained without applying any kind of cut generation. CPX showsthe bounds obtained by activating automatic cut generation of CPLEX (without user definedcuts). Finally, Full column shows bounds obtained by applying both CPLEX and user definedcuts 7. The last column indicates the improvement in the lower bound when using user cuts,instead of applying only CPLEX cuts.
Table 8Initial lower bounds
Instance LP CPX Full Improvement %
s1.1 171.30 179.59 179.59 0.00s1.2 185.34 190.50 190.75 0.13s1.3 217.87 223.06 223.06 0.00s1.4 235.56 249.24 249.58 0.14s1.5 270.01 283.02 286.02 1.06s1.6 300.77 315.69 318.13 0.77s2.1 182.49 190.19 191.45 0.66s2.2 202.53 208.87 211.86 1.43s2.3 218.40 222.42 223.62 0.54s2.4 233.94 239.17 239.17 0.00s2.5 210.33 233.27 246.91 5.85s2.6 273.52 276.30 276.33 0.01s3.1 127.41 146.00 146.17 0.12s3.2 129.04 150.15 154.63 2.98s3.3 142.84 158.38 163.10 2.98s3.4 160.44 183.12 185.37 1.23s3.5 209.70 239.60 240.15 0.23s3.6 227.89 256.47 259.87 1.33
Average 205.52 219.17 221.43 1.08
Table 9 reports the results obtained by using CPLEX with and without proposed cuts. Inboth cases, a time limit of 10800 seconds (3 hours) is imposed to the solver. We indicate theobjective function value, obtained GAP from the best bound, the best bound obtained, theCPU time (in seconds) and the number of explored nodes during the search process.
Computational results obtained in this section show that instances with up to 10 requestscan be solved to optimality in a reasonable time by using proposed model with the additionalconstraints given in section 5. One can observe that by taking advantage of the proposed cuts
7We have also tested the performance of the model with some valid inequalities for DARP proposed byCordeau (2006), namely subtour elimination constraints and precedence constraints for every pair of requests,but it proved slightly worse performance in terms of CPU time than what we obtained by using aforementionedcuts.
16

Table 9Comparisons between CPLEX and CPLEX with user cuts
CPLEX CPLEX with user cutsID Solution GAP Bound Nodes CPU Solution GAP Bound Nodes CPU
value % sec. value % sec.
s1.1 179.69 0.00 179.69 0 0.28 179.69 0.00 179.69 0 0.19s1.2 203.56 0.00 203.56 1707 5.14 203.56 0.00 203.55 927 2.81s1.3 236.12 0.00 236.12 621 2.20 236.12 0.00 236.12 471 1.44s1.4 299.47 0.01 299.44 34930 248.91 299.47 0.00 299.47 13670 102.79s1.5 330.99 0.01 330.95 73890 679.52 330.99 0.01 330.95 23229 277.84s1.6 - - 341.35 269773 10800.00 375.80 0.00 375.78 229467 9052.99s2.1 191.46 0.00 191.46 0 1.06 191.46 0.00 191.46 0 0.34s2.2 215.88 0.00 215.88 0 1.62 215.88 0.00 215.88 0 0.98s2.3 239.16 0.00 239.16 15278 163.74 239.16 0.00 239.16 2470 16.81s2.4 254.70 0.00 254.69 6068 76.83 254.70 0.00 254.70 4560 71.37s2.5 263.34 0.01 263.31 171137 4669.91 263.34 0.00 263.33 4655 200.00s2.6 - - 310.16 229458 10800.00 345.55 0.00 345.55 9649 1691.69s3.1 156.21 0.00 156.21 665 3.69 156.21 0.00 156.22 98 1.58s3.2 171.78 0.01 171.76 5356 59.18 171.78 0.00 171.78 212 5.66s3.3 184.77 0.01 184.75 34535 559.63 184.77 0.01 184.75 1405 24.16s3.4 205.86 0.00 205.86 86884 2350.09 205.86 0.01 205.85 2118 74.73s3.5 253.58 0.01 253.55 5852 248.75 253.58 0.01 253.56 11759 714.44s3.6 285.39 0.01 285.36 278121 7269.25 285.39 0.01 285.36 42746 3906.13
significantly improves the performance of the CPLEX. For the 16 instances solved to optimalityby both variants of the model within the time limit, on average CPU time was 1021.24 secondsfor CPLEX alone compared with 337.58 seconds for CPLEX with additional cuts. The averagenumber of explored nodes drops from 44690 to 6770. No feasible solutions were found for twoinstances by CPLEX alone whereas with user cuts, in both cases, optimal solutions were foundwithin the time limit.
6.3. Fixed lines frequency and passenger travel time tolerance experiments
We have made some experiments on the fixed lines’ frequency and passenger’s travel timetolerance (σ). We consider four cases for the frequency of the public transportation, particularlyevery 30 minutes, 15 minutes, 5 minutes and finally 60 minutes. In addition, tested passengertrip time tolerance takes the following values: 1.15, 1.5 and finally 2.
We used three sets of instances described in Section 6 with corresponding modifications(fixed lines frequency and time windows). Note that considered instances are more relaxedthan original ones. Therefore in order to limit the B&B search tree, the solutions obtained inprevious section are used as initial incumbents. Three hours time limit is imposed.
For the sake of readability of the paper we did not include the detailed results in the paper,but these are available upon request from the authors. Overall based on the results obtainedfrom solving considered instances, by having more frequent fixed line does not have any effecton total driving time whereas by having larger passenger trip time tolerance, savings of upto 25% may be reached (on average 3%, based on instances solved optimally). Therefore,longer passenger trip time tolerance makes a slightest impact to such transportation systems,considering the importance of the passenger service satisfaction.
7. Scenario comparisons
Since more stakeholders are involved in the considered transportation system, namely pas-senger door-to-door transportation, package transportation and public fixed line services, dif-
17

ferent scenarios representing the cooperation and coordination are simulated. Figures 6b - 6fillustrate the considered scenarios with the legend shown in Figure 6a.
1
2
1'
2'Package
Passenger
Origin DestinationPassenger
serviceCourier service
T TTransfer points
Fixed line
(a) Legends
1
2
1'
2'
T T’
(b) Scenario 1 (IFL)
1
2
1'
2'
T T’
(c) Scenario 2 (SFL)
1
2
1'
2'
T T’
(d) Scenario 3 (INFL)
1
2
1'
2'
T T’
(e) Scenario 4 (SNFL)
1
2
1'
2'
T T’
(f) Scenario 5 (SPFL)Figure 6 Schematic overview of the proposed scenarios
In scenario one (see Figure 6b), integrated passenger and parcel transport networks withfixed lines (IFL), cooperation between taxi, courier and public transportation companies isconsidered. For instance, a taxi may pick-up a package and either deliver it to its destination,or transfer it to a fixed line. As courier vans are not designed to carry passengers, it is assumedthat a package transportation company shares the information regarding the requests (origin,destination, time windows, demand, etc.). Therefore, the cooperation with courier companiesmeans sharing the information regarding requests. From the modeling perspective, proposedmodel considers IFL as a base scenario.
In scenario two (see Figure 6c), separated passenger and parcel transport networks with fixedlines (SFL), passenger and package transportation companies independently cooperate withpublic transport companies. Hence, a passenger can only be picked up by a taxi and it can betransferred to a fixed line. Similarly, a parcel can only be conveyed by courier vans, where useof fixed line is possible. In terms of modeling following scenarios, additional subsets of V aredefined, as follows:
V1 - set of vehicles belonging to a passenger transportation companyV2 - set of vehicles belonging to a courier company
18

The following constraints need to be added to the model in order to obtain scenario two.In words, constraints (40) and (41) make sure that no passenger request is serviced by couriervehicles and no parcel request is serviced by passenger service vehicles.
∑v∈V1
∑i∈N
∑r∈P2
(xvir + xvi,r+n) = 0 (40)∑v∈V2
∑i∈N
∑r∈P1
(xvir + xvi,r+n) = 0 (41)
In the third scenario (see Figure 6d), integrated passenger and parcel transport networkswithout fixed lines (INFL), passenger and parcel transport companies cooperate with eachother and none of these cooperate with public transport provider. Hence, neither a parcel nora passenger uses fixed lines. In terms of modeling, following constraints need to be added.Constraints (42) assure that no flow on fixed lines is allowed.
∑(i,j)∈F
∑r∈P
yrij = 0 (42)
In the fourth scenario (see Figure 6e), separated passenger and parcel transport networkswithout fixed lines (SNFL), none of the companies cooperate with each other. Therefore, e.g.,requests from the taxi company can be carried out only by a taxi, similarly a parcel can becarried out only by courier vehicles and there is no transfer opportunity to public transportationlines. To model this environment, constraints (40), (41) and (42) are used. SNFL reflects thecurrent real life situation.
In scenario five (see Figure 6f), separated passenger and parcel transport networks where onlypassengers can use fixed lines (SPFL), parcel and passenger transportation companies operateindependently and only passengers have the opportunity to use public transportation. Thisscenario is somehow similar to the reality as well, where a person uses a taxi from its origin toe.g., a train station, after traveling by train, it takes another taxi to its destination. To modelsuch a transportation system, the following constraints are used.
∑(i,j)∈F
∑r∈P2
yrij = 0 (43)
Thus, constraints (40), (41) and (43) are added to the model. We have modified three setsof instances described in Section 6.1 to test the mentioned scenarios. Hence, we added twodepots with one vehicle each to every instance, such that both belong to the courier company.The scenarios are compared based on the total travel time of the PD vehicles and the amountof CO2e. The obtained results are normalized to the scenario proposed in the present paper(IFL). The findings are shown in Table 11.
As expected, integrated networks (IFL) where all actors cooperate and share the informationregarding requests lead to most significant benefits. Compared to what happens in reality(SNFL), namely each service provider serves its own requests, proposed scenario proved 1.37times less total travel time in the system (savings of 26.93%). Compared to scenarios 2 (SFL)
19
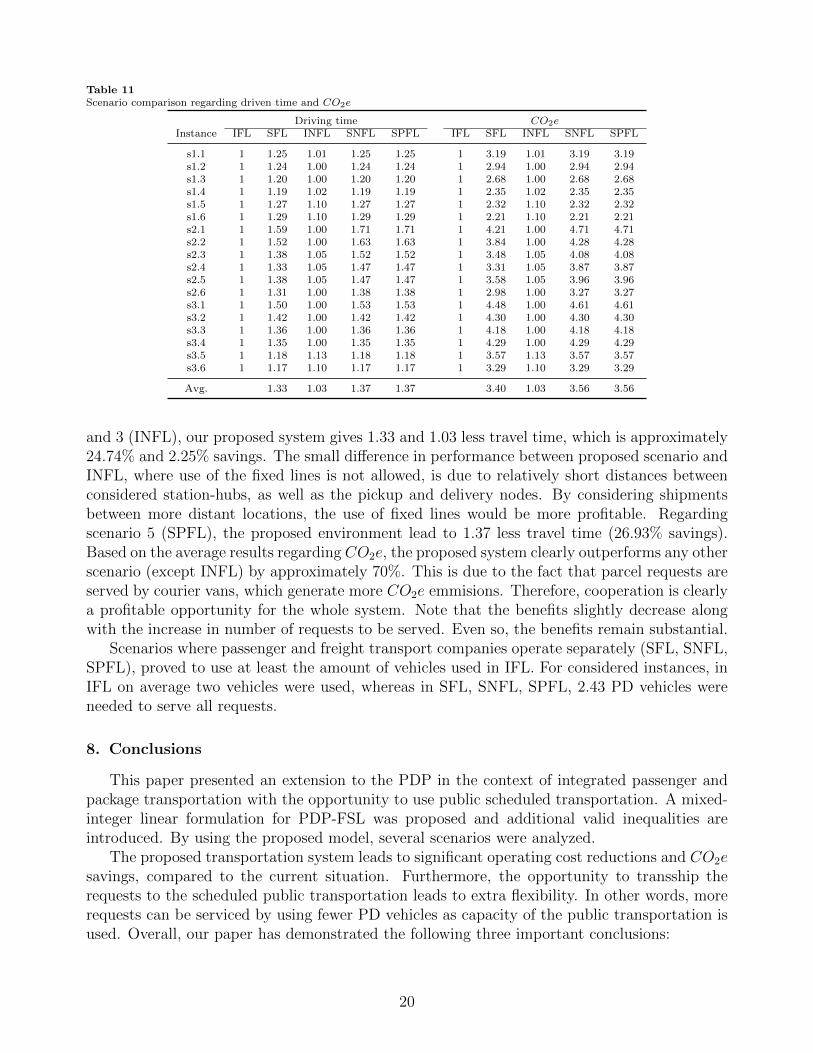
Table 11Scenario comparison regarding driven time and CO2e
Driving time CO2eInstance IFL SFL INFL SNFL SPFL IFL SFL INFL SNFL SPFL
s1.1 1 1.25 1.01 1.25 1.25 1 3.19 1.01 3.19 3.19s1.2 1 1.24 1.00 1.24 1.24 1 2.94 1.00 2.94 2.94s1.3 1 1.20 1.00 1.20 1.20 1 2.68 1.00 2.68 2.68s1.4 1 1.19 1.02 1.19 1.19 1 2.35 1.02 2.35 2.35s1.5 1 1.27 1.10 1.27 1.27 1 2.32 1.10 2.32 2.32s1.6 1 1.29 1.10 1.29 1.29 1 2.21 1.10 2.21 2.21s2.1 1 1.59 1.00 1.71 1.71 1 4.21 1.00 4.71 4.71s2.2 1 1.52 1.00 1.63 1.63 1 3.84 1.00 4.28 4.28s2.3 1 1.38 1.05 1.52 1.52 1 3.48 1.05 4.08 4.08s2.4 1 1.33 1.05 1.47 1.47 1 3.31 1.05 3.87 3.87s2.5 1 1.38 1.05 1.47 1.47 1 3.58 1.05 3.96 3.96s2.6 1 1.31 1.00 1.38 1.38 1 2.98 1.00 3.27 3.27s3.1 1 1.50 1.00 1.53 1.53 1 4.48 1.00 4.61 4.61s3.2 1 1.42 1.00 1.42 1.42 1 4.30 1.00 4.30 4.30s3.3 1 1.36 1.00 1.36 1.36 1 4.18 1.00 4.18 4.18s3.4 1 1.35 1.00 1.35 1.35 1 4.29 1.00 4.29 4.29s3.5 1 1.18 1.13 1.18 1.18 1 3.57 1.13 3.57 3.57s3.6 1 1.17 1.10 1.17 1.17 1 3.29 1.10 3.29 3.29
Avg. 1.33 1.03 1.37 1.37 3.40 1.03 3.56 3.56
and 3 (INFL), our proposed system gives 1.33 and 1.03 less travel time, which is approximately24.74% and 2.25% savings. The small difference in performance between proposed scenario andINFL, where use of the fixed lines is not allowed, is due to relatively short distances betweenconsidered station-hubs, as well as the pickup and delivery nodes. By considering shipmentsbetween more distant locations, the use of fixed lines would be more profitable. Regardingscenario 5 (SPFL), the proposed environment lead to 1.37 less travel time (26.93% savings).Based on the average results regarding CO2e, the proposed system clearly outperforms any otherscenario (except INFL) by approximately 70%. This is due to the fact that parcel requests areserved by courier vans, which generate more CO2e emmisions. Therefore, cooperation is clearlya profitable opportunity for the whole system. Note that the benefits slightly decrease alongwith the increase in number of requests to be served. Even so, the benefits remain substantial.
Scenarios where passenger and freight transport companies operate separately (SFL, SNFL,SPFL), proved to use at least the amount of vehicles used in IFL. For considered instances, inIFL on average two vehicles were used, whereas in SFL, SNFL, SPFL, 2.43 PD vehicles wereneeded to serve all requests.
8. Conclusions
This paper presented an extension to the PDP in the context of integrated passenger andpackage transportation with the opportunity to use public scheduled transportation. A mixed-integer linear formulation for PDP-FSL was proposed and additional valid inequalities areintroduced. By using the proposed model, several scenarios were analyzed.
The proposed transportation system leads to significant operating cost reductions and CO2esavings, compared to the current situation. Furthermore, the opportunity to transship therequests to the scheduled public transportation leads to extra flexibility. In other words, morerequests can be serviced by using fewer PD vehicles as capacity of the public transportation isused. Overall, our paper has demonstrated the following three important conclusions:
20

• Operational costs can be reduced by up to 27% by integrating passenger and freight flows,using fixed lines.
• CO2e emissions could be decreased by up to 70% by reducing the number of used vehiclesand using available fixed lines.
• An idea of integrated transport systems is also promising to reduce dense traffic in urbanareas.
Although the proposed transport system leads to important benefits, customer satisfactionlevel may be negatively affected due to slightly longer trip times. Thus, certain incentives(e.g., lower fares, etc.) for the passengers are needed to compensate this drawback in order tomake such services more attractive. This integration is left out for future research. Anotherpotential further research could be developing heuristic, exact algorithms that generate goodquality solutions for reasonable-sized instances. In addition, as the considered transportationenvironment is subject to changes (e.g. traffic jams, new requests, etc.), algorithms for solvingthe dynamic version of the proposed problem could be investigated as well.
Acknowledgements
The authors gratefully acknowledge funds provided by Dinalog, the Dutch Institute forAdvanced Logistics, under the grant titled “Cargo Hitching”, # 2011 4 086R.
References
Agatz, N., Erera, A., Savelsbergh, M., Wang, X., 2012. Optimization for dynamic ride-sharing:A review. European Journal of Operational Research, 295–303.
Berbeglia, G., Cordeau, J.-F., Gribkovskaia, I., Laporte, G., 7 2007. Static pickup and deliveryproblems: a classification scheme and survey. TOP: An Official Journal of the Spanish Societyof Statistics and Operations Research 15 (1), 1–31.
Berbeglia, G., Cordeau, J.-F., Laporte, G., 2010. Dynamic pickup and delivery problems. Eu-ropean Journal of Operational Research 202 (1), 8–15.
Cepolina, E. M., Farina, A., 2012. A new shared vehicle system for urban areas. TransportationResearch Part C: Emerging Technologies, 230–243.
Cordeau, J.-F., 2006. A branch-and-cut algorithm for the dial-a-ride problem. Operations Re-search 54 (3), 573–586.URL http://dblp.uni-trier.de/db/journals/ior/ior54.html#Cordeau06
Cordeau, J.-F., Laporte, G., 2007. The dial-a-ride problem: models and algorithms. Annals OR153 (1), 29–46.
Cortes, E. C., Martin, M., Claudio, C., 2010. The pickup and delivery problem with trans-fers: Formulation and a branch-and-cut solution method. European Journal of OperationalResearch 200 (3), 711–724.
21

Deakin, E., Frick, K. T., Shively, K., 2010. Markets for dynamic ridesharing? Case of Berkeley,California. Journal of the Transportation Research Board, 131–137.
DHL-Packstation, 2013. Dhl official webpage (29.11.2013).URL www.dhl.de/en/paket/pakete-empfangen/packstation.html
Hall, C. H., Andersson, H., Lundgren, J. T., Varbrand, P., 2009. The integrated dial-a-rideproblem. Public Transportation 1, 39–54.
Harms, L., Olde Kalter, M. J., Jorritsma, P., 2010. Krimp en mobiliteit (Shrinkage and mobil-ity). Ministerie van Verkeer en Waterstaat.
Hurtigruten, 2013. Hurtigruten official webpage (11.11.2013).URL www.hurtigruten-web.com/index_en.html
IBM ILOG, 2013. Copyright international business machines corporation 1987.
Levin, Y., Nediak, M., Topaloglu, H., 2012. Cargo capacity management with allotments andspot market demand. Operations Research 60 (2), 351–365.
Li, B., Krushinsky, D., Reijers, H. A., Van Woensel, T., 2013. The share-a-ride problem: Peopleand parcels sharing taxis, Technical Report, Eindhoven University of Technology.
Liaw, C. F., White, C. C., Bander, J., 1996. A decision support system for the bimodal dial-a-ride problem. IEEE Transactions on Systems, Man, and Cybernetics, Part A 26 (5), 552–565.
Lindholm, M., Behrends, S., 2012. Challenges in urban freight transport planning – a reviewin the Baltic Sea Region. Journal of Transport Geography 22, 129–136.
LLC, 2013. Winwaed software technology mileage-charts. Webpage (05.09.2013).URL www.mileage-charts.com/europe/NL.html
Masson, R., Lehuede, F., Peton, O., 2012. An adaptiv large neighborhood search for the pickupand delivery problem with transfers. Transportation Science, 1 – 12.
Masson, R., Lehuede, F., Peton, O., 2014. The dial-a-ride problem with transfers. Computers& Operations Research, 12 – 23.
Milieubarometer, 2011. Travel factors. Webpage (12.11.2013).URL www.milieubarometer.nl/uploads/files/CO2_factoren_2010,_mei_en_juni_
2011_dd_26_juni_2011_NL.pdf
Parragh, S. N., 2010. Introducing heterogeneous users and vehicles into models and algorithmsfor the dial-a-ride problem. Transportation Research Part C: Emerging Technologies, 912–930.
Qu, Y., Bard, J. F., oct 2012. A grasp with adaptive large neighborhood search for pickup anddelivery problems with transshipment. Comput. Oper. Res. 39 (10), 2439–2456.
Santos, G., Behrends, H., Teytelboym, A., 2010. Part II: Policy instruments for sustainableroad transport. Research in Transportation Economics 28, 46–91.
22
Shang, J., Cuff, C., 1996. Multicriteria pickup and delivery problem with transfer opportunity.Computers & Industrial Engineering 30 (4), 631 – 645.
SmartLogisticLab, 2013. Official webpage (01.08.2013).URL www.smartlogisticslab.nl
Trentini, A., Masson, R., Lehuede, F., Malheme, N., Peton, O., Tlahig, H., 2012. A shared ”pas-senger & goods” city logistics system. 4th International Conference on Information Systems,Logistics and Supply Chain, Quebec, Canada.
Tretinni, A., Mahlene, N., 2010. Toward a shared urban transport system ensuring passengers &goods cohabitation. Trimestrale del Laboratorio Territorio Mobilita e Ambiente - TeMALab,37–44.
23

Working Papers Beta 2009 - 2013 nr. Year Title Author(s)
441 440 439 438 437 436 435 434 433 432 431
2013 2013 2013 2013 2013 2013 2013 2013 2013 2013 2013
Integrating passenger and freight transportation: Model formulation and insights The Price of Payment Delay On Characterization of the Core of Lane Covering Games via Dual Solutions Destocking, the Bullwhip Effect, and the Credit Crisis: Empirical Modeling of Supply Chain Dynamics Methodological support for business process Redesign in healthcare: a systematic literature review Dynamics and equilibria under incremental Horizontal differentiation on the Salop circle Analyzing Conformance to Clinical Protocols Involving Advanced Synchronizations Models for Ambulance Planning on the Strategic and the Tactical Level Mode Allocation and Scheduling of Inland Container Transportation: A Case-Study in the Netherlands Socially responsible transportation and lot sizing: Insights from multiobjective optimization Inventory routing for dynamic waste collection
Veaceslav Ghilas, Emrah Demir, Tom Van Woensel K. van der Vliet, M.J. Reindorp, J.C. Fransoo Behzad Hezarkhani, Marco Slikker, Tom van Woensel Maximiliano Udenio, Jan C. Fransoo, Robert Peels Rob J.B. Vanwersch, Khurram Shahzad, Irene Vanderfeesten, Kris Vanhaecht, Paul Grefen, Liliane Pintelon, Jan Mendling, Geofridus G. Van Merode, Hajo A. Reijers B. Vermeulen, J.A. La Poutré, A.G. de Kok Hui Yan, Pieter Van Gorp, Uzay Kaymak, Xudong Lu, Richard Vdovjak, Hendriks H.M. Korsten, Huilong Duan J. Theresia van Essen, Johann L. Hurink, Stefan Nickel, Melanie Reuter Stefano Fazi, Tom Van Woensel, Jan C. Fransoo Yann Bouchery, Asma Ghaffari, Zied Jemai, Jan Fransoo Martijn Mes, Marco Schutten, Arturo Pérez Rivera

430 429 428 427 426 425 424 423 422 421 420 419
2013 2013 2013 2013 2013 2013 2013 2013 2013 2013 2013 2013
Simulation and Logistics Optimization of an Integrated Emergency Post Last Time Buy and Repair Decisions for Spare Parts A Review of Recent Research on Green Road Freight Transportation Typology of Repair Shops for Maintenance Spare Parts A value network development model and Implications for innovation and production network management Single Vehicle Routing with Stochastic Demands: Approximate Dynamic Programming Influence of Spillback Effect on Dynamic Shortest Path Problems with Travel-Time-Dependent Network Disruptions Dynamic Shortest Path Problem with Travel-Time-Dependent Stochastic Disruptions: Hybrid Approximate Dynamic Programming Algorithms with a Clustering Approach System-oriented inventory models for spare parts Lost Sales Inventory Models with Batch Ordering And Handling Costs Response speed and the bullwhip Anticipatory Routing of Police Helicopters
N.J. Borgman, M.R.K. Mes, I.M.H. Vliegen, E.W. Hans S. Behfard, M.C. van der Heijden, A. Al Hanbali, W.H.M. Zijm Emrah Demir, Tolga Bektas, Gilbert Laporte M.A. Driessen, V.C.S. Wiers, G.J. van Houtum, W.D. Rustenburg B. Vermeulen, A.G. de Kok C. Zhang, N.P. Dellaert, L. Zhao, T. Van Woensel, D. Sever Derya Sever, Nico Dellaert, Tom Van Woensel, Ton de Kok Derya Sever, Lei Zhao, Nico Dellaert, Tom Van Woensel, Ton de Kok R.J.I. Basten, G.J. van Houtum T. Van Woensel, N. Erkip, A. Curseu, J.C. Fransoo Maximiliano Udenio, Jan C. Fransoo, Eleni Vatamidou, Nico Dellaert Rick van Urk, Martijn R.K. Mes, Erwin W. Hans

418 417 416 415 414 413 412 411 410 409 408 407 406
2013 2013 2013 2013 2013 2013 2013 2013 2013 2013 2013 2013 2013
Supply Chain Finance: research challenges ahead Improving the Performance of Sorter Systems By Scheduling Inbound Containers Regional logistics land allocation policies: Stimulating spatial concentration of logistics firms The development of measures of process harmonization BASE/X. Business Agility through Cross- Organizational Service Engineering The Time-Dependent Vehicle Routing Problem with Soft Time Windows and Stochastic Travel Times Clearing the Sky - Understanding SLA Elements in Cloud Computing Approximations for the waiting time distribution In an M/G/c priority queue To co-locate or not? Location decisions and logistics concentration areas The Time-Dependent Pollution-Routing Problem Scheduling the scheduling task: A time Management perspective on scheduling Clustering Clinical Departments for Wards to Achieve a Prespecified Blocking Probability MyPHRMachines: Personal Health Desktops in the Cloud
Kasper van der Vliet, Matthew J. Reindorp, Jan C. Fransoo S.W.A. Haneyah, J.M.J. Schutten, K. Fikse Frank P. van den Heuvel, Peter W. de Langen, Karel H. van Donselaar, Jan C. Fransoo Heidi L. Romero, Remco M. Dijkman, Paul W.P.J. Grefen, Arjan van Weele Paul Grefen, Egon Lüftenegger, Eric van der Linden, Caren Weisleder Duygu Tas, Nico Dellaert, Tom van Woensel, Ton de Kok Marco Comuzzi, Guus Jacobs, Paul Grefen A. Al Hanbali, E.M. Alvarez, M.C. van der van der Heijden Frank P. van den Heuvel, Karel H. van Donselaar, Rob A.C.M. Broekmeulen, Jan C. Fransoo, Peter W. de Langen Anna Franceschetti, Dorothée Honhon,Tom van Woensel, Tolga Bektas, GilbertLaporte. J.A. Larco, V. Wiers, J. Fransoo J. Theresia van Essen, Mark van Houdenhoven, Johann L. Hurink Pieter Van Gorp, Marco Comuzzi
405 404 403 402 401 400 399 398 397 396 395
2013 2013 2013 2012 2012 2012 2012 2012 2012 2012 2012
Maximising the Value of Supply Chain Finance Reaching 50 million nanostores: retail distribution in emerging megacities A Vehicle Routing Problem with Flexible Time Windows The Service Dominant Business Model: A Service Focused Conceptualization Relationship between freight accessibility and Logistics employment in US counties A Condition-Based Maintenance Policy for Multi-Component Systems with a High Maintenance Setup Cost A flexible iterative improvement heuristic to Support creation of feasible shift rosters in Self-rostering Scheduled Service Network Design with Synchronization and Transshipment Constraints For Intermodal Container Transportation Networks Destocking, the bullwhip effect, and the credit Crisis: empirical modeling of supply chain Dynamics Vehicle routing with restricted loading capacities Service differentiation through selective lateral transshipments
Kasper van der Vliet, Matthew J. Reindorp, Jan C. Fransoo Edgar E. Blanco, Jan C. Fransoo Duygu Tas, Ola Jabali, Tom van Woensel Egon Lüftenegger, Marco Comuzzi, Paul Grefen, Caren Weisleder Frank P. van den Heuvel, Liliana Rivera,Karel H. van Donselaar, Ad de Jong,Yossi Sheffi, Peter W. de Langen, Jan C.Fransoo Qiushi Zhu, Hao Peng, Geert-Jan van Houtum E. van der Veen, J.L. Hurink, J.M.J. Schutten, S.T. Uijland K. Sharypova, T.G. Crainic, T. van Woensel, J.C. Fransoo Maximiliano Udenio, Jan C. Fransoo, Robert Peels J. Gromicho, J.J. van Hoorn, A.L. Kok J.M.J. Schutten E.M. Alvarez, M.C. van der Heijden, I.M.H. Vliegen, W.H.M. Zijm
394 393 392 391 390 389 388 387 386 385 384 383
2012 2012 2012 2012 2012 2012 2012 2012 2012 2012 2012 2012
A Generalized Simulation Model of an Integrated Emergency Post Business Process Technology and the Cloud: Defining a Business Process Cloud Platform Vehicle Routing with Soft Time Windows and Stochastic Travel Times: A Column Generation And Branch-and-Price Solution Approach Improve OR-Schedule to Reduce Number of Required Beds How does development lead time affect performance over the ramp-up lifecycle? Evidence from the consumer electronics industry The Impact of Product Complexity on Ramp- Up Performance Co-location synergies: specialized versus diverse logistics concentration areas Proximity matters: Synergies through co-location of logistics establishments Spatial concentration and location dynamics in logistics:the case of a Dutch province FNet: An Index for Advanced Business Process Querying Defining Various Pathway Terms
Martijn Mes, Manon Bruens Vasil Stoitsev, Paul Grefen D. Tas, M. Gendreau, N. Dellaert, T. van Woensel, A.G. de Kok J.T. v. Essen, J.M. Bosch, E.W. Hans, M. v. Houdenhoven, J.L. Hurink Andres Pufall, Jan C. Fransoo, Ad de Jong Andreas Pufall, Jan C. Fransoo, Ad de Jong, Ton de Kok Frank P.v.d. Heuvel, Peter W.de Langen, Karel H. v. Donselaar, Jan C. Fransoo Frank P.v.d. Heuvel, Peter W.de Langen, Karel H. v.Donselaar, Jan C. Fransoo Frank P. v.d.Heuvel, Peter W.de Langen, Karel H.v. Donselaar, Jan C. Fransoo Zhiqiang Yan, Remco Dijkman, Paul Grefen W.R. Dalinghaus, P.M.E. Van Gorp Egon Lüftenegger, Paul Grefen, Caren Weisleder
382 381 380 379 378 377 375 374 373 372 371 370 369
2012 2012 2012 2012 2012 2012 2012 2012 2012 2012 2012 2012 2011
The Service Dominant Strategy Canvas: Defining and Visualizing a Service Dominant Strategy through the Traditional Strategic Lens A Stochastic Variable Size Bin Packing Problem With Time Constraints Coordination and Analysis of Barge Container Hinterland Networks Proximity matters: Synergies through co-location of logistics establishments A literature review in process harmonization: a conceptual framework A Generic Material Flow Control Model for Two Different Industries Improving the performance of sorter systems by scheduling inbound containers Strategies for dynamic appointment making by container terminals MyPHRMachines: Lifelong Personal Health Records in the Cloud Service differentiation in spare parts supply through dedicated stocks Spare parts inventory pooling: how to share the benefits Condition based spare parts supply Using Simulation to Assess the Opportunities of Dynamic Waste Collection
Stefano Fazi, Tom van Woensel, Jan C. Fransoo K. Sharypova, T. van Woensel, J.C. Fransoo Frank P. van den Heuvel, Peter W. de Langen, Karel H. van Donselaar, Jan C. Fransoo Heidi Romero, Remco Dijkman, Paul Grefen, Arjan van Weele S.W.A. Haneya, J.M.J. Schutten, P.C. Schuur, W.H.M. Zijm H.G.H. Tiemessen, M. Fleischmann, G.J. van Houtum, J.A.E.E. van Nunen, E. Pratsini Albert Douma, Martijn Mes Pieter van Gorp, Marco Comuzzi E.M. Alvarez, M.C. van der Heijden, W.H.M. Zijm Frank Karsten, Rob Basten X.Lin, R.J.I. Basten, A.A. Kranenburg, G.J. van Houtum Martijn Mes J. Arts, S.D. Flapper, K. Vernooij

368 367 366 365 364 363 362 361 360 359 358 357 356 355
2011 2011 2011 2011 2011 2011 2011 2011 2011 2011 2011 2011 2011 2011
Aggregate overhaul and supply chain planning for rotables Operating Room Rescheduling Switching Transport Modes to Meet Voluntary Carbon Emission Targets On two-echelon inventory systems with Poisson demand and lost sales Minimizing the Waiting Time for Emergency Surgery Vehicle Routing Problem with Stochastic Travel Times Including Soft Time Windows and Service Costs A New Approximate Evaluation Method for Two-Echelon Inventory Systems with Emergency Shipments Approximating Multi-Objective Time-Dependent Optimization Problems Branch and Cut and Price for the Time Dependent Vehicle Routing Problem with Time Window Analysis of an Assemble-to-Order System with Different Review Periods Interval Availability Analysis of a Two-Echelon, Multi-Item System Carbon-Optimal and Carbon-Neutral Supply Chains Generic Planning and Control of Automated Material Handling Systems: Practical Requirements Versus Existing Theory Last time buy decisions for products sold under warranty
J.T. van Essen, J.L. Hurink, W. Hartholt, B.J. van den Akker Kristel M.R. Hoen, Tarkan Tan, Jan C. Fransoo, Geert-Jan van Houtum Elisa Alvarez, Matthieu van der Heijden J.T. van Essen, E.W. Hans, J.L. Hurink, A. Oversberg Duygu Tas, Nico Dellaert, Tom van Woensel, Ton de Kok Erhun Özkan, Geert-Jan van Houtum, Yasemin Serin Said Dabia, El-Ghazali Talbi, Tom Van Woensel, Ton de Kok Said Dabia, Stefan Röpke, Tom Van Woensel, Ton de Kok A.G. Karaarslan, G.P. Kiesmüller, A.G. de Kok Ahmad Al Hanbali, Matthieu van der Heijden Felipe Caro, Charles J. Corbett, Tarkan Tan, Rob Zuidwijk Sameh Haneyah, Henk Zijm, Marco Schutten, Peter Schuur M. van der Heijden, B. Iskandar Frank P. van den Heuvel, Peter W. de Langen, Karel H. van Donselaar, Jan C. Fransoo

354 353 352 351 350 349 348 347 346 345 344 343 342 341 339
2011 2011 2011 2011 2011 2011 2011 2011 2011 2011 2011 2011 2010 2010 2010
Spatial concentration and location dynamics in logistics: the case of a Dutch provence Identification of Employment Concentration Areas BOMN 2.0 Execution Semantics Formalized as Graph Rewrite Rules: extended version Resource pooling and cost allocation among independent service providers A Framework for Business Innovation Directions The Road to a Business Process Architecture: An Overview of Approaches and their Use Effect of carbon emission regulations on transport mode selection under stochastic demand An improved MIP-based combinatorial approach for a multi-skill workforce scheduling problem An approximate approach for the joint problem of level of repair analysis and spare parts stocking Joint optimization of level of repair analysis and spare parts stocks Inventory control with manufacturing lead time flexibility Analysis of resource pooling games via a new extenstion of the Erlang loss function Vehicle refueling with limited resources Optimal Inventory Policies with Non-stationary Supply Disruptions and Advance Supply Information Redundancy Optimization for Critical Components in High-Availability Capital Goods
Frank P. van den Heuvel, Peter W. de Langen, Karel H. van Donselaar, Jan C. Fransoo Pieter van Gorp, Remco Dijkman Frank Karsten, Marco Slikker, Geert-Jan van Houtum E. Lüftenegger, S. Angelov, P. Grefen Remco Dijkman, Irene Vanderfeesten, Hajo A. Reijers K.M.R. Hoen, T. Tan, J.C. Fransoo G.J. van Houtum Murat Firat, Cor Hurkens R.J.I. Basten, M.C. van der Heijden, J.M.J. Schutten R.J.I. Basten, M.C. van der Heijden, J.M.J. Schutten Ton G. de Kok Frank Karsten, Marco Slikker, Geert-Jan van Houtum Murat Firat, C.A.J. Hurkens, Gerhard J. Woeginger Bilge Atasoy, Refik Güllü, TarkanTan Kurtulus Baris Öner, Alan Scheller-Wolf Geert-Jan van Houtum Joachim Arts, Gudrun Kiesmüller Murat Firat, Gerhard J. Woeginger

338 335 334 333 332 331 330 329 328 327 326 325 324 323
2010 2010 2010 2010 2010 2010 2010 2010 2010 2010 2010 2010 2010 2010
Analysis of a two-echelon inventory system with two supply modes Analysis of the dial-a-ride problem of Hunsaker and Savelsbergh Attaining stability in multi-skill workforce scheduling Flexible Heuristics Miner (FHM) An exact approach for relating recovering surgical patient workload to the master surgical schedule Efficiency evaluation for pooling resources in health care The Effect of Workload Constraints in Mathematical Programming Models for Production Planning Using pipeline information in a multi-echelon spare parts inventory system Reducing costs of repairable spare parts supply systems via dynamic scheduling Identification of Employment Concentration and Specialization Areas: Theory and Application A combinatorial approach to multi-skill workforce scheduling Stability in multi-skill workforce scheduling Maintenance spare parts planning and control: A framework for control and agenda for future research Near-optimal heuristics to set base stock levels in
Murat Firat, Cor Hurkens A.J.M.M. Weijters, J.T.S. Ribeiro P.T. Vanberkel, R.J. Boucherie, E.W. Hans, J.L. Hurink, W.A.M. van Lent, W.H. van Harten Peter T. Vanberkel, Richard J. Boucherie, Erwin W. Hans, Johann L. Hurink, Nelly Litvak M.M. Jansen, A.G. de Kok, I.J.B.F. Adan Christian Howard, Ingrid Reijnen, Johan Marklund, Tarkan Tan H.G.H. Tiemessen, G.J. van Houtum F.P. van den Heuvel, P.W. de Langen, K.H. van Donselaar, J.C. Fransoo Murat Firat, Cor Hurkens Murat Firat, Cor Hurkens, Alexandre Laugier M.A. Driessen, J.J. Arts, G.J. v. Houtum, W.D. Rustenburg, B. Huisman R.J.I. Basten, G.J. van Houtum M.C. van der Heijden, E.M. Alvarez, J.M.J. Schutten

322 321 320 319 318 317 316 315 314 313
2010 2010 2010 2010 2010 2010 2010 2010 2010
a two-echelon distribution network Inventory reduction in spare part networks by selective throughput time reduction The selective use of emergency shipments for service-contract differentiation Heuristics for Multi-Item Two-Echelon Spare Parts Inventory Control Problem with Batch Ordering in the Central Warehouse Preventing or escaping the suppression mechanism: intervention conditions Hospital admission planning to optimize major resources utilization under uncertainty Minimal Protocol Adaptors for Interacting Services Teaching Retail Operations in Business and Engineering Schools Design for Availability: Creating Value for Manufacturers and Customers Transforming Process Models: executable rewrite rules versus a formalized Java program Getting trapped in the suppression of exploration: A simulation model A Dynamic Programming Approach to Multi-Objective Time-Dependent Capacitated Single Vehicle Routing Problems with Time Windows
E.M. Alvarez, M.C. van der Heijden, W.H. Zijm B. Walrave, K. v. Oorschot, A.G.L. Romme Nico Dellaert, Jully Jeunet. R. Seguel, R. Eshuis, P. Grefen. Tom Van Woensel, Marshall L. Fisher, Jan C. Fransoo. Lydie P.M. Smets, Geert-Jan van Houtum, Fred Langerak. Pieter van Gorp, Rik Eshuis. Bob Walrave, Kim E. van Oorschot, A. Georges L. Romme S. Dabia, T. van Woensel, A.G. de Kok
312 2010 Tales of a So(u)rcerer: Optimal Sourcing Decisions Under Alternative Capacitated Suppliers and General Cost Structures
Osman Alp, Tarkan Tan
311 2010 In-store replenishment procedures for perishable inventory in a retail environment with handling costs and storage constraints
R.A.C.M. Broekmeulen, C.H.M. Bakx
310 2010 The state of the art of innovation-driven business models in the financial services industry
E. Lüftenegger, S. Angelov, E. van der Linden, P. Grefen
309 2010 Design of Complex Architectures Using a Three Dimension Approach: the CrossWork Case R. Seguel, P. Grefen, R. Eshuis
308 2010 Effect of carbon emission regulations on transport K.M.R. Hoen, T. Tan, J.C. Fransoo,

mode selection in supply chains G.J. van Houtum
307 2010 Interaction between intelligent agent strategies for real-time transportation planning
Martijn Mes, Matthieu van der Heijden, Peter Schuur
306 2010 Internal Slackening Scoring Methods Marco Slikker, Peter Borm, René van den Brink
305 2010 Vehicle Routing with Traffic Congestion and Drivers' Driving and Working Rules
A.L. Kok, E.W. Hans, J.M.J. Schutten, W.H.M. Zijm
304 2010 Practical extensions to the level of repair analysis R.J.I. Basten, M.C. van der Heijden, J.M.J. Schutten
303 2010 Ocean Container Transport: An Underestimated and Critical Link in Global Supply Chain Performance
Jan C. Fransoo, Chung-Yee Lee
302 2010 Capacity reservation and utilization for a manufacturer with uncertain capacity and demand Y. Boulaksil; J.C. Fransoo; T. Tan
300 2009 Spare parts inventory pooling games F.J.P. Karsten; M. Slikker; G.J. van Houtum
299 2009 Capacity flexibility allocation in an outsourced supply chain with reservation Y. Boulaksil, M. Grunow, J.C. Fransoo
298
2010
An optimal approach for the joint problem of level of repair analysis and spare parts stocking
R.J.I. Basten, M.C. van der Heijden, J.M.J. Schutten
297 2009 Responding to the Lehman Wave: Sales Forecasting and Supply Management during the Credit Crisis
Robert Peels, Maximiliano Udenio, Jan C. Fransoo, Marcel Wolfs, Tom Hendrikx
296 2009 An exact approach for relating recovering surgical patient workload to the master surgical schedule
Peter T. Vanberkel, Richard J. Boucherie, Erwin W. Hans, Johann L. Hurink, Wineke A.M. van Lent, Wim H. van Harten
295
2009
An iterative method for the simultaneous optimization of repair decisions and spare parts stocks
R.J.I. Basten, M.C. van der Heijden, J.M.J. Schutten
294 2009 Fujaba hits the Wall(-e) Pieter van Gorp, Ruben Jubeh, Bernhard Grusie, Anne Keller
293 2009 Implementation of a Healthcare Process in Four Different Workflow Systems
R.S. Mans, W.M.P. van der Aalst, N.C. Russell, P.J.M. Bakker
292 2009 Business Process Model Repositories - Framework and Survey
Zhiqiang Yan, Remco Dijkman, Paul Grefen
291 2009 Efficient Optimization of the Dual-Index Policy Using Markov Chains
Joachim Arts, Marcel van Vuuren, Gudrun Kiesmuller
290 2009 Hierarchical Knowledge-Gradient for Sequential Sampling
Martijn R.K. Mes; Warren B. Powell; Peter I. Frazier
289 2009 Analyzing combined vehicle routing and break scheduling from a distributed decision making perspective
C.M. Meyer; A.L. Kok; H. Kopfer; J.M.J. Schutten
288 2009 Anticipation of lead time performance in Supply Chain Operations Planning
Michiel Jansen; Ton G. de Kok; Jan C. Fransoo
287 2009 Inventory Models with Lateral Transshipments: A Colin Paterson; Gudrun Kiesmuller;

Review Ruud Teunter; Kevin Glazebrook
286 2009 Efficiency evaluation for pooling resources in health care
P.T. Vanberkel; R.J. Boucherie; E.W. Hans; J.L. Hurink; N. Litvak
285 2009 A Survey of Health Care Models that Encompass Multiple Departments
P.T. Vanberkel; R.J. Boucherie; E.W. Hans; J.L. Hurink; N. Litvak
284 2009 Supporting Process Control in Business Collaborations
S. Angelov; K. Vidyasankar; J. Vonk; P. Grefen
283 2009 Inventory Control with Partial Batch Ordering O. Alp; W.T. Huh; T. Tan
282 2009 Translating Safe Petri Nets to Statecharts in a Structure-Preserving Way R. Eshuis
281 2009 The link between product data model and process model J.J.C.L. Vogelaar; H.A. Reijers
280 2009 Inventory planning for spare parts networks with delivery time requirements I.C. Reijnen; T. Tan; G.J. van Houtum
279 2009 Co-Evolution of Demand and Supply under Competition B. Vermeulen; A.G. de Kok
278 277
2010 2009
Toward Meso-level Product-Market Network Indices for Strategic Product Selection and (Re)Design Guidelines over the Product Life-Cycle An Efficient Method to Construct Minimal Protocol Adaptors
B. Vermeulen, A.G. de Kok R. Seguel, R. Eshuis, P. Grefen
276 2009 Coordinating Supply Chains: a Bilevel Programming Approach Ton G. de Kok, Gabriella Muratore
275 2009 Inventory redistribution for fashion products under demand parameter update G.P. Kiesmuller, S. Minner
274 2009 Comparing Markov chains: Combining aggregation and precedence relations applied to sets of states
A. Busic, I.M.H. Vliegen, A. Scheller-Wolf
273 2009 Separate tools or tool kits: an exploratory study of engineers' preferences
I.M.H. Vliegen, P.A.M. Kleingeld, G.J. van Houtum
272
2009
An Exact Solution Procedure for Multi-Item Two-Echelon Spare Parts Inventory Control Problem with Batch Ordering
Engin Topan, Z. Pelin Bayindir, Tarkan Tan
271 2009 Distributed Decision Making in Combined Vehicle Routing and Break Scheduling
C.M. Meyer, H. Kopfer, A.L. Kok, M. Schutten
270 2009 Dynamic Programming Algorithm for the Vehicle Routing Problem with Time Windows and EC Social Legislation
A.L. Kok, C.M. Meyer, H. Kopfer, J.M.J. Schutten
269 2009 Similarity of Business Process Models: Metics and Evaluation
Remco Dijkman, Marlon Dumas, Boudewijn van Dongen, Reina Kaarik, Jan Mendling
267 2009 Vehicle routing under time-dependent travel times: the impact of congestion avoidance A.L. Kok, E.W. Hans, J.M.J. Schutten
266 2009 Restricted dynamic programming: a flexible J. Gromicho; J.J. van Hoorn; A.L. Kok;

framework for solving realistic VRPs J.M.J. Schutten; Working Papers published before 2009 see: http://beta.ieis.tue.nl