integrating large load at grant pud - home | pnucc 2014 gpud integrating large... · integrating...
TRANSCRIPT

Integrating Large Load at Grant PUDC St d d L L dCase Study and Lessons Learned

Grant County at a Glance• Population (in 2012): 91,723• 2 777 square miles (4th largest geographic area in state)2,777 square miles (4th largest geographic area in state)• 2% Avg. annual growth rate exceeded nation and the state
from 1990 to 2010. • Logistical resources: Access to railways, one of largest U.S.
airfields, Interstate 90, fastest broadband network in country• Predominant agricultural economy• Predominant agricultural economy
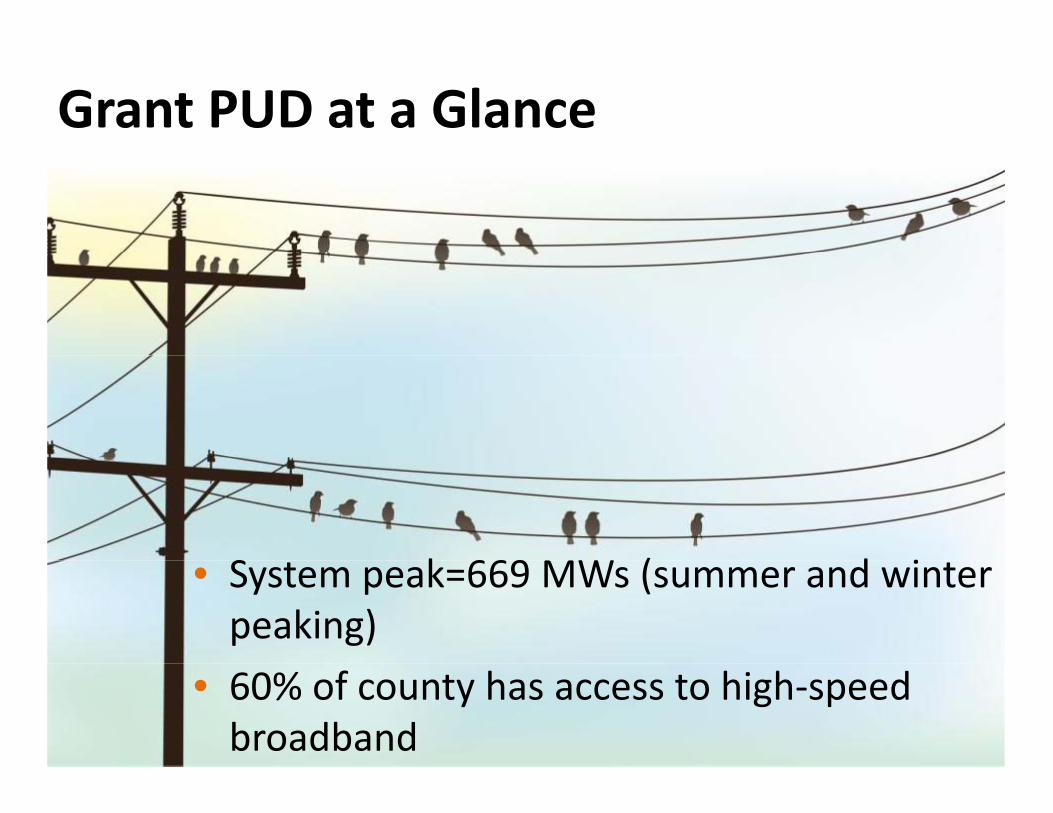
Grant PUD at a Glance
S k 669 MW ( d i• System peak=669 MWs (summer and winter peaking)
• 60% of county has access to high‐speed broadband

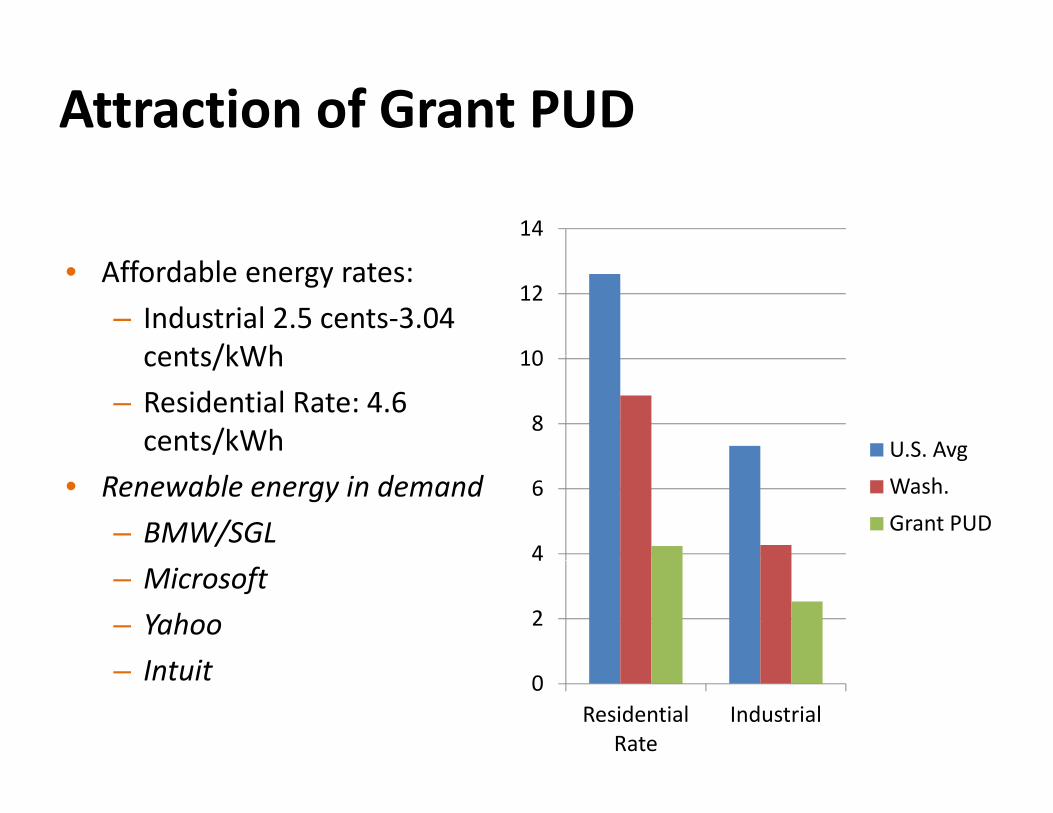
Attraction of Grant PUD
Available Low‐Cost Renewable Hydropower
Attraction of Grant PUD
14
• Affordable energy rates: – Industrial 2.5 cents‐3.04 cents/kWh 10
12
cents/kWh– Residential Rate: 4.6 cents/kWh 8
10
U.S. Avg
• Renewable energy in demand– BMW/SGL
4
6
gWash.Grant PUD
– Microsoft– YahooI t it
2
4
– Intuit 0Residential
RateIndustrial
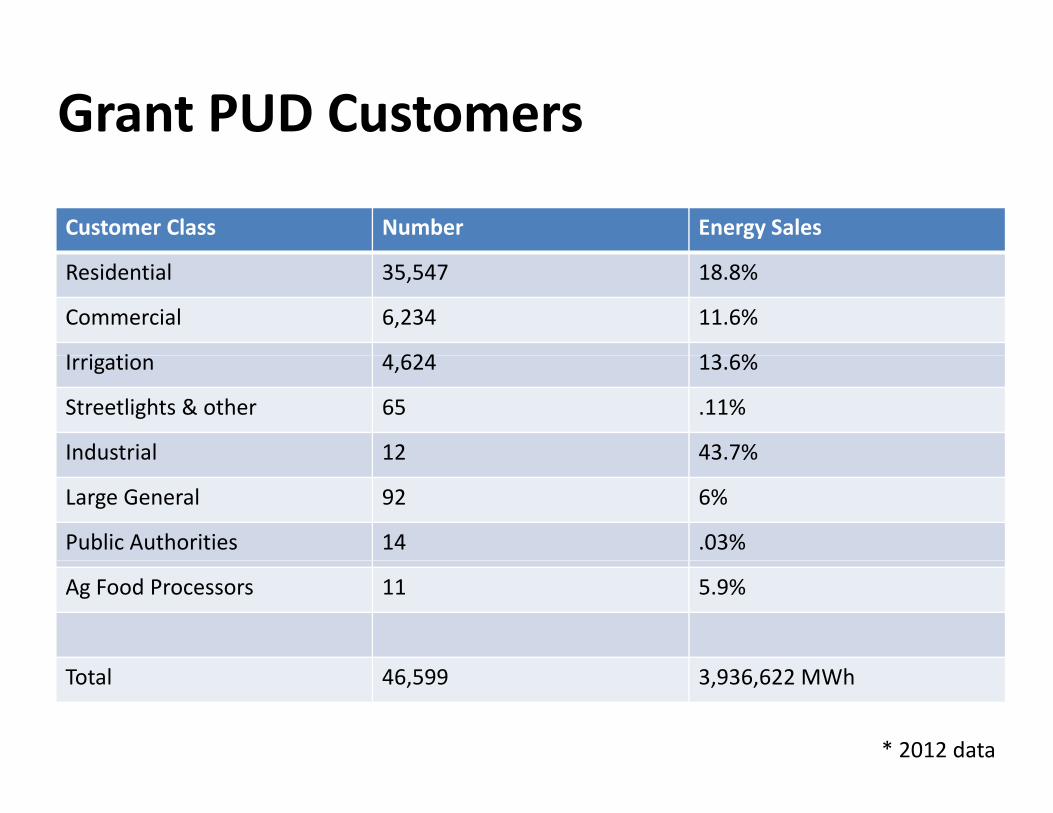
Grant PUD Customers
Customer Class Number Energy Sales
Residential 35,547 18.8%
Commercial 6,234 11.6%
I i i 4 624 13 6%Irrigation 4,624 13.6%
Streetlights & other 65 .11%
Industrial 12 43.7%Industrial 12 43.7%
Large General 92 6%
Public Authorities 14 .03%
Ag Food Processors 11 5.9%
Total 46,599 3,936,622 MWh
* 2012 data
So what’s going on at Grant?So what s going on at Grant?
• In less than 10 years Grant has transformedIn less than 10 years, Grant has transformed from a stable, slow to moderate growing service territory relative to the region into aservice territory relative to the region into a rapid grower with many new challenges.
• This growth has changed Grant in many ways i ll i h di hifespecially given the extraordinary shift to
“large individual loads”.

Where we were just 10 years agoWhere we were just 10 years ago400
300
350
Industrial
150
200
250Ag Food Process
Large General
Irrigation
Commercial
50
100
150Residential
System Losses
0
1983
1984
1985
1986
1987
1988
1989
1990
1991
1992
1993
1994
1995
1996
1997
1998
1999
2000
2001
2002
2003
2004
2005

Shift toward larger loads
Grant County PUD 2013 Medium Load Forecast Retail Sales by Rate Class
700
800
Actual Forecasted
Added 140 aMWs of load since 500
600
2004, ~40% growth
A F d P
Industrial
300
400
aMW
Commercial
Irrigation
Large General
Ag Food Process
200
System Losses
Residential
0
100
1990 1995 2000 2005 2010 2015 2020 2025 2030

A Closer Look …A Closer Look …
• Grant retail load has grown ~40% ‘04 – ’14 (CAGR G a t eta oad as g o 0% 0 (C G3.4% / yr)
• 69% of this growth has been in the industrial gsector.
• It is not just industry where we are growing –meter count is up 19% over the 10 year period BUTI d t i l l t t 0 2% TOTAL (15• Industrial class meter count up 0.2% TOTAL (15 customers) and has resulted in 69% of total load growthgrowth.
A Closer Look …A Closer Look …
• As we said the industrial class meter count upAs we said, the industrial class meter count up 0.2% TOTAL (15 customers) and has resulted in 69% of total load growth69% of total load growth.
• Our 12 largest customers provide 40% of total retail revenuesretail revenues.
• Average use per incremental customer but a h i hhuge variance across these new customers.
• Leads to large planning uncertainties.
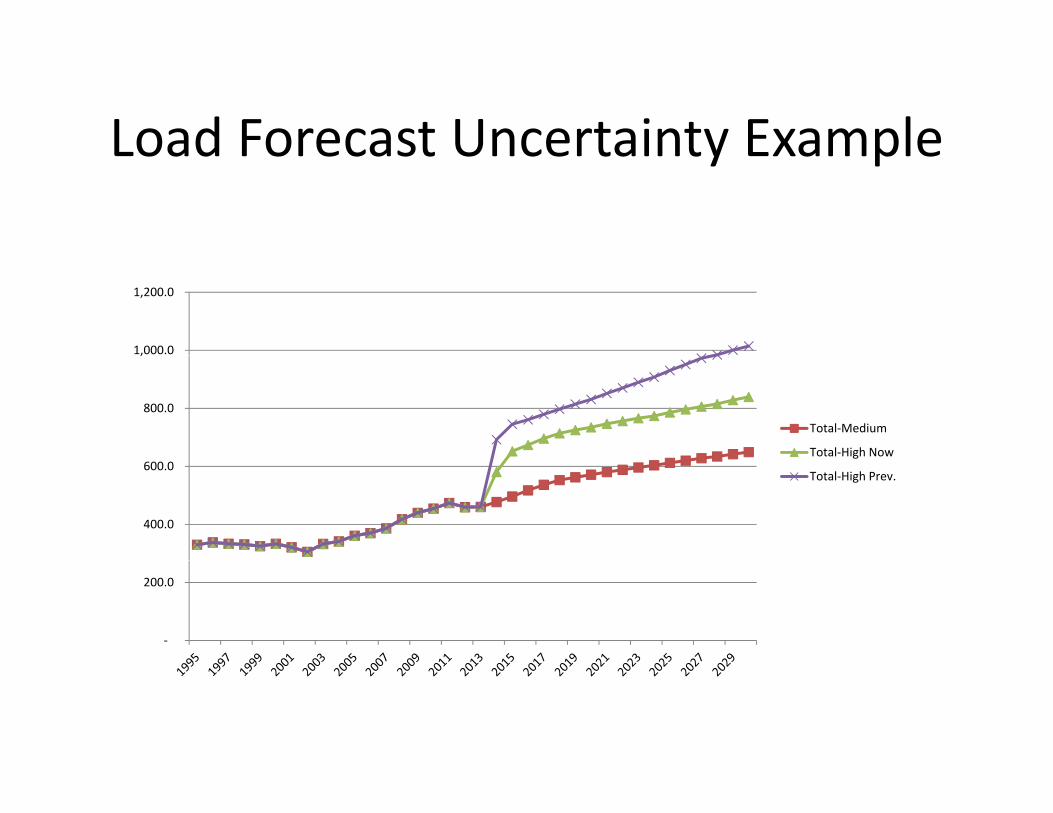
Load Forecast Uncertainty ExampleLoad Forecast Uncertainty Example
1,000.0
1,200.0
800.0
,
Total‐Medium
Total‐High Now
400.0
600.0 g
Total‐High Prev.
‐
200.0

So What Does this Mean for Planning & Forecasting?
• Forecasting has become quite challenging.g q g g• Standard forecasting techniques are not amenable to what we are facing – small number of high usage
t ith t l hi h ti l icustomers with extremely high proportional variance.• Large uncertainties around timing and magnitude of sales.sales.
• Factors driving a significant proportion of our sales are not tied to “local / regional” factors.
• International markets, trade / tariff wars and rapidly changing product markets strongly drive our positions.
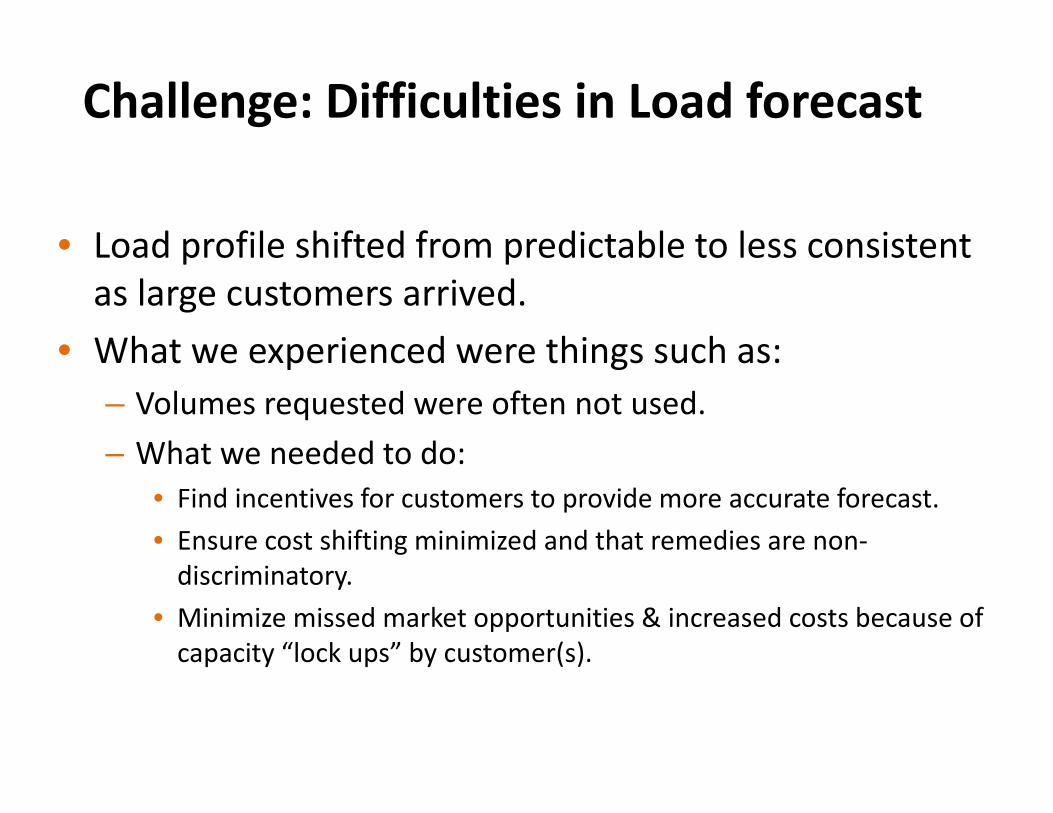
Challenge: Difficulties in Load forecast
• Load profile shifted from predictable to less consistentLoad profile shifted from predictable to less consistent as large customers arrived.
• What we experienced were things such as:What we experienced were things such as:– Volumes requested were often not used.– What we needed to do:What we needed to do:
• Find incentives for customers to provide more accurate forecast.• Ensure cost shifting minimized and that remedies are non‐discriminatory.
• Minimize missed market opportunities & increased costs because of capacity “lock ups” by customer(s). p y p y ( )
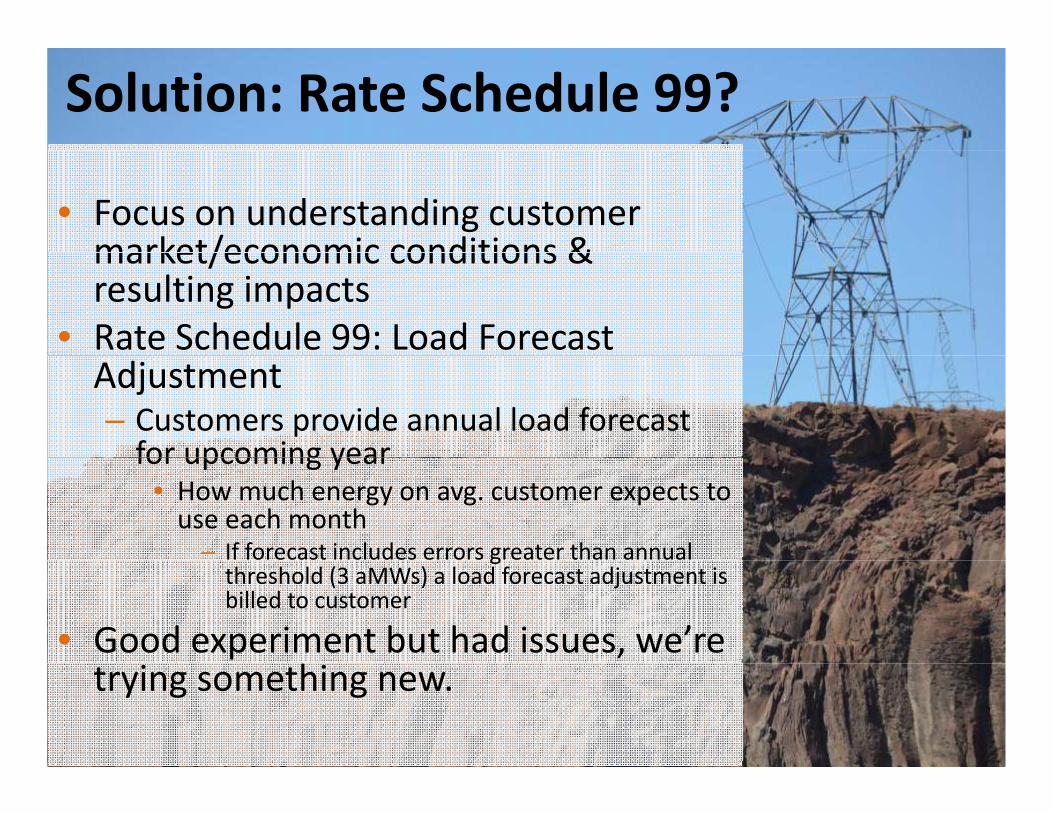
Solution: Rate Schedule 99?
• Focus on understanding customer market/economic conditions &market/economic conditions & resulting impacts
• Rate Schedule 99: Load Forecast Adjustment– Customers provide annual load forecast for upcoming yearfor upcoming year
• How much energy on avg. customer expects to use each month
– If forecast includes errors greater than annual gthreshold (3 aMWs) a load forecast adjustment is billed to customer
• Good experiment but had issues, we’re trying something new.

Who is coming to Grant?Who is coming to Grant?
• The data centers:The data centers: – YahooMicrosoft– Microsoft
– DellI t it
Quincy Area Data Centers– Intuit– VantageI (S b )– Intergate (Sabey)
– Titan Moses Lake Area
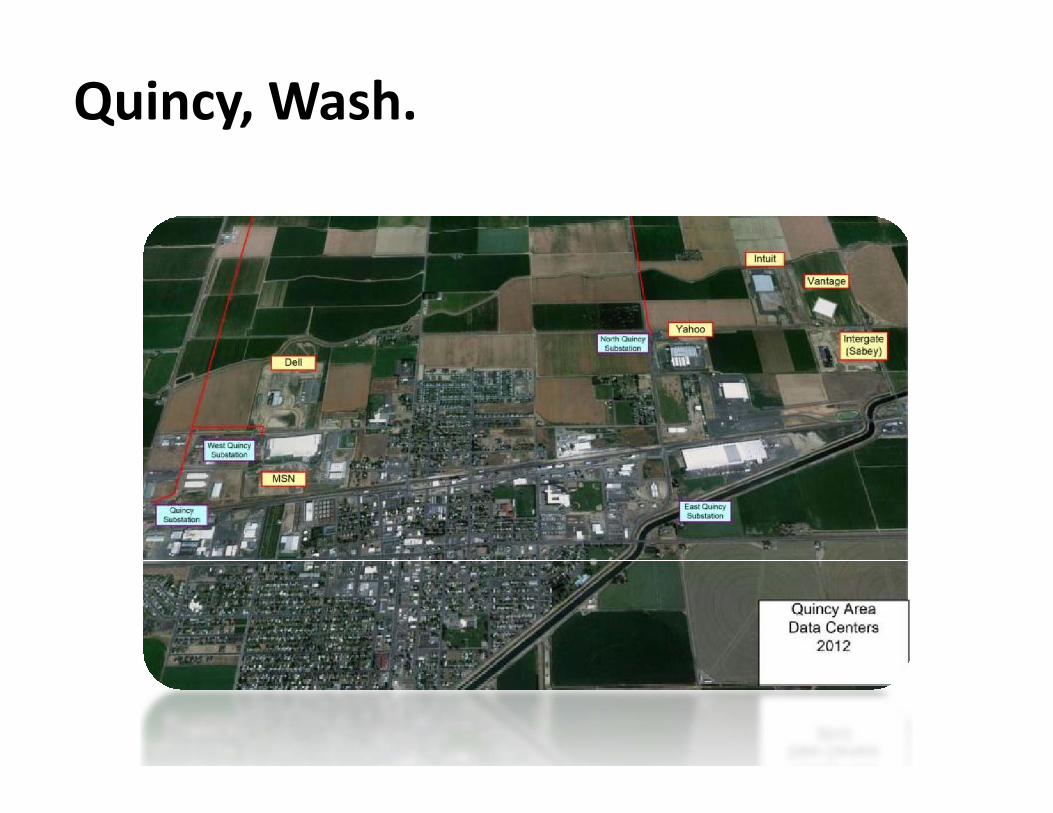
Quincy, Wash.
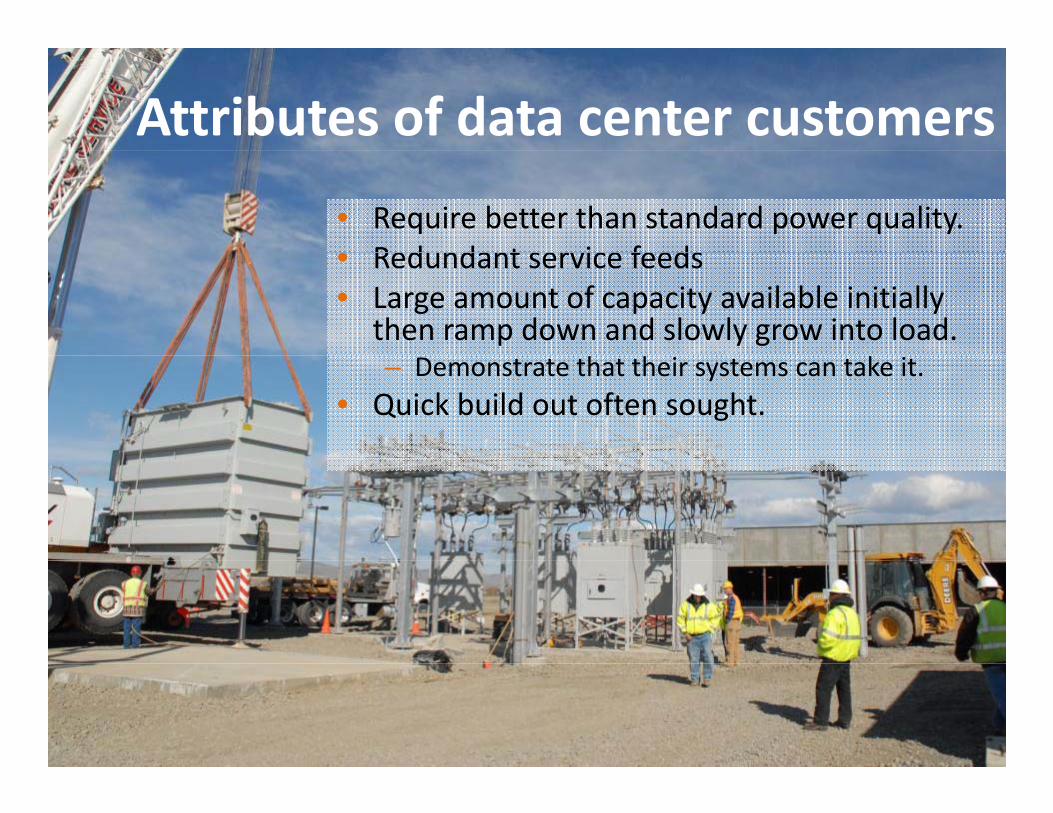
Attributes of data center customers
• Require better than standard power quality.• Redundant service feeds• Redundant service feeds• Large amount of capacity available initially
then ramp down and slowly grow into load.– Demonstrate that their systems can take it.
• Quick build out often sought.
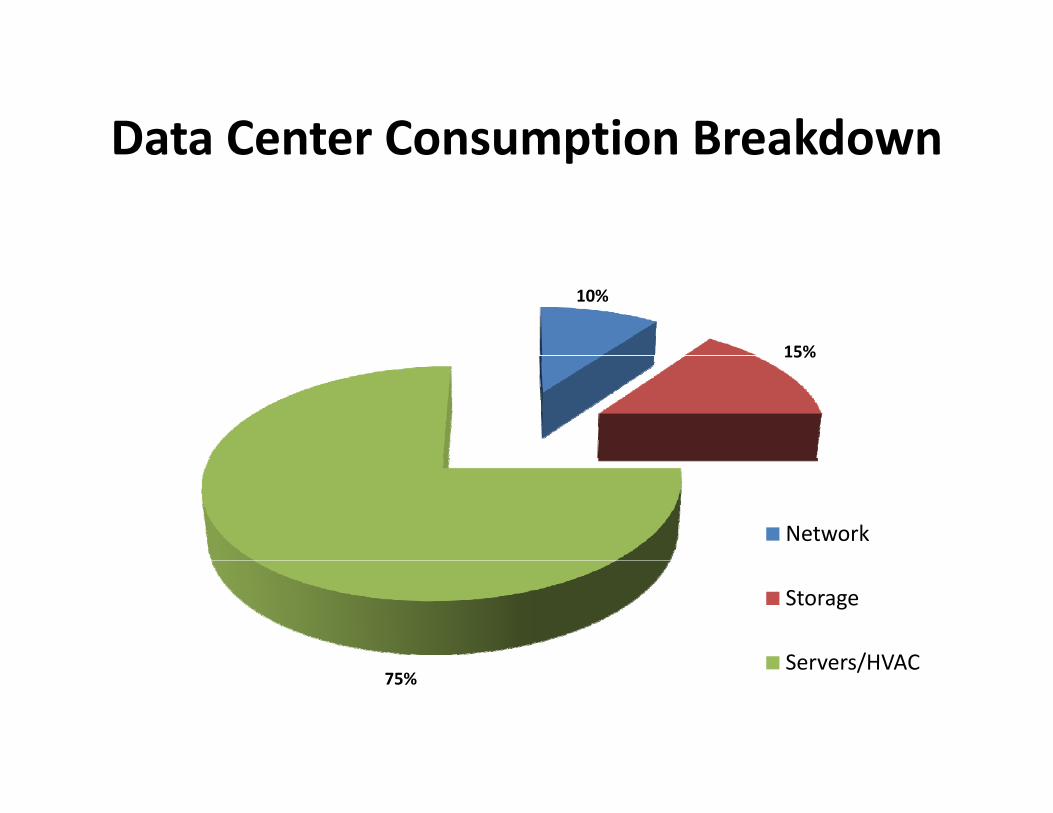
Data Center Consumption BreakdownData Center Consumption Breakdown
10%
15%15%
Network
Storage
Servers/HVACServers/HVAC75%
Who is coming to Grant?Who is coming to Grant?
• The data centers of course:The data centers, of course:• But not just:
M f t i– Manufacturing• Heavy ‐ SGL Carbon Fibers (SGL – BMW joint venture), REC Silicon ChemiconREC Silicon, Chemicon
• Light ‐ Genie, Takata, MLI, D&L Foundry
– Food Processingood ocess g• Fuji, Pacific Coast Canola, Amway

REC Silicon – “the first”REC Silicon the first

SGL Carbon FibersSGL Carbon Fibers
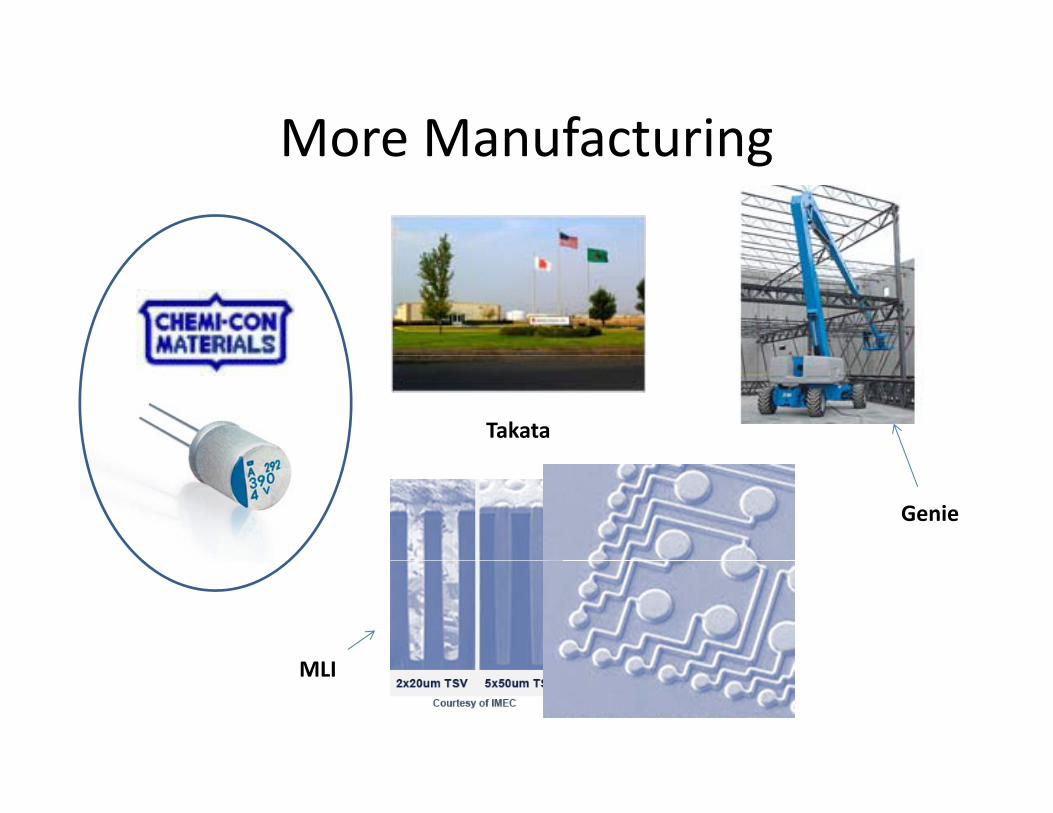
More ManufacturingMore Manufacturing
Takata
Genie
MLIMLI
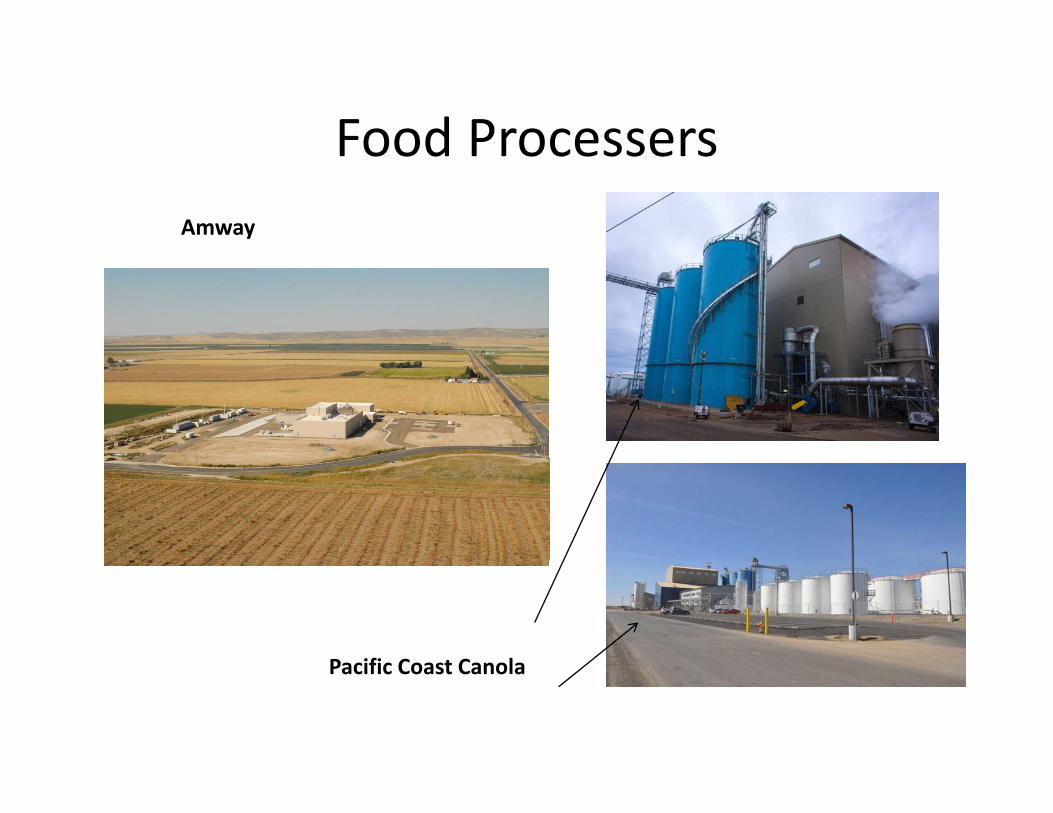
Food ProcessersFood ProcessersAmway
Pacific Coast CanolaPacific Coast Canola
Changing Expectations for ServiceChanging Expectations for Service
• Electricity is a commodity but our customersElectricity is a commodity but our customers are not just seeking and choosing based upon price.
• “System Power” delivered under our standard terms and policies often not adequate.
• We are seeing requests for schedule flexibility, high availability, specific power attributes and power quality as well as opportunities for DSM and EE.
Examples of Changing Expectations for Service
• Expedited facilities construction.Expedited facilities construction.
• Optionality for future expansions• Optionality for future expansions.
E li it GHG d t it t• Explicit GHG and resource type commitments.
• Extremely high availability and “upstream” redundancy.
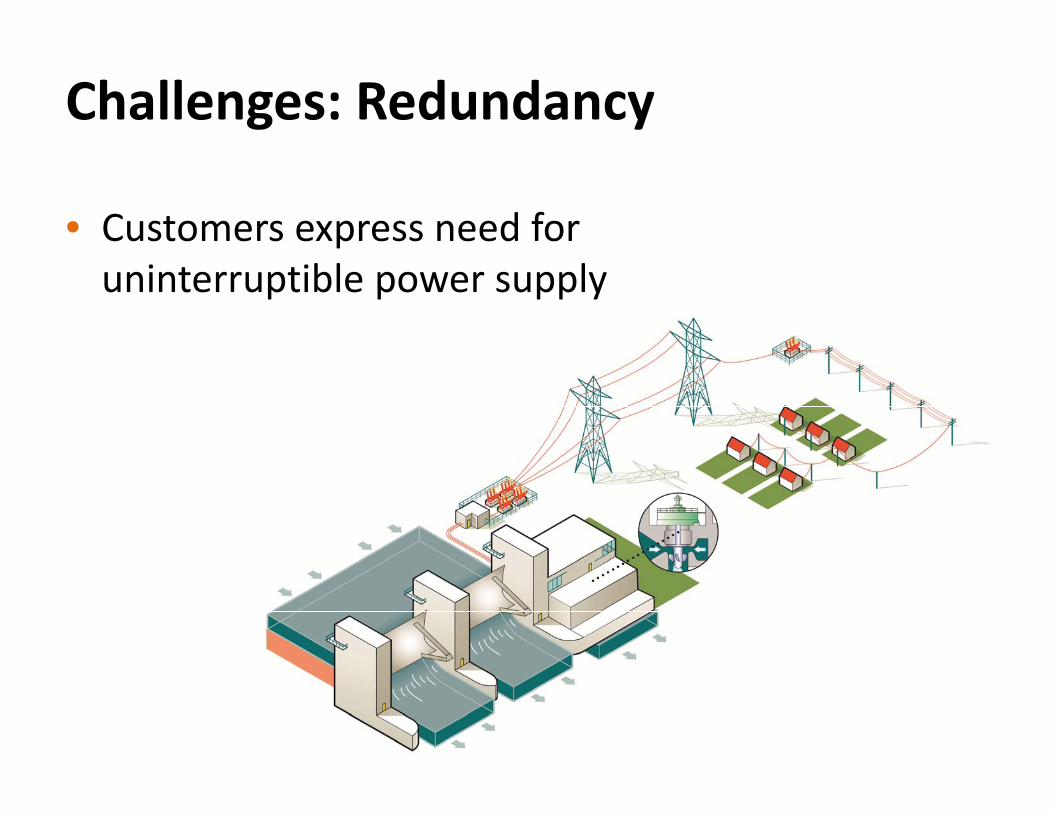
Challenges: Redundancy
• Customers express need for uninterruptible power supply

Obligation for redundancy?
• Policies state: Required to serve all customers, but not to provide redundancy
• “The District will attempt to provide, but does not pguarantee, a regular and uninterrupted supply of service.”– Customer Service Policy yManual section 2.5

Solution: RFCC
• Redundant Facilities Cost ContributionC t t ib ti i l t f d d t– Customer pays contribution equivalent for redundant capacity to be used
– Underground distribution or extension beyond oneUnderground distribution or extension beyond one mile=customer pays
– Additional system upgrade costs are socializedy pg• Customer pays actual cost of transmission construction
• Can raise upfront cost / financing issues for customer and requires very crisp demarcation definition for “system” vs. “customer” redundancy
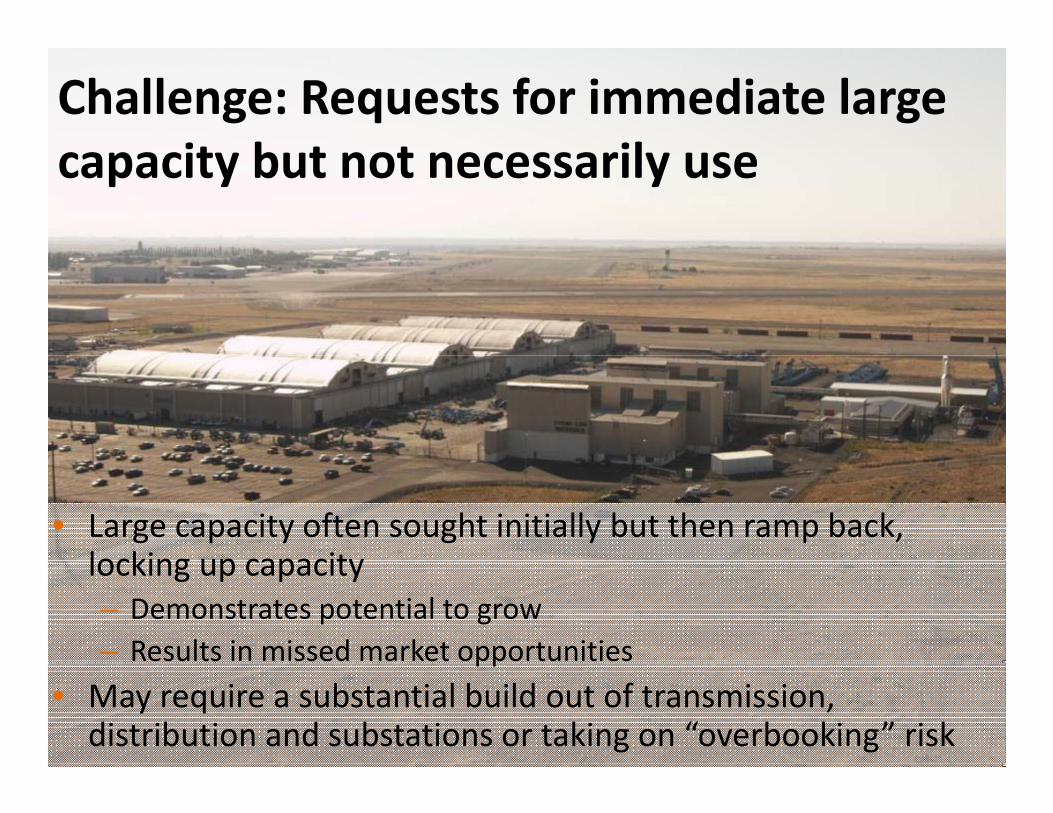
Challenge: Requests for immediate large it b t t ilcapacity but not necessarily use
• Large capacity often sought initially but then ramp back, locking up capacitylocking up capacity – Demonstrates potential to grow– Results in missed market opportunities pp
• May require a substantial build out of transmission, distribution and substations or taking on “overbooking” risk
Financial Considerations & ConcernsFinancial Considerations & Concerns
• The growth and especially the type of growth we are experiencing provides opportunities but also entails some new risksentails some new risks.
• We are seeing affects on:• We are seeing affects on:– Financial reserves required.– Rate design.– Credit support.– Perceived risk profile.
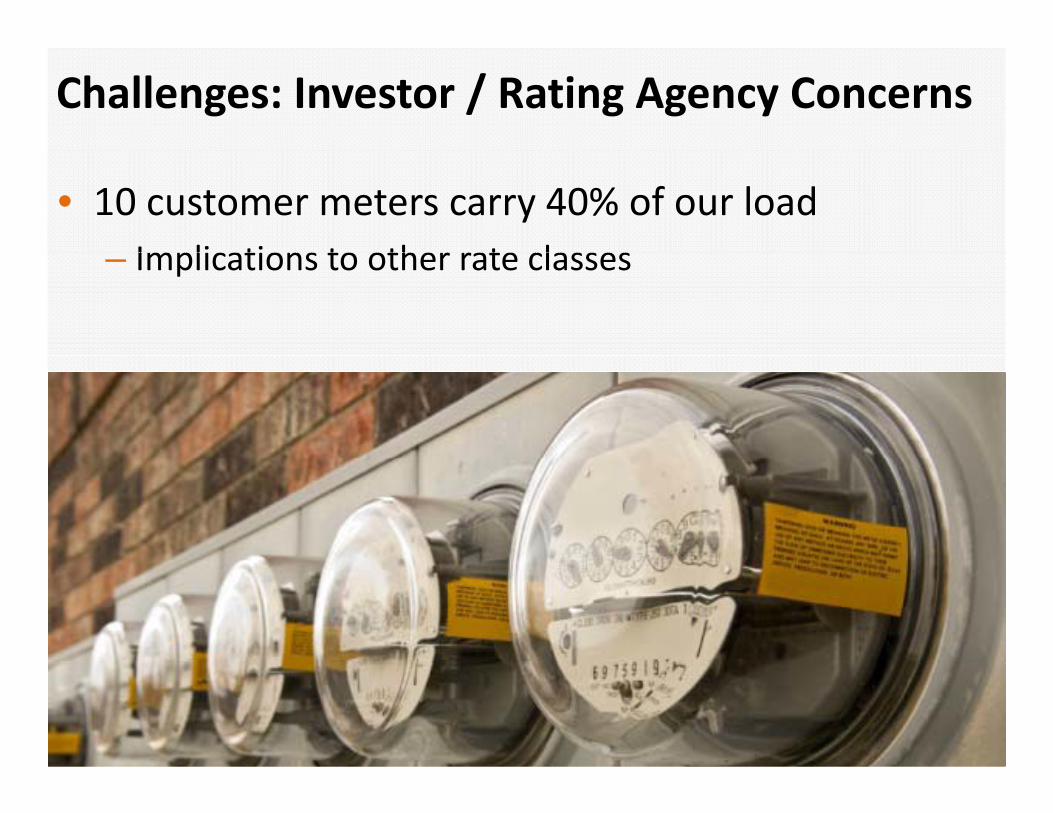
Challenges: Investor / Rating Agency Concerns
• 10 customer meters carry 40% of our loadImplications to other rate classes– Implications to other rate classes
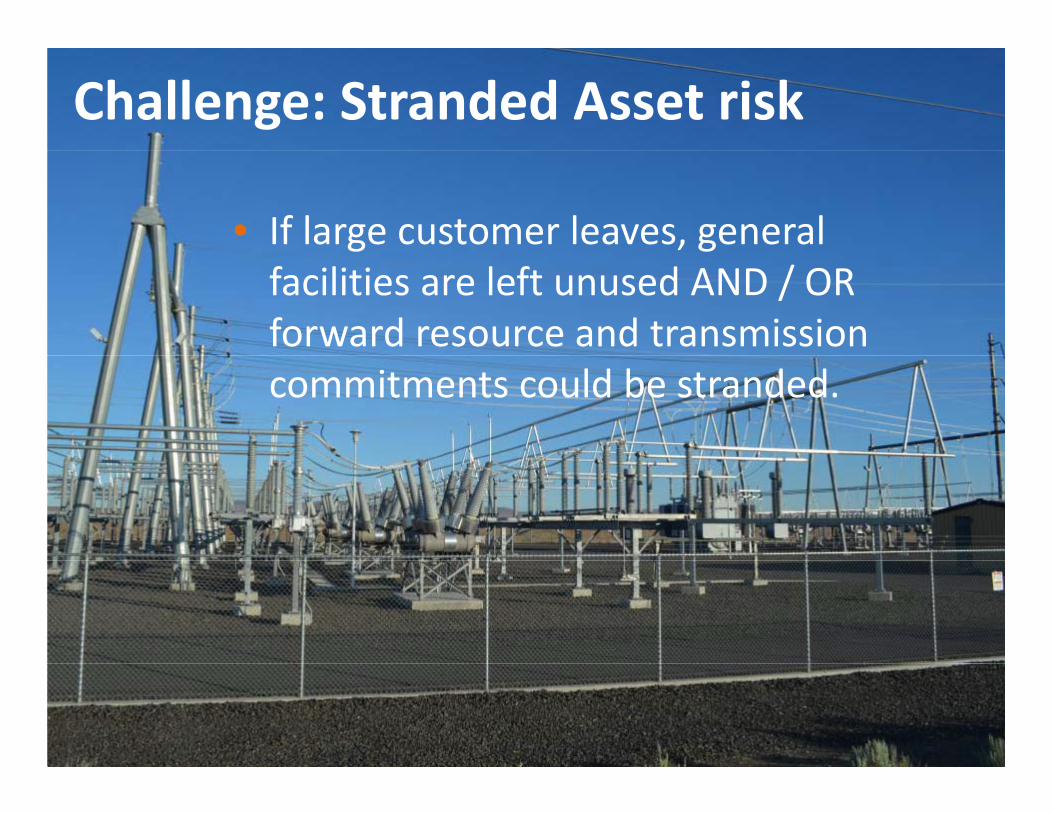
Challenge: Stranded Asset risk
• If large customer leaves, general facilities are left unused AND / OR forward resource and transmission commitments could be stranded.

How do we charge?Challenge:Challenge: ggg
• Rate design has become much more important for us.
• Changing customerChanging customer mix results in vast differences betweendifferences between cost to serve classes.
• Explicit definition of• Explicit definition of “policy choices”.

Challenge: Vast Differences within “I” Class
• How similar are a 6 MW and 50+ MWHow similar are a 6 MW and 50+ MW customer?
• Unique attributes and service desires lead to• Unique attributes and service desires lead to questions about mechanism for charging.L ki l d fi i i• Looking at new customer class definitions.
• Considering augmenting current published rate schedules with bespoke retail rate contracts.

Benefits of integrating Large Load
• Consistent revenue producing customerscustomers
• Community developmentC i t t fl t h l l d• Consistent, flat hourly load profiles
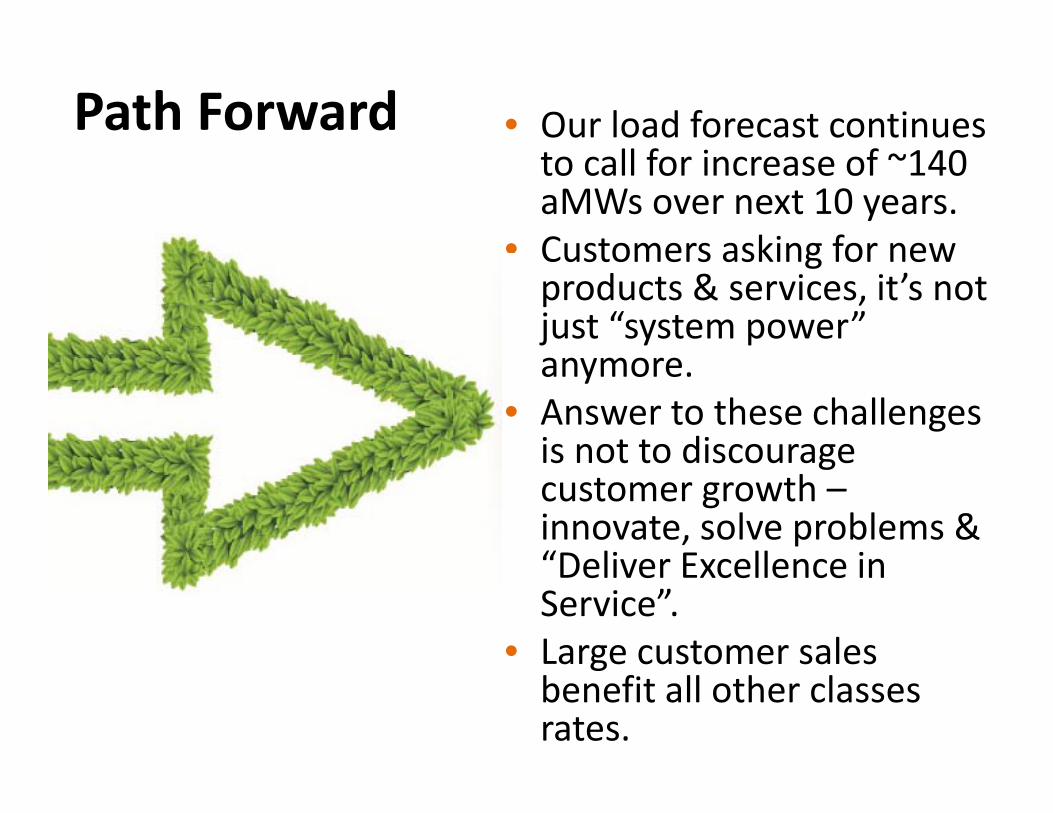
Path Forward • Our load forecast continues ll f i f 140to call for increase of ~140
aMWs over next 10 years.• Customers asking for newCustomers asking for new products & services, it’s not just “system power” anymore.
• Answer to these challenges is not to discourageis not to discourage customer growth –innovate, solve problems & “Deliver Excellence inDeliver Excellence in Service”.
• Large customer salesLarge customer sales benefit all other classes rates.