integrated solid waste mangement approach for
TRANSCRIPT

INTEGRATED SOLID WASTE MANGEMENT APPROACH FORENVIRONMENTAL IMPROVEMENT: A CASE STUDY OF SYLHET CITY
A Thesis by
UTTAM KUMAR SABA0400041381'
1-. .. ---
. 1111111111111111111111111" 1111111#100851#
MASTER OF SCIENCE IN CIVIL ENGINEERING
DEPARTMENT OF CIVIL ENGINEERINGBUET, DHAKA
February 2005

Chairman
Member
Member
Member
External
•
JyJ.Dr. Sk. Sekender AliProfessor & HeadDepartment of Civil EngineeringBUET, Dhaka.
~v~
Dr. Md. Habibur RahmanProfessorDepartment of Civil EngineeringBUET, Dhaka.
The thesis titled "Integrated Solid Waste Management Approach for EnvironmcntalImprovement: A case study of Sylhet city" by Utiam Kumar Saha, Roll No. 040004] 38F,Scssion April 2000 has been accepted as satisfactory in partial fulfillment of the requirementfor the degree ofM.Sc. Engineering (Civil and Environmental) on 22nd February, 2005
Dr. Md. Mafizur RahmanAssociate Professor(Supervisor)Department of Civil EngineeringBUET, Dhaka.
BOARD OF EXAMINERS
Dr. Md. Delwar HossainProfessorDepartment of Civil EngineeringBUET, Dhaka.
Dr. Shafiul Azam AhmedWater and Sanitation SpecialistWater and Sanitation ProgrammeWorld Bank, Dhaka.

Dfi:CLARATlON
This thesis contains no matenal, which has been accepted for the award of any otherdegree fro111any other institutions. Further to the best of my knowledge and belief, thethesis contains no material previously published or written by any other persons, exceptwhere specific references are made.
Ul~!) V-u~ ~"lv,--/Uttal11 Kumar Saha
"
I hereby declare that the thesis work submitted herewith was performed bv me as aresearch work in partial fulfillment of the requirements for the degree of Master ofScience and Engineering in Civil from Bangladesh University of Engineering andTechnology (BUET)
FebrualY 200S

ACKNOWLEDGEMENT
i ."
Uttam Kumar Saha
III
The author wishes to express his deepest and sincere gratitude to almighty God. Theauthor would like to extend his sincere and special thanks to his Supervisor Dr. Md.Mafizur Rahman, Associate Professor, Civil Engineering Department, BUET for hisincessant able guidance, spirited encouragement and constructive criticism at every stageof this study.
Special thanks are also due to all others those who have contributed directly or indirectlyto the publication of this report.
February 2005
The author also wishes to convey his gratefulness to all staff of Sylhct Partnership andConservancy Department of Sylhet City Corporation for their help and support insupplying necessary data and making arrangement in site visit.
The author acknowledges the sacrifice of his parents and brother in the family that hasenabled him to attain this level. His heartfelt gratefulness to his father in law ShamalSaha for his continuous encouragement in completing the thesis. Special thanks to hiswife Sweety Saha for her invaluable contribution in writing and editing and Ratan KumarDey and Nipa Mojumdar of Sylhet Partnership for their assistance in printing the thesis.
, ,
ABSTRACT
One of the most pressing demands on services of Sylhet City Corporation of Bangladesh fromurban dwellers is better waste management. The conservancy section is responsible for sweepingthe streets, collecting rubbish and disposing to a landfill, drain clearing. Sweeping is carried outby 129 permanent sweepers located in main streets of the city. The City Corporation estimates itcollects between 60 and 80 tonnes of rubbish hom its bins (152 dust bins) and open pomts (60)for disposal daily where as around 180-200 tonne5 of rubbish is produced every day The lanclfillis located a Shol1 distance outside (about 7km) of the city, on 17 acres of land owned by the citycorporation. The land is approximately 3 metres below the level of the road. The site is notengineered and has been used for 5 years. The City Corporation has no Waste Strategv toimprove the cleanliness of the city and reduce the effect of the city's rubbish on the environment.
During the research programme a household survey was done to explore the Clt)' dwellersopinion in tackling the conservancy problems. The survey was cancer survey and done in threeelectoral words of the city. Total 3036 households were surveyed. The waste generation rate is0.34 kg/cap/day Most of the households (73%) produced 1-2kg daily Among the householdwaste, 34.7% is coming from cooking, 27% is coming from homestead activities and the restcovers cosmetics, toilet, education and cloth. The survey shows that 68.3% of total householdwaste is compostable, 11.7% is recyclable and the rest 20% is disposable.
Only little of the total households (II %) preserve waste for recycling About half of the totalpopulation (51 %) in the surveyed area is enjoying additional facilities from some CommunityBased Organizations (CBOs). The households have been bearing Tic 10 to tk 200 monthly forthe CBO who works for waste collection in their locality Most of the residents (934%) of thesurveyed area are quite ignorant abollt the waste management policy ofSylhet City Corporation.
The conservancy activities should include the 100% primary collection of the waste, optimumutilization of waste through intensive recycling, awareness raising on waste education as well aswaste reduction.
The conservancy activities of Sylhet City Corporation should be decentralised in live blocksrather than one centralised area. In order to ensure 100% primary collection of the waste, CityCorporation should encourage the pal1icipation of NGOs and CBOs, and facilitate theseorganisations to dispose their collected waste in some designated secondary transfer pointstimely rather than a number of small dustbins.
Recycling and reclamation should be strongly promoted for conservation of resources andprevention of environmental degradation The city corporation will relive from the heap ofgarbage and its huge amount of budget will be saved and recycled product will also increase thefertility of the soil. The reduced quantity of rubbish will also increase the life of the finaldumping point
IV

TABLI~or CONTENTS
Board of examinersDeclarationAcknowledgementAbstractTable of contentsList of tab lesList of figures
44:li5
23
5778101 ]121422
4
222
II
III
IV
V
\ill!
IX
Page no
Waste GenerationTypes of Solid WasteComposition of City Solid Waste'On Handling, Storage and ProcessingCollectionTransfer and Transp011Processing and Resource Recovel)'Characteristics of CompostDisposal
2.3.12.322.3.32.342.3.52.3.62.3.72.3.82.3.9
Objectives of Solid Waste ManagementTerminology of Solid Waste Management SystemFunctional Elements of Solid Waste Management
v
Profile of Sylhct Cit\' CorporationResources and access to services
2.1222.3
Introduction
GeneralObJectives of the StudyOutline of MethodologyScope and Limitations of the StudyOrganisation of the Thesis
3.'13.2
Conservancy Services of Sylhct City Corporation'
Literature Review
2.0
Introduction
1.I121.3141.5
Chapter 3
Chapter 2
Chapter 1
\Vaste Strategy Framework
Survey Analyses
595961
33
27
585859
5556
27272828282930
303232
3438404449
62636364
3333
i .-
Pilot SchemeExpansion & Improvement+Service Development
Phase-lPhase-2Phase-3
Socio I':conomic ConditionInformation about WastePrimary Collection ProcessCBO's & NGOs involvementInformation about DustbinsLevel of People's Knowledge about the WasteManagement Policy ofSylhet City CorporationPeople's Recommendation for Solving Problem
SweepingRubbish CollectionThe LandfillCollection PointsResou rces- EmployeesEquipmentPal1icipation ofCBOs and NGOs
5.3.153.25.3.3
4.3.7
33. I3.3.23.333.3.43.3.53.3.63.3.7
4.3.14.3.243.343.44.3.54.3.6
The Medium TermThe Long TermCriteria for Selecting Pilot Mohollas and NGOsMonitoring and Evaluation
VI
IntroductionAims & ObjectivesThe Short Term
Objectives of the SurveyMethodologyFindings
RecommendationsSylhet Waste ProductionTypes of Waste
3.3 Sylhet City Corporation Conservancy Services
5.45.55.65.7
5. I5.25.3
4.14.24.3
3.43.53.6
Chapter 5
Chapter 4
j)1 ''C.
.• _,.I ~
.~•

VII
f ,
80
79
69
69
Page
64646567
Opportun ities to Improve the Solid Waste Management of SylhetCityImproving the Solid Waste Management ofSylhet CityCorporation: Key principlesRecolllmendations as well as suggestions for PromotingCommunity based Solid Waste Management system in Sylhet CityCorporation
Refcrcnces & Bibliography
6.3
6.2
6.1
Conclusions and Recommcndations
IntroductionStandardsMonitoring of OperationsPelformance Indicators
5.7 15.7.25.7.35.7.4
Chapter 6
•

List of Tables
Table 2.\Table 2.2Table 2.3Table 2.4Table 3.1Table 3.2Table 3.3Table 3.4Table 3.5Table 3.6Table 4.1Table 4.2Table 4.3Table 4.4Table 4.5Table 4.6Table 4.7Table 4.8Table 4.9Table 4.10:Table 4.\\ :Table 4.\2 :Table 4.\3 :Table4.\4 :Table 4.\5 :Table4.16:Table 4.\7 :Table 4.\8:Table 4.19 :Table 4.20 :
Table 5.1Table 5.2Table 6.\Table 6.2
Page
Quantities of solid wastes generated and collected in different cities of Asia 6Estimated Quantities of solid wastes generated in Bangladesh 6Approximate composition of solid wastes in India, Bangladesh and Europe ,8Chemical Constituents of Compost 14Growth of the Sylhet City from 1991 to 2001 23Resource base / organisations and access to services in the city area 23Business outlet in Sylhet City 25Item wise public expenditure in the Sylhet City c , 26Item wise distribution of public expenditure in the Sylhet City 26A typical day activities for sweepers & labors 29Name of the surveyed area 34Descriptive statistics of the family size 35Quantity of the waste produced by family size 35Occupation of the household 36Primary collector of the waste in the home 40Duration of waste Storage 42Feeling need for preservation 43Items preselved for recycling 43List of the CBO's along with their covering area ,45Cost bears by household for CBO's 46List of the collection rate ofCBO's 47Distance between house and dustbin 48Time to waste disposal in different distance 48The place of the overflowed waste spread out 50The place of overflowed of waste during the rainy season 51Types of problems arises due to air pollution 53Types of problems arises due to water pollution 54Types of problems arises due to soil pollution 54Types of the diseases could be spread out due to health problem 55Recommendation for Solving the existing problem of the City Corporationabout Waste Management 56Indicators of Standard (Work Area Basis) 67Indicators of Standard (Service Area Basis) 68Household, Commercial Units and Population (Block and ward wise) 70Land requirements for composting Activities in Sylhet City Corporation 76- '.
, .VIII
._~

IX
, .
131617182021353637373839394041424444454950525255
57707172737475
7778
8285
PageList of Figures
Figure 2.1 : Basic Composting ProcessFigul"c 2.2 : Barrel CompostingFigure 2.3 : Layout ofa trial Composting FacilityFigure 2.4 : Sections of a composting PlantFigure 2.5 : Typical sequence of composting Week-]Figure 2.6 : Typical sequence of composting Week-8Figure 4.1 : Family size of the householdsFigure 4.2 : Income levelFigure 4.3 : Religion of the familyFigure 4.4 : Trend of livingFigure 4.5 : Category of the housesFigure 4.6 : Sources of wasteFigure 4.7 : Quantity of the wasteFigure 4.8 : Waste storage processFigure 4.9 : Types of waste storageFigure 4.10: Waste preservation for recycleFigure 4.11 : Causes for preservation of wasteFig\ll'e 4.12 : Existence of CBO engaged in waste collectionFigure 4.13 : Household SatisfactionFigure 4.14: Placement of dustbinsFigure 4.15: The leachet takes place from the dustbinFigure 4.16: Time to collect waste from the dustbinFigure 4.17: Regularity of the waste collection from the dustbinFig\ll'e 4.18 : People's knowledge on the conservancy policy of Sylhet City about waste
managementFigure 4. t 9 : People interest to participate in any initiative for raisingFigure 6.1 : Target Area and Key DataFigure 6.2 : Map of Block -AFig\ll'e 6.3: Map of Block -BFigure 6.4: Map of Block -CFigure 6.5: Map of Block -DFigure 6.6: Map of Block -E
Diagram-I: Existing Waste Management in SylhetDiagram-2: Ideal Integrated Approach to Waste Management
Appendix- I : Case Study of Static Windrow MethodAppendix-2 : Household Survey Questionnaire

Chapter 1
Introduction
1.1 General
Rapid urban population growth is one of the important features of contemporary Bangladesh.Approximately one-fifth of the country's population live in urban area, expected to rcach nearly80 million by 2020 (World Bank 1998). The history of systematic dcvelopment and managementof urban areas of Bangladesh structured through the institution of Municipality/Pourashava is aphenomenon of colonial era. The cities and towns of Bangladesh lack the necessary capacities inproviding municipal services like water supply, decent housing, health, education facilities,transportation etc. They depend very much on central government for financial support and arepoorly equipped to meet the challenges of the rapid urbanisation and the rising demands forurban services and kindred basic urban amenities. The pressure of rapid urbanisationaccompanies ecological threats - water and air pollution, abandoned waste. In fact, one ofpressing demands on municipal services from urban dwellers, is better of waste management. Inmost of municipalities, collection of total garbage may not exceed 30:40% of total generation.Although manageable, waste has now become an acute environmental threat in urban areas. Thecity/municipal waste is an acute problem for environment and public health but it receives littleattention compared to the other utility services in all of the municipalities of Bangladesh. Thecase in Sylhet city is no different.
The Sylhet city corporation estimates it collects around 60-80 tones of rubbish from its rubbishbins each day, but that around 180 - 200 tonnes per day is being produced. The differencebetween what is collected and what is produced is thought to be lost to drains or other sources.The collected portion is also dumped in open grounds. Solid Waste Management of Sylhet CityCorporation can be characterized by inappropriate technology and equipment, institutionalinadequacy, inappropriate method of finance, lack of legislation and policy guidelines forenvironmental monitoring and legislation and enforcement. In recent consultation with localresidents and business community, proper waste management has been identified as one of thetop priorities. (Baseline Study ofSylhet Municipality, Asia-Urbs Sylhet Partnership 2001).
1.2 Objectives of the study
The study is aimed to explore the weakness of conservancy services of Sylhet city corporationand to develop a alternative integrated approach for community based solid waste managementwhich is both economically sustainable and environmentally sound.
The following are the major objectives of this thesis o

• To study the CUiTent activities of conservancy section of Sylhet City Corporation toidentify its weakness.
• To undertake a household survey to assess the opinions of the city dwellers to ensure asafe and clean city.
• To collect and analyse the infonnation on community based composting techniques inBangladesh
• To suggest an integrated approach to solid waste management system which is botheconomically sustainable and environmentally sound.
1.3 Outline of Methodology
The methodology to be adopted in this study is literature review of previous studies, review ofconservancy services of Sylhet City Corporation, assessment of city dwellers opinion indeveloping a clean city through household survey in three electoral words.
Dargamahallah, Lamabazar and Kajolshah words are selected to undertake the household surveyprogramme as these words are the representative of the city and slums are not concentrated inthese words and a main road is included in these words to contain shops and businesses.
Determination of effects in terms of environmental aspects results from current unhygienic wastemanagement practices and to explore the current community based composting techniques inBangladesh and to represent a success case study of community based compo sting.
Development a long term city -wide environmentally sound waste management plan in whichnon governmental organisations, individual and groups can take part with their own interest toimplement the plan and which is economically sustainable and environmentally sound.
1.4 Scope and Limitation of the study
The selected study areas constitute high and medium group of people of Sylhet City but in lowincome slum areas the survey results may vary. No actions were taken to measure the chemicalcomposition of wastes. Chemical analysis ofleachete has not been done. As the City Corporationdoes not maintain a separate accounts in conservancy expenditure so it was not possible tomeasure the cost effectiveness between current system and the proposed interview approach. Theinformation presented in this study will influence the policy makers of Local GovernmentEngineering Department as well as municipal/city corporation authority to adapt the proposedcommunity based approach in conservancy services.
1.5 Organisations of the thesis
The thesis presents literature review, analysis of household survey, present community basedcomposting practices in Bangladesh, development of framework for community based solid
2
"

3
,. ,
presents waste strategy framework for short, medium and long term
presents a general discussion on the findings of the study, identifies precIseconclusions and provides a number of recommendations for future study
presents household survey findings
presents the profile of municipalities in Bangladesh and proflle of Sylhet CityCorporation & its conservancy services
includes literature review covering function elements of solid waste managementsystem. Briefreviews of relevant literature are also discussed in this chapter
includes general introduction, objective, outline of methodology, scope andlimitations of the study
References presents a list of relevant publications and reports, which may be useful for futurestudy in this context
Chapter 5
Chapter 6
Chapter 4
Chapter 3
Chapter 2
Chapter 1
waste management in six chapters as shown in below 1n addition, a bibliography of relatedpublications has also been presented.

4
Chapter 2
. ,
Liter:lture Review
In trod n ction
2.2 Terminology of Waste Management System
Municipal Solid Waste Management - includes the cleaning and sweeping of public areasand streets. as well as the pnmary and the secondary collection, transfer and finaldisposal of solid waste. Primary collection is the collection of solid waste at source (fromhouseholds, businesses, institutions etc.) or from street containers, and its transportationto point of transfer. Secondary collection is the collection of the waste from transfer. ,
2. I Objectives of Solid Waste Management
Domestic wastes have three main characteristics: weight generated, density andconstituents. This varies not only from countlY to country but also from town to town andwithin a town according to the status level of different income groups Therefore, norational decision on solid waste system is possible until a representative data of this kindare available.
The key objectives of solid waste management is to minimize the adverse envIronmentaleffects caused by indiscriminate disposal of solid wastes. Sound solid waste managementsystem necessary to raise and maintain the standard of cleanliness of the cityenvironment, particularly in respect of rubbish collection and containment, demonstratethe high standards of cleanliness 01' public land achievable to protect health and theenvironment and to demonstrate an integrated approach to waste 111anagclllcnt at acommunity level and to install a fully resourced integrated infrastructure. In order toachieve these objectives solid waste management system is to be approached in anefficient and orderly fashions through a clear understanding of the fundamental aspectsand relationships of the constitueot elements of waste management It is to be recognisedhowever that problems associated with the management of solid wastes particularly indeveloping countries are complex. This is because of increasing quantity and diversenature of the wastes along with the development of sprawling urban centres, fundinglimitations for public services as well as limitations in both energy and raw materials.
2.0
Solid waste is the term now used internationally to describe non- liquid waste material,which arises from the domestic, trade commercial, industrial, agricultural and minlIlgactivities. Solid Waste Comprises countless different materials: dust food packaging inthe form of paper, metals, plastics or glass, discarded clothing and furnishings gardenwaste, construction waste, factory off cuts and processing wastes, pathological wastes,hazardous and radioactive wastes.

points for transport to the final disposal site. House - to - house collection of waste at thedoorstep.
Recovuy - represents the removal or rescue of post-consumer materials for some typeof rescue or recycling. This often Implies separation, sorting ancl eventual processmg foruse in production.
Recycling - is used to mean the transformation of recovered and stored materials intointermediately products for industrial production (Such as crushed glass or ground orextracted plastic) or the making of the new products for final use, such as the productionof lanterns fTOm steel cans. Reuse (or product in its original form, for the same or a newpurpose within or outside the household. With respect to organic wastes, term recovery orreuse is used rather than recycling: organics may be reused as fuel and may be compostcdfor agriculture and horticulture.
Organic Materials: refers to waste materials, such as food leftovers, vegetable and fruitpeelings and garden waste (also called wet or biodegradable waste).
, ,Inorganic materials: refers to recyclable materials, such as plastics, paper and metals(also called dry waste), which have a potential reeling monetary value.
2.3 Functional Elements of a Solid Waste Management System
The activities involved with the management of solid waste from the point ofgcnerationto final disposal have been grouped into six functional elements namely (I) Wastegeneration, (2) On-site handling, Storage and Procession (3) Collection (4) Transfer andTransport (5) Processing and Recovery, and (6) Disposal.
2.3.1 Waste Generation
\Vaste generation refers to generation of waste at source. Generation of solid waste vanesin different types of dwelling in different socio- economic groups
Waste generation encompasses those activities in which materials are identified as nolonger being of value and either thrown away or gathered together for disposal. Theprimary sources of solid waste include (I) Residential, (2) Commercial, (3) Municipal,(4) Industrial. (5) Open areas, (6) Treatments, and (7) Agricultural, etc.
Factors that affect generation rate
(i)Geographic location, (ii) Season of the year (iii) Frequency of collection (IV) Use ofHome Grinders (v) Characteristics of population (vi) Extent of Salvage and Recycling(vii) Legislation and (viii) Public attitudes.

Urban Run" TotalAdnlinistrative
:: "0 :: ~ :: ~Division 0 0 ] 0 .S "0 .S "0 .S ] 0~ "' '"';: .;: .;: - - .;:
" " E " " ..:; " " " " ":; E "' E "' ~ "' .. E "' E "' ..- ~ "' - ~ = .E - ~ "' - <:: - "'0.. .;: '" .;: '" 0.. - '" .;: '" .;: '" ::" ~J) E " " " - - " <:: "0 '" '" 0 '" "' " '" '" "c. w •• w •• ,,. c. w •• cJ) :.. W •• cD W •• CD~ ~ ~ ~ ~million Kg/cap/day ton/clay million Kg/cap/clay ton/clay ton/clay
Raishahi 2.213 0.5 1107 25.287 0.15 3793 4900~02b.~I. 0.466 0.4 186 7.291 0.15 1094 1280- _._------- .. .- _. ...__ ... - ...
Khulna 1.609 0.5 805 11.634 0.15 1745 25550Dhaka 5.966 0.5 2983 27.974 0.15 4196 7179Chittaganj 2.619 0.5 1310 19.250 0.15 288 4198Svlhet 0.255 0.4 102 6.892 0.15 1074 1136Total 13.128 6493 98.328 0.15 14750 ; 2123
Table 2.1: Quantitics of solid wastcs gcncl'atcd and collcctcd in diffcl'cnt citics ofAsia
)11l..
Source: UNCRD( 1988)
Source (Diaz et al 1998)
6
Estimated quantities of solid wastes generated in BangladeshTablc 2.2:
Depending on the above factors, the generation tates of solid wastes in different citles ancltowns of different countries vary quite considerably Table 2.1 and 2.2 shows thevariation
Citics WASTE GENERATION ' Waste CollectionKg/capita day lOT ton/yea I'
, 10J ton/ycal'Ii
Bombay 0.5-0.6 1150 1150Manila 0.5 1380 1140Bangkok 0.88 1800 1533Kualalamour 1.29 730 . I 730Singapore 0.98 1873 I 943BeiIJintr 1.59 3580 I 2983Shanghai 0.87 2256 12256Tokyo 0.54 4491 ! 3417

, ,
2.3.2 Types of Solid Waste
The principal types of solid waste originating from a metropolitan area include
Food \Vaste: Food wastes are the animal. fruit or vegetahle residues resulting form thehandling preparation, cooking and eating affocd.
Rubbish: Rubbish consists of combustible and non-combustible solid wastes. Typicallycombustible rubbish consists of materials such as paper cardboard. plastics, textiles,rubber, lather, wood, furniture and garden trimmings. Non-combustible rubbish consistsof items, such as glass, aluminium in cans and crockery, ferrous and other nonferrousmetal and dirt.
Ashes and Residues: Materials remaining from the burning of wood, coal coke andother combustible waste. Ashes and residues are normally composed of fine powderymaterials. Demolition and construction waste includes dil1, stones, concrete, brick plaster,timber,' shingles, plumbing, heating and electrical parts.
Special Wastes: Waste such as street sweepings, roadside litter, litter from municipallitter container, catch basin, debris, dead animals and abandoned vehicles are classified asspecial wastes.
T,'eatment Plant Waste: The solid and semisolid waste from wastewater and industrialwaste treatment facilities are included in tillS classification.
Agricultural Waste: Wastes are residues resulting from drivers agricultural activitiessuch as the planting and harvesting arrow, field and tree and vine, crops, the productionof milk, the production of animals for slaughter and operation offeedlots are collectivelycalled agricultural waste.
Hnzardous waste:
Chemical, biological, flammable. explosive or radioactive waste that pose a substantialdanger, immediately or over time to human, plant or animal life are classified ashazardous waste.
2.3.3 Composition of City Solid Waste
Information on the composition of solid waste is important in evaluating alternativeequipment needs, system and management needs, system and management programs andplans
Physical Composition: Information and data on the physical composition of solid wasteare important in the selection and operation of equipment and facilities in assessing thefeasibility of resource and energy recovery and the analysis and design disposal facilities
7

.- ,"
The percentage of municipal solid waste components varies with location, seasoneconomic conditions and many other factors.
Chemical Composition
Information on the chemical composition of solid waste is important in evaluatingalternative options. Table 2.3 summarizes and compares typical composition of solidwastes from developing and industrialized countries.
Table 2.3: Appl'Oximate composition of solid wastes in India, Bangladesh andEurope
Bangladesh *EuropeWaste Components India ('Y-Iby weight) (Dhaka)
(% by weil!ht) (% by weight)
Food and Vegetable 7570 30waste
Paper products 2 4 : 27Plastics I 5 : 3 IRags 3 - ; 3Metals 0.1 0.13 I 7Glass and ceramics 0.2 0.25 , II,
Wood - 0.16 ! -IGarden wastes - II I 4-6,Others (stones, dirt
7 5 I 0
etc) 0
-----._---Moisture content 22-32 65 15-35Source. (after Cairn cross & Feachem, 1993) * [FRO & BCS1R(1998)
2.3.4 Online Handling Storage and Processing
Those activities associated with the handling, storage and processing.'
Onsite HaJl(lIing
Online handling refers to the activities associated with the handling of solid waste untilthey are placed in the containers used for their storage before collection. Depending onthe type of collection service handling may also be required to move the loaded containerto the collection point and to return the empty container to the point where they are storedbetween collections.Domestic wastes accumulated at several locations in and around low and medium riseresidential dwelling are placed in large storage container to await removal by wastecollection agency. Where curb collection is used the resident is also responsible forplacing the loaded storage container (s) at the curbs and for returning the emptvcontainers(s) to their storage location next to or in the dwelling. In high-risc ap"rtmcnts
8
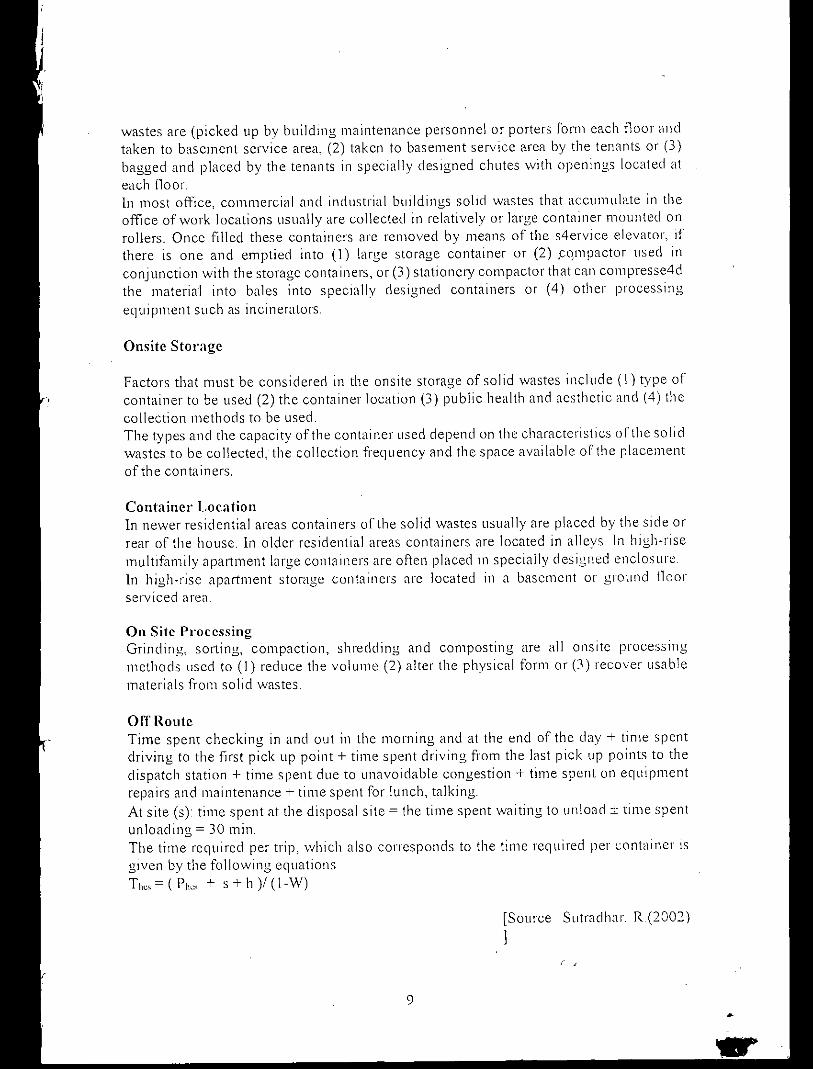
wastes are (picked up by building maintenance personnel or porters form each floor andtaken to basement service area, (2) taken to basement service area by the tenants or (3)bagged and placed by the tenants in specially designed chutes with openings located ateach floor.In most office, commercial and industrial buildings solid wastes that accumulate in theoffice of work locations usually are collected in relatively or large container mounted onrollers. Once filled these containers are removed by means of the s4ervice elevator, Ifthere is one and emptied into (1) large storage container or (2) .cqmpactor used inconjunction with the storage containers, or (3) stationery compactor that can compresse4dthe material into bales into specially designed containers or (4) other processingequipment such as incll1erators.
Onsite Storage
Factors that must be considered in the onsite storage of solid wastes include (I) type ofcontainer to be used (2) the container location (3) public health and aesthetic and (4) thecollection methods to be used.The types and the capacity of the container used depend on the characteristics of the solidwastes to be collected, the collection ti'equency and the space available of the placementof the containers.
Container LocationIn newer residential areas containers of the solid wastes usually are placed by the side orrear of the house. In older residential areas containers are located in alleys In high-risemultifamily apal1ment large containers are often placed in specially designed enclosureIn high-rise apartment storage containers are located in a basement or ground iloorserviced area.
On Site ProcessingGrinding, sOlting, compaction, shredding and composting are all onsite processingmethods used to (I) reduce the volume (2) alter the physical form or (3) recover usablematerials from solid wastes.
Off RouteTime spent checking in and out in the morning and at the end of the day + time spentdriving to the first pick up point + time spent driving from the last pick up points to thedispatch station + time spent due to unavoidable congestion + time spent on equipmentrepairs and maintenance + time spent for lunch, talking.At site (s): time spent at the disposal site = the time spent waiting to unload:!: time spentunloading = 30 min.The time required per trip, which also corresponds to the time required per container isgiven by the following equationsTh" = (Ph" + s + h )/ (1-W)
[Source Sutradha r. R (2002)]
, ,
9

2.3.5 Collection
Stationery Container System
These are collection system in which the container used for the storage of waste remain atthe point of generation, except for occasional short trips to the collection vehicle.
( ,
StationalY container system may be used for the collection of all types of wastes. Thesystem varies according to the type and quantity of waste to be handled, as well as thenumber of generation points. There are two main types (I) system in which self-loadingcompactors are used and (2) system in which manually loaded vehicles are used.
Residential Collection SCI"vice
Low-Rise Detached Dwellings - the most common Types of residential services used are(1) curb (2) alley (3) set out - set back (4) set -out and (5) backyard carryWhere curb service is used, the homeowner is responsible for placing the containers to beemptied at the curbs on collection day and for returning the empty containers to theirstorage location until the next collection.Where alleys are part of the basic layout ofa city or a given residential area alley storageof containers used for solid wastes is common.In set out set back service, containers are set out set out from the homeowners prope11yand set back after being emptied by additional crews that work in conjunction with thecollection crews responsible for loading the collection vehicle.Set out service is essentially the same as set out - setback service except that thehomeowner is responsible for returning the containers to their storage location.In backyard carry service, the collection crew is responsible /(lr entering the:homeowner's property and removing the waste from the storage location.Methods of loading the collection vehicle may be classified as either manual ormechanical Methods commonly used for residential wastes includes (I) the directlifting and canymg of containers, (2) the rolling of loaded containers on their rim, (3) theuse ofsmalilifts for rolling the containers to the collection vehicle and (4) the use oflarge containers ("toto") or drop cloths into which wastes from small containers ~Heemptied before being carried or rolled to the collection vehicle.
Where collection vehicles with low loading heights are used, wastes are transferreddirectly from the containers in which they are stored or carried to the collectlon vehicleby the collection crew In some cases where open body are used crew members stationedon the truck will lift the loaded container into the truck with the help of the collections onthe ground, empty the container, and return it to the collectors on the ground.Evaluating alternative processing and recovery options.
, ,
10

Comnlc)"ciai-Indllstrial sel"vi{'p's
The collection service provided to large apartment buildings and commercial activitiestypically is centred on the use of large moveable and stationary containers ane! largestationmy compactors.
Communal Collection
In this system householders discharge their waste into the communal bin at specrficlocations over a considerable distance and refuse collection vehicle collects theaccumulated waste at a frequent interval, usually once in a day in most of the third worldcountries this type of collection system is followed.
2.3.6 Transfer and transport
The functional elements of transfer and transport refers to the means. facilities, andappurtenances used to effect the transfer of waste from relatively small collection vehicleto large vehicles and to transport them over extended distance to either processing centresas disposal sites. Factors that tend to make the use of transfer operations attractiveinclude (I) the presence of illegal dumps and large amounts of litter (2) the location ofdisposal site relatively far from collection routes (typically more than 10 mile) (3) the useof small capacity collection trucks (generally under 20 Yd3) (4) the existence of lowdensity residential areas (5) the widespread use of medium -sized container for thecollection of waste hom commercial sources and (6) use of hydraulic or pneumaticcollection system. Transfer and transport operations became a necessity when hauldistance to available disposal site or processing centres increases to the point that directhauling is no longer economIcally feasible.
[Source Sutradhar., R.(2002)]
Transfer stations
Important factor that must be considered in the design of transfer stations includes-
I.type of transfer operation to be used2.capacity requirement.3.eqllipment and accessory reqllirernent 4.sanitation requirement.
Types of tnlllsfcl' station
Depending on the method used to load the transfer vehicle transfer station mav beclassified into 4three types -
Direct discharge (2) storage discharge (3) combined direct and storage dIscharge.
II
; .

, ,
12
(68%)(11%)
Organic, made up offood and garden rubbishRecyclable paperInorganic (21%)•
••
Composting is the process of bacterial conversion of organic solid and semi solid wastesinto compost which can be handled, stored and transported without any adverseenvironmental effect, and can be used as organic manure for improvement of soil qualityand feI1i1ity. Composting is an ancient resource recovery process practiced, though lessfrequently, in both developing and industrialized pal1s of the world. Composting hastaken a beating in some western countries with collapse of markets associated with thehigh costs sophisticated processing techniques, yet the system appears to presentedpotential solutions in high population cities of the developing worlds, where wastecharacteristics are suitable for such method of resource recovery.
The main purposes of processing arc to improve the efficiency of operatioll, to recoverresources and to recover cOllversion products and energy. Important processingtechniques used routinely in municipal solid -waste system includes: compaction,thermal volume reduction (incineration) and manual separation of waste components.
1. On a small scale, espeCially developed for slums, but equally applicable tohouseholds with a garden, is barrel composting This IS suitable for one to sixhouseholds and produces suitable compost In around three months. Themateria! can be used on the gardens or sold to growers.
Community based composting is an integral part of integrated solid waste management.
2.3.7 P,'ocessing and Resource Recovery
Composting plays an impol1ant role in reducing the amount of rubbish being disposed tolandfill and places value in rubbish as a resource, recycling it into a product that can beused to improve soil texture and crop yields Composting can reduce the demand on theCity's secondary collection, while supplementing the local economy and improving theenvironment.
Composting
The overall moisture content orcolleeted residential waste may be as high as 500/0.
IVIethods of Community Composting
Quautity of Rubbish suitable for COlllpostiug
Community composting can be done in two different methods.
There are three main components to household rubbish:
" ..
Non-Compostables
Salvageable
13
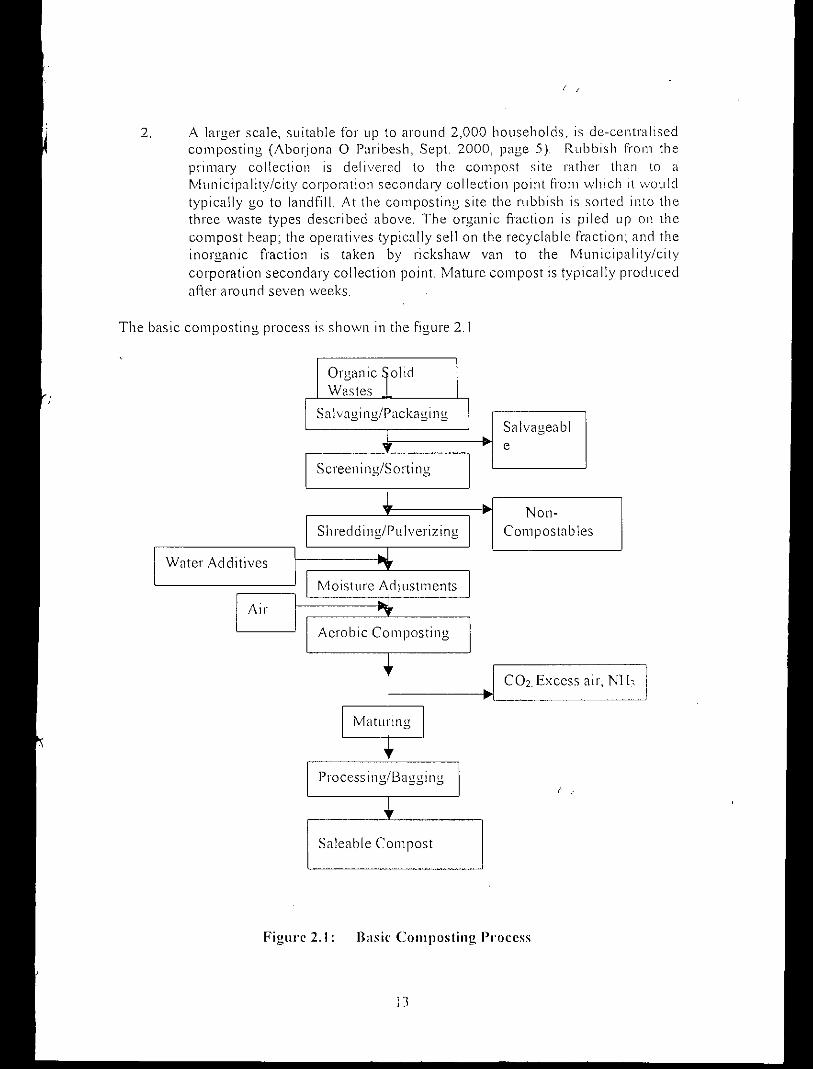
Basic COlllposting Process
------~ICO2 Excess air, Nl-h I
Moisture Adjustments
Saleable Compost
Organic olidWastes
Aerobic Composting
Shredd ing/Pu Iverizing
Sa lvagi ng/Packaging
Screeni ng/Sorting
Figurc 2.1 :
Air
Water Additives
2. A larger scale, suitable for up to around 2,000 households, is de-centralisedcomposting (AbolJona 0 Paribesh, Sept. 2000, page 5) Rubbish from theplimary collection is delivered to the compost site rather than to aMunicipality/city corporation secondalY collection POII1lhom which It wouldtypically go to landfill. At the composting site the rubbish IS sorted into thethree waste types described above. The organic fi'action is piled up on thecompost heap; the operatives typically sellon the recyclable fraction; and theinorganic fraction is taken by rickshaw van to the Municipality/citycorporation secondary collection point. Mature compost is typically producedafter around seven weeks.
The basic composting process is shown in the figure 2.
14
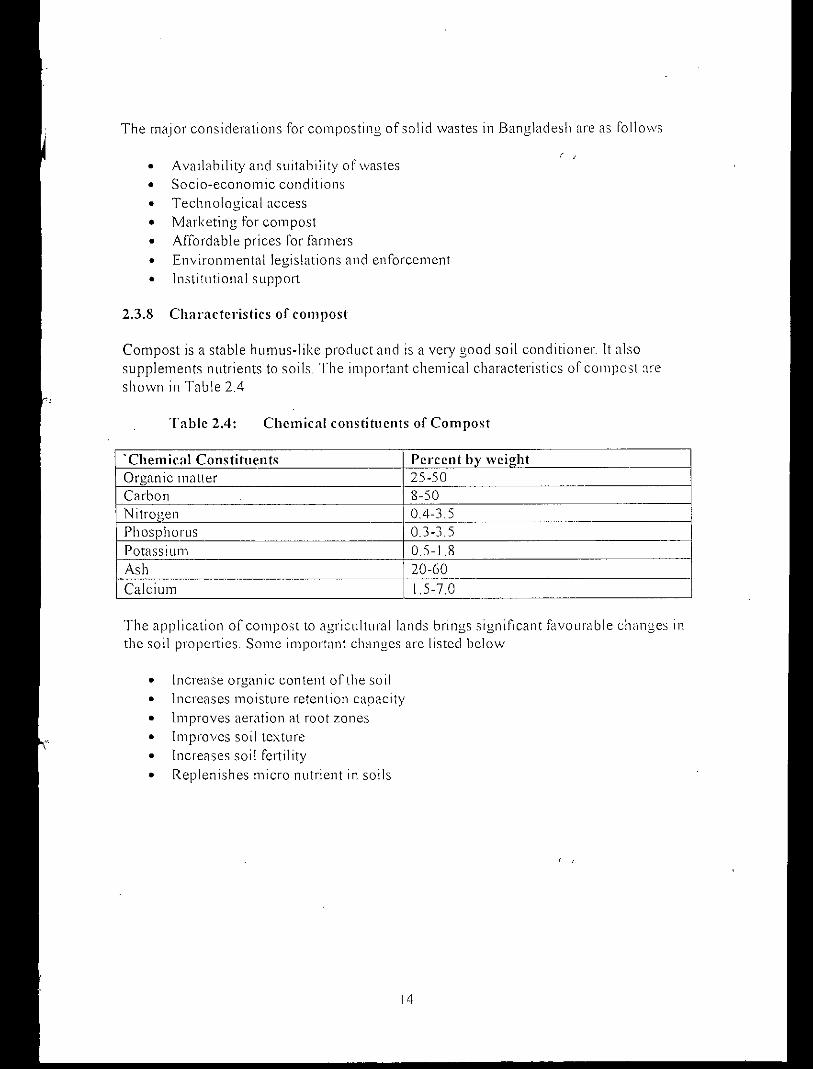
2.3.8 Characteristics of compost
Chemical constituents of CompostTable 2.4:
• lncrease organic content of the soil• Increases moisture retention capacity• Improves aeration at root zones• Improves soil texture• Increases soil fel1ility• Replenishes micro nutrient in soils
, ,
• Availability and suitability of wastes• Socio-economic conditions• Technological access• Marketing for compost• Affordable prices for farmers• Environmental legislations and enforcement• Institutional suppol1
The application of compost to agricultural lands brings significant favourable changes inthe soil propel1ies. Some important changes are listed below
Compost is a stable humus-like product and is a very good soil conditioner. It alsosupplements nutrients to soils. The important chemical characteristics of compost ~lreshown in Table 2.4
The major considerations for composting of solid wastes in Bangladesh are as follows
'Chemical Constituents Percent bv we;ahtOrganic matter 25-50Carbon 8-50Nitrogen 0.4-3.5 I
Phosphorus 0.3-3.5Potassium 0.5-1.8Ash 20-60Calcium 1.5-7.0

15
Placement of Barrel
i ,
>- The base of the barrel should be placed on elevated surface (6" from groundlevel) to avoid ralll water or Ilood
r The base should be ring shaped and macle of bricks, sand ancl cement.r The ring will be hollowed in two positions to ensure the supply of sufficient
oxygen and to collect the compost~ The gap between barrel and ring shape will be minimal
• The capacity of barrel can be of45 to 200 litres depends on availability in themarket
o To ensure the supply of necessary oxygen in the barrel and to avoid anaerobiccondition a number of hole (OS" dial will be made in the base and sides orthebarrel.
• The barrel must be covered to avoid rainwater. The cover of the barrel will beslightly larger than the diameter of the ring shaped base
• I sft size door system must be kept in the lower pOl1ion of the barrel to collectthe produced compost
• The barrel should be painted to avoid fungal attack and erosion. The barrel usedfor composting will be painted in green colour and the barrel used for collectingdisposable waste is yellow colour
In placement of barrel following points should be considered
Ba •.•.el Composting
COInposting Barrel
Methods of Compo sting

Figure 2.2 : Barrel Composting
Windrow Method
In this method, compostable organic waste is heaped into piles under a covered shedmade with steel angle posts and asbestos groping on top which al10ws the beneficialmicro organism to decomposed the organic waste efficiently. The pile is aerated withbamboo aerators. Fig. 2.3 and 2.4 shows layout of a trial composting facility and sectionsof a compo sting plant.
, ,
16

•
Section
Section
lns
~ Solid
17
BACK OF PLOTSOl1ing AreaSol id ground slab
(Preferably Concrete Construction)
l
s
:~..,I ".
( "\./I:.::
I I I I I I I ! ! ! ! I ! ! I ! ! II I I ! ! ! ! ! ! ! ! ! ! ! ! ! ! ! Ii I ! ! I ! ! ! I ! I ! ! ! ! I ! ! Ii14'wiele S01id slab walkway
( ,':.....': ..:':.:v:(~: :':,:':.:':~',:'..:':.::~':.:' :.::.:: ..... "::'::':.:' ..:'..:':.:':,:':.:';.';~ ,';.,';.
11~:
s t~ ::~:(
V :.~ j .,::~nsiom ~:i:
(:.,':.::.;>:.>: ,':<:<,:>~:<: :I., ;";.:';.:";.,",; ::.:":.:":.:";.:";.:':.,:<",,':.:": •.<,:' :>:>:, ,
:~::
l!~ Ai:,{ >~~:,.,.,:;.:.;':,.,.:.:::.,:;.:.;.;.:.'.:.;.::.: ......... •.:.....:'..,..i. :.:":.:':.:':.,":.:":.:::.;':.:::.:::.;':.:". .;-
Ri ks law V~
Figure 2.3 Layout of a trial cOlnposting facility - -
A
4 No.Maturing BayBEach havingInternal Dime(Plan)
DETAIL1/
Wall9 No.Compost Bay(Plan)Removable
Layout of a trial composting facility

I
I
I!oiI
I
II
I
I
I
"iI
I
I
I
•• (>".,
" ,
enter and lea
Solid wall6' High
:":\':.'::':':::<:
.................i
RemovableWalls
6' clear height to roof truss
Bays internal dimension
Packaging Area
7' clear height to rooftnlssWidth of Site
Suitable foundations & Walkway slab
Solid Wall(,' High
~Suitable foundations & Walkway slabs
DETAIL IThis detail IS typical for all intersections between solid walls and removable walls.
I
IWal~way
-"~-----~lo- <rl •• -••------~~ <l
18, ,
Solid Walls.i<}Figure 2.4: Sections of a compi;~t)ji'i? plant.............
,:;',:,:',::',:,
Solid wall5' High
I
IWall~way
<l
6")
SECTION B
SECTION A

Typical Sequence of Openltion of \Vindrow Compo sting Facility
The following diagrams set out the typical order of progress ofa week's compost throughthe facil ity
The sequence is as follows:
Week I
Each bay in the first row is filled with compostable rubbish over two days (Figure 2.5)
Week 2On the first day of the second week, the first bay in the first row is moved to the baybehind, in the second row.The first bay in the first row is then filled over two days.Each of the bays in the first row is moved in a similar method
Week 3
On the first day of the third week, the first bay in the second row is moved into the rowbehind, in the third row. In addition, the process begun in week 2 is repeated
Week 4
On the first day of the fourth week, the first bay in the third row is moved Into one of thematuring bays The process described in week 3 is repeated. r ,
On the tlmd day, the second bay in the third row is moved into the same maturing bay aswas placed the first day. Similarly, on the fifth day the third bay in row three is mo\cdinto the same maturing bay. One maturing bay has been filled and will remain in placefor 4 weeks.
Week 5
The maturing bay filled in week 4 remains untouched.The process described in week 4 is repeated.wlth a different maturing bay beingfillec1over the week.
Week 6 & 7The process in week 5 is repeated with the two remaining maturing bays.
Week 8
The maturing bay filled in wee4 is removec1 and packaged for sale The bav IS refilledover the course of the week. (Figure 26)The process continues in thIS f~lShioll.
A case study on state window method has been shown in Appendix-I
19

Solid, ..
5&6
Removable \ lalls
3&4
20
Sorting Area
Figurc 2.5 Typical scqucnce of Compo sting
Days I & 2
Week 2WallsCompost Bays
Week 3Compost 13ays
Weeks 4 to 7Maturing Bays
Week ICompost Bays
WEEK 1
Week S +Packagi ng Area

WEEI< 8
Packagi ng Area
Week ICompost Bays
Week 2Compost Bays
Week 3Compost Bays
Weeks 4 to 7Maturing Bays
Week 8 +Packaging Area
So Iting Area
Days 1 & 2 3 & 4 5&6
iF
/ /'/
"""""V g~:~::~::~:::~::::1.'~~''''~''~''''''' •. / .•/. ,..,1': .••..'~'''''~'''''.''''''./ ..".. /., .~,'.•••, •••••••••••y" ••••• /' ","'./ ., ••~••••
:000~1~•••...-..-.AV'V' ..•..•.•••.•" •• " _••'_••••./".."...•••.•.v •...",.. ..•.•.••.••.....,r...,. .......,........... .•..•.•,...•,....." ..."..v .•~,,~ ..•~... ~.' ........./".••/.if. v"v••••••.v'~••.••,•.-.'.",
-') <- < .<~\(,/.••/ .••<..........~.......,....J",;,,,~,.",,-.v", ••••.••••.•" ••.....;.."' ..,,...,..••~•... ,."...,.. .•..';, ..•.•'.,/....•.•..•..... ,.~""~~"'•••.•.....' ;<f:'~j ~-:::~::-:;:::~:~., .••••••..,.•••••..•.••••••-•..,.....-.••V' •••••'..::<..•.....<-.< ..•::.~ ................
•....................... -................................................................................................................. ...................................... ................................................................................................................................................................................................................................................ .. .......................................................................................... ............................. .... ....-
Figure 2.6 Typical sequence orComposling
21

2.3.9 DisJlosal
Waste disposal on land has always been the lowest cost disposal option. Alternativemethods such as composting or incineration usually, but not always, involve the use ofhigh cost capital plant and equipment that needs skilled management and labour and arealso costly to operate. The term san italY landfill means an operation in which the waste tobe disposed of are compacted and covered with a layer of soil at the end of each daysoperation.
The factor that must be considered in evaluating potential solid waste disposal siteincludes (I) available land area (2) impact of processing and resource recovery (3) hauldistance (4) soil condition and topography (5) climatological conditions (6) surface waterhydrology (7) geologic and hydrologic condition (8)local environmental condition (9)potential ultimate use for the completed site.
i ,
22

Source: Baseline study of Sylhet Municipality, Asia Urbs Sylhet Partnership (2002)
Chapter 3
23
Resource base/ol'g:lnizations & access to services in the city area
Growth of the Sylhet City from 1991 to 2001
Table 3.2:
Table 3.1:
Description QuantityElectricity distribution line (km) 1,609.1Electricity consumer (no) 54,494Households havin" electricitv (oercentl 90.9Households with Cable Connection (percent) 27.5
Items In 1991 In2001 PCl'ccntngeChange
Area (Sq km.) 16.92 26.05 54.0Households 14,068 49,628 252.8Population 109,000 285,308 161.8
Male 61.000 156.010 155.8---_ ..- -- .. ,
Female 48.000 129,298 169.41 Household size 6.8 5.6 (21 .4)Ward 5 13' 160.00Mahalia 94 ;01* 113.8Density (no per sq.km.) 6.442 10,952 70.0
Conservancy Services of Sylhet City Corporation
, •.
3.2 Resources and access to servicesWaste generation having depends on no. of population and recourses of the cityThe physical resource base of the City Corporation is repol'ted in the,table (3.2)
The City widens by more than 50 percent during the 1O-year period. Household and populationexpanded clue to horizontal expansion of the City as well as the growth of population.Household size is becoming smaller and is now 5.6. The rate of decrease is about 2.1 percent perannum during the period of 1991 to 200 I. Population density was 6,442111 1991 and increased toabout 70 percent in 2001. This indicates that the city is becoming extremely crowded.
Sylhet City Corporation began functioning in 1878 with 5.82 sq.km. area and almost 17 thousandpopulations. At present its area increased to 26.05 sq.km. and population approximately 5hundred thousands. Table 1.1 presents the extent of the growth of this city during the last 10years period.
3.1 Profile of Sylhet City Corporation

24
I
Pucea Roads (km.) 41 83Pucca drains (km.) 18.09Kutcha drains (km.) 70.79Box culvert 35Bridge 3Gravevard 4Crematori um 2Concrete made bins for waste deposit 160Normal garbage truck 7Push can 20Schools & colleges 63Children park 7
Museum IAirpol1 IBanks 26Press club ITelegraph office IChamber of commerce (business association) IDistnct bar association IRed crescent organization IFreedom fighter association IDistrict sports association IJ"eI'.'~L,,-ass oc iati0!1__ .. I--~. . - ---- . ._----- ---
Spons club 4Academy for children ICultural academy ICircuit house IResIdential hotels 125Department rest house 9Pariatan motel IBus & rail station 2+1 =3General hospital 2Maternity & child care hospital 3Infectious disease hospital ,
ITB hosoitaJ 1EPI centre 29Post office 19Co-operative association 85Restaurants, hotels and community centres 270Police st<:ltion 2 .-
, ,
Source: Baseline study ofSylhet Municipality. Asia Urbs Sylhet Partnership (2002)
It appears from the table (3.3) that the City Corporation has a number of educational institutes,hotels, community centers, restaurants, banks, pharmacies and health clinics. These offices,business centers and institutions are producing a quantity of waste daily

25
Source: Baseline study ofSylhet Municipality, Asia Urbs Sylhet Partnership (2002)
Busiuess outlet in Sylhet cityTable 3.3:
From the table (3.3) it is clearly seen that the city area has a less no of industry . In this senceSylhet cities waste is almost fi'ee frolll chemicals except in health care waste.
Quantity--~
DescriptionDepartmental store 41
Jewellery 155Whole sale dealer 35
Bakery 40Rice mill 35Flour mill 16Saw mill 3
Hotel & restaurants 185 --Tea stalls 5r-------
Grocery shop 944Beddin" store 35Fruit stall 22Fish shed ",~
Vegetable shop 26Meat shop 35
Tobacco shop 2
IEngi neeri ng/co nsu Itan cy 27
Hardware store I 15Sanitary store 45
Printi ng/s tati ana ry 74Snacks bar 55News stall 5_. --Shoe store 105
Welding shop 102Sweetmeat 21
Coaching centre 10Photography 54Mus ic centre 35Video centre 52Cinema hall 6
Community centre 26Other shops 10,251
Total

26
,- ,
, ,
Item-wise public expeuditure in the Sylhet City
Item-wise distributiou of public expenditure in tbe Sylbet Ci(v
Table 3.4:
* Data include water supply and sanitation projects of9 district cities.
Table 3,5:
Year Establishment Health 8:. Sanitation Education In fras tru ctu re Other% % % % %
1995-96 14.97 3.18 0.11 8143 0.311996.97 14.76 3.85 0.39 80.26 , 0.731997.98 16.90 11.33 0.94 70.06 0.781998.99 26.02 2346 2.00 46.69 I 831999.00 17.13 26.3 I 1.56 58.90 1.11
Year Establishment Water, Health Education 1nfras tru ctu re OtherTaka & Sanitation Taka laka laka(nominal) laka (nomina!) (nomina!) (n 0111 in a!)
(nolllinal)1995.96 13442773.00 2858789.00 97200.00 7313417500 278586.0
01996-97 14616095.00 3816217.00 384350.00 79455302.00 726395.0
01997-98 15285900.00 10252950.00 846730.00 63372499.00 701652.0
01998-99 15043800.00 13568785.00 1156922.00 2700187600 1055725
001999.00 15776898.00 34218105.00 2034595.00 76611342.00 1439590.'---_. 00- ._ .. -~-- - ,_.
Source: Baseline study ofSylhet Municipality, Asia Urbs Sylhet Partnership (2002)
From the table (34 and 3.5) it can be said that the allocation and expenditure in water, health andsanitation sector is increasing. The figure indicates that the policy makers of city corporation areconsidering the waste management with importance.
The components of water, health and sanitation are purchase of bleaching powder, repair ofmachinery and equipment of the water supply system, cleaning of drainage and garbage, buyingof medicine, health equipment, insecticides, immunization programme, other buying and repairsA major proportion of the City expenditure goes to infrastructure development This includesland development, repair and construction of bridge, culvert, drain, market, butlding, rOilds, parlebus terminals and other construction and repairs

3.3 Sylhet City Corporation - Conservancy Section
The Current Situation
The Conservancy Section is responsible for sweeping the streets, collecting rubbish anddisposing to a 'landfill'. The section is the responsibihty of the Medical Officer and is supportedby one inspector and 7 supervisors.
3.3.1 Sweeping
Sweeping is carried out by 129 permanent sweepers located in main street of the city andsuppoI1ed by a number of labourers hired on a daily basis. Main streets are programmed to beswept every day, while the majority of side streets and residentIal streets are not swept at all bythe City Corporation. The sweepers spend some time clearing drains., The duties of thesupeIvisors and inspector are unclear. The inspector stated if he was told of a problem on thestreets then he would attend. It is not clear whether the sweepers are checked. The tools used bythe sweepers are limited to a brush. having no handle, and a flat wicker basket into which litter ISswept
3.3.2 Rubbish Collection
Rubbish Collection occurs at 152 City provided rubbish bins and there are bo ad -hoe collectionpoints. A concrete box with one side +open and roughly 1.5 metres wide by 10 m deep identifiesthem. Trucks undertake daily rubbiSh collection from all bins. Men with shovels empty the binsinto the truck, and unload the rubbish at the 'landfill' in a similar way. Collection of rubbishappears to occur only six days a week, Fridays being a day off It is on these days that the streetsbecome considerably di,1y and covered with piles of rubbish. The loading of rubbish into thetrucks is carried out using nat wicker baskets and a pick type shovel. This takes a long time toclear a bin and contributes significantly to the delay in clearing rubbish across the city
The City Corporation estimates it collects between 60 and 80 tonnes of rubbIsh from its bins fordisposal every day, but that around 180-200 tonnes of rubbish is produced every dav Theamount not collected 'disappears'. mostly into drains. Consequently the draIns are invariablv fulland have 110 capacity for carrying rainwater.
There are four main issues associated with rubbish bins.Bins are located next to or on top of drainsThe construction of the bins is insuiTicient. The bins are too small for the amount of rubbishbeing placed in them, and in some cases a bin does not exist.All sites have insufficient hard surfacing for storage of the rubbish and all have insuffIcientboundaries to contain the rubbish and prevent It falling in to the drainsThe bins are not always completely cleared of all rubbISh when they are emptiedThere are too few bins.
27

3.3.3 The 'landfill'
The landfill is located a sholt distance (about 7 km) outside of tbe city, on 17 acres of landowned by the City Corporation. The land is approximately 3 metres below the level of the roadthat runs along sided it and dumping radiates from an access point on the road. The sIte is notengineered and is simply rubbish dumped on open land. The land is susceptible to floodingduring the rainy season, and was covered in water at the time of the visit. The site is notengineered and has been used for 5 years
There are no controls over what wastes are being placed in the site. Clinical waste lS beingdumped here at the same time as other rubbish. The site has approx'imately a dozen peopleworking on it, primarily sOlting the rubbish and removing valuable materials such as paperThere is a clear severe health risk for these people from, not least, the clinical waste. lt wasunclear whether these people were employed by the City Corporation, or if the City Corporationsimply allowed anyone to sift through the rubbish. [n any case, the City Corporation has aresponsibility to protect people 1i'om the hazards it is creating here.
Floodwaters come up to the rubbish. There are complaints from the local farmers about thesmell. The site has no engineering and it must be assumed that water and land is being poll uted.It is likely that food produced adjacent to this site will contain elements hazardous to health andother elements in quantities in excess of WHO recommended safe levels for human health. Thesite has no clean water facilities for drinking and washing.
3.3.4 Collection Points
The City Corporation unde11akes collections of rubbish from some 200 locations around the city.It is estimated that 135 of these locations are designated areas with rubbish bins provided by theCity Corporation. In addition, there are some 60 or so other ad-hoc collection points which arenot technically designated as Municipal collection points, although collections are made ii'omthese.
City Corporation rubbish bins were originally provided in the form of a concrete structure, butover the years these have disappeared or fallen into a bad state of disrepair, with many locationshaving rubbish lying on open ground without any form of containment. Many collection pointsare adjacent to or over drains and invariably the drains are full of rubbish.The rubbish placed at collection points becomes scattered about mainly as a result of tbescavenging that goes on for recyclables, such as paper products. FU11hermore, cows are oftenfound at collection points, probably placed there by their owners. Both tbese practices aredetrimental to maintaining a clean area.
3.3.5 Resources - Employees
The Conservancy section employs of permanent labour and day labour, hired on a daily basis, asfollows:
28( .

29
Source: From Conservancy Section ofSylhel City Corporation
i57 No. at Tk 60 per day (to be confirmed)17 No. at Tk 80 per day2i No. at Tk 60 pcr day20 No. at Tk 60 per day10 No. at Tk 2,700 per month8 No. at Tk 2,700 per monthi No. at Tk 3,800 per month (inclusivc of Bonus)
A typical day activities 1'01' sweepel's & laboul'sTable 3.6 :
SweepersDump Labourers (hire)Day Labourers (Ime)Night Labourers (hire)Truck driversSupervisorsInspector
There are three shifts during which differing numbers of trucks and labourers are employed onrubbish collection: Table 3.6 shows a typical day activities of our labour
Methodology
Approximately Tk1 ,25,000 is spent on fuel for 8 trucks each month.
3.3.6 Equipment
This calculates to a total labour cost ofTk 66,00,000 per year.
There does not appear to be any routine maintenance of vehicles carried out such as oil change. Itappears that maintenance, or more accurately repair, is carried out when the vehicles breakdown.
The section has two 2 tonne compaction-typc vehicle donated as a gift by Hiroshima City inrecognition of the two cities being twinned. The City Corporation owns 10 vehicles 8 NO.3tonne trucks and 2 NO.2 tonne compaclion type vehicles. There are currently 2 trucks out ofservice with englnc problems, one for 16 months and the other for 6 months.
In the period 9am to 12pm. there is a total of 32 employees on rubbish collection, and amaximum 01'5 trucks. The number of trucks reduces to 3 at 12pm The 20 sweepers employed onrubbish collection are drawn from the total i57, so that the number of sweepers carrying outsweeping is reduced.
Of the 21 day labourers employed, it is usual for 12 to carry out rubbish collection and,depending on labour availability, 9 carry out drain clearing.
6am to 12pm 9am to 5pm 5pm to 9pm 9pm to 4am to 6am4am
Sweepel's (no.) 20 NIL NILDay laboul'el's (no.) J7 N1L NlI_Nightla bouI'CI's(no.) NIL 20 NILTrucks 5 5/3 NTL 5 NlI"

The conservancy team knows the locations of the rubbish bins, but there is no map or record oftheir location. Similarly, the routes 0[' the trucks are known but are not recorded. Principally,there are 5 routes covering the centre of the city during the morning, and 5 serving either thecentre or main roads around the CltV at night In the al1ernoon, three vehicles are typicallyassigned to residential areas but in practice, these carry Ollt 'fire-fighting', providing areactionary service to clear 'demand'. DUring the night one vehicle services solely the marketopposite the post office in the centre of the city. On the whole, each vehicle removes 3 or 4truckloads of rubbish at night, and 2 truckloads removed by each truck during the day. Maps ofday and night collection rounds has been prepared as pal1 of this review with the help of theChieflnspector of the Conservancy section.
3.3.7 Participation of NCOs S<CBOs
Currently a number of NGOs and Community Based Organisations have established PrimaryCollection Schemes in some four parts of the City.
These schemes have focused on building residents' awareness and participation in puttingrubbish out in a more satisfactolY method. The schemes have achieve~ success rates of at least85%
It is clear that NGOs and CBOs playa vital role in bridging the gap between residents and the.SecondalY Collection undel1aken by the city, and demonstrates that evelY sector has a role intaking responsibility for maintaining a clean city.
From discussions with the Cit), Corporation inspector the following observations are clear:
There are J1C;lrly always 5 trucks Glrryi/lg out rubblsil collection, except in the afternoon sill/I.However, the rote of rubbish collections is not set and on any particular day trucks may carty outreactive work to clear rubbish where complaints are being raised, where 'demand' requires, sothat 'routine' rubbish collection is serviced by less than 5 trucks.
3.4 . Recommendations
Sen'ices
The statutOlY services of city corporations are secondalY rubbish collection, proviSion andmaintenance of rubbish collection points, sweeping, Drain clearness, conservancy lawenforcement and their additional services are primarv rubbish collection, Recycling Composting.Awareness riSIng 8:..education, \Vaste reduction.
Collection Points
A programme of collection point rehabilitation must be prepared and implemented Key issues toaddress during rehabilitation must be:
30

Construction or reconstruction of a clearly defined structure of sufficient capacity for thedepositing ofrubbish with solid foundation and ground slab for the full containl11ent of rubbish
Drains adjacent 10 rubbish collection points ll1ust be cleared of'accull1ulated debris, and protectedfrom further contamination.
Co-ordinated with the construction of collection points and recommendation 2 (c) above, areview of the number of collection points with a view to reduce the number along busy routes.This might be achieved by providing larger collection points at less conspicuous locations, ifpossible
Wherever locations allow it, open spaces adjacent to collection points should be landscaped. Anexample l11ight be to build a planter of sufficient height to discourage placing rubb,sh on it,planted with robust plants The purpose of landscaping is partly to disguise the collection point,partly to generally improve the area around the collection point so to aVOid a repetition ofwidespread dUl11ping ofnlbbish.
Propcr schcduling of truck routcs aud timcs for rubbish collcction.
There are no maps prepared by the city corporation clearly setting out the areas and routescovered by the 8 vehicles in operation. Much of the information relating to the working timesand number of loads transported to the dump are anecdotal and are not supported by records ofany nature. It is not clear what the supervisors actually do. other than trouble shoot and redirectvehicles to service 'demand'. Nevertheless, the Chief Inspector demonstrates that someintelligent thought has been put into the collection rounds at sOl11etil11e.
All the while the City Corporation fails to cOl11mit additional resources to the Conservancysection. the existing routing of the trucks at day and night should not b'e altered.
At such time as composting capacity allows, organic market waste should be placed forcollection separate to other wastes, so that the organic waste may be taken dlrectlv to thecomposting factlity without requiring sorting Market waste must be combined into residentialwaste for de-centralized community based composting as soon as capacity allows. ThiS wi]1allow a more efficient composting process to take place and produce a higher quality product.The sorting of wastes for recycling will also improve, allowing more waste to be recycledwithout contamination.
A thorough detailed evaluation of the amount of rubbish being placed at collection points acrossthe city must be undertaken to fully support the scale of additional resources required to fullymeet the demand. By way of example, the Pilot Project has instigated such an overwhelmingpositive response that its demands now require a dedicated vehicle to service the collection pointin that area.
31
-'. ,.

32
3.6 Types of Waste
j
Sylhet's solid waste is mainly comprised of general waste and clinical waste. vVastes such asengine oil and chemicals are thought to be present in the general waste but this is difficult toidentify
By these estimates it is calculated that between 55,000 and 75,000 tonnes of rubbish is producedeach year in Sylhet, or between 0.3 to 0.4 kgs per person per day. On a dailv basis each familyproduces between 1.65 kg to 2.2 kg (assumcs average family size is 5.5 people)
The City Corporation estimates it collects around 60 - 80 tonnes of rubbish from its rubbish binseach day. but that around 180 - 200 tonnes per day is being produced The difference betweenwhat is collected and what is produced is thought to be lost to drains or other Sources. There areapproximately 600,000 people resident in the city
Appropriate amount of dedicated resources, labourers and vehicles, should be allocated toclearing drains so that drain clearing and debris removal is properly co-ordinated without callingUpon and diminishing the resources fully required for routine secondary collection of rubbish.
3.5 Sylhet Waste Pl'odlldioll
General Waste comprises mostly household waste and shop waste and consists of orgonickitchen waste, plastic bottles and bags, paper, few drinks tins, and SOme household cleaningl1uids. Organic waste is vegetable and meat or fish, though meat and fi~h .are not wasted and thiswaste is main Iy bones.
Clinical waste is all types of health care waste, comprising needles and syringes, discardedmedicines, body palts and fluids and general infected and non-infected treatment materials.
These wastes are found mixed together and deposited in the street. Private clinics are the Sourceof clinical waste and there is no separate collection of this waste. These wastes are collec1ed bythe City Corporation together and dumped at the corporation's site out of town.

Chapter 4
Survey Analyses4.1 Objective of the snrvey
The main objective of the household survey is to collect information on city dweller's opinion inbuilding a safe and clean city.
The specific objectives are
To study the current conservancy services and to explore it's weakness.To identifY the waste generation rate and the types of wastes produced.To increase the awareness and responsibilities of the city dwellers in building a safe and clean city.
4.2 Methodology
The household survey has completed by door-to-door survey with an open ended questionnaire in Ward- 1.2,3. The questionnaire was developed by own. The survey was cancer survey A questionnaire hasbeen attach in Appendix -2
4.3 Findings
Basic Infonnation:
There are 3036 households in ward - 1.2,3 which have surveyed. There are 26 para have been found inthe surveyed area. The list of the para along with the number of households is shown in the table no.4. J
i ,
33
,. r<:;7.

34
4.3.1 Socio- Economic Condition
Namc of thc survcycd arcaTablc 4.1:
Frc"ucnc" Pcn:cnt
Old 356 11.7Kazi !lias 35 1.2New Medicnl 383 12.6Police line 94 3.1C&B Medical 5 . .2Lamabazar 34 l.lCivil Surgeon 10 ,
.0
Jollarpar 67 2.2Munshipara 114 3.8Shagordighirpar 20 7Medical Colony 13 4Mirermoida 140 4.6Shoroshpur 115 3 8Dorgagate 53 1.7Dorgamoholl 35 1.2Sona!i Bank Staff 30 1.0Dariapara 378 12.5Dorshondewri 192 6.3Mia Fazilchist 79 2.6Rajargoli 170 5.6Amberkhana 23 8Mirjazanga II 4Zornerpar 180 59Kazolshah 1~5 ().IKewapara 303 10.0Zindabazar 3 ]Total 3028 99.7
Missing System 8 ,.0
Total ]nVi woo
Fanlily size:Waste generation per household depends on the number of person in household. From figure 4. I it isclear that more than half of the families 56% in this area are consists of 4-6 members. About one fifth ofthe total are small families who have less than 4 members and only 5% are largc families of whichmembers are more than 10. It indicates that the number of nuclear family is much more higher than thatof joint family

The average family size is 5.55 in this area, which is almost same as the national figure. Thc range of thefamily size varies from] to 30. Which has been shown in table 4.2
More than 10
35
7 - 10
Quantity of waste produced by family size
4-6
Descriptive Statistics of the family sizc
Table 4.3:
Less than 4
Table 4.2:
Figure - 4.1: Family Size of the Households
Family size
50
20
40
30
60
10CQ)
~,g: 0
No of person StatisticsMinimulll Maximum Mean
Familv size I 30 5.55
:)uantitv of Waste KG(% Within Famil\' ] -2 kg 2-4 KG 4-5 KG 5+ KG Total
Fam iI Less then X 17 I X.I .2 IOOUSIze 4 - 75.5 22.9 .9 .(, I ()O.O
7 - (,7A 30.3 2.2 .2 IOU.OMore then 59.9 30.7 XO r1 .~5 1000
Total 742 24 0 I 4 4 1000
N
When the family size become bigger the quantity of waste become greater. Table 4.3 shows the quantityof waste produced by family size.

Monthly income of the household
51.430.8712.7342.2244
98.51.5
, .
]5629352158110357721 ]
299145
ServiceBusinessLabourSelf EmolovedExoatriateDoctorTeacherDriverRetiredTotalSvstem
Table - 4.4: Occupation of the household
Missini.!
Income level of the household:
36
Waste generation depends on the income status of the household. From the figure (4.2) it is clear that41% households monthly income varied from Tic I ,000 to Tic 5,000. 36'"" arc livll1g In the income levelofTk. 5,000-10,000. One fifth (20%) of the total households income is more than Tk. 10,000. Only 3%households income is less than Tk. 1,000.
Figure 4.2 Income level
Education level of the family:
Waste generation depends on the education of the family members. Generally business family has atendency to generate larger quantity of waste than others. In the survey area 514% household ( table44) are servicer. Most of the people living in this area have literacy skills. 789% of the tot1tlhouseholds are literate of whose family members are educated. Among others 124% of the surveyedhouseholds family members have basic literacy skills who can only identify the alphabets and the rest8.7% are illiterate.

Islam
77,5%
. ,
More t~en 20 years
16. 20 yeef~
37
11.15 years
Religion of the family
~.10yea"
Figure 4.3:
".Uplo 1 yeer
Figure 4.4: Trend of living
Years living In Sylhet
.2%
50
Buddism
22.0%
Hinduism
3%
Christianily
20
Religion of the household:
Physical composition of waste depends on the religion of the household. Among the total household ofthe area, 77.5% of them are Muslim, 22% are Hindu, 0.3% are Christian and the rest 02% are Buddhist.
Trend of living:
Waste generation rate depends on the trend of living systems Generally the permanent resident has atendency to generate more waste than others. From the figure (4.4) we can see that a large number ofpeople (44% of the total household) of this area have been living in Sylhet town for more than 20 yearsAmong the rest of the people] 6% of them have been living here for 2-5 years and 5% households arehere for less than] year, who are living here as a temporary basis.

Govermeni ruidence
t .'
27.5%
Rented
Care la~"r
8,6%
Figure 4.5: CategOl)' of the houses
63.6'k
38, ,
CategOl)' of the house
A large number of people are living in rented houses. From figure 4.5 it can be said that (27.5%) of therespondents are living in their own houses. A few are living in government residence and the others areliving in the houses with a condition of taking care of the houses. The owner of those houses livingabroad permanently and the pay their visit here temporarily Rest of the time those houses were looksafter by the caretaker.
Sources of waste
4.3.2 Informatiou about waste
Household waste generally comes from cooking, toiletries, homestead activities, toilet,educational materials cloth. Fig 4.6 shows that 34.7% waste is coming from cooking 135%comes from cosmetics, 27.0 % is comes from home stated activities 6.5% IS to ilet 13 2% comesfrom educational materials 5. I% is coming from cloth.

Cloth
13.5%
Cooking
34.7%
5+ KG4.5 KG
39
Ouantity 01 garbagl-'
Figure 4.7: QU:lIltily of the waste
.,
"
"
"0
""
Figure 4.6: Sources of wnste
27.0%
Education material
5,1%
6.5%
Toilet
13,2%
Homestead activities
There are varieties in collected wastes. Different types of waste are produced from differentsources. Some of them are decomposable, some are recyclable and 'some are disposable. Thewaste from cooking purpose, homestead activities and half of the education materials (68.3%)are compost able. Clothes and half of the education materials (11. 7%) are recyclable Waste Ii'omcosmetics, toiletries and toilets (20%) are disposable
Quantity of the waste
Average 5609 kg. waste is produces from these area of the town daily. From the figure (4.7) wecan see that most of the households (73%) produced 1-2kg, 2-4kg waste is produced from 24%households, 4-5kg waste is produced frolll 14% households and from 04% households producewaste is more than 5kg per day

Waste stor~ge process
, ,
'Vaste storage processFigure 4.8:
Frenuencv PercentServant 869 28.5Family member 2078 68.2Total 2947 96.8
Missin.tl; System 98 3.2Total 1nLl, 1 nn n
Primary Collector
40
Table 4.5: Primary collector of the waste in the home
Peco,
"'
20
Put here and there
4.3.3 Information abont p,.;mary waste collection process
50
8090
\Vaste storage process:
Solid waste management system starts at household level So the storage of waste in a fixedplace by a durable container is mandatory for Integrated Solid Waste Management System.Fig 4.8 shows most (90%) of the people have the tendency to preserve wastes in a fixed place intheir home either it is in a basket, bucket or polythene. People have a very natural tendency tokeep their houses clean. If this kind of positive attitude grew among the people covering a largerarea certainly we would have a clean city. But J 0% of the households people put theirhouseholds waste here and there. This kind of attitude is very harmful for the environment
Persons involved in primal)' storage
In most of the families, family members collect wastes by themselves. Most of the time (54%)it is done by the housemother of the house but sometimes the house-father of the house and thechildren are also do this. From the table 4.5 It is clear that only 28% of the total house haveservants to perform this duty. Some of the household members also did it along with theservants.

\.-.
,., '~'.- "
1,:.;.....•\,.
( ,
Polythcne
37.6%
41
Figlll'c 4.9: Typcs of wastc st oragc
Basket
16.1%
Earthenware
Buckel
Waste disposal /delivelY in proper place depends on the types of container used in primarystorage of waste. From the figure (4.7) we can see that nearly half (43%) of the total householdsuse basket for preserving wastes. A large number of household use polythene. Some people usebucket and a few households use earthenware as waste preserver. Some of the households usemore than one item to preserve wastes.
.6%
Types of container used in primal")' SIOI"agc ofwastc"
Duration of wastc storagc:
Duration of waste storage depends on the facility of waste disposal point or waste carryingvehicle. Table 4.6 shows 95% of household dispose their collected waste daily. But some peoplcdidn't do that. Among them some household members dispose waste after 2 days. some did itafter 3 days and the rest of the household did it after more than 3 days, which is very harmful forpeople's health as well as for the environment.

, ,
9521.6
.6
.297.6
2.4
No
Duration of waste storage
I day2 days3 daysMore then 3 daysTotalSystem
T~ble 4.6:
DUI"ation of waste stonlgc
Figure 4.1 0: "V~ste p,'esel"V~tion for recycle
42
Preserve for recycle
Missing
WO
80
60
"
20
Cw~w<L
Preserve for recycling
Recycling of waste is very important part in integrated solid waste management system.Intensive recycling programme can reduce the pressure on municipal conservancy services aswell as protect the enviroIUllcnt. From the figure 4.10 we can see that only a few of the totalhousehold members (11%) preserve waste for recycling.
Among the households who are practicing preservation 56.9% (table 4.7) others. more than halfof them never feel the importance and necessity of the preservation and recycling. 32% peoplehave no response. A small portion of the waste is preserved directly for recycling So a hugeportion of the waste is need to bring under process by the authority

, ,
Table4.7: Feeling need for 11I'eselvation
Fr n p. r nNo 1728 56.9Yes 317 104Total 2045 674No response 991 32.6
Preservation Items.
This indicates the little concept of the household on recycling prograamme
Some of the specific items are preserved for recycling. These are mainly paper, plastic, can,bottle, metal and food related items. Apart from those, people also preserve wood, rubber, ashand used tea leaves. Table 4.8 indicates 16.8% household preserve food related waste, 24.6%paper waste, 18.5% plastic waste.
Table4.8: Items prese.ved for recycling
Items
pFood related 16.8Paper 24.6Plastic IX.S
Can 15Jl
Bottlc 174Metal 6.3Chemical wastes .1Wood .1Rubber .2Ash .1Tea leaf .2Tn'ol 1000
Causes for prcsclvation of waste
Different items being preserved for different purposes. Different preserved items have differentmarket value. lVIost of the people preserved it for sale. Paper, plastic, bottle, can and metal arepreserved for sale. Some of the items are also preserve for re-use. Some of the waste is preservefor using as soil condition, like food related items and tea leaves. The figure 4. II says thathousehold in the surveyed area preserve waste as sale 79.3% use for sale purpose 38% andreuse purpose is 16.9%.
43

1(i,9%
Re-u<e
79,3%
Sale
38%
Figul'c 4.11: Causcs for pl'cselvation ofwastc
Exislence of esa
Figure 4.12 Existence of eBO engaged in wrlste collection:
44
Information about primal)' waste disposal:
Fig 4.12 indicates (51%) of households in the surveyed area is enjoying some additional facilitiesfrom some Community Based Organizations (CBOs). There are 17 CBO's (table 4.9) areworking in these area providing waste collection services from household level. 1536 householdsnot having these type of facilities. Most of these organizations are formed by a group of youngboys of the community.
4.3.4 Participation ofCBOs & NGOs engaged in waste collection:

Satisried about there activities
( .
Name of the organization
List of CBO's along with their covering areaTable 4.9:
. Frequency PercentShahialal Somaz Kollan 202 13.4Dariaoara SonQstha 125 8.3Svlhet Somaz Kollvan Son~stha 183 12,1Pavra Somaz Kollvan 295 19.5Younrr Brothers Club 75 5.0Raiarrroli Somai Kollvan 23 1.5Kewaoara Somaz Kollvan 102 6.8Waves Somaz Kollvan 15 1.0Yeamani Porishad. Fazil Chist. 25 17Machudirrhir Par Somai Kollyan 1 .1Modhu Shahid Somaz Kollyan 31 21Shuvechcha Somaz Kollyan 5 3Promukto Akota Jubo 1 1Purathan Medical Boys 53 3.5
Welfare Association. Puraton Medical 54 3.6Kazolshah .1ubo 304 20.1
Somaz Kollvan Son~stha 15 10Tnt:> 1509 100,0
45
Existence of CBOs in the locality
Figure 4.13: Household Satisfaction
State of satisfaction
Regular collection of waste is yery important for integrated solid waste managementMost of the organizations are able to satisfy people's demand. (figure 4.13) says that 83% of thehouseholds those who receives organizational support are satisfied about their activities on wastecollection.

Amount wants to bcar by houschold for ellO's
City Corporation is not responsible for primary collection of the waste. They are collectingconservancy tax for secondary collection and disposal of the waste. So the city corporation doesnot bear the cost incurred by CBO's Households have to pay the incurred cost.
The households have been bearing costs for the CBO who works for waste collection in theirlocality This collection rate varies from organization to organization and household tohousehold depending on their economic condition. The range of the collection rate is from Tk.1 0to Tk 200. Mostly Tk 10, IS, 20 or 50 have been collected Table 4. I0 shows the cost bear byhousehold .. Normally those who collect a large amount of money they do Ilot limit theiractivities only in waste collection rather they works in the field of community development as awhole. Table 4. I I shows the list of collection rate of CBOs in the surveyed area
Tablc 4.10: Cost bcars by houschold for CIlO's
Frcoucllcv PercCIltAmount Tk.IO 449 30.7Tkl5229 15.7TUO423 28.9Tk.25 J J .8Tk.30 50 34Tk.35
4 .J,. ..Tk.45 17 I 2Tk.50 269J 8.4TkJOO
9 .6Tk.2002 .ITotal 1463 1000
46

If es, how much
Tk Tk.Tk.l0 Tk.15 Tk.20 Tk.25 TUO Tk.35 Tk.45 Tk.50 100 200 Tot,11Shajalal Somaj Kallan 119 4 2 1 1:~6Songstha94.4% 3.2% 1,6%
.8% 100.0 %Dariya Para Songstha 9 117 71:'36,8% 88.0% 5.3%
100.0YoSSKS 10 94 5 1 6 1 3 1;'08.3% 78.3% 4.2%1 .8% 5.0% 8% 2.5% 100.0%Payra Somaj Kollan 10 35 3 14 179 5 2 2'.8Songstha4.0% 14% 1,2% 5.6% 72.2% 2% 8% 1000 %Razargolli Somaj Kollan 27 1 53 12 11 2 1(16Songstha
25.5% .9% 50% 11% 104% 2% 100.0%Waves Somaj Kallan15 1
'6Songtha94% 6.3%
100.010Yeamani Ponsod Mia20 2 ;:2Fajilchist
91% 9.1% 100.010Suvechcha Songstha6 1 7Mia Fajilchist
86% 14.3% 1000%Young Brother's Club 3 54 2 1 1 ('14.9% 89% 3.3% 1.6% 2% 100.0%Kewapara Somaj Kollan 1 78 10 2 SI1Sonstha1.1% 86% 11% 2.2% 1000%Promukto Akota Jubo 1
1 2Shonga50.DoA)
50.0% 100.010Masu Digirpar Songstha1 1
100% 100.0%Modhushahld Somal29 1
:'0Kallan Songstha97% 3.3%
100.0 %Puratan Medical Boys 11 41 1 22 ,'5Club14.7% 55% 1.3% 29,3% 100.0%Puraton Medical Colony
28 ;~8Welfare Assocation100% 100.0 %Soma) Kollan Songstha
1 2 1 4 15 10 1 "4Sagardigir par2,9% 5.9% 2.9% 12% 44.1% 29.4% 3% 100.0 Yo
'-Moitri Para Songstha 3 , ,
3100%100.0 %Kazolshah Jubo Shango 109 13
1;~289.3% 11%1000%Total 303 216 359 7 47 4 17 261 9 2 12;:524.7% 17,6% 29% .6% 3.8% .3% 1.4% 21.3% .7% 2% 100.0%
Table 4.11:, ,
List of collection rate of CBO's
Name of the organization by collection rate
47

j •.
48
3.5
726.6
14668.1
1000
) ..105220200443
20683036
< •
Table 4. I2: Distance betweeu honse and dnstbin
< 10 yards10 - 20 yards20 - 30 yards30> yardsNot known/no dustbin
Table 4,13: Time to waste disposal in different distance
Information where there is no CBO have been worldng
Distance between house and dnstbin
The honseholds where there is no CBOs working for collecting waste hom houses have to put itto the dustbm by their own. According to the data a large number of people (68%) did notresponse about the distance between their house and dustbin. This is because probably they haveno dustbin in their locality or the family member do not know the existence of the dustbin. Fromtable (4.12) we can see that 15% of them have it which is more then 30 yards rar from theirhouse.
Timely waste disposal is mandatory for the success of integrated solid waste managementsystem .. People throw their waste to the dustbin at any time at whatever distance between houseand dustbin. People those who have a fixed time to waste out, they prefer to did it in themorning, a few people throw their waste to dustbin at night and some people also did it at theafternoon ( See table 4.15)
Time to garbage outMorning A rlernoon Night Any time Total< 10 yards lb.j j.t! 4.8 75.0 100.010-20yards 19.8 1.6 7.7 70.9 100.020 - 30 yards 42.1 1.5 1.5 54.9 100030 > yards 40.1 17.8 17 40.4 100.0Total 33.6 9.3 3.3 53;8. 100.0

4.3.5 Information abont dnstbin
Placcment and condition of dnstbins
Proper placing and good condition of dust bins encourages city dwellers to dispose dispose theirwaste in proper place.
, ,From the figure 4.14 we can see that nearly half (45%) of the respondents have no respons'eabout placement of dustbins. According to the active respondent's opinion, more than half of thedustbins are placed adjacent to a drain which can easily block the drainage system, If it is notmaintain properly. 29.9% of the dustbin could create trouble in communications which aresituated near a roadside and 19.3% of the dustbins are situated adjacent to the tIlstitutions likeschool, mosque, bank, clinic, office. 0.2% are near to restaurant. These Improper placement isvery harmful for public health.
In residential Area
.1%
Adjacent to restaura
2%
RoadSide
299%
Adjacent to {Jrain
Adjacent to ins!
19.3%
Figure 4,14: Placement of dustbins
, ,
49

50
Open placeWater bodyRoadDrain
o
20
10Pereent
Figure 4.15: The leachel lakes place from the dustbin.
30
40
leaehete from the waste in dustbin
50
Table 4.14: The place of the ove,'nowed waste spread out
Garbage takes place by ove"nowing waste ".,P"l'r,,"tRoad 62.6
Drain 31.6Open Area 6ResidentialArea
4.9Ponds
.3Tot"1 1000
Problem arises by ovedlow of the waste.
Due to limited number of dustbin, sometimes dustbin have been overflowed. When the wasteoverflows from the dustbin, most of the overflowed waste is lie down if! t.he street and createtroubles for people who are moving around. and also create's traffic nuisance. 62.6% household(Table 4.14) says that waste takes place on road by overflowing.
When waste is stored in the dustbin, fClr long days, the waste then decomposed and producesleaehet and is spread out in different places and make them dirty The liquid lI.om the dust billha ve been flows to the drain 42%. It a Iso affects the road, water body and open places

51
Time to transport waste
29.3
40.09.61.8189.4, ,
100.0
PercentTvples of places
Effect drainLying in the streetEffect residential areaEffect water bodyNo responseEffect open AreaT al
Regularly with proper timing to transport waste is important for integrated solid wastemanagement approach. Generally the time should be early morning or late night. Thefigure 4.16 show that waste is transfclTed by open truck in the morning.
Table 4.15: The place of overflowed of waste during the rainy season
A large number of dustbins are cleaned up at any time of the day. Most of the time wasteis collected in the morning, though the morning time is one of the busy time of the dayfor the school going children and office bound people. The dustbins need to cleaned up inbetween 10 P.M. to early morning. But this facility is very limited in this area.
The conservancy section of Sylhet City Corporation is responsible for collecting wastefrom different spot. It is very important to carry out waste from the dustbin by enclosedtruck for the safety of public health. But a small portion of the waste is carried byenclosed truck and most of them are carried by open truck. Sylhet City has only 2enclosed trucks and 8 open trucks for waste collection from the City Corporationprovided dustbin to landfill.
Types of vehicles engaged in secondary waste collection
The situation becomes deteriorate in the rainy season. The table (4.15) shows that theleaehete from dustbin in rainy season spreads in drain 30%

Interval of waste collection from the dustbin
, ,
52
rignre 4.17: Regularity of the waste collection frolll the dustbins
Time of garbage collection from the dustbin
40
50
20
30
so
"
2.0
20
Perc 10
ent
0
Pe 10
rcent 0
Figure 4.16: Time to coliect waste frolll the dustbin
Waste should collect regularly but from the survey, it is clear frolll 4.17,36% household say thatwaste collection from the dustbin regularly.

ProblelllS arises due to iIl1Iu'opel' waste collectiOIl
Different types of problem arises due to inadequate waste management system The problem cancategorized into environmentally all health and economic. Such as environmental, heath as wellas economic problems. In case of health related issues, various types of diseases spread out andinfect the community. These are cholera, diarrhoea, typhoid, malaria, asthma, plague etc.Environment becomes polluted due to improper waste management. Bad smell spreads out fromthe waste. Water body becomes polluted due to leaching of decomposed waste, resulting thedeath of aquatic plants and animals. The combine effects of improper waste managementhampered our economy.
Improper waste management could create air pollution also. Harmful gas and smoke is beingproduced from decomposed waste as well as bad smell which pollute the air and make theenvironment unsafe for the community.
The respondendents opinion on air pollution are descried in table 4.16 water pollution in table4.17 and soil pollution in 4.18.
Table 4.16: Types of p•.oblems a•.ises due to ni•. pollution
, ,
p•.•."''''tCreate bad smell 48.3Produce harmful qas 39.3Produce smoke 10.7Total 98.3Missinu System 1.7Tot"1 1nn n
Water is affected by waste. Water loscs its purity, when the waste or it's liquid mix up with it.Polluted water has bad smell and turned into different colour. An uncountable number of fish andaquatic plant has been decreasing due to water pollution.
53

Table 4.17: Types of problems arises due to water pollutiou
PercentImpLlrit 19.5Create bad 17.2Turned into deep 15.4Produce 18.0Epidemic of fish & water 16.0Impure water recess under soil 13.9Total 99.9
Missing System .1Total 100.0
Soil, which is also polluted and lost its fertility due to various limitations in proper managementof waste. 99.3% of the respondent express their concern about decreasing of soil fertility
Table 4.18: Types ol'flroblems arises due to soil pollutiou
Perceu tDecrease fertility 99.3Others .6Total 99.9
Missin.~ System .1Total 1000
Community people have to face different types of health problems which related with health.Various diseases were spread out due to pollution in different sector. ThiS pollution is theultimate result of inadequate and improper waste management Table 4.19 shows the name ofdiseases and their percent
54

T~ble 4.19: Types oflhe diseases cOllld be spre~d Ollt dlle to health I"'oblem
People's kllowledge on the cOllservancy policy of Sylhet Cit~, about wasIl'I1lfllla gcmcll t
5S
Pel"CelllDiarrhoea 14.4Dvsenlrv 12.3Cholera 9.7Tvphoid 7.0Pla.gue 4.8Maleria 10.9l-iepatvsis 4.0Dyspnoea 9.7Den.!..!,u 10.61nfluenza 5.4Skin disease 11.2Total 99.8
Missing System .2Total 1nn n
Figu re 4.18
4.3.6 Level of people's kllowledge abollt the waste mallagemellt policy of Sylhet CityC orpor~ t iOIl
Peoples proper knowledge in the conservancy policy of the city corporation is fundamental tointegrated solid waste management system.
Fig 4.18 indicates (93.4%) household of the surveyed area are quite ignorant about the wastemanagement policy of Sylhet City Corporation. Even the educated, well-established citizens alsositting in the dark having 110 knowledge regarding the policy though they have their own housesand living in the city for more than 20 years. On the one hand the City Corporation never takesany initiative and at the same time the city citizens didn't show any kind ,o~ curiosity abolll thepolley. .

56
4.3.7 Peoples Recommendation for solving problem
.-' I
Recommendation for solving the existing problem of the City Corporationabout waste management
Recommendation
Fn, "I"n"" Pcn'cn!Dust must be clean within 9 1.7Dust must be clean within 11 2.1Dust il111St be clcrm aner evening 14 2.7Increase social awareness 73 13.9Incrcnsc Illall power 72 13.7Work properly 29 5.5Increase !lumber or dustbin 157 299Dust must be clear regularly 160 30.5Total 525 100.0
People's inh~"l'st011 participation
Participatory appro<lch is very important for success of any activitIes. So soliving theconservancv problem of sec peoples recommcndation is very important
Only 12% of tbe total respondents put tbeir recommendation for solving existing pro blems of theConservancy service. In their opinion tbe problem arises mainly for inadequate number ofdustbins and not cleaning the dust bins regularly at a proper time. So out of the total respondents60.4% gave more importance to increase the number dustbins and clean it regularly. People alsorecommend that number of manpower should be increase as well as awareness of the communitypeople to support the authority to work properly The recommendations are summarized in table4.20
Table 4.20:
Among the respondents of the surveyed area 96% households (figure 4. I 9) expressed theirinterest to participate in awareness raising activities if any actor would take any initJative. Theparticipation will vary from economically to counseling People are interested to work inawareness programme different ways A significant number of people's interested area is morethan one. 3.3% people have no interest to participate in any initiatives and 08% householdshave no response about it

, ,
CounsellingVoluntmilyMeetingsEconomic~lly
How
, ,
57
30
10
20
40
50
Figure 4.19: Peoples interest to participate in any initiative for awareness raising.
, ,
Cha plcl' :;
\Vaste Stnltegy Fnllnework
5.1 Inlroduction
A Wasle Slrategy is a policy document that sets out the overall objectives of how waste is to bemanaged. Projections for quantities of waste being produced, due to economic and developmentgrowth will significantly drive the needs of Waste Management in the future. The aim of thiswaste strategy framework is to express its commitment to improve the conservancy services. Theframework will allow improvements in the way rubbish is collected from the streets of Sylhetand then disposed. The framework is built around short, medium and long-term goals.
In the short term. a Waste Strategy Steering Group have to be established and pilot schemes forthe collection of rubbish ii'om households will be established, moving on to improvements in theefficiency of city collections and ultimate City-wide expansion of the service.
Waste disposal must be properly addressed in the medium term and the long term objectivessuggest the potential for waste disposal to be developed up to 10 years from the commencement.
5.2 Aims & Objcctivcs
The aim ofSylhet City Corporation's Waste Strategy will be to improve the cleanliness of thecity and reduce the effect of the city's rubbish on the environment.
This can be achieved by having short, medium and long lerm objectives, so that an overalJimprovement to waste management is achieved in a planned approach taking advantage of manysmall changes in the way rubbish is produced, collected and disposed
The overall strategy will seek an integration of many organisations from the community basedsector, private industlY as well as the City Corporation, so that the responsibility of undertakingwaste management is shared between everyone that is able to make a contribution. The CityCorporation will maintain its overall responsibility. as set out in the Paurashava Ordinance, 1977,for ensuring rubbish is removed from the streets of the city and that the effects of rubbish do notcompromise the health of its residents.
The gains to be achieved from implcmenting this framework will be visible on the street. withcleaner streets, clear drains and less flooding Residents' health will be protected and civicawareness and pride will be enhanced.
58

5.3 The Short term - np to 3 years from now
The sh0l1 term will include activities to be completed over two - three years
During this period, community based organisations and the City Corporation should worktogether to improve the collection and removal of rubbish from homes and businesses. There arethree distinct phases to achieve this:
5.3.1 Phase 1- Pilot Schemes
Sylhet City Corporation, in conjunction with a NGO, or Community Based Organisation, willestablish a trial project in one or two mohollas. The following activities will be undertaken in thefirst 6 - 12 months:establish Sylhet 'Vaste Management Steering Cronp consisting of Conservancy Section stafffrom the City Corporation, NGOs, and other interested bodies, chaired by the City Corporation'sChief Engineerundertake a survey of residents in the trial areas.raising awareness of residents so they begin to understand the importance of collecting rubbishand disposing of it in a proper way, so that pollution and flooding of drains is avoided and thatthe responsibility of managing rubbish is theirs as well as the city's: Civic Pride will the mainobjectiveestablish a 'Primary Collection' round that will collect separated wastes, recyclables such aspaper, vegetable waste and non-recyclables. Vegetable waste will be composted, recyclables willbe sold and the City will dispose non-recyclables.Rubbish collection wil] be undertaken usingrick-shaw vans. Residents will be encouraged to pay for the collection of rubbish from theirhomes.in the area that already has a scheme established, introduce community-based compostingthe 'Secondary Collection' stage li'om corporation rubbish bins in the areas of the trlalmus! beimproved so that resident confidence in the project is maintained. Failure to maintain rubbishbins will destroy the value of raising awareness.area around rubbish bins in the trial project area must be completely cleared of all rubbish thathas ovetilowed into the drains over time. Rehabilitation of these areas and reconstruction of thebins, with continued maintenance of them in a clean condition will reinforce the value of theawareness raising and collection schemestrong boots and gloves and facemasks are provided for the protection of rubbish collectors'health.
5.3.2 Phase 2 - Expansion and Improvement
This phase will focus on 2 issues in the short term Lipto 2-3 years:the expansion of Primary Collection and community-based recycling and composting schemesacross the whole ofSylhet City;The outcome from the work of phase I will be a clear understanding of the methodology toestablishing Primary Collection schemes and community-based waste recycling and composting
, ,.
59
••

schemes. To assist the expansion of Primary Collection schemes across the whole city, it 1Sproposed that a Community Waste Toolkit is produced The Toolkit will set out the clear stepsrequired to establish new schemes. The Sylhct Waste Strategy Steering Group should prepare theToolkit and be active in promoting its use. ( (
Expansion of Primary Collection schemes across the city will take time and it is estimated thatcomplete coverage can be achieved in 2-3 years.thorough improvement of the Secondary Collection undertaken by the coupled withrehabilitation ofthe rubbish bins and surrounding areas where rubbish has accumulated in drainsand roadsides.
Success of the awareness raising and Primary Collection scheme will depend on residentsconfidence in clean streets being maintained. As the Prima1y Collections expand across the citythere will be a need for Secondary Collections to be regular and reliable. The current state ofrubbish bins, with rubbish lying around and blocking the drains, wili not secure this confidence.All rubbish bins must be included in a programme of rehabilitation that includes the following:all areas around bins must be completely cleared of all accumulations of rubbishproper hard surfacing and boundaries to bins being reconstructed to contain rubbish and preventit falhng into drainsvehicles attend rubbish bins in a sequence that is logical and efficientvehicles attend rubbish bins at more appropriate times, such as during the night, taking advantageof less traffic and cooler temperaturesrubbish collectors are given regular health checksinvestigate and, ifapplicable, secure more appropriate vehicles for rubbish collectron and tools toload themensure sufficient number of vehicles are employed
It is likely that the Primary Collection schemes will create a reduction in waste for disposal perhousehold. However, with the quantity of waste being collected increasing from 40% to near100%, it may be the case the Corporation will not witness any reduction in the quantity beingdisposed in the long term.
The Corporation should consider increasing the number of rubbish bins located in streets andcommence a programme of introducing litterbins along main roads. A significant problem \vithlitter in roads is that people have no where else to place their wrapper Litterbms when supportedby awareness raising can reduce the amount of rubbish dropped in the streets by pedestriansLitterbins could be emptied during the Secondary Collection.
The Corporation should, through development with the Sylhet Waste Strategy Steering Group,introduce new Bye-laws, Rules or Regulations, as may be suitable and in accordance with thepowers of the Corporation, for the improvement of waste management on the streets and homhomes and businesses. It is already feasible for waste storage containers to be stipulated as partof planning conditions for new buildings, but the Corporation may wi'sh to Insist on certaJl1businesses, such as private clinics. containing their special wastes separately from the generalwaste.
60

5.3.3 Phnse 3 - Service Development
The Wnste StrategyBy the end of the Short term it will become clear how waste is being collected, both in thePrimary Collection and in the Secondary Collection The quantities of different wastes will bebetter known. It is at this time that the Sylhet Waste Strategy Steering Group should review thisframework and commence formulating a Thorough Waste Strategy.
A Waste Strategy is a policy document that sets out the overall objectives of how waste is to bemanaged. Projections for quantities of waste being produced. due to economic and developmentgrowth, will significantly drive the needs of Waste Management in the future. The Strategy willidentify how waste is to be disposed in the medium and long terms and estimate the capacities ofany facilities that mny be required. A move towards 'contracting-ouf should be considered and aframework for achieving this should be included.
A Waste Strategy should also set out other significant policies that must be adopted inconjunction with Waste Management. These should include enforcement against offencesrelating to waste, pollution offences.
Tax Collection, Planning and public involvement
A thorough exnmination of the methodology the Corporation employs to collect rubbish from thedesignated places should have identified the need for more resources. Resources in the form ofworkers and vehicles .require financing. It will therefore be necessary for the City Corporation, toincrease the success of its tax collection.
Planning rules, if they do not already exist, should be developed to strengthen the requirement ofdevelopers and occupiers to place ruhbish oul for collectioll in designated places. Under thescheme developed in Phase I, Primary Collection schemes will undertake collections of rubbishfrom homes and place it in the designated places. Developers of new proper1ies should provideadequate capacity containers and storage space for rubbish so that Primary Collections are ableto be made more efficiently and will assist in keeping streets clean in between collections
Public involvement in all issues concerning public services is of utmost impOJ1ance ifresponsibility, ownership and suppol1 of schemes is to be successful. In deed, it has beenindicated by the World Bank and the Asian Development Bank that any applications for externalfunds to assist in the development of waste facilities in the medium and long term will requiredemonstration by the City Corporation that minimum levels of tax collection and publicinvolvement, amongst others, have been achieved.
The City Corporation, should consider setting a tax, if one does not already exist, for theSecondary Collection and disposal of rubbish produced by shopkeepers and bUSInesses, but mostimportantly, suppor1ed by an increase in the level of tax collection.
, 61
",-
5.4 Medium Term- up to 5 year, from now
The mediulll term covers the period 2 to:; years from now.
Landfill
Waste disposal must be properly addressed at this time. The current practice of dumping rubbishon a field outside of the city is not Waste Disposal and will lead to increased significant pollutionof water and land in the area. The area of land currently being used for this purpose should beproperly engineered and remediation of the contaminated land undertaken Anv contaminatedland can be used in the landfill for fill and the void it produces used as additional capacitv
The opportunity exists for the landfill site to have significant capacity for many years ofclisposal,but will require careful planning and implementation. Isolated capacity can be set aside forspecial waste such as clinical waste. Ultimately the site can be returned to pasture and potentiallybecome a park for enjoyment of residents. This can be achieved in stages and a fully engineeredsite would be constructed to allow this.
Pollution from waste will be contained within the landfill site and be treated to make it safe. Inthe long term, electricity may be generated from the landfill site by burning the gases that arecreated by degrading wastes.
Financing of an engineered landfill site is likely to be achieved with the assistance of the WorldBank and Asian Development Bank. However, any such applications are likely to be successfulonly if the City Corporation has produced a Waste Strategy and can demonstrate minimumperformance levels ofcel1ain public functions, such as tax collection.
Planning for"Gnnvth
The city is developing and growing and is supPol1ing an increasing. population. Services mustgrow to match the demands of the population. To ignore growth will be to the detriment of theservice and will undo much of the important and successful work achieved over the precedingyears.
The Sylhet Waste Management Steering Group can be instrumental in maintaining qualityservice provision as the city grows. New Primary Collections schemes must cont111ue to beintroduced and Secondary Collections must expand to match.
Private Sector & Contract Management
The City Corporation will be very clear by this time on the levels of performance that can beachieved in the SecondalY Collection. An 0ppoJ1unity exists for the City CorporCltion to enterinto contracts with private sector companies to undertake Secondmy Collections.
Engineered landfill must be designed and constructed in a proper way and. unless the CityCorporation acquires this skill, the private sector must be used to design and construct it. It is
62

likely to be more efficient for the City Corporation to enter into contract with the private sectorfor the management of the landfi II site.
Contracting-out these basic public services will leave the City Corporation with the function ofContract Managing the contractors. Therefore, contracts must be based on performance or outputspecifications so that the Corporation IS able to monitor contractor's performance and ensure it isgetting value for money,
5.5 Long Term - up to 10 years from now
The long term sets out the type of issues that must be considered and planned in the period 5 to10 years from now so that the development of Waste Management will provide for as much as25 years beyond that time.
This overall ffamework gives an indication of what the City Corporation's Waste Strategy willhave to consider and include. It is nearly impossible to set out how Waste Management may
~ develop in the next 10 years and the City Corporation Illust be mindful to take account of~internationallaw that may become applicable to waste management and pollution control at any'
~time in the future.C'JiJ Landfill will not continue to support a growing city and will eventually become fulL The~lpotential life of the landfill can be extended by moving to a more sustainable disposal method
such as incineration with recovclY of energy, generating electricity. i By products fromincineration such as metal recovery and recycling of bottom ash into building blocks is possibleand reduces the need to dispose of incinerator ash. Some wastes will continue to be land filled.
5.6 Criteria for sdccting Pilot Mohollas & NCOs
Pilot Mohollas
The Waste Strategy Steering Group should agree what the criteria for selecting the IVlohollas forthe pilot should be. The following provides an outline of suggested criteria.
The state of the streets in the pilot area should be as representative of the city as is possible. Thatis to say that it should not be the area with the least nor the most amount of rubbish on its streetsIf slums are concentrated in a moholla then they should be avoided for the pilot areas as thesemay require special attention
The concentration of housing and shops should be typical of the built-up pal1 of the city, andshould contain multi-storey buildings as well as single storey
The pilot areas must have Municipality rubbish bins located in the area
A main road should run through the pilot area contall1ing shops and businesses
63

A plot of land for recycling and composting activities in the pilot areas are not necessary as it islikely that such plots will not exist in all mohollas. However, one moholla must have a plot forrecycling and COlllposting so that a comparison can be made with one that does not.
NCOs
The Waste Strategy Steering group should agree the criteria for selecting an NGO to undertakethe pilot project The following points are provided to assist the group.It is not intended that the pilot project should develop a new methodology for creatingcommunity involvement and PrimalY Collections, but should attempt to replicate a successfulproject. Therefore, it would be useful if the NGO has experience, best practice, and a successfulmodel, to apply to the pilot areas.
The NGO must be able to demonstrate a respectable and auditable organisational andinstitutional infrastructure, with a Mission Statement or similar, accounts, portfoliO of activities
An NGO without experience may wish to work with another NGO that does have experience,and the Steering Group should consider this option to facilitate expedient sharing of knowledge
, ,The NGO must have the willingness and available staff resources to dedicate to the pilot(s), andbe prepared to work with other organisations for the benefit of the pilot project
Ideally, the NGO will have access to funding, or be capable of attracting funding, for the supportof the pilot
5.7 Monitoring and Evnlnntion
5.7.1 Inh'o(It"'lion
Monitoring and evaluation of any work stream is an important part ofprOlect management toensure that a project is on target to achieve its aims and objectives within the resources andtimefi-ames set for it
5.7.2 Standnnls
The framework of monitoring requires standards against which monitoring can be carried out.'Improving the cleanliness of the city' is a subjective statement, and at any time the cleanlinessmay well have been improved, but the lllission of the project may suggest ever Improvingcleanliness beyond what is economically and practically viable. Without standards, a projectteam in this field of work is likely to be working without a clear definition of what is expected,although job descriptions may well describe what tasks are to be carried out. Standards, allowothers to be aware of what the project is trving to achieve, and sets a ceiling beyond whichadditional resources are likely to be wasted. The following standards are proposed:
64
•

5.7.3 Monitoring of Operations
. There are two levels of monitoring that should be adopted:
• Operatives, and• Supervision
Operatives
It is necessary in providing a reliable and quality service to be sure that the deflDed work isactually being carried out.
Having defined the quality of work to be undertaken and the area within work is to be carriedout, it should be relatively straight forward to check that the work is being done.
Monitoring further provides the 0pp0l1unity for identifying 'I-IOT SPOTS'. 1-101spot have theresult of diminishing the effectiveness of the rubbish collection scheme, possibly allowing aculture of dumping in cel1ain areas to continue at the detriment of the whole area being cared for.Monitoring should be carried out on a daily basis, but at a time that takes account of the times ofrubbish collection. The Supervisor should be in the field almost permanently whileEnvironmental Operatives are at work. The following items are typical of those that might berecorded during a monitoring regime:
• Date, Time,• Name of Street inspected• Amount of rubbish evident, Including litter• Any Hot Spots, described by location and size
An example sheet is attached. 11is impractical, unless absolutely necessary, to inspect everystreet in a day Therefore, a regime of inspections must be developed that places the supervisor indifferent parts of the service area at different days and times, but so that every street is inspectedover the course ofa defined period, of say a week.
Supervision
Monitoring of supervision is equally important in managing the successful operation of theservice and may simply take the form of reviewing the monitoring sheets on a regular basis, sayonce a week. The following items may be checked:
• Inspection record completed satisfactorily• Appropriate action has been taken agaInst any unsatisfactory pelformance• All streets are being inspected.

Street Name Time Details of rubbish and litter HOT SPOTS -JInspected
I
--
, ,-'-'-' --------~. -~-----.. _. '-" - . - ----
Monitoring Record Sheet
Name of Supervisor:
Supervisor's ('omrncnts:Reasons and Action taken to correct missed or incomplete rubbishcollection:.
66
Date:
•

5.7.4 Performance Indicators
67
Indicators of Standard (\Vork Area Basis)Table 5.1
Petformance indicators and service efficiency f~lctors are valuable in helping assess and evaluatethe service and allows the following to be carricd out:
Having attained this information, comparisons can take place and appropriate Cjuestlons orreviews taken to determine and provide explanations for differences, or influence appropnate'change to work areas. An important factor that may help explain differences in these Indicatorsmay be the characteristics of the area being served, and it is important to record these forapplying the model to other service areas:
• Provide commOIl data across a number ofsilllilar service areas ane! work areas• Allow comparisons across \\lork areas to determine best efficiency_• identify service deficiencies for corrective action• apply the model in other areas in a knowledgeable and informed manner
Information should be gathered based on the service area as a whole. and based on the II1dlvidualwork areas assigned to each of the environmental operatives. The following arc e~amples thatmay be applicable, and all such information should be gathered that is considered necessarv to beable to make proper decisions to improve effectiveness:
-------- --
I-I~useholds served'WAI Number of Density of Ho""h" Id,,,~",I !househo Ids households served per allocated man- per actual man-served =WAla/WAlb hour hour- I--------~Work Area I
Work Area 2I IEtc ..
.._---_.Number Description UnitsWAla Number of households served No .WAlb Area served . Sq uare metresWA2a Distance to nearest Municipal Rubbish Bin from Metres
centre of area._-----
WA2b Time to travel from centre of area to rubbish bin MinutesI-Irs: Illl-ns
---,- ._------WA3 Actual time taken to complete work area ._----~WA4 Charge collection effiCiency =
Number oJ'hoLlseholds payiJl~~ the ehar!!c x 100 IY;)Number of households served
WAS Other waste management oDtions in oDeration

68
Sen'ice Area
Indicators ofStand'lI'd (Service A,'ea Basis)Table 5,2:
The preceding indicators based on work areas "viII assist in reducing unnecessary costs. Thefollowing indicators should be maintained and reviewed on a regular basis:
• With the introduction of recycling and composting, the amount of rubbish collected in thePrimalY Collection is likely to reduce. What changes to the allocated work times, numberof bouse holds served etc. in the affected service areas can be introduced that will allowgreater efficiency of the environmental operatives.
• What other 'added value' environmental selvices could be introduced in the work areas,such as clearing HOT SPOTS, if time is identified following a review.
An overall objective of the project is that it demonstrates sustainability. It is desirable it becomesself supporting financially ifit is to be replicated elsewhere, so that in the long term suchschemes do not require grant aid of any sort.
Costs should II1clude all overheads and capital repayment and finanCing costs that wouldotherwise be payable without grant aid. All grant aid should be excluded from Income costs as ifit was not provided.
Service reviews, ,
ln ensuring the optimum efficiency of rubbish collections, and time allocated to the work area,the following service reviews should be borne in mind:
• The number of environmental operatives and their individual allocated times to workareas, so that appropriate time is allowed for completion of residential rubbish collection,and extended hours of rubbish collection on YIP route is allowed.
Number Description UnitsActual cost of residential rubbish collection per
SAla household served Tk per householdCharge for residential rubbish coJlection per household Tk per household
SAl b served (Must be greater thanor eelual to SA Ia)
Charge Collection efficiencySA2 = total number of households paying charge I total %
number of households servedActual cost ofYl? route rubbish collection per business
SA3a served Tk per businessCharge for VIP route rubbish collection per business Tk per business
SA3b served (Must be greater thanor equal to SA3a)
Charge Collection efficiencySA4 = total number of businesses paying charge I total %
number of businesses served

Chapter 6
Conclusions and Recommendations
6.1 Opportunities to Improve the Solid Waste Management of Sylhet CityCOl'poration
Options for improving the solid waste management services of Sylhet City Corporationinclude efforts to focus on cost effective approaches, to mobilize public support andparticipation, to improve policy interventions, and to close the knowledge gap. Mobilizingpublic SUPP0l1 and participation for solid waste management involves raising awareness ofproblems and solutions and promoting participations by NGOs and by the informal sector Onthe policy side efforts should focus on improving the coverage, efficiency and effectivenessof individual interventions as well as on choosing an appropriate balance of policies and: instruments. This can be done efficiently by creating mutually supportive packages thatemphasize strategic investments and financing.
6.2 Improving the solid waste management of Sylhet City Corporation: Keyprinciples
Win-win environmental solutions occur when environmental and economic goals arecomplementary. City Corporation can develop a service department for helping andencouraging the NGOs, individuals who are interested to work on environmentally soundwaste management services. City Corporation can facilitate the participants by providing landfor resource recovery system without any tax.
69

70
Figurc 6.1: Targct Arca and Kcy Data
Sylhct City Corporation
Tablc 6.1 : Houschold, Commcrcial Units, Population (Block & ward wisc):
Source SylhetCityCorporation(2002)
Block War Numbcr Numbcr of Total Numbcr ofNo d No. of Commcrcia Holding No. PopulationI-Iouschol I Holding
dA 1 1,2,3 4655 749 5404 299732 I1,12 4943 461 5404 254533 13,14 4306 4372 8678 22176B 4 15,16,17 5253 585 5838 271155 18,19 9114 1988 II[02 408386 8,9,10 5777 559 6336 27888C 7 6,7 6322 756 7078 316108 4,5 6990 420 7320 349499 20,21 5549 300 5849' 27745D 10 22 2000 88 2088 1000011 23.24 4074 71 4145 2037012 25,26 4164 - 4164 20818E 13 27 2709 - 2709 13544Total 13 27 65856 10349 76205 332479

Figure 6.2: Block A
,71
:"--< ..<..:." .• . . ;..,;..
Block A
•.~.;..;..,..<.:
Source: Sylhet City Corporation (2002)
Kev Data
Items Number
1. Electoral Wards. 1,2
2. Number of Household 9598
" Number of Commercial 1210o.Units
108084. Total Holding
554265. Number of Population
Main of Paras! Mohollas:Lamabazar, Shoroshpur, Kajolsha, Dorgamoholla,Kaji !lias, Mirermoidan

Block B
Figure 6.3: Block-B
Key Data:
Items Number
I. Electoral Wards. ( Old) 3,4,5
2. Electoral Wards (New) 13,14,16,17,18,19
3. Number of Household18673
4. Number of CommercialUnits 6945
25618
5. Total Holding90128
6. Number of Population
Main of Paras/ Mohollas:Taltola, Topkhana, Kajitola, Howapara.Kumarpara, tvIirabazar
Source Sylhet City Corporation (2002)
72
, ,

Block C
Figure 6.4: B1ock-CKey Data:
ltems Number-----~~---
I. Electoral Wards ( Old) 6, 7, 8
2. Electoral Wards (New) 4,5,6,7,8,9
" Number of Household 19089o.
4. Number of Commercial 1735Units
20824
5. Total Holding 94447
6. Number of POJlulation
Main of Paras/lVlohollas:Kanishail, Bagbary, Housing Estate, Shubidbazar,Amberkhana, Mozumdary
Source Sylhet City Corporation (2002)
73
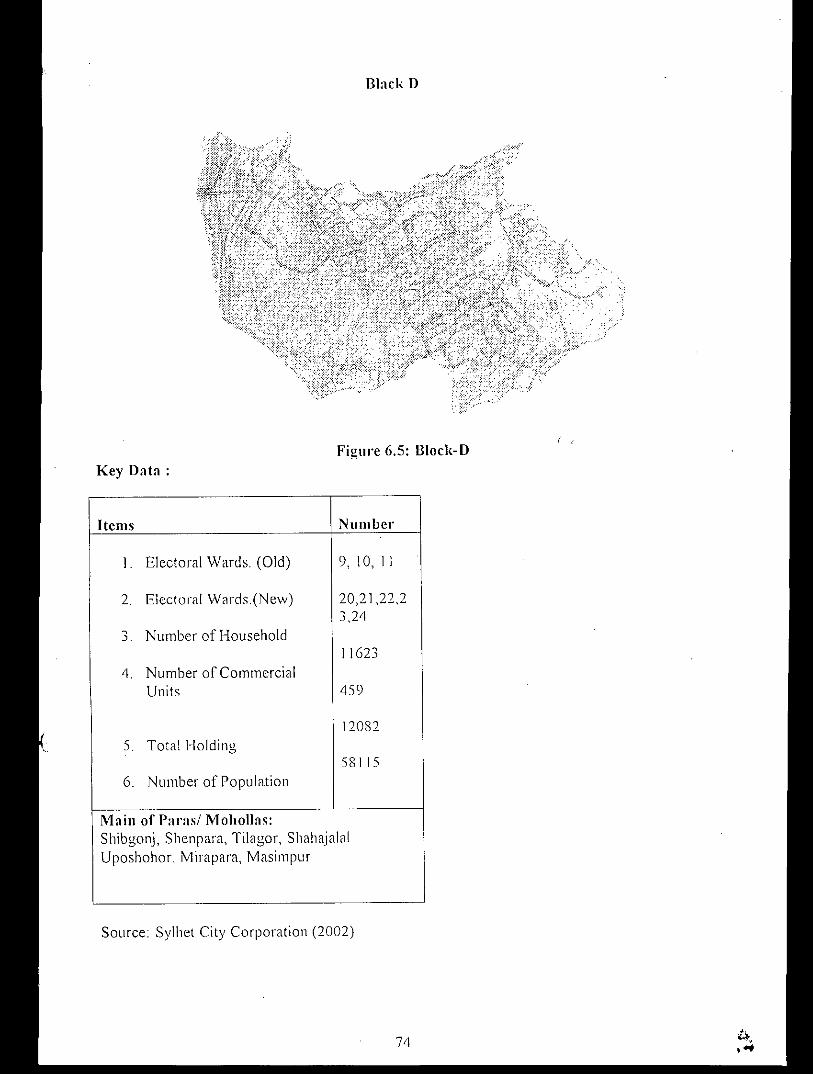
Black 0
Figure 6.5: Bloc!{-DKey Data:
Items Numbe,'
1. Electoral Wards. (Old) 9, 10, I]
2. Electoral Wards.(New) 20,21,22,23,24
3. Number of Household11623
4. Number of CommercialUnits 459
120825. Total Holding
581 156. Number of Population
Main of Paras/ Mohollas:Shibgonj, Shenpara, Tilagor, ShahajalalUposhohor, Mirapara, Masimpur
Source: Sylhet City Corporation (2002)
74

Block E
Figure 6.6: Block-E
Key Data:
Items Number
1. Electoral Ward ( Old) 12, 13
2. Electoral Wards ( New) 25,26,27
1 Number of Household 6873j.
4. Number of Commercial -
Units6873
5. Total Holding 34362
6. Number of Population
Main of Paras/ Mohollas:Shibbari, South Surma, Kodomtoly, Vartokhola,Khozerkhola, Gotatibari
Source: Sylhet City Corporation (2002)
75•\.

Table 6.2 Land Requirement for Composting Activities in Sylhet City Corporation'
Zone of No. of No. of Quantity Quantity of NecessarySylhet City Household Households of Waste Compostahle LandCorporation in 2002 ~l to 2025 (101.'2 __ .Jlortion (ton) (sft)-------- ..•8-' J._ ------I 10808 3 10730 564 J " 35733'J_~
2 25618 736518 1336 909 8480973 20824 598690 1084 739 6494874 12082 347358 631 430 4011905 6873 197599 359 245 228585
Total Land Required 2484698 sf! = 5734 decimal = 192 care
Assuming Household change rate -25.2%, Waste generation rate is .33 kg Icapl day, aveI'agehousehold size is 5.5, cornpostable portion in household waste is 683% and 933 sft isrequired for 1 ton compo sting plant ( Data Source Baseline Study of Sylhet City Corporation(2002)
76

f)fAGRAM 1- EYISTING W4STE MANAGEMENT INSYUIET
I!J~ size Olfhl' j,oxji;r each ,'I(,lIIenl rej!re,\enls Ihe siz~ oflhe aclil'illl 111relalf()lIlo, and lI'hen, all olher inlenlej!endenl elelllelllS ar~i" jJ/acl' ((lid 'J'orking
A\V<lI"t'llCS ...,
Raising.&.Education
Recycling &Composllng
Prim;:arv rnl1pr.tinn
RubbishGener'ation
Rubbish for disposalBlockedDrains
j
Secondary Collection
Rubbish Disposal
77
Clearanceof Drains

f)JAGRAM 2 - mEAl, INTE(,'RATEf) APPROACH TO WASTE MANA GEMENT IN ,ST/BET
{he si~L' nt/lie /.lox.!()!" r.!uch l'/cmCII! represents !he size (!(r!ll.! ((clilo'ily in relation In, and \l'hen, oIl other interdependent clelJ1en/s orc
ill IJ/rlL\' ullc!ll'()l"king.
Awareness Rubbish Waste.~
ReductionRaising & GenerationEducation
I PRIMARY COLLECTION I~ ---~
Recycling Composting Rubbish fordisposal21%11 'X, 68%
RehabiJ itation,reconstruction Clearance &and maintenance Protection Secondary Collection.of collection of Drainspoints
Rubbish Disposal
•~
78

6.3 Recommendations as wcll as snggcstions for Promoting Community bascdSolid WastcManagcment systcm in Sylhet City Corporation
• The policy makers ofSylhet City Corporation should consider the problems result fromunhygienic solid waste management with importance and the policy of the conservancystrategy should encourage the participation of NGOs and private sector in conservancyservices.
• The waste generation rate is 0.34 kg/cap/day. Most of the households (73%) produced 1-2kg daily Among the household waste, 34.7% is coming rrom cooking, 27% is comingfrom homestead activities and the rest covers cosmetics, toilet, education and cloth.Among the household waste 68.3% is compost able, 1 1.7% recyclable and the rest 20%is disposable.
• In developing the master plan of the City Corporation, Sylhet City Corporation shouldconsider the necessalY land (192 care) for recycling of waste for next 25 years.
II Sylhet City Corporation should consider and facilitate the private body who areinterested in composting by providing land and supplying raw materials for composting.
• Sylhet City Corporation should take massive awareness programme to involve all thestakeholders such as expert, academicians, city dwellers, civic societies, city councilauthorities, city dwellers to aware the people in participating the model wastemanagement programme.
t
()
79. ..."
U"

REFERENCES
Ahmed, M. F. (1993), "Municipal Wasle Managemenl in Bangladesh 'I'ilh i;;mphasis onRecycling", presented in the Regional Workshop Urban Waste Management ITl AsianCities, Dhaka, April 10-12.
Ahmed, I\!J. F. and Rahman, M. M. (1994) Composting: "A fJolentiaiji)r /(esourceRecycling in Bangladesh, Resource Waste: Source oj'income" Goethe Institute: GermanCultural Centre, Dhaka.
Ahmed, M. F and Rahman, M. M. (2000) "WaleI' Supply and Sanilalion _HI/ml amILow income Urhan Comml/nilies" First edition, !TN - Bangladesh.
Ahsan, T and Ahmed, S.A (2001), "Comml/nily hased Solid Wasle Managemcnl I'ilotProjeci in Khulna Cily: Problems and Prmpecls" Papers and proceedings of the regionalseminar on community based solid waste management with support from RUDO andUSAlD.
Ali, AK (2002), "Keep ~),Ihet Clean" An unpublished article made to get a land forcomposting in favor ofSylhet Pm1nership.
Chowdhury, M. A, Rahman, M. H, Saha, G. c., Mannaf, M. A, Rahman, M, Ali, SandAli, M. (2002), "Solid Waste Managemenl Slail/s in Bangladesh ", Proceedings of the 281hWEDC Conference, Kolkata, India, November. , ,
Enayetullah, l. (1995), "A Siudy oj'Solid Wasle Managemenl.li)r l."n,'imn/lIL'nta!impmvemel1/ oj'Dhaka Cily", an unpublished Master thesis, Department of Urban andRegional Planning, BUET, Dhaka.
Enayetullah, I & Sinha, A, l-I. M. M (1999 - 2000) "Ahorjona () IJarihesh" _ aNewsletter on Recycling and Waste Management in Bangladesh, Produced by WasteConcern, Dhaka, Bangladesh with support from Regional Urban Development Office(RUDO), USAID, New Delhi, Issues 1,2,3,4, and 5.
Enayetullah, I. and Sinha, A H. M. M. (2000), "Col1ll1lunily Based Solid WasteManagemenl: The Asian Experience ", Papers of the Regional Seminar on CommunityBased Solid Waste Management, Published by Waste Concern, Dhaka, Bangladesh
Furedy, C. and Lardinois, 1. (1999), "Source Sepamlion oj' HOl/sehold WasteMalerials: Analysis oj' Case Stl/dies Fom Paki,\lan, Ihe i'hi!lijJincs, india, 13m:i!,'Argeminil ond Ihe Netherlands", Urban Waste Series-7, Gouda WASTE.
LGED ( 1989 ) IISocio-eco17ollJic ,,)',,rvey on LOlt, Cost 5'onilalio17 in Y P()lIrashcf\-'os",Local Government Engineering DepaI1mcnt, Gov!. of Bangladesh, Dhaka.
80
\.
ABBREVIATIONS:
Yousuf, T B. (1996), "Suslainabilily o/Solid WasleManagemenl S)lslem o/Dhaka CilyCorporation ",M. Sc. Thesis, Dept. of Civil Engg. BUET
81
Bangladesh Bureau of StatisticsBangladesh University of Engineering & TechnologyCommunity Based OrganizationCommunity Based Solid Waste ManagementConservancy InspectorLocal Government & Engineering DepalimentNon-Government OrganizationSylhet City CorporationUnited Nation Development Programme
Sinha, A H. M. M. (I 995), "Solid Wasle Managemenl and Recycling in Dhaka:Problem and PI'O,ljJecls",a paper published in EARTH Magazine, issue no-4.
Sinha, A H. M. M. (1993), "The Formal and Injhrmal Sector Linkages in WasleRecycling: A Case o[Solid WasleManagemenl in Dhaka Cily." An unpublished M. Sc.Engg. Thesis, Human Settlement, Asian Institute Technology (AIT), Bangkok, Thailand.
Rashid, H. U., Rahman, M. M. and Turnquist, S (1994) "Bangladesh Silualion Analysis- WaleI' Supply and Sanilalion," Ministly of LGRD&C, lJN1CEF, UNDP and UNDP-World Bank Water and Sanitation Program, Dhaka.
Salam, IVI A (2000) "Analvsis and /)esign (J{Solid Wasle Management Svslem li)r"Residential Zone o/Dhaka CiIV".M. Sc. Engg. Thesis, Department of Civil Engineering,BUET
Tayler,I(. (2000), "Guide 10 Siralegic Planningji)r Municipal Sanilalion ". Apublication ofGHK Research and Training in association with WEDC and WSP-South Asia
Sutradhar, R. (2002) ''A Sindy on Solid Wasle Managemenl Syslem of DhakaMell'Opolilan Cily" M. Sc. Thesis, Dept. of Civil Engg BUET.
BBSBUETCBOCBSWMCILGEDNGOSCCUNDP
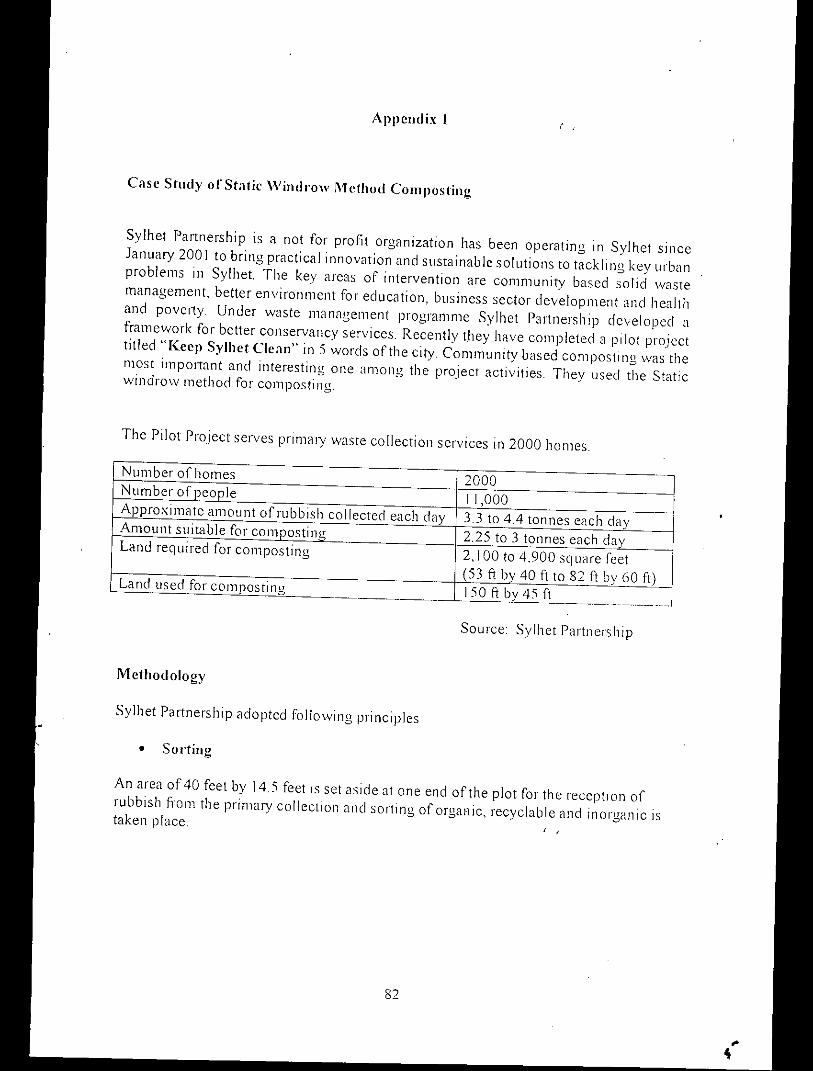
82
• Sorting
/ ,Appendix I
Case Study of Static '''indrow Method Composting
Source: Sylhet Partnership
Sylhet Pal1nership is a not for profit organization has been operating in Sylhet sinceJanuary 200 I to bring practical innovation and sustainable solutions to tackling key urbanproblems in Sylhet. The key areas of intervention are community based solid wastemanagement, better environment for education, business sector development and healthand povel1y. Under waste management programme Sylhet Partnership developed aframework for better conservancy services. Recently they have completed a pilot projecttitled "Keep Sylhet Clean" in 5 words of the city. Community based compostlng was themost impol1ant and interesting one among the project activities. They used the Staticwindrow method for composting.
The Pilot Project serves primalY waste collection services in 2000 homes.
Methodology
Sylhet Pal1nership adopted following principles
An area of 40 feet by 14.5 feet IS set aside at one end of the plot for the reception ofrubbish fi:om the primary collection and sorting of organic, recyclable and inorganic istaken place. , ,
,Num ber of homes 2000Number of people 11,000Approximate amount of rubbish collected each day 3.3 to 4.4 tonnes each dayAmount suitable for compostinl! 2.25 to 3 tonnes each davLand required for composting 2, I00 to 4,900 sq uare feet
(53 ft by 40 ft to 8? ft by 60 ft)Land used for composting 150ftby45ft
--~-..._._~ ---

83
...•.
Rubbish Colleclion from householdFigure 6.3:
• Composting '-~maturing
Figure 6.4: Drying of Compost
( ,
Sylhet l'a/1nership engaged 6 labours to operate the plant.
Eight boxes of each 160 sft size and two packaging platform of each 350 sft isconstructed at the middle of the plot. Each box receives seven consecutive dav's rubbish,so that all boxes can receive 8 weeks consecutive rubbish.
The boxes have internal dimensions of approximately 25' x 6.5' and:" reel tall, givingeach a capacity or 810 cubic feet.
The packaging area is two each of 25 feet by 14 reet.

COilS t rue ti 011
Water. drainage and electncity is provided The whole facility, including sOlting,COlllpOStlng, maturing and packaging area is covered to protect workers from sun andralll, and to reduce unnecessulY drying out of compost.
The sorting area is of concrete slab construction, with suitable drainage and soak away toallow washing down and prevent accuJ1lulatlon of foul water around the facility. AwashIng area for the operatives is provided.
The COJ1lpOsling bays are constructed of hollow block with one-sided steel door.
All other areas between and around the COJ1lposting bays are concrete, while the base ofthe bays is open to the earth, allOWing dra111age to the underlying soil and migration ofworms, invertcbrates and the like.
84
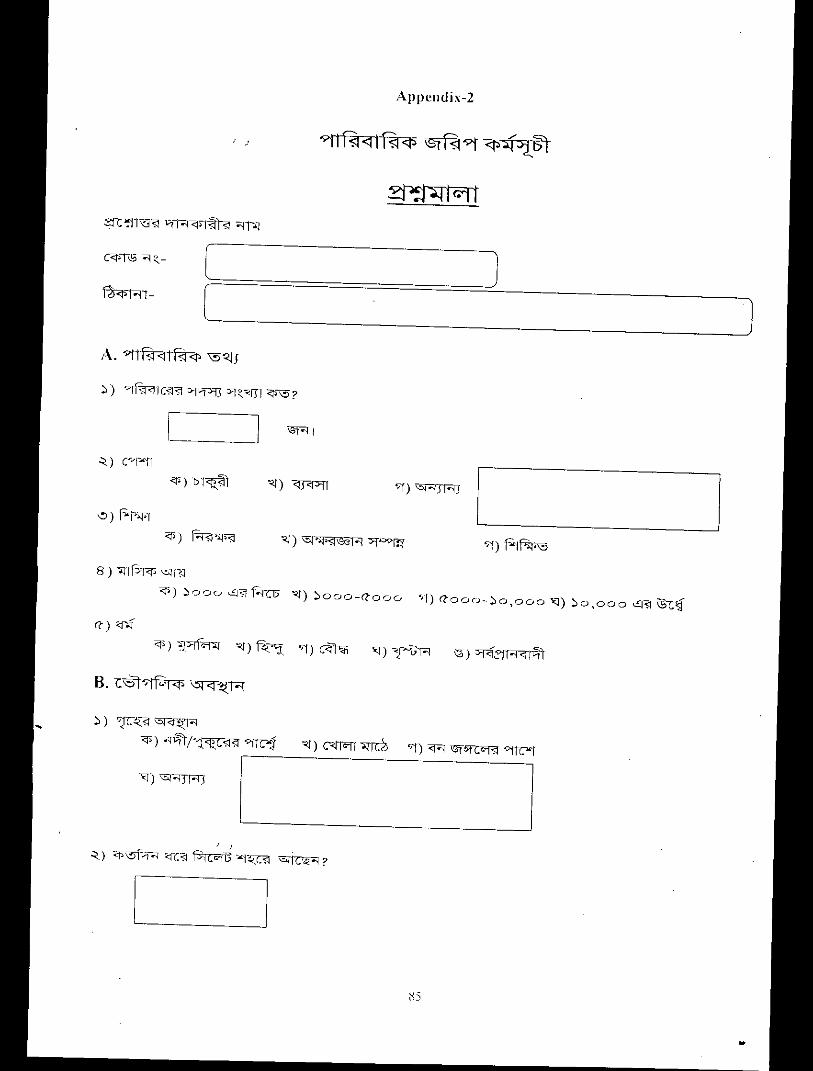
]
18'R I
[
[~-------]
1- ]"-)el~fI
<I')D~
':l ) J'<r"l'l<1') R-:<f'1'S1
Appcnuix-2
:\5
8 ) 'lnJ'I<I' "'11$1
<1$) ~ooo ..£J"?i R-CI5' <J) ~OOO-((ooo ~/t)Qooo-~o,ooo"'i.:l) ~o,ooo ~Sf ~~
~) ";IC"'~"'<<1"(1",
<1')"'lqjr"ftC~ ~ '<I) c<1T"'rprrcz, "f) <R"f~ ~r
1 1
, >'"-) <!'-'5f",~ "ref! f~ ~I"CBI ~?

%) c<rl\501
<I)~-8 ~
~) <rr>fRl <:i'Fi
<1')fur-i <I) ~I "1) "'1"1) H)8 ) <rPTRI C'<Jf."3Z ., Z
~) <rc'S]j <I ~<;"l
<P ) ~-., <1'11:<1 <I) ~TI 'fA <!J<P-<:I1:'il
~) <rc~ <r<'R<p) <IT"') "'F"rF<l{~ <I) <l'1"f';l
" "
~) <rciSffil QrA"f19<p) ~ -~ r<Pf~
~) ":fl ~<rpr:!(I'''R1 '<n 'il'QfK!>l:'il'il 6RJ "T~ <PC'!l"l 'pj; 'TI?
<p) <&1, <I) "'IT

"I)~RJ I~ _
. ,
i) itr, ?,(e"1Pl> F<P<1') "J[q} "'F"~~
i i) c:<l'''< OJ ~:J",'<!',3R ?<1') "1"13 "1)"1",,-le<;R1~ "'J)~~
8) ~~, '5I"r'-i'rf."'l'3[~ ~ ~I C1"'f'J (~f.1'<PP<[f.'1 ~ "1)(%,.) <lR~ ?
<p )'<1'1 "'J) .,1
~) '5W~r"H <1'1"11 C-'fC<ISH% "1 &1 \ST'2'F<r c-'E! ~'.,;5 <P\5 ?<1') )0 <l\VS'P1 f.'rc15 "'J»)o c<lc<I' -"'0 "fi!;l. "1) -"'0 c<lGl' "'0 "fi!;l <1) "'0 "fi!;l c<IGl' c<r4t
"') '3l1<rGT"'1 J'1I<iT"!"'l~ C<1'R ~ '51'2i~re., c<Pe"1'1?<1') "l<1'[("1 "'J) ':l,?.[(:<1 "I) <lTe;£) <1) G1 c<I'B :>~
~~OJ ~~rtTi<l.,('1 'G ~

'71)~~,,~ T.>:rfC'P"I) ~<l-C~ <PTClll
I
'<) "Im-C"l<l ~I c<l'R "l>:rC11"'ff'<f'l'Rl <i'~ '01?<Ii) :>f<fSTC'1 <I) 'J:"'JF'l "1) iliC"1 "I) c<1T.<i'A ~
'<) "'T;l:Ff\5 ~<rRl <PRlV'i Pis Pis @1'11.cC", "'rfC<l?<1') "P.'lRrnI <1) '5f1"lT><P.'l '1) <i'T.'1'?11 '<1)i>-[';.;:<i"C1T'!3 '!!» T.'{,j'71 15) '1TfC~ 'Zi) C?("'ffGl1<:f[;"'1
~) ,,~C"<<j mJ'1I T.<i'A ~ '1i'1<iIi:(C"l<l >:rlm'1~rf'<I\5 "0l?<1') C-<ffi'fl~ <I) <i"'<ii~ '1) ~ "rn", "I) '31'1) 1'1)
"') <P1lfi1;l <iT<i<rrC"<"l<,wn "'r~Rl ~ '01?<1') ~ f",~ <1) ~ f't-I '1) '" f't-I "I) '3I"l) l"l)
~) '3I1<iibf~rr';l'''If;';<Ii<rPI'!i'FFfI'?1 '5<'5TC<if~'J<1; "'1"l"'III"';I12 B1?<1') "'T!:;:)'71'" <1) "'!l.<iC"P<1'>1'" "1) '51"1r.'1R:><l'
G:) "'1<1';Irg "'ffC':'''l "T'111,,~.qc--of?I '11l"1Rl Pis '3I<I'!(1 -I.c'l?<1') @" "'fC'P <I) ~P.'l "'IC\!P <'I) '3IPlTP1<P '-'1"1P1'P.! "I) l!:if"[f><IT:l1
~ ) ",f2f<rr."l'?lq-<f!;(A c<l'1"fP.'l?<1') ~~ f.T<pf; <1)~~/"1z~ Fr-,",i>
'!!» "'RTA11 I
'<) ~C~ ~ ~9f?<rs) "'fBll>z('l ,,~ 'l\5 <1) '5f5tl CDffiI '1) '3ATA1 I
"') "f2NC"<'?I ~I "l1<iFi'Fl'" '@"'fC15~ GFrI? ~- -----------
-,;jl :'~I :,nl<1 '>rC'P? 1~)_~ ~18) ",'BPi" C<IT.<I'R<lf\5 '5?f'1 "11'fl~ c<P1Q1Bl"'IC'P?
"') "10J<rs 'SF'1'!i'IT."l'3If<li!l1-'f1r"f\?'1 f'l,-;q-I <;1'<"'"''''1/ <rs~f"l 'i''FJ <lfC<A f'l,-;q-I ?<1') '<:if <1) ~

iii) c<!TIrr Z'1
IJ) o>ic"n"i ~) "'<<1TR1 I~ _~_I
vi) '51"1)H)
\:J) "l"~ c<Rm:<r <i'ji!lj ~'iZ, \5TC'11l "I'TC'S1 "'<1?fA ~ ~I?"1') ~ -.I) .,1
~) ~'>j<TR'I i8R1 c<l'FI <r~ -.I<;Il5 <1"'.-1 <r<'lc':APe--.,-r?"1') ~ -.I) .,1
~) '5l1"'RB '-'1~ '511<161"11"l"'-"JC~i8RP'!~-:i1T["I c<l'FI "l,,~ <l'T<9j~ ~?"1') ~ -.I) on
~ '<C"f "l"~<Tf"1 '8 ~ 1 _
vii) ",<"1)1"1)I~ ~"i) <rm'I:"A
i) f"!B "f'I11?R! '0
~) 9ff.'~r "[\5 ~ ~ ~ "'.C,=, "'IK<;I?<1')~'I:"Ai) ~ ~ 11,=,I """ <f'l:<;I i i) "'< "I) HI
-.I) ~'I:"Ai) 9f1"R -.,-'2 '0 i i) '>fIM c'" <i"'ii '0

~) .,1
911
8) "1"<:<1JFITC<l ~ <:Wt""l1~ ~D"'''I", I~'" c<PR '&:"'TJ1"f ~ = f<\; '3l1?fR \5TC'" "'l,,"t ~"f 'S~<rr0i'51 4'<'1VI"I ?
~) '3l19ff.'\P1f1> <!5T.<frc:~ ~ ~"'RBl 1-1 !'I'1<11G ~ ",Ie"l "I ~?. <1") itn ~) .,1