integrated modeling to predict occupant thermal … modeling to predict occupant thermal comfort r....
TRANSCRIPT
01A1024____________________________________________________________________________________________
INTEGRATED MODELING TO PREDICT OCCUPANT THERMAL COMFORT
R. Farrington, G. Barber, T. Hendricks, W. Marion, T. Markel, R. McGuffin, J. RughNational Renewable Energy Laboratory
Golden, Colorado, USAhttp://www.ott.doe.gov/coolcar
AbstractThe two primary functions of a vehicle climate control system are safety through de-icing and de-foggingwindows, and occupant thermal comfort. However, vehicle air-conditioning systems can significantly impactfuel economy and tailpipe emissions of conventional and hybrid electric vehicles (HEVs) and reduce electricvehicle (EV) range. In order to meet the new U. S. Supplemental Federal Test Procedure (SFTP), as well asgrowing concern about vehicle fuel economy, automotive engineers are being challenged to evaluate amultitude of new opportunities for reducing the impact of vehicle air-conditioning systems on fuel economy andtailpipe emissions. Because there isn’t enough time to fabricate and test each system, a good modelingapproach is essential. However, many models are required to evaluate solar spectral data, glazing spectralproperties, cabin temperature and velocity fields, occupant thermal comfort, and vehicle fuel economy andtailpipe emissions. The focus of this paper is to describe an approach used at the U.S. Department ofEnergy’s National Renewable Energy Laboratory to evaluate the largest climate control load, air conditioning,by integrating diverse models.
1.0 IntroductionThe mission of the U.S. Department of Energy's (DOE) National Renewable Energy Laboratory (NREL) is tolead the United States toward a sustainable energy future by developing renewable energy technologies,improving energy efficiency, advancing related science and engineering, and facilitating commercialization. Tosupport this mission, NREL’s Cool Car Project works with the automotive industry to reduce the fuel used forvehicle climate control by 50% in the short-term and 75% in the long-term while maintaining or improving theoccupants’ thermal comfort and safety.
This paper focuses on the largest vehicle auxiliary load – air conditioning. The power necessary to operate avehicle air-conditioning compressor can be greater than the engine power required to move a mid-sizedvehicle at a constant speed of 56 km/h (35 mph). The air-conditioning load can decrease the fuel economy ofa conventional vehicle by 10-20%, a mild HEV by up to 35%, and 3L/100-km vehicle by 50%. The UnitedStates could save over $6 billion annually if all the light-duty vehicles in the country achieved a modest0.4-km/L (1-mpg) increase in fuel economy.
It is challenging to reduce the climate control loads in a vehicle without adversely affecting occupant thermalcomfort. Occupant thermal comfort modeling is essential to ascertain the acceptability of advanced, energy-efficient thermal comfort systems. Modeling has certain limitations and assumptions, however it can provide arelative comparison between system configurations. A benefit of modeling is to evaluate and select systemsprior to fabrication and testing, therefore, there is a great need to rapidly evaluate advanced thermal comfortsystem designs1 through modeling. The models involved are inter-disciplinary, including expertise inthermal/fluids, statistics, meteorology, optics and materials, human physiology and psychology, and vehiclesystems, leading to creative thinking and innovation.
2.0 BackgroundIn 1998, gasoline use in the United States was about 473 billion liters (125 billion gallons) for on-road use,2
including gasoline-fueled commercial trucks. Also in 1998, there were about 203.6 million cars and light-dutytrucks on the U.S. roads3 using an average of 2316 liters (612 gallons) of gasoline per vehicle annually. Givencertain assumptions4 about automobile use5 and air-conditioning use6, about 235 liters (62 gallons) of gasolineare required annually for operating the air-conditioning system. An additional 12.7 liters (3.4 gallons) pervehicle are used to carry the additional weight of the air-conditioning system6 leading to about 40 billion liters(10.6 billion gallons) of gasoline annually in the United States for operating vehicle air conditioning.
Until recently, little has motivated U.S. auto makers to find ways to reduce the impact of air conditioning on fueleconomy and emissions. But a new emissions regulation, the Supplemental Federal Test Procedure7 (SFTP),includes operating the air conditioning during part of the emissions testing procedure. The SFTP for vehicleswith gross vehicle weight under 2720 kg (6000 lb.) applies to 25% of model year (MY) 2001 vehicles, 50% ofMY2002 vehicles, 80% of MY2003 vehicles, and 100% of MY2004 vehicles. Although the SFTP is not used tomeasure fuel economy, reducing the weight of a mid-sized vehicle’s air-conditioning system by 9.1 kg (20 lb.)results in about a 0.04 km/L (0.1 mpg) increase in fuel economy on the current combined city/highway test.
The Clean Air Vehicle Technology Center has measured the effect of the air-conditioning system on fueleconomy and tailpipe emissions for a variety of vehicles.8 Table 1 compares seven vehicles (’95 Voyager, ’97Taurus, ’95 Civic, ’95 F-150, ’97 Camry, ’96 Camaro, and ’95 Skylark) with the air-conditioning system on andwith the air-conditioning system off over the SC03 drive cycle.
Table 1. Measured Impacts of Air-Conditioning System Operation
Increase with AirConditioning On
CO (g/km) +71%NOx (g/km) +81%
NMHC (g/km) +30%Fuel Economy(km/L or mpg)
-22%
On average, the air-conditioning system increased CO emissions by 0.42 g/km (0.675 g/mile) and NOx
emissions by 0.053 g/km (0.085 g/mile). If we assume that vehicles are driven 19,300 km (12,000 miles)annually, the air-conditioning system operates 45% of the time,6 the test results are representative of light dutyvehicles, and 80% of the vehicle fleet have working air-conditioning systems, then vehicle air-conditioning usein the United States increases CO emissions by 594,000 metric tons (655,000 tons) and NOx emissions by74,000 metric tons (82,000 tons).
3.0 Integrated Modeling ApproachEvaluating occupant thermal comfort is complex. For example, a key element for determining occupantcomfort is the amount of thermal radiation on the occupant’s face, which can be from direct solar radiation aswell as re-radiation from an absorbing glazing. Air-conditioning systems compensate for this thermal load byforcing air across the face to reduce the skin temperature. Predicting occupant thermal comfort requires anunderstanding of the solar radiation transmitted through the glazing, thermal re-radiation from the glazing tothe face due to absorbed solar radiation, the air temperature and velocity passing the face from the air-conditioning system (which vary with engine speed and vehicle speed), and the surface temperatures of thecabin that also re-radiate thermal energy to the face. Additionally, the transient air-conditioning load on theengine affects fuel use and tailpipe emissions.
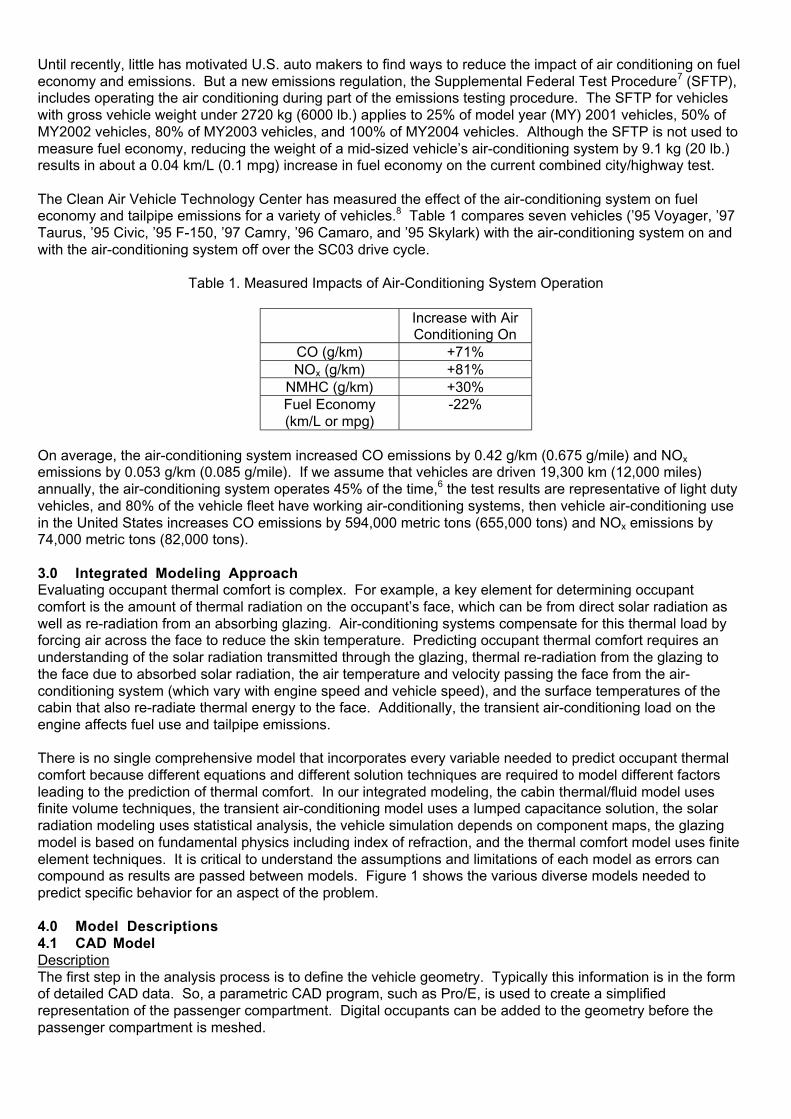
There is no single comprehensive model that incorporates every variable needed to predict occupant thermalcomfort because different equations and different solution techniques are required to model different factorsleading to the prediction of thermal comfort. In our integrated modeling, the cabin thermal/fluid model usesfinite volume techniques, the transient air-conditioning model uses a lumped capacitance solution, the solarradiation modeling uses statistical analysis, the vehicle simulation depends on component maps, the glazingmodel is based on fundamental physics including index of refraction, and the thermal comfort model uses finiteelement techniques. It is critical to understand the assumptions and limitations of each model as errors cancompound as results are passed between models. Figure 1 shows the various diverse models needed topredict specific behavior for an aspect of the problem.
4.0 Model Descriptions4.1 CAD ModelDescriptionThe first step in the analysis process is to define the vehicle geometry. Typically this information is in the formof detailed CAD data. So, a parametric CAD program, such as Pro/E, is used to create a simplifiedrepresentation of the passenger compartment. Digital occupants can be added to the geometry before thepassenger compartment is meshed.
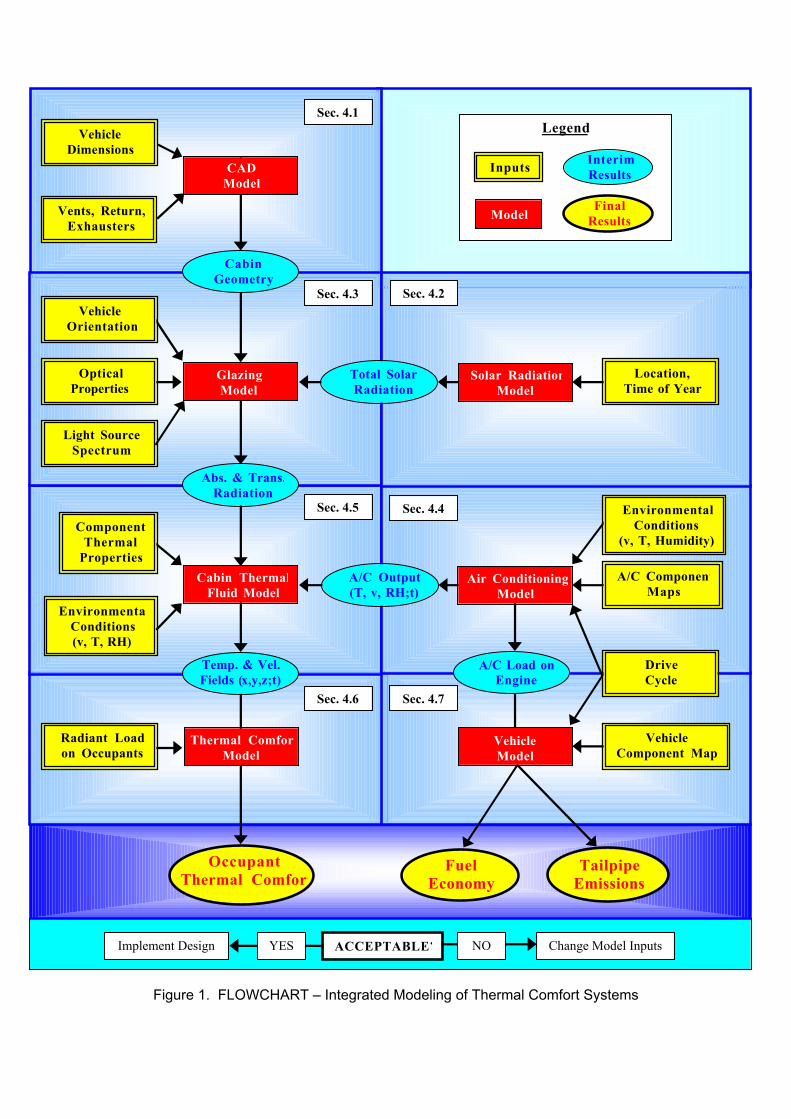
Figure 1. FLOWCHART – Integrated Modeling of Thermal Comfort Systems
GlazingModel
Solar RadiationModel
Thermal ComfortModel
Air ConditioningModel
Abs. & Trans.Radiation
CADModel
VehicleModel
Cabin ThermalFluid Model
Temp. & Vel.Fields (x,y,z;t)
CabinGeometry
OccupantThermal Comfort
Total SolarRadiation
A/C Output(T, v, RH;t)
A/C Load onEngine
FuelEconomy
TailpipeEmissions
VehicleOrientation
OpticalProperties
ComponentThermal
Properties
Radiant Loadon Occupants
Location,Time of Year
DriveCycle
EnvironmentalConditions
(v, T, Humidity)
A/C ComponentMaps
VehicleComponent Maps
Light SourceSpectrum
Legend
Inputs
ModelFinal
Results
VehicleDimensions
Sec. 4.1
Sec. 4.3
Sec. 4.5
Sec. 4.6
Sec. 4.2
Sec. 4.4
Sec. 4.7
InterimResults
Vents, Return,Exhausters
YES ACCEPTABLE? NOImplement Design Change Model Inputs
EnvironmentaConditions(v, T, RH)
InputsThe CAD data can be in the form of native files or translation files such as STEP or IGES. These CADsurfaces are used to morph a generic parametric vehicle or to create a simplified one-time Pro/E model toapproximate the cabin geometry. The vents, recirculation inlet, and extracters are defined, as are the CADoccupant models, such as shown in Figure 2.
ResultsThe passenger compartment interior and occupants are meshed by using a 3rd party mesh generator, acomputational fluid dynamics (CFD) preprocessor, or the Pro/E mesh generator. The mesh, an example ofwhich is shown in Figure 3, has an exact correspondence to the CAD geometry; including open areas andwalls and is comprised computational fluid volumes, boundaries, and blocked elements.
Limitations and AssumptionsThe results are affected by the choices made, such as how much detail of the cabin interior to model. Usersmust decide if computational time should be expended modeling the conduction heat transfer inside theheadliner, door cavities, seats, instrument panel, etc. or to define the passenger compartment at the innersurfaces. Users must also decide if they should model the air flow external to the cabin or simulate theexternal heat transfer with boundary conditions. Key limitations of this model include grid resolution, the timestep for transient solutions, the turbulence model, and the convergence criteria. A fine mesh may be neededaround turbulent jets while a coarser mesh may be acceptable in areas of low air velocity.
ValidationThe quality of the geometry is checked by a visual comparison of the Pro/E model and mesh with the originalvehicle CAD data.
4.2 Solar Radiation ModelDescriptionThe solar radiation model calculates the solar spectral irradiance incident on the vehicle as a function oflocation, weather, and vehicle orientation. The spectral irradiance is calculated over a range of 300-2500 nmat 5 nm intervals using the model SEDES developed by Nann and Riordan9.
InputsModel inputs include the sun’s position as described by its zenith angle and azimuth angle, atmosphericozone, dew point temperature, pressure, ground reflectivity, direct normal solar radiation, diffuse horizontalsolar radiation, and the vehicle surface and glazing orientations as described by angles of azimuth headingand tilt from horizontal.
Model input data are available for 239 locations in the United States and its territories in the form of weatherand sun position data extracted or derived from typical meteorological years (TMY).10 A TMY is a data set ofhourly values of solar radiation and meteorological elements for a one-year period judged to be typical for theparticular location. To meet users’ needs, data from any hour of the day from 239 locations may be used asinput to the spectral irradiance model.
Figure 2. Digital Occupant Figure 3. Sample Mesh
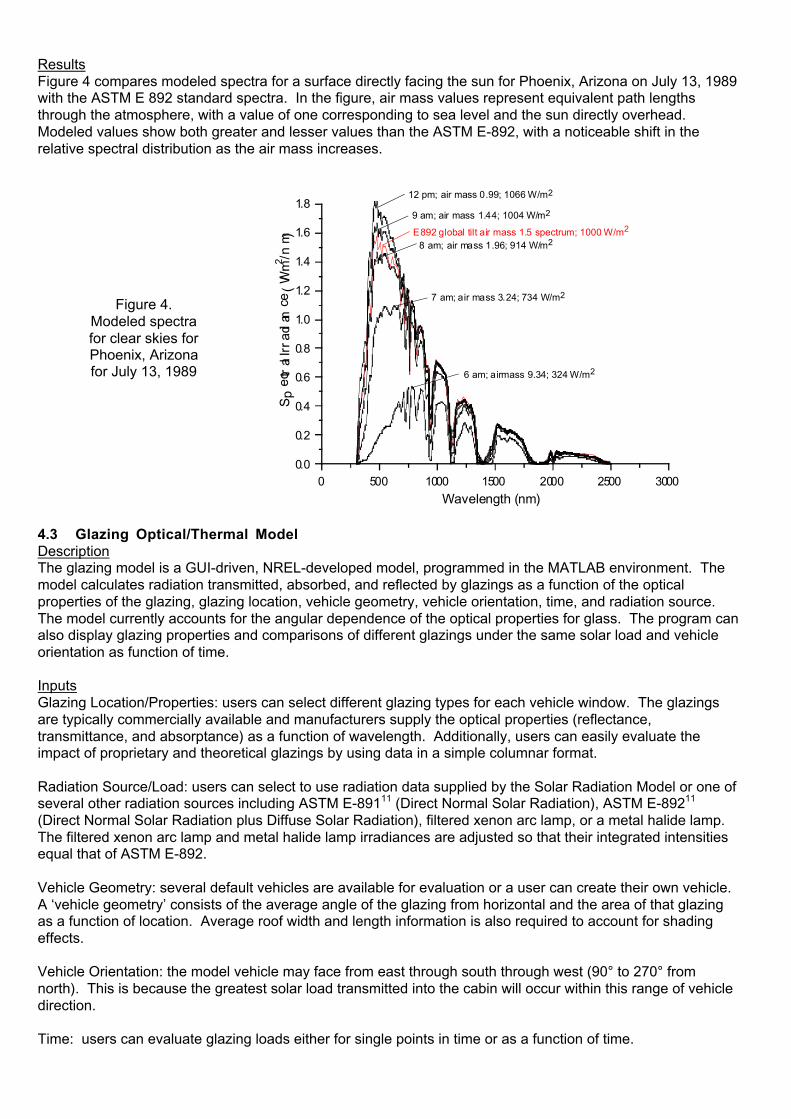
ResultsFigure 4 compares modeled spectra for a surface directly facing the sun for Phoenix, Arizona on July 13, 1989with the ASTM E 892 standard spectra. In the figure, air mass values represent equivalent path lengthsthrough the atmosphere, with a value of one corresponding to sea level and the sun directly overhead.Modeled values show both greater and lesser values than the ASTM E-892, with a noticeable shift in therelative spectral distribution as the air mass increases.
4.3 Glazing Optical/Thermal ModelDescriptionThe glazing model is a GUI-driven, NREL-developed model, programmed in the MATLAB environment. Themodel calculates radiation transmitted, absorbed, and reflected by glazings as a function of the opticalproperties of the glazing, glazing location, vehicle geometry, vehicle orientation, time, and radiation source.The model currently accounts for the angular dependence of the optical properties for glass. The program canalso display glazing properties and comparisons of different glazings under the same solar load and vehicleorientation as function of time.
InputsGlazing Location/Properties: users can select different glazing types for each vehicle window. The glazingsare typically commercially available and manufacturers supply the optical properties (reflectance,transmittance, and absorptance) as a function of wavelength. Additionally, users can easily evaluate theimpact of proprietary and theoretical glazings by using data in a simple columnar format.
Radiation Source/Load: users can select to use radiation data supplied by the Solar Radiation Model or one ofseveral other radiation sources including ASTM E-89111 (Direct Normal Solar Radiation), ASTM E-89211
(Direct Normal Solar Radiation plus Diffuse Solar Radiation), filtered xenon arc lamp, or a metal halide lamp.The filtered xenon arc lamp and metal halide lamp irradiances are adjusted so that their integrated intensitiesequal that of ASTM E-892.
Vehicle Geometry: several default vehicles are available for evaluation or a user can create their own vehicle.A ‘vehicle geometry’ consists of the average angle of the glazing from horizontal and the area of that glazingas a function of location. Average roof width and length information is also required to account for shadingeffects.
Vehicle Orientation: the model vehicle may face from east through south through west (90° to 270° fromnorth). This is because the greatest solar load transmitted into the cabin will occur within this range of vehicledirection.
Time: users can evaluate glazing loads either for single points in time or as a function of time.
Figure 4.Modeled spectrafor clear skies forPhoenix, Arizonafor July 13, 1989
0 500 1000 1500 2000 2500 3000
Wavelength (nm)
0.0
0.2
0.4
0.6
0.8
1.0
1.2
1.4
1.6
1.8
Sp
ectr
al Irra
dian
ce (W/
m2 /nm )
12 pm; air mass 0.99; 1066 W/m2
9 am; air mass 1.44; 1004 W/m2
8 am; air mass 1.96; 914 W/m2E892 global tilt air mass 1.5 spectrum; 1000 W/m2
7 am; air mass 3.24; 734 W/m2
6 am; airmass 9.34; 324 W/m2
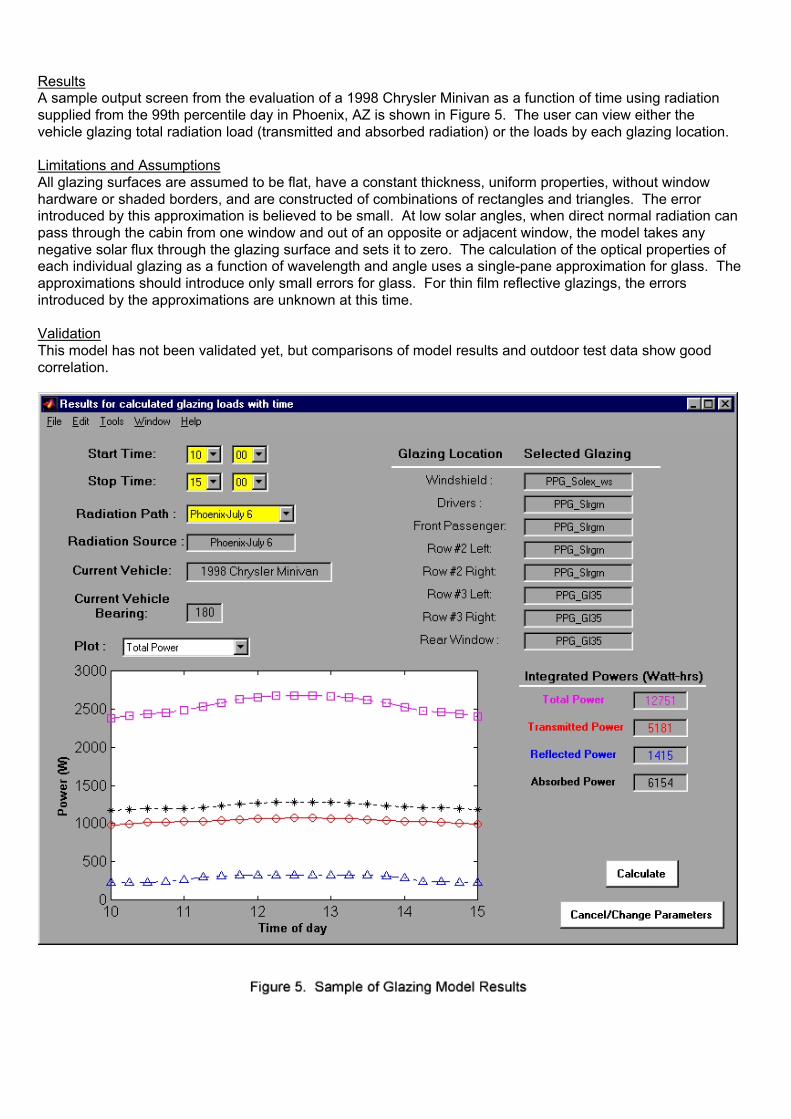
ResultsA sample output screen from the evaluation of a 1998 Chrysler Minivan as a function of time using radiationsupplied from the 99th percentile day in Phoenix, AZ is shown in Figure 5. The user can view either thevehicle glazing total radiation load (transmitted and absorbed radiation) or the loads by each glazing location.
Limitations and AssumptionsAll glazing surfaces are assumed to be flat, have a constant thickness, uniform properties, without windowhardware or shaded borders, and are constructed of combinations of rectangles and triangles. The errorintroduced by this approximation is believed to be small. At low solar angles, when direct normal radiation canpass through the cabin from one window and out of an opposite or adjacent window, the model takes anynegative solar flux through the glazing surface and sets it to zero. The calculation of the optical properties ofeach individual glazing as a function of wavelength and angle uses a single-pane approximation for glass. Theapproximations should introduce only small errors for glass. For thin film reflective glazings, the errorsintroduced by the approximations are unknown at this time.
ValidationThis model has not been validated yet, but comparisons of model results and outdoor test data show goodcorrelation.
4.4 Transient Air-Conditioning ModelDescriptionIn order to understand transient air-conditioning system performance and its impact on vehicle fuelconsumption and emissions, NREL is developing a transient air-conditioning model within the SINDA/FLUINTanalysis software environment and integrating it with the ADVISOR vehicle systems analysis software. Thetransient, one-dimensional, thermal-hydraulic model was developed using a nominal representative air-conditioning system that was identified in discussions with NREL’s automotive industry partners. This modelcaptures all the relevant physics of transient air-conditioning system performance, including two-phase floweffects in the evaporator and condenser, system mass effects, air side heat transfer on thecondenser/evaporator, vehicle speed effects, temperature-dependent properties, and integration with asimplified cabin thermal model. This model can predict typical transient air-conditioning compressor powerrequirements, system pressures and temperatures, system mass flow rates, and two-phase/single-phase flowconditions throughout the air-conditioning system flow circuit.
The simplified cabin thermal model predicts cabin and panel outlet temperatures during transient cool-downperiods and during steady state operational periods. The combined model predicts air-conditioning systemand cabin thermal conditions during various drive cycles so that transient performance and optimization resultscan be tailored to each unique set of driving conditions.
With its current integration to a simplified cabin model and ultimate integration to the cabin thermal/fluid modeldiscussed in Section 4.5, the transient air-conditioning system model thereby provides the system link thatconnects the cabin thermal comfort requirements with vehicle fuel consumption and tailpipe emissions.
InputsModel inputs include compressor performance characteristics; condenser and evaporator tube diameters andlengths, overall dimensions, and air-side design parameters; transport and suction line diameters and lengths;ambient temperature; solar thermal loads; compressor pulley ratio; and orifice tube diameter.
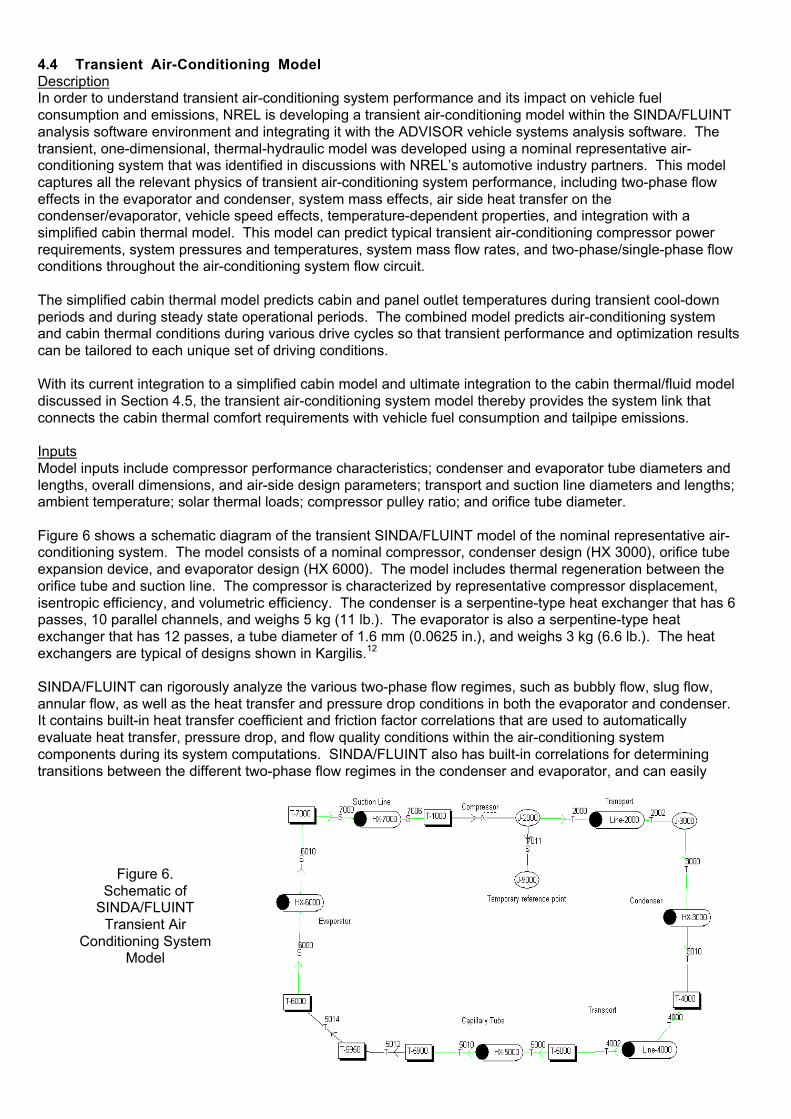
Figure 6 shows a schematic diagram of the transient SINDA/FLUINT model of the nominal representative air-conditioning system. The model consists of a nominal compressor, condenser design (HX 3000), orifice tubeexpansion device, and evaporator design (HX 6000). The model includes thermal regeneration between theorifice tube and suction line. The compressor is characterized by representative compressor displacement,isentropic efficiency, and volumetric efficiency. The condenser is a serpentine-type heat exchanger that has 6passes, 10 parallel channels, and weighs 5 kg (11 lb.). The evaporator is also a serpentine-type heatexchanger that has 12 passes, a tube diameter of 1.6 mm (0.0625 in.), and weighs 3 kg (6.6 lb.). The heatexchangers are typical of designs shown in Kargilis.12
SINDA/FLUINT can rigorously analyze the various two-phase flow regimes, such as bubbly flow, slug flow,annular flow, as well as the heat transfer and pressure drop conditions in both the evaporator and condenser.It contains built-in heat transfer coefficient and friction factor correlations that are used to automaticallyevaluate heat transfer, pressure drop, and flow quality conditions within the air-conditioning systemcomponents during its system computations. SINDA/FLUINT also has built-in correlations for determiningtransitions between the different two-phase flow regimes in the condenser and evaporator, and can easily
Figure 6.Schematic of
SINDA/FLUINTTransient Air
Conditioning SystemModel
analyze slip flow conditions that may occur during two-phase flow in these components. Hendricks13,14
presents flow quality and flow regime results and discusses the influence of system components on flowquality and flow regimes in the condenser and evaporator.
The transport lines between the compressor and condenser and between the condenser and the expansiondevice, shown in Figure 6, are critical components in the air-conditioning system design. Their diameter andlength can impact system performance. Compressor characteristics and orifice diameter are other key systemparameters that impact system performance. Hendricks discusses how these component designs areimportant to optimizing system coefficient-of-performance (COP) and interdependent on other importantsystem components, particularly the condenser.
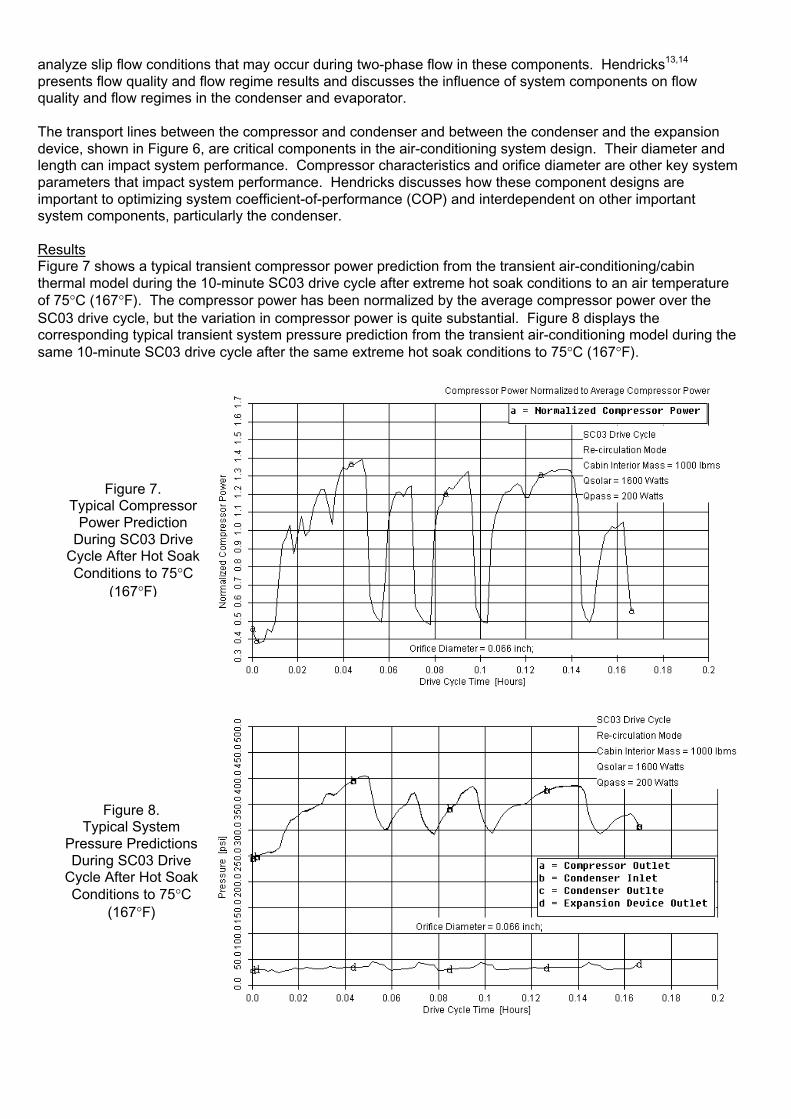
ResultsFigure 7 shows a typical transient compressor power prediction from the transient air-conditioning/cabinthermal model during the 10-minute SC03 drive cycle after extreme hot soak conditions to an air temperatureof 75°C (167°F). The compressor power has been normalized by the average compressor power over theSC03 drive cycle, but the variation in compressor power is quite substantial. Figure 8 displays thecorresponding typical transient system pressure prediction from the transient air-conditioning model during thesame 10-minute SC03 drive cycle after the same extreme hot soak conditions to 75°C (167°F).
Figure 7.Typical Compressor
Power PredictionDuring SC03 Drive
Cycle After Hot SoakConditions to 75°C
(167°F)
Figure 8.Typical System
Pressure PredictionsDuring SC03 Drive
Cycle After Hot SoakConditions to 75°C
(167°F)
a,b,c
Limitations and AssumptionsThe transient air-conditioning model in its current state of development makes several assumptions including:• Internal, one-dimensional flow throughout system components• Low-speed, viscous flow throughout the flow loop• No lubricants included• R-134a fluid properties• Orifice tube system (TXV system versions are planned in the future)• REFPROP Version 6 fluid property data base
ValidationThe model is still being developed and improved. We are working with industry to identify model validationopportunities and system and vehicle level test configurations.
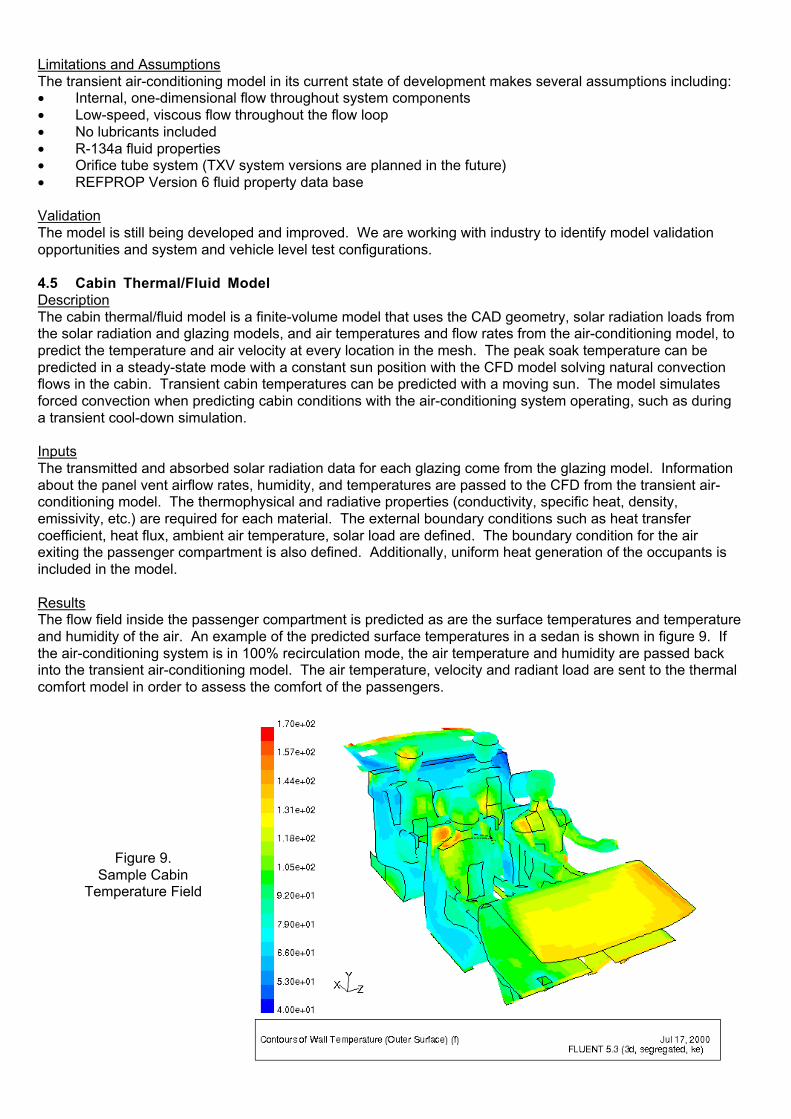
4.5 Cabin Thermal/Fluid ModelDescriptionThe cabin thermal/fluid model is a finite-volume model that uses the CAD geometry, solar radiation loads fromthe solar radiation and glazing models, and air temperatures and flow rates from the air-conditioning model, topredict the temperature and air velocity at every location in the mesh. The peak soak temperature can bepredicted in a steady-state mode with a constant sun position with the CFD model solving natural convectionflows in the cabin. Transient cabin temperatures can be predicted with a moving sun. The model simulatesforced convection when predicting cabin conditions with the air-conditioning system operating, such as duringa transient cool-down simulation.
InputsThe transmitted and absorbed solar radiation data for each glazing come from the glazing model. Informationabout the panel vent airflow rates, humidity, and temperatures are passed to the CFD from the transient air-conditioning model. The thermophysical and radiative properties (conductivity, specific heat, density,emissivity, etc.) are required for each material. The external boundary conditions such as heat transfercoefficient, heat flux, ambient air temperature, solar load are defined. The boundary condition for the airexiting the passenger compartment is also defined. Additionally, uniform heat generation of the occupants isincluded in the model.
ResultsThe flow field inside the passenger compartment is predicted as are the surface temperatures and temperatureand humidity of the air. An example of the predicted surface temperatures in a sedan is shown in figure 9. Ifthe air-conditioning system is in 100% recirculation mode, the air temperature and humidity are passed backinto the transient air-conditioning model. The air temperature, velocity and radiant load are sent to the thermalcomfort model in order to assess the comfort of the passengers.
Figure 9.Sample Cabin
Temperature Field
Limitations and AssumptionsThe human thermal comfort model is used to calculate occupant skin temperatures needed to predict thermalcomfort. The predicted surface temperatures of the occupants from the cabin thermal/fluid model do notinclude actual occupant physiology. The occupants are included in the CFD model only to estimate theirobstruction in the flow field and heat generation into the passenger compartment. Leakage into the passengercompartment is not generally included unless it can be quantified. Decisions about grid resolution, turbulencemodel, time step increment, cabin component thermal properties, time-dependent boundary conditions, andcabin geometry detail will all affect the final result. Likewise, assumptions made in the solar radiation model,the glazing model, and the air-conditioning model will impact the temperature and velocity fields.
ValidationNREL has been involved in numerous vehicle test programs where soak and cool-down data were measured.The model is being validated with the test data.
4.6 Occupant Thermal Comfort ModelTwo models are used to predict occupant thermal comfort. The first model predicts the physiological responseof the occupant to environmental and metabolic conditions. The second model predicts the occupant’sperception of the thermal environment based upon their physiological response to the thermal environment.
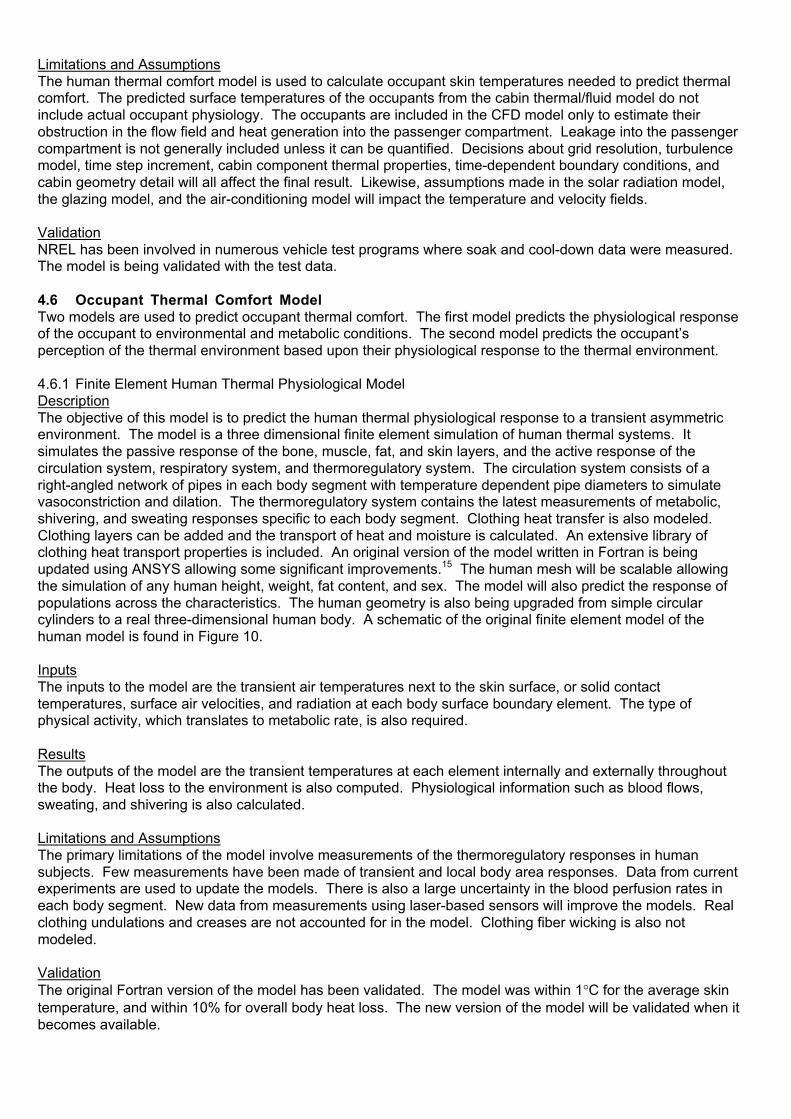
4.6.1 Finite Element Human Thermal Physiological ModelDescriptionThe objective of this model is to predict the human thermal physiological response to a transient asymmetricenvironment. The model is a three dimensional finite element simulation of human thermal systems. Itsimulates the passive response of the bone, muscle, fat, and skin layers, and the active response of thecirculation system, respiratory system, and thermoregulatory system. The circulation system consists of aright-angled network of pipes in each body segment with temperature dependent pipe diameters to simulatevasoconstriction and dilation. The thermoregulatory system contains the latest measurements of metabolic,shivering, and sweating responses specific to each body segment. Clothing heat transfer is also modeled.Clothing layers can be added and the transport of heat and moisture is calculated. An extensive library ofclothing heat transport properties is included. An original version of the model written in Fortran is beingupdated using ANSYS allowing some significant improvements.15 The human mesh will be scalable allowingthe simulation of any human height, weight, fat content, and sex. The model will also predict the response ofpopulations across the characteristics. The human geometry is also being upgraded from simple circularcylinders to a real three-dimensional human body. A schematic of the original finite element model of thehuman model is found in Figure 10.
InputsThe inputs to the model are the transient air temperatures next to the skin surface, or solid contacttemperatures, surface air velocities, and radiation at each body surface boundary element. The type ofphysical activity, which translates to metabolic rate, is also required.
ResultsThe outputs of the model are the transient temperatures at each element internally and externally throughoutthe body. Heat loss to the environment is also computed. Physiological information such as blood flows,sweating, and shivering is also calculated.
Limitations and AssumptionsThe primary limitations of the model involve measurements of the thermoregulatory responses in humansubjects. Few measurements have been made of transient and local body area responses. Data from currentexperiments are used to update the models. There is also a large uncertainty in the blood perfusion rates ineach body segment. New data from measurements using laser-based sensors will improve the models. Realclothing undulations and creases are not accounted for in the model. Clothing fiber wicking is also notmodeled.
ValidationThe original Fortran version of the model has been validated. The model was within 1°C for the average skintemperature, and within 10% for overall body heat loss. The new version of the model will be validated when itbecomes available.
4.6.2 Human Thermal Comfort Psychological ModelDescriptionThe objective of this model is to convert the internal body and skin temperatures predicted by the physiologicalmodel into psychological feelings of thermal comfort. The psychological model will simulate the mentalperceptions of both local and global thermal comfort while subjected to transient and asymmetric thermalfields. Human subject tests are being conducted to determine the thermal comfort sensitivity of each bodysegment. An apparatus has been developed to locally heat/cool each body segment and control the transientoutput. The sensitivities of each body segment will then be combined to predict global comfort. The humansubject tests will guide the development of the combination algorithms. The psychological model will have aphysiological basis using the hot and cold thermal receptors of the human body. The firing rates of thesereceptors as a function of transient temperature have been measured and modeled.16,17,18 Thermal comfortwill then be based on summations of firing rates. Modeling the actual input and nervous systems of the bodywill provide a more accurate prediction of thermal comfort, and allow for improvement of the model in thefuture as new data becomes available.
InputsThe inputs to the model are the transient temperatures internally and on the skin of the body. The specificbody type and physiological characteristics are input into the physiological model.
ResultsThe results of the model are the transient perceptions of local and global thermal comfort.
Limitations and AssumptionsThe model is limited to a spatial resolution of the 16 body segments. The first version of the model will bebased on the responses of only 20 human subjects, due to the large number of tests for each body segment.The measurements of receptor firing rates have currently only been conducted on chimpanzees.18 Only a fewmeasurements of the transient response of receptors have been made, and more data is needed for anaccurate simulation. The first version of model will only acquire the thermal comfort response from skinsurface heating/cooling. Internal conditioning of the body or core temperature control will be performed in thefuture to incorporate that effect.
ValidationA set of human subject tests will also be conducted in a climate-controlled wind tunnel that will allow validationof the model in a realistic automobile environment with transient cabin climate conditions and a variety ofcontrolled external environment conditions.
Figure 10.Human Thermal ModelFinite Element Mesh15
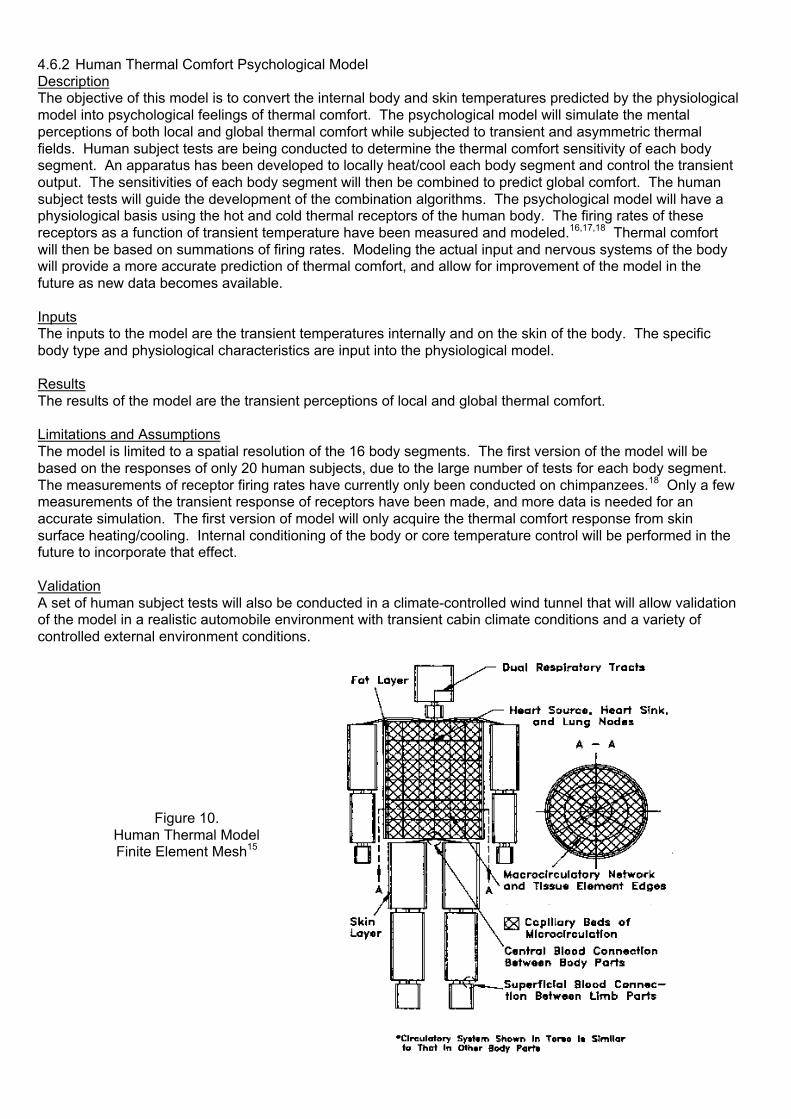
4.7 ADVISOR Vehicle Simulation ModelDescriptionIn order to more completely understand and quantify the interaction between various vehicle systems and theirimpact on vehicle fuel consumption and emissions, NREL has developed a vehicle systems analysis codecalled ADVISOR (ADvanced VehIcle SimulatOR).19,20 This model can simulate a variety of vehicleconfigurations including conventional internal combustion engine powertrains, series and parallel hybridelectric powertrains, electric and fuel cell powertrains. As input to the model, the user can choose from varioustransmissions, engines, energy storage systems, and electrical accessory loads as appropriate to define thevehicle of interest. The tool allows the user to simulate the vehicle under a variety of conditions defined bybasic drive cycles (FTP, Japanese 1015, NEDC, etc.) and test procedures (gradeability, acceleration, etc.).The basic drive cycle defines the desired vehicle speed as a function of time. Based on the vehiclerequirements to satisfy the cycle demands, the model determines the operating point of each componentworking backwards from the roadway to the wheels to the power source. As a result, the calculations aresimple and the simulations take very little CPU time. The tool also provides the ability to perform vehicledesign optimization studies.
InputsIn general, the inputs to the model are component performance maps (e.g. fuel usage as a function of speedand torque out for an engine) and characteristics (mass, torque limits, etc.). Figure 11 shows the vehicle inputscreen from ADVISOR v3.0. The user may build a vehicle from the default vehicle configurations, by selectingthe individual components, and/or overriding specific vehicle or component parameters. The inputs are highlyparameterized providing the user with significant flexibility in design analysis. Other inputs include the drivecycle (vehicle speed as a function of time) or test procedure for which vehicle simulation results are desired.
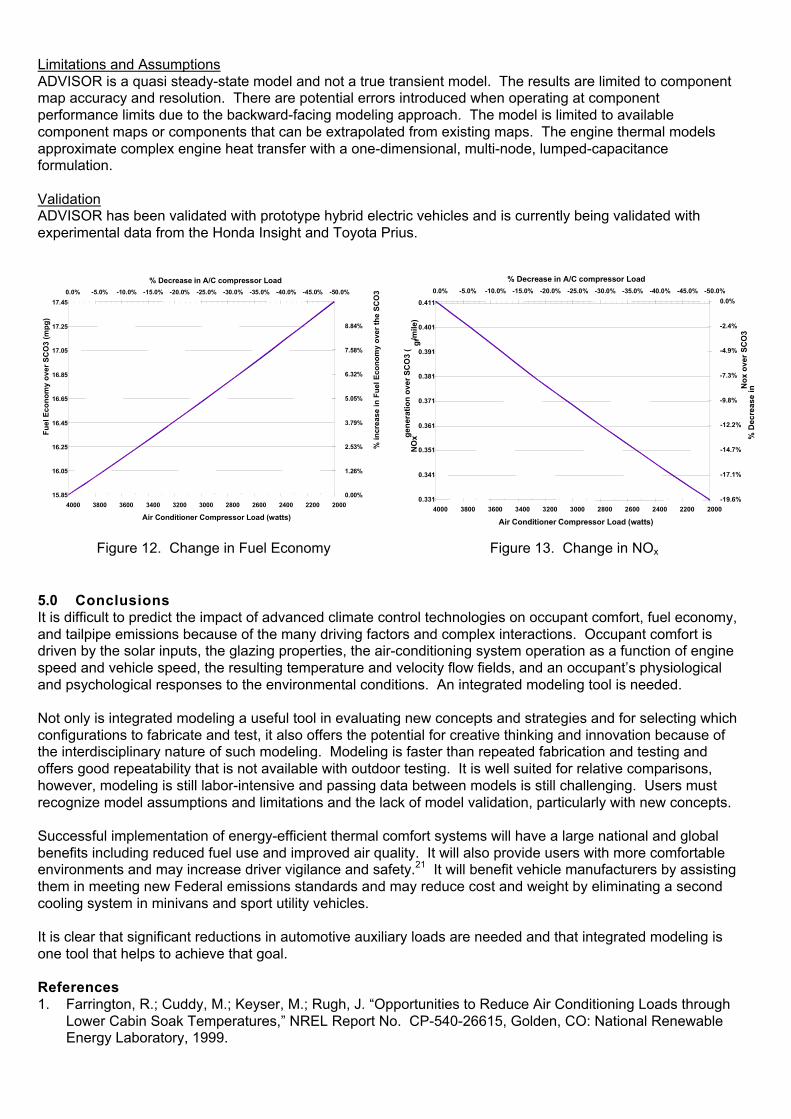
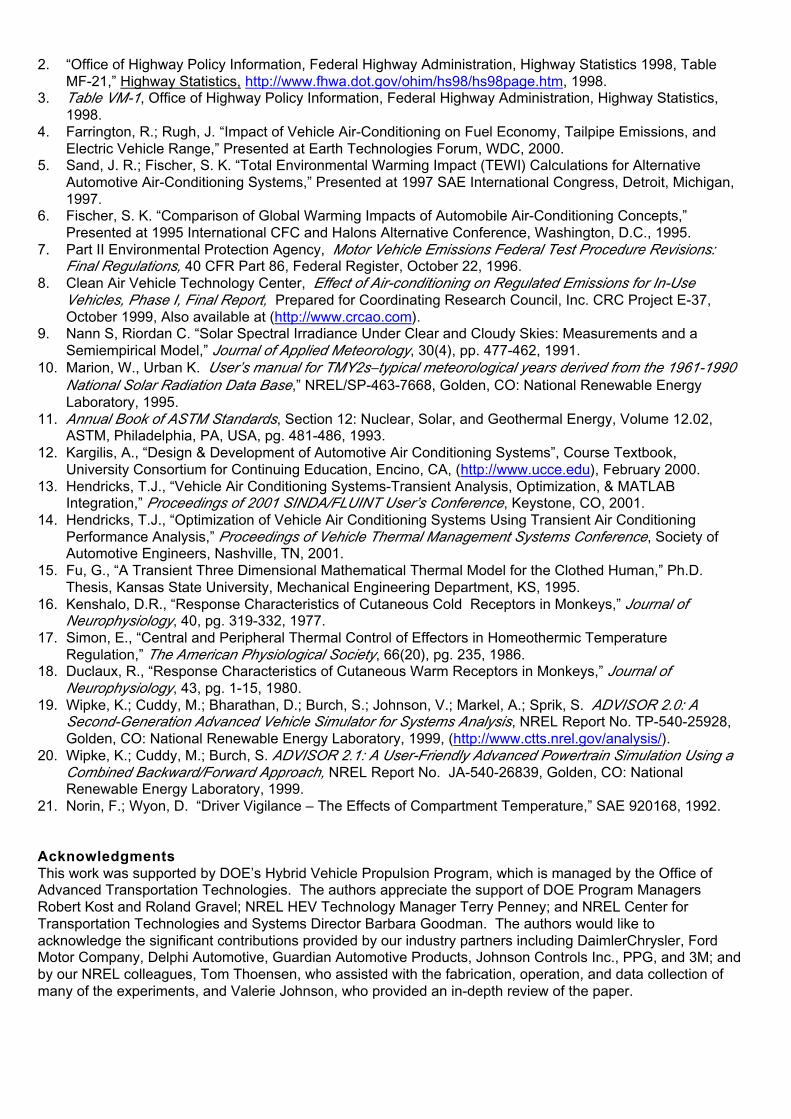
ResultsThe model predicts loads (power and energy) for all modeled vehicle components including vehicle fuel usage(Figure 12), tailpipe emissions (Figure 13), energy usage profiles, and many other vehicle performanceparameters, such as engine thermal energy, braking energy, and exhaust temperatures, as a function of timefor any user-specified driving profile.
Limitations and AssumptionsADVISOR is a quasi steady-state model and not a true transient model. The results are limited to componentmap accuracy and resolution. There are potential errors introduced when operating at componentperformance limits due to the backward-facing modeling approach. The model is limited to availablecomponent maps or components that can be extrapolated from existing maps. The engine thermal modelsapproximate complex engine heat transfer with a one-dimensional, multi-node, lumped-capacitanceformulation.
ValidationADVISOR has been validated with prototype hybrid electric vehicles and is currently being validated withexperimental data from the Honda Insight and Toyota Prius.
5.0 ConclusionsIt is difficult to predict the impact of advanced climate control technologies on occupant comfort, fuel economy,and tailpipe emissions because of the many driving factors and complex interactions. Occupant comfort isdriven by the solar inputs, the glazing properties, the air-conditioning system operation as a function of enginespeed and vehicle speed, the resulting temperature and velocity flow fields, and an occupant’s physiologicaland psychological responses to the environmental conditions. An integrated modeling tool is needed.
Not only is integrated modeling a useful tool in evaluating new concepts and strategies and for selecting whichconfigurations to fabricate and test, it also offers the potential for creative thinking and innovation because ofthe interdisciplinary nature of such modeling. Modeling is faster than repeated fabrication and testing andoffers good repeatability that is not available with outdoor testing. It is well suited for relative comparisons,however, modeling is still labor-intensive and passing data between models is still challenging. Users mustrecognize model assumptions and limitations and the lack of model validation, particularly with new concepts.
Successful implementation of energy-efficient thermal comfort systems will have a large national and globalbenefits including reduced fuel use and improved air quality. It will also provide users with more comfortableenvironments and may increase driver vigilance and safety.21 It will benefit vehicle manufacturers by assistingthem in meeting new Federal emissions standards and may reduce cost and weight by eliminating a secondcooling system in minivans and sport utility vehicles.
It is clear that significant reductions in automotive auxiliary loads are needed and that integrated modeling isone tool that helps to achieve that goal.
References1. Farrington, R.; Cuddy, M.; Keyser, M.; Rugh, J. “Opportunities to Reduce Air Conditioning Loads through
Lower Cabin Soak Temperatures,” NREL Report No. CP-540-26615, Golden, CO: National RenewableEnergy Laboratory, 1999.
Figure 12. Change in Fuel Economy Figure 13. Change in NOx
15.85
16.05
16.25
16.45
16.65
16.85
17.05
17.25
17.45
20002200240026002800300032003400360038004000
Air Conditioner Compressor Load (watts)
Fu
el E
con
om
y o
ver
SC
O3
(mp
g)
0.00%
1.26%
2.53%
3.79%
5.05%
6.32%
7.58%
8.84%
-50.0%-45.0%-40.0%-35.0%-30.0%-25.0%-20.0%-15.0%-10.0%-5.0%0.0%
% Decrease in A/C compressor Load
% in
crea
se in
Fu
el E
con
om
y o
ver
the
SC
O3
0.331
0.341
0.351
0.361
0.371
0.381
0.391
0.401
0.411
20002200240026002800300032003400360038004000
Air Conditioner Compressor Load (watts)
NO
x gen
erat
ion
ove
r S
CO
3 (
gr/m
ile)
-19.6%
-17.1%
-14.7%
-12.2%
-9.8%
-7.3%
-4.9%
-2.4%
0.0%
-50.0%-45.0%-40.0%-35.0%-30.0%-25.0%-20.0%-15.0%-10.0%-5.0%0.0%
% Decrease in A/C compressor Load
% D
ecre
ase
in No
x o
ver
SC
O3
2. “Office of Highway Policy Information, Federal Highway Administration, Highway Statistics 1998, TableMF-21,” Highway Statistics, http://www.fhwa.dot.gov/ohim/hs98/hs98page.htm, 1998.
3. Table VM-1, Office of Highway Policy Information, Federal Highway Administration, Highway Statistics,1998.
4. Farrington, R.; Rugh, J. “Impact of Vehicle Air-Conditioning on Fuel Economy, Tailpipe Emissions, andElectric Vehicle Range,” Presented at Earth Technologies Forum, WDC, 2000.
5. Sand, J. R.; Fischer, S. K. “Total Environmental Warming Impact (TEWI) Calculations for AlternativeAutomotive Air-Conditioning Systems,” Presented at 1997 SAE International Congress, Detroit, Michigan,1997.
6. Fischer, S. K. “Comparison of Global Warming Impacts of Automobile Air-Conditioning Concepts,”Presented at 1995 International CFC and Halons Alternative Conference, Washington, D.C., 1995.
7. Part II Environmental Protection Agency, Motor Vehicle Emissions Federal Test Procedure Revisions:Final Regulations, 40 CFR Part 86, Federal Register, October 22, 1996.
8. Clean Air Vehicle Technology Center, Effect of Air-conditioning on Regulated Emissions for In-UseVehicles, Phase I, Final Report, Prepared for Coordinating Research Council, Inc. CRC Project E-37,October 1999, Also available at (http://www.crcao.com).
9. Nann S, Riordan C. “Solar Spectral Irradiance Under Clear and Cloudy Skies: Measurements and aSemiempirical Model,” Journal of Applied Meteorology, 30(4), pp. 477-462, 1991.
10. Marion, W., Urban K. User’s manual for TMY2s−typical meteorological years derived from the 1961-1990National Solar Radiation Data Base,” NREL/SP-463-7668, Golden, CO: National Renewable EnergyLaboratory, 1995.
11. Annual Book of ASTM Standards, Section 12: Nuclear, Solar, and Geothermal Energy, Volume 12.02,ASTM, Philadelphia, PA, USA, pg. 481-486, 1993.
12. Kargilis, A., “Design & Development of Automotive Air Conditioning Systems”, Course Textbook,University Consortium for Continuing Education, Encino, CA, (http://www.ucce.edu), February 2000.
13. Hendricks, T.J., “Vehicle Air Conditioning Systems-Transient Analysis, Optimization, & MATLABIntegration,” Proceedings of 2001 SINDA/FLUINT User’s Conference, Keystone, CO, 2001.
14. Hendricks, T.J., “Optimization of Vehicle Air Conditioning Systems Using Transient Air ConditioningPerformance Analysis,” Proceedings of Vehicle Thermal Management Systems Conference, Society ofAutomotive Engineers, Nashville, TN, 2001.
15. Fu, G., “A Transient Three Dimensional Mathematical Thermal Model for the Clothed Human,” Ph.D.Thesis, Kansas State University, Mechanical Engineering Department, KS, 1995.
16. Kenshalo, D.R., “Response Characteristics of Cutaneous Cold Receptors in Monkeys,” Journal ofNeurophysiology, 40, pg. 319-332, 1977.
17. Simon, E., “Central and Peripheral Thermal Control of Effectors in Homeothermic TemperatureRegulation,” The American Physiological Society, 66(20), pg. 235, 1986.
18. Duclaux, R., “Response Characteristics of Cutaneous Warm Receptors in Monkeys,” Journal ofNeurophysiology, 43, pg. 1-15, 1980.
19. Wipke, K.; Cuddy, M.; Bharathan, D.; Burch, S.; Johnson, V.; Markel, A.; Sprik, S. ADVISOR 2.0: ASecond-Generation Advanced Vehicle Simulator for Systems Analysis, NREL Report No. TP-540-25928,Golden, CO: National Renewable Energy Laboratory, 1999, (http://www.ctts.nrel.gov/analysis/).
20. Wipke, K.; Cuddy, M.; Burch, S. ADVISOR 2.1: A User-Friendly Advanced Powertrain Simulation Using aCombined Backward/Forward Approach, NREL Report No. JA-540-26839, Golden, CO: NationalRenewable Energy Laboratory, 1999.
21. Norin, F.; Wyon, D. “Driver Vigilance – The Effects of Compartment Temperature,” SAE 920168, 1992.
AcknowledgmentsThis work was supported by DOE’s Hybrid Vehicle Propulsion Program, which is managed by the Office ofAdvanced Transportation Technologies. The authors appreciate the support of DOE Program ManagersRobert Kost and Roland Gravel; NREL HEV Technology Manager Terry Penney; and NREL Center forTransportation Technologies and Systems Director Barbara Goodman. The authors would like toacknowledge the significant contributions provided by our industry partners including DaimlerChrysler, FordMotor Company, Delphi Automotive, Guardian Automotive Products, Johnson Controls Inc., PPG, and 3M; andby our NREL colleagues, Tom Thoensen, who assisted with the fabrication, operation, and data collection ofmany of the experiments, and Valerie Johnson, who provided an in-depth review of the paper.