integrated approach to data center power...
TRANSCRIPT

1
Integrated Approach To Data Center PowerManagement
Lakshmi Ganesh, Hakim Weatherspoon, Tudor Marian, Ken BirmanComputer Science Department, Cornell University
{lakshmi,hweather,tudorm,ken}@cs.cornell.edu
F
Abstract—Energy accounts for a significant fraction of the opera-tional costs of a data center, and data center operators are increas-ingly interested in moving towards low-power designs. Two distinctapproaches have emerged towards achieving this end: the power-proportional approach focuses on reducing disk and server powerconsumption, while the green data center approach focuses on reduc-ing power consumed by support-infrastructure like cooling equipment,power distribution units, and power backup equipment. We propose anintegrated approach, which combines the benefits of both. Our solutionenforces power-proportionality at the granularity of a rack or even anentire containerized data center; thus, we power down not only idle ITequipment, but also their associated support-infrastructure. We showthat it is practical today to design data centers to power down idle racksor containers—and in fact, current online service trends strongly enablethis model. Finally, we show that our approach combines the energysavings of power-proportional and green data center approaches, whileperformance remains unaffected.
Index Terms—Cloud, power management, distributed storage
1 INTRODUCTION
Global-scale online services typically run on hundredsof thousands of servers spread across dozens of datacenters worldwide. Google is estimated to own overa million servers, while Microsoft’s Chicago datacenter alone is estimated to contain over 300,000servers [13]. These scales will only increase significantlyas Infrastructure-, Platform-, and Storage-as-a-Service(IaaS, PaaS, and SaaS) models mature [1], and approachwhat many perceive as a likely vision of the future—ahandful of infrastructure providers hosting the world’sdata and computation. As companies compete to takethe lead in this space, the operational efficiency of theirmassive data centers assumes central importance.
This paper focuses on a key aspect of data center op-erational efficiency—energy management. Energy costscan account for over 35% of the total cost of ownership(TCO) of data centers [5, 6]. As servers grow ever morepowerful, and data center server densities continue toincrease, Wattage per square foot has been growing aswell. This compounds the amount of heat generatedper square foot, in turn requiring the expenditure ofmore energy to remove. Energy costs now rival server
costs [10], yet average data center energy efficiency is amere 50% [5, 6].
Given the economic as well as environmental impactof the global data center energy footprint, it is perhapssurprising that average energy efficiency in this sec-tor is so low. Two challenges impede progress in thisspace: idle resource energy consumption, and support-infrastructure energy consumption. Since data centersare provisioned for peak load, which is significantlyhigher than average load, average data center resourceutilization is very low [8]. This leads to considerableresource idleness on average, and as idle resourcescan consume almost as much energy as active ones,significant amounts of energy can be wasted here [9].The approach typically taken to address this problemis to power down idle resources (disks and servers),to achieve power proportionality. A power proportionalsystem consumes energy proportional to its load. It ishard, however, to achieve power proportionality withoutdegrading performance, as resource idleness is difficultto predict accurately.
The second source of data center energy inefficiency issupport-infrastructure energy consumption. In additionto servers and IT equipment that are doing directlyuseful work, data centers contain power distribution,power backup, networking, and cooling infrastructurethat enable the IT equipment to function correctly, butdo not contribute directly to useful work done. Ideally,total energy consumed by the data center should bea small factor (close to 1) of the energy consumed byIT equipment; this factor is called Power Usage Effec-tiveness (PUE). In reality, however, data center support-infrastructure consumes energy comparable to the ITequipment, leading to industry average PUE of over2 [5, 6]. Several green data center solutions have beendesigned to address this problem: direct current (DC)power distribution is advocated for improving powerdistribution efficiency [4]; battery-backed servers im-prove on the efficiency of a central UPS power backupsolution [2]; free cooling—the practice of using outsideair to cool the facility, thus obviating the need forpower-hungry chillers—significantly improves cooling
2
efficiency [3]. Most existing facilities, however, cannottake advantage of these solutions without significantengineering overhaul.
This paper takes an integrated approach to data centerenergy management to simultaneously address idle re-source energy consumption, and support-infrastructureenergy consumption. We argue for a power manage-ment approach that powers down racks or even entirecontainerized data centers, when idle, thus poweringdown not only servers, but also their associated powerdistribution, backup, networking, and cooling equip-ment. Our evaluation shows that shifting to this modelcombines the energy savings of the power-proportionalas well as the green data center approaches, while notimpacting performance. We also show that this shift ispractical today at very low deployment cost, and thatcurrent data center trends strongly enable it.
The rest of this paper is organized as follows. Sec-tion 2 presents related work, and explains its limitations.Section 3 describes our solution and identifies variousenabling data center practices. We present evaluationresults in section 4, and conclude in section 5.
2 RELATED WORK
We describe the current solution space for data centerenergy management, under the two broad categoriesof power-proportional solutions, and green data centersolutions. The former category of solutions works byidentifying, isolating, and enabling the power-down ofidle IT resources through various mechanisms. The lattercategory of solutions reengineers data centers to improvesupport-infrastructure energy efficiency, and thus datacenter PUE. In the next section we show how to integratethese two approaches.
2.1 Power Proportional Solutions
The principle behind power-proportionality is thatpower should track utilization. More formally, the prop-erty states that executing a given job should consumea constant amount of energy, irrespective of how muchtime it takes. This is possible only if base-line powerconsumption (power consumed when no job is beingexecuted) is zero. In other words, idle resource powerconsumption must be zero. The reality, however, is thatservers consume almost as much energy when idle orlightly loaded, as when heavily loaded [9]. The problemis exacerbated by the fact that most data centers, beingprovisioned for peak rather than average load, are verylightly loaded on average [8].
So why don’t data center operators just turn off idleresources? Many server components also have the abilityto operate in multiple power modes (corresponding tocommensurate levels of performance), so that they canbe manipulated to consume power proportional to theirload, or desired level of performance. However, thereare several challenges to this approach. First, switching
between power modes takes time, and can lead to de-graded performance if load is not accurately predictedand resource power modes matched to it. Most servicescan tolerate very little, if any, performance degradation.Second, server load is hard to predict accurately. Finally,average server idle times are very short, leading to noenergy saving (and perhaps energy wastage) from serverpower down.
Power proportional solutions address these challengesthrough various load concentration techniques. The basicinsight is that if load can be concentrated on a subsetof the data center servers in a predictable manner, thenthe rest can be powered down to save energy withoutimpacting performance. This solution space can be spec-ified using two basic parameters:
1) Load Localization Target: Power-proportionalschemes attempt to localize load to a subset ofthe system so that the rest can be powered down.The load localization target parameter encodesthis concept. For instance, MAID (Massive Arrayof Idle Disks) [28] concentrates popular data ona new set of “cache” disks, while PDC (PopularData Concentration) [29] uses a subset of theoriginal disk set to house the popular data.Power-aware caches [30] attempt to house theworking set of spun-down disks in the cache, toincrease their idle time. Write-offloading [31] is atechnique that can layer on top of each of thesesolutions to temporarily divert write-accesses fromspun-down disks to spun-up ones, and so is ascheme to localize write accesses. SRCMap [32] issimilar to MAID and PDC (and additionally useswrite-offloading), but is a more principled versionof both. KyotoFS [34] is similar to write-offloading,but uses the log-structured file system to achievewrite diversions.
2) Architecture: Power-proportional systems often addlevels to the storage hierarchy in order to cre-ate resource power-down opportunities. The archi-tecture parameter encodes the storage hierarchyof a given solution. For instance, the standardstorage hierarchy puts primary memory (RAM)ahead of spinning disks. Power-proportional stor-age solutions add spun-down disks to the tailof this hierarchy. MAID uses an additional setof disks (cache-disks) between memory and theoriginal disk set. PDC, power-aware caching, SR-CMap, write-offloading, and KyotoFS all use theoriginal disk set, and add no new levels. Hiberna-tor [27] uses multi-speed disks, as does DRPM [35].HP AutoRAID [41] divides the disk-set into asmaller, high-performance, high-storage-overheadRAID 1 level, and a larger, low-performance, low-cost RAID 5 level. PARAID [42] is a power-awarevariant of AutoRAID.
An important shortcoming with all of these solutionsis their neglect of the power overheads of power distri-

3
bution, networking, and cooling. These overheads canaccount for as much as 35% of the power consumed bythe data center [5, 6]. Compare this with disk power,which accounts for less than 27% of facility power [27].Yet most solutions in the power proportional spacefocus on disk or server power down. This narrow focusinherently limits the energy saving potential of thesesolutions.
2.2 Green Data Center Solutions
We describe some engineering solutions designed to re-duce support-infrastructure energy consumption. Thesefall under three broad categories:
1) Power Distribution Efficiency: For every Watt ofenergy used to power servers, up to 0.9 W can belost in power distribution [4]. To a large extent,these losses result from the series of alternatingcurrent (AC) to direct current (DC), and DC to ACconversions that are part of the power distributionprocess. For example, power is typically deliveredto a data center as high voltage AC power; thisis stepped down to lower voltage AC power fordistribution to racks for use by servers and otherIT equipment. Inside this IT equipment, powersupplies typically convert the AC power to the DCpower needed for digital electronics. If the facilityuses a UPS, an additional level of indirection isinjected in routing the power through the UPS -resulting in another set of AC-to-DC, and DC-to-AC conversions. Power is lost at each of theseconversions; further, more power is needed to coolthe conversion equipment [4].It has been shown that power conversion efficiencycan be improved significantly if the data center issupplied with DC power instead of AC power. DCpower delivery systems have been shown to be upto 20% more efficient that AC delivery [4]. Thissolution is orthogonal to ours, and can be used inconjunction with it.
2) Power Backup Efficiency: In order to prevent out-ages, data centers use a backup power supplythat can kick in temporarily if the primary supplyfails. Traditionally, this backup takes the form of acentral UPS; power to the facility flows through theUPS, charging it, and is then routed to the racks.Significant power loss can result from this model,as the average UPS has an efficiency of only about92% [2].A new model has been demonstrated byGoogle [2], where power backup is providedthrough per-server batteries; this distributeddesign has been shown to achieve close to100% efficiency [2]. Again, this solution iscomplementary to ours.
3) Cooling Efficiency: An industry rule-of-thumb sug-gests that for every Watt of energy consumed bya server, about 0.5 W is needed to remove the
resulting heat generated [3]. Data center coolinginfrastructure typically consists of a chiller unit tochill the coolant used (water or air), and fans todirect cool air towards the servers, and hot air awayfrom the servers. These are both thermodynami-cally complex and power-hungry processes.A highly effective way to reduce cooling energyconsumption is through free cooling, a system thatuses ambient air for facility cooling, thus obviatingthe need for power-hungry chillers. It has beenshown that free cooling can help bring data centerPUE down to as low as 1.07 [15]. However, existingdata centers would need a significant engineeringoverhaul to adopt this solution. Further, a limitingfactor for this solution is the requirement thatambient temperatures be suitable for use in facilitycooling.
We now describe a solution with very low deploymentoverhead, that combines the benefits of the power pro-portional and green data center approaches.
3 INTEGRATED APPROACH
As we saw in section 2, current data center en-ergy management solutions are siloed into two sepa-rate approaches: power-down solutions for idle IT re-sources, and engineering solutions for reducing support-infrastructure energy consumption. In this section, weshow how to integrate these two approaches by ex-tending power-down solutions to include support-infrastructure.
3.1 Larger Power Cycle Units
We define the power cycle unit (PCU) as the re-source unit that the power management scheme oper-ates over. This is the unit whose power state is ma-nipulated to track utilization. For example, disk powermanagement schemes manipulate the disk power state(ON/OFF/possibly low-power states corresponding tolower speeds); CPU power management schemes manip-ulate CPU power (typically through frequency tuning).Our contention in this paper is that larger PCU options,which have not been explored thus far, promise signifi-cantly bigger energy savings.
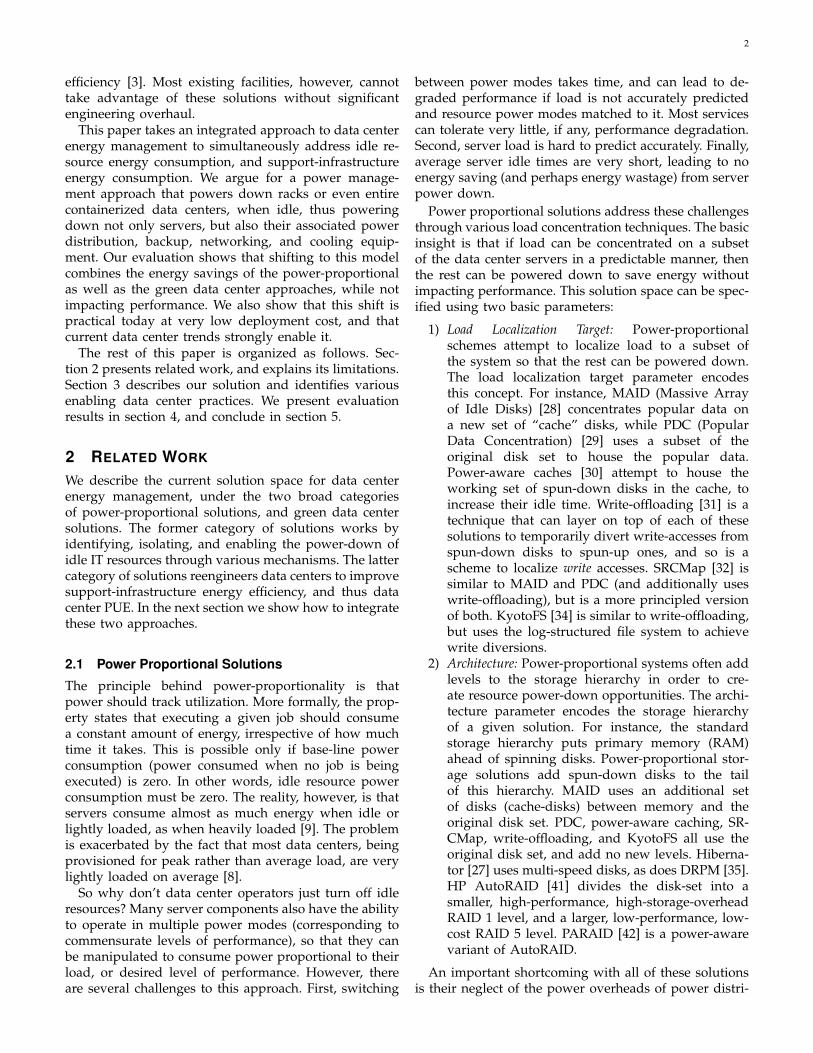
Figure 1 illustrates our rack PCU model. Dependingon the rack and server dimensions, a rack could containanywhere between 10 to 80 servers, or more. In Figure 1,we show a module consisting of two racks, which sharean in-rack cooling system, a rack power distribution unit(PDU), and a top-of-rack switch. The in-rack coolingsystem [40] draws hot air from the servers in the racks,and circulates cool air to maintain the required serveroperating temperature. This cooling system would typ-ically be allied with a central chiller unit, which wouldsupply it with chilled air; if the outside air conditions arefavourable, the chiller can be dispensed with in favorof free cooling. The rack PDU supplies power to the
4
� �
������
��A�BAC����DEF���
��������
��AC��������F��
������
��C��C��
��C��C��
��C��C��
��C��C��
��C��C��
��C��C��
�
���
��
Fig. 1. Rack Power Cycle Unit
rack components; a switched PDU [39] will allow remotecontrol of this power supply, allowing the rack to beturned on or off over the network. Finally, the top-of-rackswitch connects the servers in the rack to the data centernetwork. The switch power is also controlled by the rackPDU. The data center network is typically hierarchical,with rack switches connected using row switches, whichin turn connect to a set of central switches that havea link to the outside. In this model, the rack PCU canbe powered down/up without impacting the rest of thedata center network. The breakdown of power drawwithin the rack PCU depends on a number of factors,such as server power ratings, disk power ratings, num-ber of disks per server, and chilling technique employed(free air cooling/chiller unit). For what the Green Gridcharacterizes as the average data center [49], serversdraw only about 30% of the rack power, while up to45% may go towards cooling, and the remaining poweris spent on the PDU, the switch gear, and power backup.
While racks today are physically self-sufficient, andoffer fault isolation from the rest of the data centernetwork, powering them down can result in data un-availability or service interruption unless mindful loadplacement is practised. In order to create rack power-down opportunities, PCU-aware data organization must beemployed, as follows:
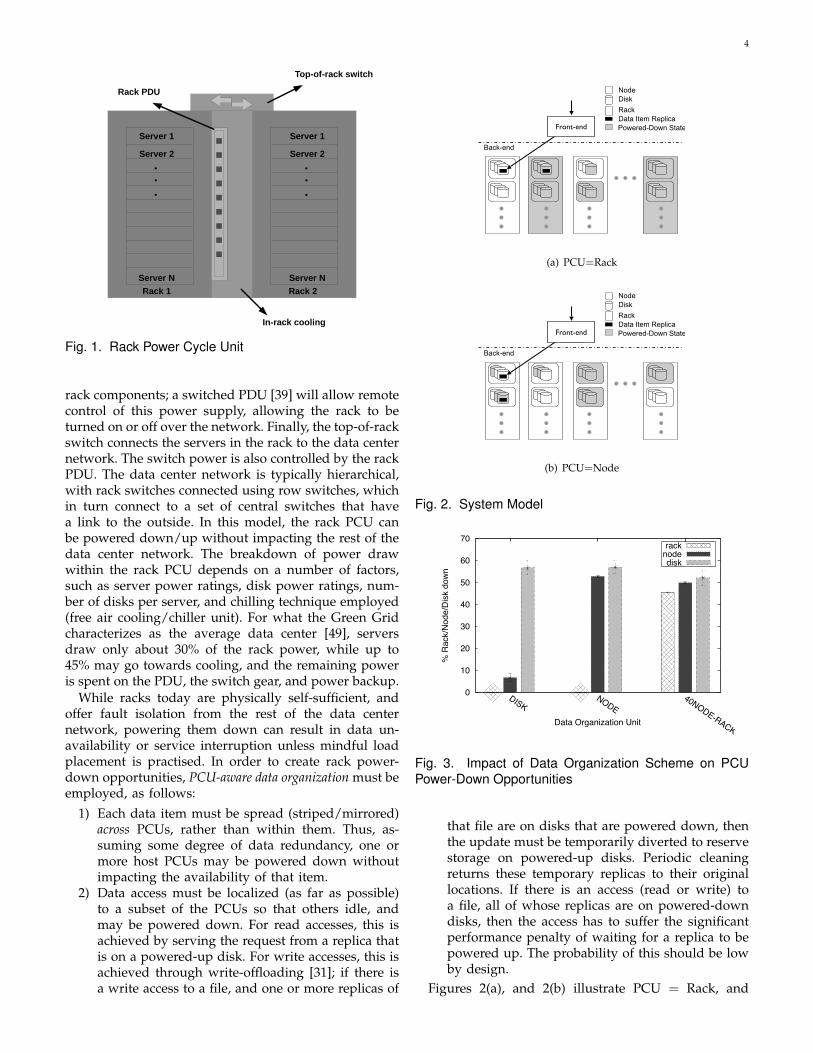
1) Each data item must be spread (striped/mirrored)across PCUs, rather than within them. Thus, as-suming some degree of data redundancy, one ormore host PCUs may be powered down withoutimpacting the availability of that item.
2) Data access must be localized (as far as possible)to a subset of the PCUs so that others idle, andmay be powered down. For read accesses, this isachieved by serving the request from a replica thatis on a powered-up disk. For write accesses, this isachieved through write-offloading [31]; if there isa write access to a file, and one or more replicas of
MAID
Back-end
Node
Disk
Rack
Data Item Replica
Powered-Down StateFront-end
(a) PCU=Rack
MAID
Back-end
Node
Disk
Rack
Data Item Replica
Powered-Down StateFront-end
(b) PCU=Node
Fig. 2. System Model
0
10
20
30
40
50
60
70
DISKNODE
40NODE-RACK
% R
ack/
Nod
e/D
isk
dow
n
Data Organization Unit
racknodedisk
Fig. 3. Impact of Data Organization Scheme on PCUPower-Down Opportunities
that file are on disks that are powered down, thenthe update must be temporarily diverted to reservestorage on powered-up disks. Periodic cleaningreturns these temporary replicas to their originallocations. If there is an access (read or write) toa file, all of whose replicas are on powered-downdisks, then the access has to suffer the significantperformance penalty of waiting for a replica to bepowered up. The probability of this should be lowby design.
Figures 2(a), and 2(b) illustrate PCU = Rack, and

5
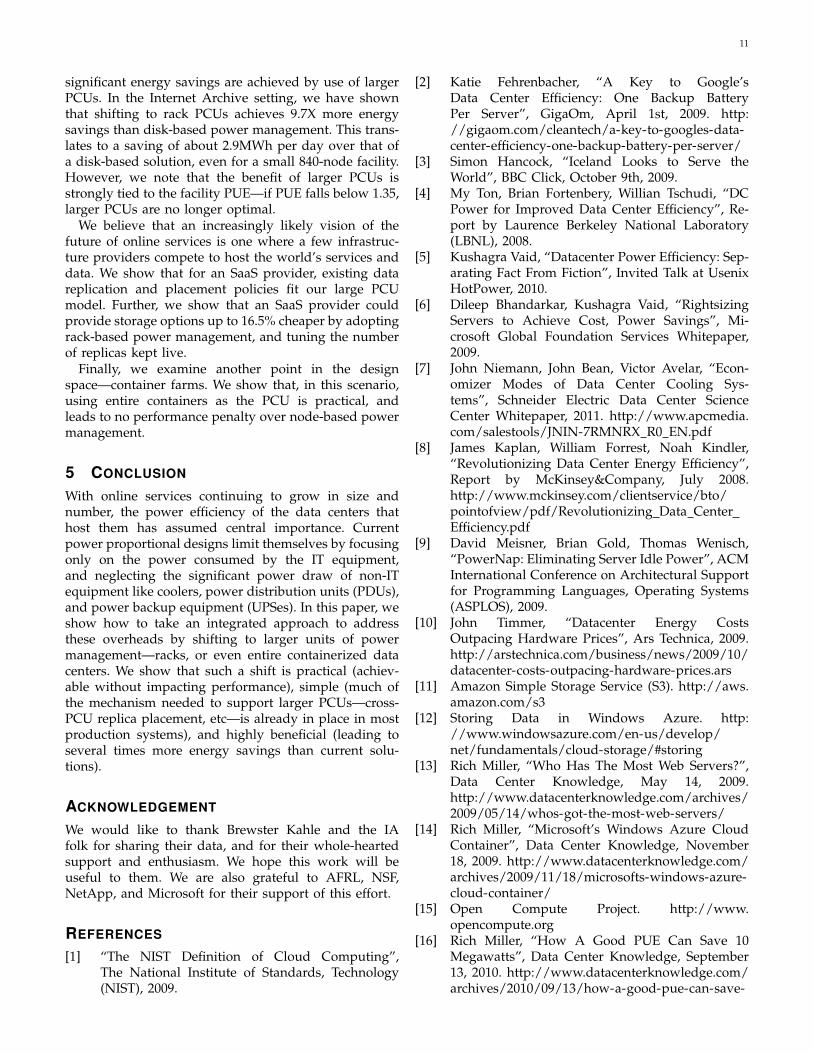
PCU = Node, respectively. Note how replica placementchanges with PCU; also, the creation of idle PCUsthrough selective access of more active replicas. Fig-ure 3 demonstrates the importance of PCU-aware dataorganization. We simulate a production data center, andset the PCU to 40-node racks; we then vary the dataorganization unit (the unit across which replicas aredistributed). Notice that unless replicas are distributedacross the given PCU (40-node racks, in this case), thereis no opportunity for powering them down. Thus, PCU-aware data organization (and retrieval) is key to enablinglarger PCUs.
3.2 Enabling Trends
Before evaluating the benefits of shifting to larger PCUs,we discuss the overhead of deploying such a solutiontoday. One of the strengths of our approach is that itis facilitated by several current trends in large-scaleonline services, thus making the expected deploymentoverhead quite low.
Rack-and-Roll: Rapid scalability is an imperative forhosting successful online services, and this has led to theso-called rack-and-roll data center expansion model [38].Data center operators can rapidly expand their facilitiesby purchasing “commodity racks”, which have servers,top-of-rack switches [37], power distribution units [39],and in-rack cooling equipment [40] pre-installed.Purchasing and commissioning a rack is now a merematter of hours. Thus, our model rack of Figure 1 is awidely prevalent reality today. Further along this path,entire data centers have now been commoditized—thedata center shipping container.
Data Model and Placement: Industry-leading storagedesigns are converging on certain techniques for perfor-mance and reliability that prove strongly enabling forpower management solutions in general, and large PCUsin particular:
• Replication: Most large-scale systems today replicatetheir data for fault-tolerance. A replication factor ofthree is an industry standard [51, 53, 54]. With ap-propriate replica placement, there is opportunity forpowering down one or more replica hosts, withoutimpacting data availability. This provides a tunableparameter—number of live replicas—which can beadjusted based on load, and is a key enabler forstorage power management. When combined withPCU-aware replica placement (see trend below),larger PCUs are facilitated.
• Cross-failure-domain replica placement: Each object isreplicated, not only across disks, but across racks,and also across data centers. This ensures dataavailability in the face of domain-correlated failures,such as a rack or data center outage. This practicehas been adopted in leading systems like AmazonS3 [11], Microsoft Azure [12], and Google GFS [51].
Thus, the mechanism is already in place to supportPCU-aware data placement.
• Append-only model: A data model that is gainingpopularity today due to its performance propertiesis one where data is stored on disk in immutabledata structures. Updates become appends in thismodel, and consolidation happens lazily. This modelcaters especially to workloads that are dominated bynew writes and large sequential reads, with updatesbeing relatively infrequent. GFS [51], Bigtable [52],and Cassandra [54] are industry-leading systemsthat use this model. This model is a good fit forpower management—updates do not require pow-ering up of all replicas; instead, they can be ‘of-floaded’ (appended) to powered-up disks, and lazilyconsolidated when the requisite replica hosts are up.
Data and Compute Locality: A challenge in data-intensive compute systems is to localize data andcomputation. Several techniques have been developedthat facilitate this. For example, Bigtable [52] exposesdata locality control to its clients, so that they can enforcecontiguous placement of related data. Another techniqueis proposed in GreenHDFS [50], which determinesobject placement by its age; their measurement of alarge Hadoop deployment showed that data popularityis strongly correlated with its age in the system, andby placing data of similar age together, they achieveaccess locality. Thus, mechanisms are in place today inmost production systems to ensure data and computelocality. This facilitates power management, because itallows us to power-manage storage without impactingcomputation; further, it allows us to power downnot just disks, but the associated servers as well—inthis model, compute tasks assigned to a server areassociated with the data hosted on that server, and thusit is reasonable to infer an idle CPU associated with idledisks.
Data Deluge: Studies suggest that the digital universe—all the digital data being created by consumers andbusinesses worldwide—is growing at a compoundannual rate of 57% [22]. Just for the year 2010, thisrate of growth translated to an increase in the world’sdigital data by 1.2 million petabytes [17]. This trend issignificantly changing storage needs. Our belief is thatwe have arrived at a point in the data deluge wherethe fraction of data accessed, or even accessible, forany reasonable length of time (a week, say), is a tinyfraction of the total data stored. We come, therefore,to the workload property that the vast majority ofdata is seldom accessed, the data that is accessed isaccessed mostly as reads, and writes that are performedare mostly new writes, instead of updates. Thisproperty is highly conducive to power management—itcreates opportunities for a significant fraction of thestorage system to be powered down without impactingperformance or data availability.

6
TABLE 1Simulator Parameters (applicable unless specified otherwise)
Parameter Description ValueData Layout Redundany scheme employed PCU-aware,
2-way mirroringDisk Power (W) Power consumed by disk when up, down, or transitioning(Up/Down/Tran) between up and down 10/2/10Node Power (W) Power consumed by node (over and above that consumed by its(Up/Down/Tran) disks) when up, down, or transitioning between up and down 200/5/200Rack Power Overhead (%) Power consumed by rack (over and above that consumed by its(Up/Down/Tran) nodes) when up, down, or transitioning between up and down 50/0/50Disk Access Time (ms) Time taken to retrieve 1 byte from disk that is up 8Disk Bandwidth (MBps) Data transfer rate from disk that is up 120Disk Transition Time (s) Time taken by disk to go between up and down states 6Node Transition Time (s) Time taken by node (over and above that taken by its disks)
to go between up and down states 30Rack Transition Time (s) Time taken by rack (over and above that taken by its
component nodes) to go between up and down states 300Power Check Interval (hr) The intervals at which all PCUs are examined
and idle ones powered down 0.5Power Management Start Time (hr) The interval after start of simulation when
power checking begins 0.5Disk Power Down Threshold An exponentially weighted disk access count threshold
below which the disk is considered idle 10Per-Server Cache Size self-explanatory 1 GBNumber Of Nodes Actual number from an IA MC data center 840Number Of Disks/Node Actual number from an IA MC data center 4
One concern with any power-down solution is thepotential impact of power-cycling on component relia-bility, and hence on overall system availability. With ourapproach of using larger PCUs, a natural question to askis whether powering down cooling equipment increasestheir failure rates. Experiential evidence suggests thatit does not [7]: Economizer modes of operation, whichbypass (power down) chiller units when environmentalconditions allow use of ambient air, are already extentin several production facilities, and have not impactedchiller reliability.
In summary, with online service trends leading tohuge amounts of replicated, potentially seldom-accesseddata, there is increasing opportunity for saving energyin data centers by powering down idle/redundant re-sources. Further, current industry practices are makingracks (and more recently, containerized data centers)the unit of choice for resource commissioning as wellas replication, which in turn enables larger PCUs. Thedeployment of a larger PCU solution would thus incurlittle overhead, and have large energy-saving potential.Next, we quantify this energy-saving potential.
4 EVALUATION
The aim of this study is to quantify the potential energysavings from using larger PCUs, for different data centersettings. We address the following questions:
1) How much energy can be saved by shifting tolarger PCUs?
2) How is performance impacted by shifting to largerPCUs?
3) Under what conditions does it make sense to shiftto larger PCUs?
We describe our methodology, and then present ourfindings.
4.1 Methodology
We use simulations to explore a number of different datacenter settings and PCU options. Our results have beenpromising, and we are planning a small-scale implemen-tation study in future work.
4.1.1 SimulatorWe model a large distributed storage system comprisedof a set of servers and their disks, and associatedsupport-infrastructure. The model allows PCU choices ofdisk, node, rack (comprising a specified number of nodesas well as their cooling and power distribution equip-ment), and container (comprising a specified number ofnodes, their cooling and power distribution equipment,as well as a UPS). Parameters that can be varied include:disk/server/rack/container power ratings, number ofdisks per server, number of servers per rack/container,per-server memory capacity, per-disk storage capacity,

7
TABLE 2Trace Characteristics
Attribute Trace 1 Trace 2 Trace 3Duration 6 hrs 6 hrs 6 hrs# accesses 6.5m 7m 6.6mAvg. access size (MB) 1.7 1.3 1.5Max access size (GB) 7.73 20.74 7.73Avg # accesses to a node 7797.77 8338.12 7862.95Max # accesses to a node 110322 184424 120983# Nodes accessed 833 838 835
data organization scheme (PCU-aware or not), data repli-cation scheme (full replication, striping, RAID schemes),power management policy (idleness threshold for pow-ering down resource units, how frequently power man-agement decisions are made), among others. Given thesystem specifications, we simulate the progress of eachfile request through the system, recording latency andpower consumption. Periodically, all the disks in thesystem are checked to see whether their access frequencyis less than a given idleness threshold; if so, they arepowered down. If the system PCU is set to node orbigger, then nodes with all their disks down and with acache access frequency lower than the specified thresh-old, are powered down as well. Finally, for systems withPCU larger than a node, a PCU is powered down if allits nodes are down. An access to a powered-down diskwill trigger the powering up of that disk (including, ifneeded, the powering up of its parent node and PCU).Table 1 presents the standard simulation settings.
4.1.2 DataTo drive our simulations, we use access logs from a pro-duction data center hosting the Internet Archive’s (IA)Media Collection [36] service. This is a web service thatserves text, image, audio, and video files from a large(2 PB) collection. Table 2 gives details of these traces.Unless otherwise specified, each data point presented inthe following section is the averaged result of running 6-hour traces from three different days of the week of April3-9, 2009. (a Monday, Tuesday, and Friday, the same setof hours being picked from each day). The traces areHTTP GET logs, and specify, for each file access, theaccess time, the file name, and file size, as well as thetarget server ID and disk ID. However, we manipulatethis information slightly to conform to different data or-ganization layouts. Given a data organization scheme—PCU-aware, 2-way mirroring, for example—we staticallymap each disk to a “mirror disk” such that the mirrordisk is on a different PCU from the original disk. Anaccess request to any item on either disk is then directedto the more active of the two. Support for dynamic, per-file mapping is planned in future work.
The traces have a read-ratio ( # reads# accesses ) of very close
to 1 (0.9926), and so we did not model writes (weignored writes on the trace). We argue that this lack of
1e-05
0.0001
0.001
0.01
0.1
1
0.1 1 10 100 1000 1e+4 1e+5
Com
plem
enta
ry C
DF
(frac
tion
of a
cces
ses)
Latency (ms)
MeasuredSimulated
Fig. 4. Comparing the Simulator Against Single-ServerRAID-0 Setup
writes does not bias our results unduly: From a powermanagement point of view, write accesses (with write-offloading) are indistinguishable from read accesses thatmiss the cache; ie., their pattern of disk access will besimilar. Our traces, having been captured at the backend,are comprised entirely of cache misses from the fron-tend web server caches, and thus have inherently lowcacheability. This is reflected in our simulations, wherethey show less than 54% combined hit rate at the servercaches. Thus, we expect that the disk access patternswould not change significantly even if up to 40% of ouraccesses were writes (as they would behave similarly tothe 46% cache misses we currently observe). There is oneexception to this rule: some resource power ups may betriggered when reclamation of offloaded writes is done.Since this is an infrequent event, its impact on energyconsumption should not be significant. In future work,however, we plan to add write-offloading support to oursimulator and verify this intuition.
4.1.3 Validation
We used two methods to ensure that our simulator tracksground truth. First, we compared its storage model atthe granularity of a single server against measurementsfrom a real storage node. Second, we used actual mea-surements from production settings to configure thesimulator’s rack-level parameters.
Figure 4 compares measured and simulated accesslatencies from a single server RAID-0 store spread oversix disks. Each data block is striped over the six disks(no redundancy). We combined file access traces fromthree of the most-accessed nodes in the IA data, and re-played them on the RAID-0 system. This combined tracespanned 25 minutes, and comprised 32,749 requests.We also ran this trace on our simulator, configured toresemble the RAID-0 setup. As seen in Figure 4, oursimulator tracks reality well at the server level.
We obtained node and rack power cycling informationfrom actual measurements at the IA. These have in-formed our choice of node and rack transition times, andpower overheads. In future work, we plan to verify our

8
0
200
400
600
800
1000
1200
1400
1600
1800
2000
NONEdiskPCU
nodePCU
rackPCU
Ener
gy (k
Wh)
(a)
10^0
10^1
10^2
10^3
10^4
10^5
10^6
diskPCU
nodePCU
rackPCU
Late
ncy
(ms)
< 100 in 10^5 accesses< 10 in 10^5 accesses
< 1 in 10^5 accesses
(b)
0 20 40 60 80
100
% R
acks
Dow
n
rackPCU nodePCU diskPCU
0 20 40 60 80
100
% N
odes
Dow
n
0 20 40 60 80
100
0 1 2 3 4 5 6
% D
isks
Dow
n
Simulation Time (hr)
(c)
Fig. 5. Optimal PCU Size for the Internet Archive
simulator at rack-level through a small-scale prototypeimplementation.
4.2 ResultsWe now explore the potential as well as the limitationsof power management through larger PCUs. We presentour results in the context of three motivating scenarios:
4.2.1 Motivating Scenario: Online Media ServiceThe Internet Archive’s Media Collection (MC), whichstores and serves over 2 PB of video, audio, imageand text files, is a popular online media service. Ourworkload data derives from one of the MC data centers;we now explore the right choice of PCU for this datacenter.
We simulate an MC data center; Table 1 describes theconfiguration parameters, which are intended to reflectground truth. The IA maintains two copies of each file,on two separate storage servers. The MC data center wesimulate has 840 storage servers—commodity machineswith 4 disks each. We compare PCU choices of disk,node, and rack. We configure rack overhead to be 50%;ie., the support-infrastructure on each rack consumes50% as much power as the servers and disks on the rack.We assume that an additional 10% power goes to thedata center power backup equipment. We show resultsfor a 42-server rack, but we confirmed that very similarresults obtain for a whole range of rack sizes (from 10-server to 200-server), so long as rack power overheadand transition time are constant.
Figure 5(a) shows that rack PCUs lead to 41% energysavings (a 9.7X improvement over disk PCU, and 1.5Ximprovement over node PCUs) in this data center. Fur-ther, we see in Figure 5(b) that the system performanceunder the rack PCU configuration is the same as itsperformance under the node PCU configuration; each setof three bars in this graph shows the highest latency seenin the 99.9-, 99.99-, and 99.999- th percentile of accessesrespectively (left to right). Figure 5(c) explains why therack PCU configurations do not impose any performancepenalty. For each configuration, it tracks the number ofracks, nodes, and disks that are powered down over thelength of the simulation. We see that for the rack PCUconfiguration, the number of racks down stays constantafter the initial power check interval. This means thatno access goes to a powered-down rack, with the resultthat rack power-downs have no additional performancepenalty.
Figure 6 shows the impact of PUE on optimal PCUsize. Rack power overhead reflects data center PUE—inour model, 50% rack power overhead implies a PUE ofat least 1.6 (factoring in the additional 10% overhead forthe UPS). In other words, when PUE is X, for every Wattconsumed by the servers in a rack, 0.1 W goes towardsthe UPS, and (X-1.1) W goes towards the in-rack coolingunit. We see that for values of PUE below 1.35, largerPCUs no longer make sense—it is better to use node-based power management in these settings. This bearsout our intuition—the motivation for shifting to largerPCUs is to reduce some of the non-IT power overheadsof the data center; the smaller these overheads, the lessreason to make this shift. Keep in mind, however, thatthe industry average for data center PUE is 2-2.5.
Figure 7 shows the impact of disk-to-CPU ratio onoptimal PCU size. For a service such as the IA MediaCollection, whose load is entirely I/O-bound, it makessense to use servers with a larger number of disks. Thisis in fact precisely the direction the IA is taking; they arein the process of transitioning to storage nodes with 24 to36 disks each. In this disk-heavy model, we reexamineoptimal PCU choice. Note that, when maintaining thesame data center capacity and increasing the disk-to-node ratio, the number of nodes (and racks) decreases.

9
0
500
1000
1500
2000
2500
3000
NONEdiskPCU
nodePCU
rackPCU
Ener
gy (k
Wh)
(a) PUE=1.15
0
500
1000
1500
2000
2500
3000
NONEdiskPCU
nodePCU
rackPCU
Ener
gy (k
Wh)
(b) PUE=1.35
0
500
1000
1500
2000
2500
3000
NONEdiskPCU
nodePCU
rackPCU
Ener
gy (k
Wh)
(c) PUE=2.1
Fig. 6. Effect of PUE on Optimal PCU Size
0
100
200
300
400
500
600
NONEdiskPCU
nodePCU
rackPCU
Energ
y (
kW
h)
(a)
10^0
10^1
10^2
10^3
10^4
10^5
10^6
diskPCU
nodePCU
rackPCU
Late
ncy (
ms)
< 100 in 10^5 accesses< 10 in 10^5 accesses< 1 in 10^5 accesses
(b)
Fig. 7. Optimal PCU Size When Disk-to-CPU Ratio is 24
Figure 7 shows that a rack is still the optimal PCU choicewhen disk-to-CPU ratio is increased to 24; comparingwith Figure 5 (disk-to-CPU ratio of 4), however, as mightbe expected, we see that the energy savings over disk-based power management has decreased.
4.2.2 Motivating Scenario: Storage as a Service
We now consider another popular online service—Storage as a Service (SaaS). Amazon’s Simple StorageService (S3) [11], for example, provides storage at ap-proximately 10 cents per Gigabit-month. SaaS providerstypically replicate data for reliability - the basic serviceproviding at least 3-way replication, with replicas spreadacross failure domains such as racks and data centers.Clients can alternatively choose a cheaper option—lowerlevel of replication for data requiring less stringent reli-ability guarantees.
Consider a new SaaS feature: tunable number of livereplicas. Clients, when they upload objects, can specifytheir expected popularity, and tune the number of repli-cas that need be kept live; the lower this number, thelower the cost of storing the object. With mechanismsalready extant for spreading replicas across racks (anddata centers), PCU-aware data organization is an easyfit. Figure 8 shows the energy savings from reducingthe number of live copies. The number of live replicasis represented as (r,l) along the x-axis, where r is the
total number of replicas (3, here), and l is the numberof live ones. We show results for two choices of PCU:node, and 40-node rack. We see that keeping only onecopy live in the rack PCU configuration leads to 55%energy savings, while keeping two copies live saves 27%energy. Assuming that energy costs contribute 30% tototal storage cost, these savings could reduce end-userperceived storage prices by a significant 16.5%, or 8%respectively.
4.2.3 Motivating Scenario: Container Farm
Containerized data centers are seeing increasing adop-tion in industry; for example, Microsoft reportedly ownsa facility in Chicago comprising 112 containers—a con-tainer farm [14]. Containers have the advantages ofmodularity, ease of deployment, ease of management,and improved space and power efficiency, and mightreasonably be expected to be a popular data centercommissioning unit of the future. With this in mind, weconsider the right PCU choice for a data center consistingof a network of containers.
In this model, we have a new PCU choice—an entirecontainer. The advantage of powering down a containeris that we power down its associated power distributionand backup infrastructure. Assuming that these over-heads add up to 10% of the power draw, Figure 9shows the energy savings from container-based power

10
0
500
1000
1500
2000
(3,3)No Pwr Mgmt
(3,1) (3,2) (3,3)
Ene
rgy
(kW
h)
PCU=None PCU=Node PCU=Rack
(a)
10^0
10^1
10^2
10^3
10^4
10^5
10^6
Node(3,1)
Rack Node(3,2)
Rack Node(3,3)
Rack
Late
ncy
(ms)
< 100 in 10^5 accesses< 10 in 10^5 accesses
< 1 in 10^5 accesses
(b)
Fig. 8. Energy Savings From Tuning Number of Live Replicas
0
200
400
600
800
1000
1200
1400
1600
1800
2000
NONEdiskPCU
nodePCUrackPCU
containerPCU
Ener
gy (k
Wh)
(a)
10^0
10^1
10^2
10^3
10^4
10^5
10^6
diskPCUnodePCU
rackPCUcontainerPCU
Late
ncy
(ms)
< 100 in 10^5 accesses< 10 in 10^5 accesses
< 1 in 10^5 accesses
(b)
Fig. 9. Optimal PCU Choice for a Container Farm
0
200
400
600
800
1000
1200
1400
1600
1800
powerdown
threshold
powercheck
interval
accessfreqmult
factor
accesscount
interval
evictionbuffersize
Ene
rgy
(kW
h)
1 10 100
5min
1hr
2hr
0.1
0.3
0.5
0.8
1min
5min
15m
in
5% 10%
20%
node rack
Fig. 10. Result Sensitivity to Simulator Settings
management. Here, our data center consists of two 420-node containers, container power-up takes 10 minutes(as opposed to 5 minutes for rack power-up), and con-tainer power overhead is 60% (as opposed to 50% rackpower overhead). We see that the container PCU andrack PCU offer similar energy savings (Figure 9(a)), and
similar performance (Figure 9(b)).
4.3 Sensitivity AnalysisFinally, we verify that our results are not artifacts of thesimulator settings. Figure 10 shows that our findings arerobust to simulator fine-tuning. Disk power down thresholdis the access frequency threshold below which a diskis considered idle (and hence can be powered down).Periodically (with period length = disk power check in-terval), all disks (as well as higher-level components)are checked for power-down opportunities. Disk accessfrequency is computed as an exponentially weightedmoving average, with a multiplicative factor determiningthe weight given to the mean frequency computed overthe most recent interval; access count interval is the lengthof this interval. Finally, cache eviction buffer allows mul-tiple evicted cache entries to be aggregated before beingevicted together; its size is measured as a percentage ofcache size. As Figure 10 shows, none of these simulator-specific parameters plays any role in determining thesimulation results.
4.4 SummaryTo summarize, we have examined a number of differentonline service models and shown that in each case
11
significant energy savings are achieved by use of largerPCUs. In the Internet Archive setting, we have shownthat shifting to rack PCUs achieves 9.7X more energysavings than disk-based power management. This trans-lates to a saving of about 2.9MWh per day over that ofa disk-based solution, even for a small 840-node facility.However, we note that the benefit of larger PCUs isstrongly tied to the facility PUE—if PUE falls below 1.35,larger PCUs are no longer optimal.
We believe that an increasingly likely vision of thefuture of online services is one where a few infrastruc-ture providers compete to host the world’s services anddata. We show that for an SaaS provider, existing datareplication and placement policies fit our large PCUmodel. Further, we show that an SaaS provider couldprovide storage options up to 16.5% cheaper by adoptingrack-based power management, and tuning the numberof replicas kept live.
Finally, we examine another point in the designspace—container farms. We show that, in this scenario,using entire containers as the PCU is practical, andleads to no performance penalty over node-based powermanagement.
5 CONCLUSION
With online services continuing to grow in size andnumber, the power efficiency of the data centers thathost them has assumed central importance. Currentpower proportional designs limit themselves by focusingonly on the power consumed by the IT equipment,and neglecting the significant power draw of non-ITequipment like coolers, power distribution units (PDUs),and power backup equipment (UPSes). In this paper, weshow how to take an integrated approach to addressthese overheads by shifting to larger units of powermanagement—racks, or even entire containerized datacenters. We show that such a shift is practical (achiev-able without impacting performance), simple (much ofthe mechanism needed to support larger PCUs—cross-PCU replica placement, etc—is already in place in mostproduction systems), and highly beneficial (leading toseveral times more energy savings than current solu-tions).
ACKNOWLEDGEMENT
We would like to thank Brewster Kahle and the IAfolk for sharing their data, and for their whole-heartedsupport and enthusiasm. We hope this work will beuseful to them. We are also grateful to AFRL, NSF,NetApp, and Microsoft for their support of this effort.
REFERENCES
[1] “The NIST Definition of Cloud Computing”,The National Institute of Standards, Technology(NIST), 2009.
[2] Katie Fehrenbacher, “A Key to Google’sData Center Efficiency: One Backup BatteryPer Server”, GigaOm, April 1st, 2009. http://gigaom.com/cleantech/a-key-to-googles-data-center-efficiency-one-backup-battery-per-server/
[3] Simon Hancock, “Iceland Looks to Serve theWorld”, BBC Click, October 9th, 2009.
[4] My Ton, Brian Fortenbery, Willian Tschudi, “DCPower for Improved Data Center Efficiency”, Re-port by Laurence Berkeley National Laboratory(LBNL), 2008.
[5] Kushagra Vaid, “Datacenter Power Efficiency: Sep-arating Fact From Fiction”, Invited Talk at UsenixHotPower, 2010.
[6] Dileep Bhandarkar, Kushagra Vaid, “RightsizingServers to Achieve Cost, Power Savings”, Mi-crosoft Global Foundation Services Whitepaper,2009.
[7] John Niemann, John Bean, Victor Avelar, “Econ-omizer Modes of Data Center Cooling Sys-tems”, Schneider Electric Data Center ScienceCenter Whitepaper, 2011. http://www.apcmedia.com/salestools/JNIN-7RMNRX R0 EN.pdf
[8] James Kaplan, William Forrest, Noah Kindler,“Revolutionizing Data Center Energy Efficiency”,Report by McKinsey&Company, July 2008.http://www.mckinsey.com/clientservice/bto/pointofview/pdf/Revolutionizing Data CenterEfficiency.pdf
[9] David Meisner, Brian Gold, Thomas Wenisch,“PowerNap: Eliminating Server Idle Power”, ACMInternational Conference on Architectural Supportfor Programming Languages, Operating Systems(ASPLOS), 2009.
[10] John Timmer, “Datacenter Energy CostsOutpacing Hardware Prices”, Ars Technica, 2009.http://arstechnica.com/business/news/2009/10/datacenter-costs-outpacing-hardware-prices.ars
[11] Amazon Simple Storage Service (S3). http://aws.amazon.com/s3
[12] Storing Data in Windows Azure. http://www.windowsazure.com/en-us/develop/net/fundamentals/cloud-storage/#storing
[13] Rich Miller, “Who Has The Most Web Servers?”,Data Center Knowledge, May 14, 2009.http://www.datacenterknowledge.com/archives/2009/05/14/whos-got-the-most-web-servers/
[14] Rich Miller, “Microsoft’s Windows Azure CloudContainer”, Data Center Knowledge, November18, 2009. http://www.datacenterknowledge.com/archives/2009/11/18/microsofts-windows-azure-cloud-container/
[15] Open Compute Project. http://www.opencompute.org
[16] Rich Miller, “How A Good PUE Can Save 10Megawatts”, Data Center Knowledge, September13, 2010. http://www.datacenterknowledge.com/archives/2010/09/13/how-a-good-pue-can-save-
12
10-megawatts/[17] Bernard Golden, “Cloud Computing: How
Big is Big Data? IDC’s Answer”, CIO, May7, 2010. http://www.cio.com/article/593039/Cloud Computing How Big is Big Data IDCs Answer
[18] Radhika Kaushik, “Spreading the digital word”,ExtremeTech, April 29, 2003. http://www.extremetech.com/article2/0,3973,1047454,00.asp
[19] Emma Woollacott, “Digital content doublesevery 18 months”, TG Daily, May 19, 2009.http://www.tgdaily.com/hardware-features/42499-digital-content-doubles-every-18-months
[20] Electric Power Monthly, U.S. Energy InformationAdministration, January 14, 2011. http://www.eia.doe.gov/electricity/epm/tables5 6 a.html
[21] “Data, data everywhere”, The Economist SpecialReport, February 25, 2010.
[22] Peter Lyman, Hal Varian, Peter Charles, NathanGood, Laheem Jordan, Joyojeet Pal, “How MuchInformation? Executive Summary”, School of In-formation Management Systems, UC-Berkeley,2003.
[23] Albert G. Greenberg, James R. Hamilton, DavidA. Maltz, Parveen Patel, “The Cost of a Cloud:Research Problems in Data Center Networks”,Computer Communication Review, 2009.
[24] Hrishikesh Amur, James Cipar, Varun Gupta, Gre-gory Ganger, Michael Kozuch, Karsten Schwan,“Robust, Flexible Power-proportional Storage”,Symposium on Cloud Computing (SOCC), 2010.
[25] David Andersen, Jason Franklin, Michael Kamin-sky, Amar Phanishayee, Lawrence Tan, VijayVasudevan, “FAWN: A Fast Array of WimpyNodes”, Symposium on Operating Systems Prin-ciples (SOSP), 2009.
[26] Adrian Caulfield, Laura Grupp, Steven Swanson,“Gordon: Using Flash Memory to Build Fast,Power-efficient Clusters for Data-intensive Appli-cations”, Architectural Support for ProgrammingLanguages, Operating Systems (ASPLOS), 2009.
[27] Qingbo Zhu, Zhifeng Chen, Lin Tan, YuanyuanZhou, “Hibernator: Helping Disk Arrays SleepThrough The Winter” ,Symposium on OperatingSystems Principles (SOSP), 2005.
[28] Dennis Colarelli, Dirk Grunwald, MichaelNeufeld, “The Case for Massive Arrays of IdleDisks (MAID)”, File and Storage Technologies(FAST), 2002.
[29] Eduardo Pinheiro, Ricardo Bianchini, “EnergyConservation Techniques for Disk Array-BasedServers”, International Conference on Supercom-puting (ICS), 2004.
[30] Qingbo Zhu Francis, Francis M. David, Christo F.Devaraj, Zhenmin Li, Yuanyuan Zhou, Pei Cao,“Reducing Energy Consumption of Disk StorageUsing Power-Aware Cache Management”, Sympo-sium on High-Performance Computer Architecture
(HPCA), Febuary 2004.[31] Dushyanth Narayanan, Austin Donnelly, “Write
Off-Loading: Practical Power Management forEnterprise Storage”, File, Storage Technologies(FAST), 2008.
[32] Akshat Verma, Ricardo Koller, Luis Useche, RajuRangaswami, “Energy Proportional Storage UsingDynamic Consolidation”, File, Storage Technolo-gies (FAST), 2010.
[33] Lakshmi Ganesh, Hakim Weatherspoon, Ken Bir-man, “Beyond Power Proportionality: DesigningPower-Lean Cloud Storage”, IEEE Network Com-puting, Applications (NCA), 2011.
[34] Lakshmi Ganesh, Hakim Weatherspoon, MaheshBalakrishnan, Ken Birman, “Optimizing PowerConsumption in Large Scale Storage Systems”,HotOS, 2007.
[35] Sudhanva Gurumurthi, Anand Sivasubramaniam,Mahmut Kandemir, Hubertus Franke, “DRPM:Dynamic Speed Control for Power Managementin Server Class Disks”, International Symposiumon Computing Architecture (ISCA), 2003.
[36] The Internet Archive. http://www.archive.org[37] Data Center Top-of-Rack Architecture Design,
Cisco, 2009. http://www.cisco.com/en/US/prod/collateral/switches/ps9441/ps9670/whitepaper c11-522337.html
[38] Cisco Data Center Infrastructure 2.5 Design Guide,Cisco, 2007. http://www.cisco.com/en/US/docs/solutions/Enterprise/Data Center/DC Infra2 5/DCI SRND 2 5 book.html
[39] Switched Rack PDU, APC. http://www.apc.com/products/family/index.cfm?id=70
[40] “High Density In-Rack Cooling Solutions forServer Racks, Computer Rooms, Server Rooms& Data Centers”, 42U. http://www.42u.com/cooling/in-rack-cooling/in-rack-cooling.htm
[41] John Wilkes, Richard Golding, Carl Staelin, TimSullivan, “The HP AutoRAID Heirarchical StorageSystem”, ACM Transactions on Computer Systems(TOCS), 1996.
[42] Charles Weddle, Mathew Oldham, Jin Qian, An-I Andy Wang, Peter Reiher, Geoff Kuenning,“PARAID: A Gear-Shifting Power-Aware RAID”,File and Storage Technologies (FAST), 2007.
[43] Elliot Jaffe, Scott Kirkpatrick, “Architecture of theInternet Archive”, Israeli Experimental SystemsConference (SYSTOR), 2009.
[44] Bruce Baumgart, Matt Laue, “Petabyte Box forInternet Archive”, November 2003.
[45] Cade Metz, “Sun packs 150 billion web pagesinto meat locker”, The Register, March 2009.http://www.theregister.co.uk/2009/03/25/newinternet archive data center/
[46] Brewster Kahle, “Project Greenbox”, January2008. http://backyardfamilyfarm.wikispaces.com/Project+Greenbox
[47] In Personal Communication with Brewster Kahle
13
and the Internet Archive Staff, January 14, 2010.[48] The Green Grid. http://www.thegreengrid.org[49] “Seven Strategies To Improve Data Center Cooling
Efficiency”, The Green Grid, 2008. http://www.thegreengrid.org/en/Global/Content/white-papers/Seven-Strategies-to-Cooling
[50] Rini Kaushik, Milind Bhandarkar, Klara Nahrst-edt, “Evaluation, Analysis of GreenHDFS: ASelf-Adaptive, Energy-Conserving Variant of theHadoop Distributed File System”, Cloud Comput-ing Technology, Science (CloudCom), 2010.
[51] Sanjay Ghemawat, Howard Gobioff, Shun-Tak Le-ung, “The Google File System”, Symposium onOperating Systems Principles (SOSP), 2003.
[52] Fay Chang, Jeffrey Dean, Sanjay Ghemawat, Wil-son Hsieh, Deborah Wallach, Mike Burrows,Tushar Chandra, Andrew Fikes, Robert Gruber,“Bigtable: A Distributed Storage System for Struc-tured Data”, Operating Systems Design, Imple-mentation (OSDI), 2006.
[53] Giuseppe DeCandia, Deniz Hastorun, Madan Jam-pani, Gunavardhan Kakulapati, Avinash Laksh-man, Alex Pilchin, Swaminathan Sivasubrama-nian, Peter Vosshall, Werner Vogels, “Dynamo:Amazon’s Highly Available Key-Value Store”,Symposium on Operating Systems Principles(SOSP), 2007.
[54] Avinash Lakshman, Prashant Malik, “Cassan-dra - A Decentralized Structured Storage Sys-tem”, Large Scale Distributed Systems, Middle-ware (LADIS), 2009.
AUTHOR BIOGRAPHIES
Lakshmi Ganesh: Lakshmi received her Ph.D.from Cornell University in January 2012. Her thesiswork, under the joint advisorship of Dr. HakimWeatherspoon and Dr. Ken Birman, was on data centerpower management. She was the recipient of an MSRGraduate Research Fellowship award in 2009, and aComputing Innovation Fellowship in 2011. She is nowworking as a postdoctoral fellow with Dr. Mike Dahlinand Dr. Lorenzo Alvisi at the Laboratory for AdvancedSystems Research at the University of Texas at Austin.
Hakim Weatherspoon: Hakim Weatherspoon is anassistant professor in the Department of ComputerScience at Cornell University. His research interestscover various aspects of fault-tolerance, reliability,security, and performance of large Internet-scalesystems such as cloud computing and distributedsystems. Professor Weatherspoon received his Ph.D.from University of California at Berkeley and B.S.from University of Washington. He is an Alfred P.Sloan Fellow and recipient of an NSF CAREER award,DARPA Computer Science Study Panel (CSSP), IBMFaculty Award, the NetApp Faculty Fellowship, and theFuture Internet Architecture award from the National
Science Foundation (NSF).
Tudor Marian: Tudor Marian received his Ph.D. fromCornell University in August 2011. His thesis work,under Prof. Hakim Weatherspoon, was on operatingsystems abstractions for high-speed software packetprocessing in datacenter networked environments. Aftercompleting his postdoctoral work at Cornell University,he joined Google, where he works with the Storage andInfrastructure group.
Ken Birman: Ken Birman is the N. Rama Rao Professorof Computer Science at Cornell University, wherehe has headed a research effort in the area of highassurance distributed computing for thirty years. Kenis best known for inventing the virtual synchronycomputing model and building the Isis Toolkit, whichwas ultimately used to build the system that operatedthe New York Stock Exchange for more than a decade,and the systems that continue to operate the French AirTraffic Control system and the US Navy AEGIS today.He also pioneered in the use of gossip protocols forsystem monitoring, management and control; severalof his solutions are used today in the platforms thatoperate today’s largest cloud computing infrastructures,notably at Amazon, IBM and Microsoft. A Fellow of theACM since 1999, Ken won the 2009 IEEE Kanai Awardfor his research in distributed systems.