insurance technology | market update q1 2020
TRANSCRIPT

INSURANCE TECHNOLOGY
While the impact of COVID-19 is proving negative in the short term, some areas will likely prove resilient (or even benefit), and there is plenty of liquidity.While insurtech ended 2019 on an optimistic note, with several large financings and M&A deals announced and an environment that indicated that other deals were sure to follow, this momentum has paused with the COVID-19 pandemic. Some have predicted that, because insurtechs were overvalued and have never weathered an economic downturn, a market correction is sure to hit the category hard. Recent harbingers of doom include the following:
States including New Jersey and Ohio have introduced legislation that would effectively require commercial insurers to pay claims to businesses affected by COVID-19, even if there is policy language specifically excluding viruses/pandemics.
Given the current shelter-in-place status for most of the world, demand is expected to decrease for coverages related to the contingent workforce (e.g., Uber/Lyft drivers, 1099 contractors, etc.).
Healthcare insurance claims related to COVID-19 are expected to skyrocket.
The thought is that insurtechs selling into markets like these will suffer along with incumbents. On the other hand, even in a recession people need basic insurance coverage—think auto, homeowners/renters, life, and health—and, indeed, demand may surge in some categories. Additionally, large carriers, reinsurers, and brokers enter this crisis in a much stronger position than they did in 2008 and may be willing to invest in or acquire insurtechs, especially as valuations compress. Further, private equity funds retain massive amounts of dry powder and, if not overwhelmed by concerns related to COVID-19 with their existing portfolio companies, may seek to capitalize on current opportunities. Even if capital raising and M&A effectively shuts down in the short term, there’s still plenty of liquidity likely to lead to consolidation once the market recovers.
As with past economic downturns, winners and losers among insurtechs will emerge.Although incumbents have different exposures, COVID-19 is anticipated to speed up digitization and data usage initiatives. In the short term, B2C models are probably more vulnerable, while B2B and B2B2C models should be more resilient. In particular, deals relating to consumer engagement and marketplaces, software, and data and analytics should be less negatively affected by COVID-19. Both strategics and sponsors will continue to favor platforms that either reduce cost and operating friction and/or have highly recurring revenues, strong operating leverage, and robust cash flow generation.
Private-market valuations will take a hit overall, but it probably won’t be as bad as you think.The “growth at all cost” mindset took a hit in 2019, as investor sentiment began souring about firms using cheap VC capital to drive customer growth at the expense of profitability. Current market uncertainty may accelerate this trend, causing a sharp reversal in investor sentiment and reducing, if not eliminating, the number of outsized rounds being done at stratospheric valuations. We believe the “bump up” in insurtech valuations between rounds will also flatten out or contract significantly in cases of down rounds.
That said, high-performing insurtechs should continue to demand a market premium, especially as they become more scarce in our new reality. Historically, private-market valuations have been impacted when public markets have remained dislocated for at least two quarters. So unless the current slowdown lasts through the November election, private-market holdings should not see meaningful write-downs, at least for healthy insurtechs that don’t need immediate funding.
The outbreak of COVID-19 has resulted in a global health emergency and sent financial markets into a frenzy. Below is Houlihan Lokey’s assessment of the impact of the virus on the insurtech industry.
Key Insurtech Themes Related to COVID-19
1
Kegan GreeneDirector, Financial [email protected]
Mark [email protected]
+44 (0) 20 7907 4203
Tim [email protected]+44 (0) 20 7907 4213
Craig [email protected]
212.497.7859
Chris [email protected]
212.830.6166
Additional Team Contacts
2
3
Insurance Technology (Insurtech) Market Update: COVID-19
1
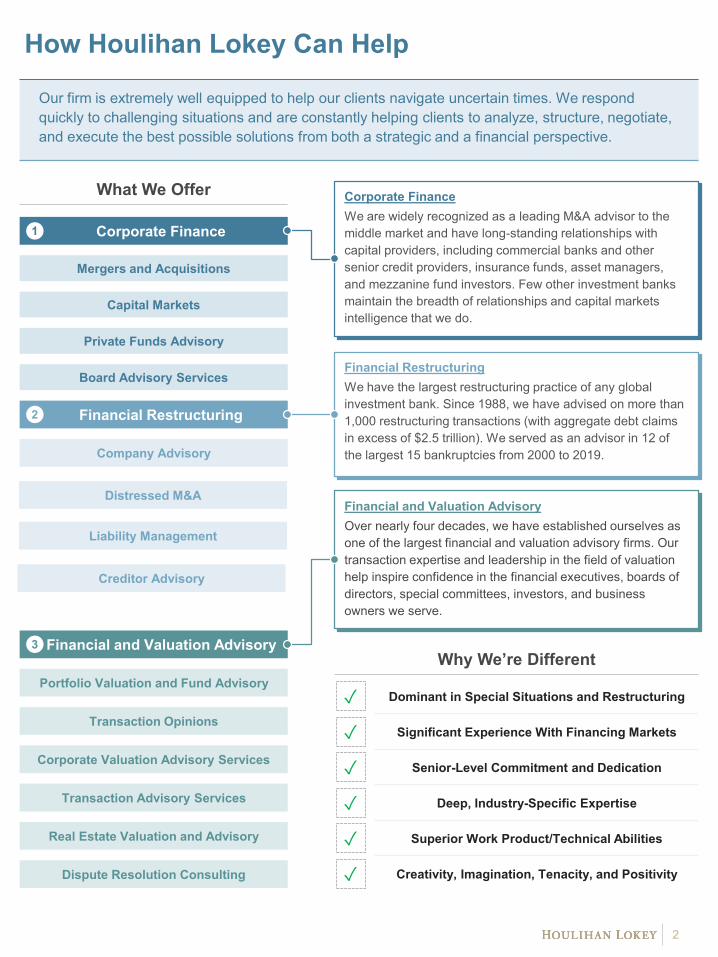
Our firm is extremely well equipped to help our clients navigate uncertain times. We respond quickly to challenging situations and are constantly helping clients to analyze, structure, negotiate, and execute the best possible solutions from both a strategic and a financial perspective.
What We Offer
Superior Work Product/Technical Abilities
Creativity, Imagination, Tenacity, and Positivity
Deep, Industry-Specific Expertise
Senior-Level Commitment and Dedication
Portfolio Valuation and Fund Advisory
Significant Experience With Financing Markets
Dominant in Special Situations and Restructuring
Corporate Finance
Financial Restructuring
Financial and Valuation Advisory
Transaction Opinions
Corporate Valuation Advisory Services
Transaction Advisory Services
Real Estate Valuation and Advisory
Dispute Resolution Consulting
Mergers and Acquisitions
Capital Markets
Private Funds Advisory
Board Advisory Services
Corporate FinanceWe are widely recognized as a leading M&A advisor to the middle market and have long-standing relationships with capital providers, including commercial banks and other senior credit providers, insurance funds, asset managers, and mezzanine fund investors. Few other investment banks maintain the breadth of relationships and capital markets intelligence that we do.
Company Advisory
Creditor Advisory
Financial RestructuringWe have the largest restructuring practice of any global investment bank. Since 1988, we have advised on more than 1,000 restructuring transactions (with aggregate debt claims in excess of $2.5 trillion). We served as an advisor in 12 of the largest 15 bankruptcies from 2000 to 2019.
Distressed M&A
Liability Management
Financial and Valuation AdvisoryOver nearly four decades, we have established ourselves as one of the largest financial and valuation advisory firms. Our transaction expertise and leadership in the field of valuation help inspire confidence in the financial executives, boards of directors, special committees, investors, and business owners we serve.
Why We’re Different
1
2
3
✓
✓
✓
✓
✓
✓
2
How Houlihan Lokey Can Help
$351 $702
$2,773 $2,694$3,185
$3,989
$6,003
$707
55
88
127
163
206216
269288
0
50
100
150
200
250
300
$
$1,000
$2,000
$3,000
$4,000
$5,000
$6,000
$7,000
2013 2014 2015 2016 2017 2018 2019 Q1 2020
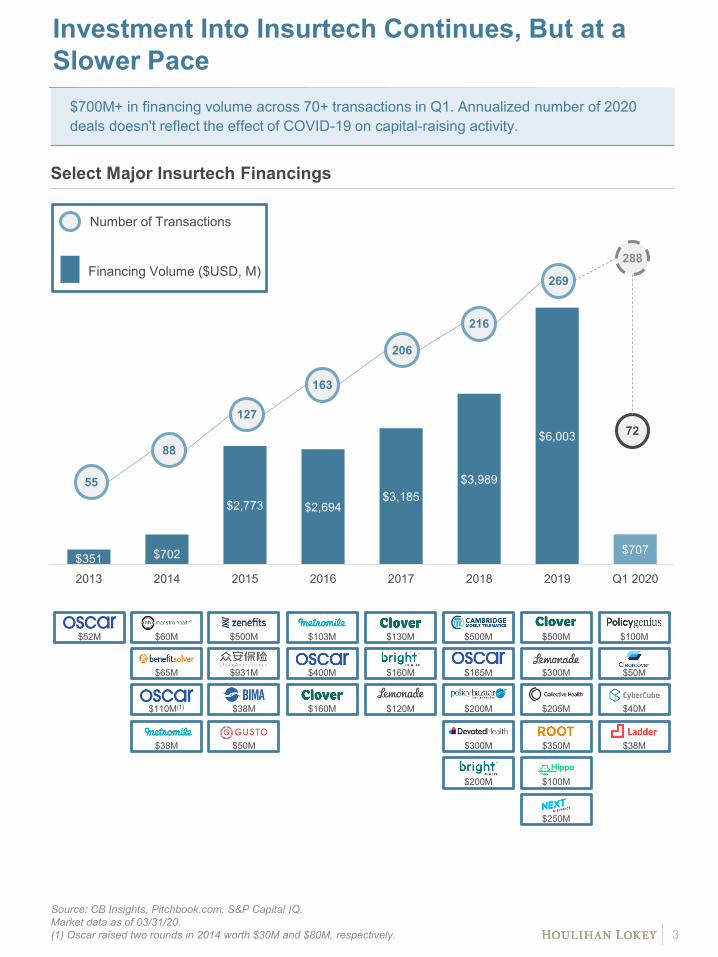
Investment Into Insurtech Continues, But at a Slower Pace
$700M+ in financing volume across 70+ transactions in Q1. Annualized number of 2020 deals doesn't reflect the effect of COVID-19 on capital-raising activity.
Select Major Insurtech Financings
Source: CB Insights, Pitchbook.com. S&P Capital IQ. Market data as of 03/31/20.(1) Oscar raised two rounds in 2014 worth $30M and $80M, respectively.
Number of Transactions
Financing Volume ($USD, M)
3
88
216
206
163
55
127
269
288
72
$65M
$38M
$52M
$160M$110M(1)
$130M $500M
$400M $165M
$50M
$120M
$38M
$103M
$200M
$500M$60M $500M
$300M
$200M
$160M$931M
$205M
$300M
$350M
$100M
$250M
$100M
$40M
$50M
$38M

Financing Activity Continues Across Insurance Types and Value-Chain Categories
Q1 ‘20 financing volume was well below the previous three quarters and the year-ago period, with a higher number of transactions and lower average deal size.
Quarterly Financing Activity ($M)(1)
Source: CB Insights, Pitchbook.com. S&P Capital IQ. Market data as of 03/31/20.(1) Includes private company equity financings and Everquote IPO in Q2 2018.
Selected Q1 2020 Financing Transactions ($M)
Insurance Segment Insurance Value Chain
P&C Life Customer Acquisition and Engagement
Innovative Distribution and
Underwriting
Software and Services
Data and Analytics
Average Deal Size ($M)
LTM financing volume: $5.2B across 251 deals
4
16.1 26.0 16.9 24.1 33.515.8 14.4 18.6 9.8
Health
Ann. Date CompanySelected
Investor(s) Amt. Invested Post-Money
ValuationSegment/
Value Chain
03/09 $40.0 $145.0
02/27 $25.0 N/A
02/23 $30.0 $95.0
02/20 $34.0 $124.0
02/21 $37.5 $237.5
02/17 $24.1 $62.3
01/30 $100.0 $540.4
01/29 $27.0 $87.0
01/03 $50.0 N/A
01/03 $31.8 N/A
$899$621
$883
$1,586 $1,520 $1,519$1,155
$1,808
$707
5743
55 61
90
63 62 54
72
0102030405060708090100
$$200$400$600$800
$1,000$1,200$1,400$1,600$1,800$2,000
Q1 2018 Q2 2018 Q3 2018 Q4 2018 Q1 2019 Q2 2019 Q3 2019 Q4 2019 Q1 2020
62636155
4357
90
5472
(1)

M&A Activity Off to a Slower Start in 2020
Q1 ‘20 reflected a slower start compared to 2019 on an annualized basis, which doesn’t reflect the effect of COVID-19 on M&A.
Selected Major Insurtech M&A Transactions
Source: CB Insights, Pitchbook.com. S&P Capital IQ. Market data as of 03/31/20.
Acquirer logo on top
5
$1.8B
$1.1B
$2.4B
$400M
$8.7B
$760M
$1.4B
$174M
$160M
$2.5B
$919M
$490M
$322M
$155M
Undisclosed
Undisclosed
$6.7B
$1.5B
$1.6B
$3.5B
$1.4B
Undisclosed
$276.3M
Undisclosed
Undisclosed
$5,266$7,444
$18,547
$5,052 $5,559$8,693
$11,805
$865
58
85
67 71
88
73 74 76
0
10
20
30
40
50
60
70
80
90
100
$
$2,000
$4,000
$6,000
$8,000
$10,000
$12,000
$14,000
$16,000
$18,000
$20,000
2013 2014 2015 2016 2017 2018 2019 Q1 2020
58
85
67 7188
73 74
19
76
Number of Transactions Financing Volume ($USD, M)

M&A Activity Continues Across the Insurtech Ecosystem
Q1 ‘20 M&A volume was slightly ahead of Q4 '19 but well below the previous three quarters.
Quarterly M&A Activity ($M)
Source: CB Insights, Pitchbook.com, S&P Capital IQ. Market data as of 03/31/20.(1) Q2 ‘19 includes $140M sale of an investment portfolio by Axiata Digital to Singaporean
Fund managed by Gordian Capital, which included their stake in BIMA.(2) Average deal sizes exclude outlier transactions.
Selected Q1 2020 M&A Transactions ($M)
Insurance Segment
P&C Life Health
Customer Acquisition and
Engagement
Innovative Distribution and
Underwriting
Software and Services
Data and Analytics
Insurance Value Chain
6
Carlyle’s $6.7B
acquisition of Sedgwick
Average Deal Size ($M)(2)
Willis’s $1.4B acquisition of
Tranzact
$7,389
$1,876
Prudential’s $3.5B acquisition
of Assurance
$7,432
33.3 36.3 34.1 26.4 62.010.7 83.5 187.2
LTM M&A volume: $10.8B across 74 deals
(1)
$225$500 $689 $579 $476
$1,753
$3,932
$744 $865
21
15
20
1719
21 22
12
19
0
5
10
15
20
25
$
$1,000
$2,000
$3,000
$4,000
$5,000
$6,000
$7,000
$8,000
Q1 2018 Q2 2018 Q3 2018 Q4 2018 Q1 2019 Q2 2019 Q3 2019 Q4 2019 Q1 2020
45.5
21
15
2017
19 21 22
12
19
Ann. Date Buyer TargetTransaction
Value
Segment/ Value Chain
02/20 N/A
02/19 N/A
01/30 $12.0
01/21 $276.3
01/17 N/A
01/08 N/A
01/07 $31.6
01/07 N/A
01/06 N/A
01/02 N/A
0.0
50.0
100.0
150.0
200.0
250.0
80
90
100
110
120
130
140
150
160
170
180
Benefits Admin/Payroll Brokerage Data and Analytics Insurance Software
IT and BPO Services Online Distribution eHealth
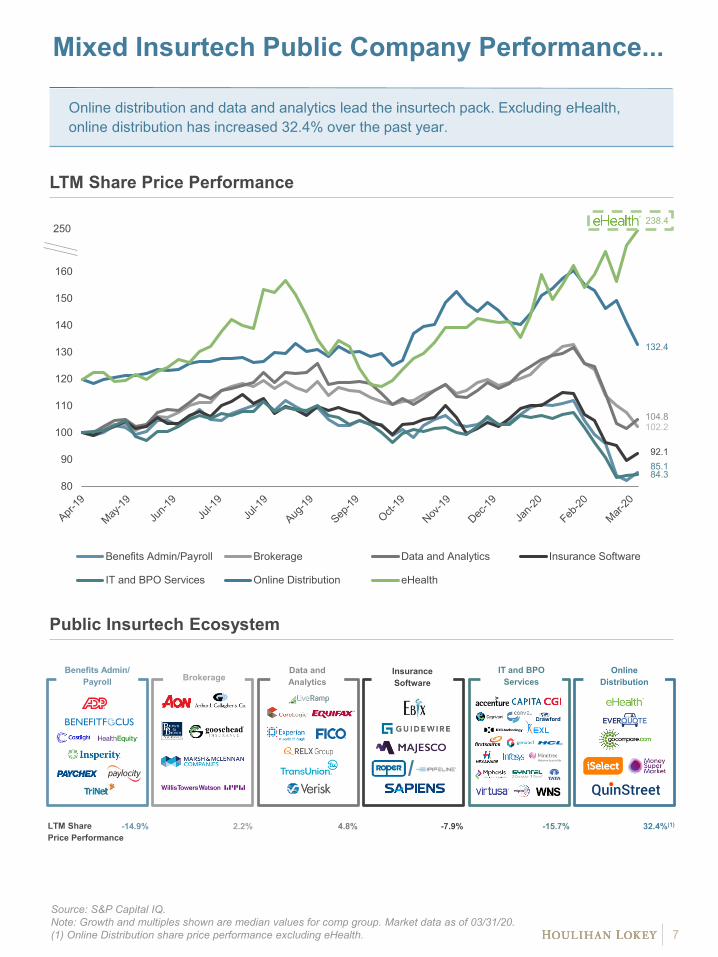
Mixed Insurtech Public Company Performance...
Online distribution and data and analytics lead the insurtech pack. Excluding eHealth, online distribution has increased 32.4% over the past year.
LTM Share Price Performance
Public Insurtech Ecosystem
Source: S&P Capital IQ.Note: Growth and multiples shown are median values for comp group. Market data as of 03/31/20.(1) Online Distribution share price performance excluding eHealth.
-14.9% 2.2% 4.8% -7.9% -15.7% 32.4%(1)LTM Share Price Performance
BrokerageInsurance Software
IT and BPO Services
Benefits Admin/ Payroll
Online Distribution
Data and Analytics
7
92.185.184.3
132.4
102.2104.8
/
238.4250

…Drives Revenue Multiple Differentiation in Certain Categories
Below are selected Insurtech subsectors and multiples.
Enterprise Value/2020E Revenue
Public Insurtech Ecosystem
Source: S&P Capital IQ.Note: Growth and multiples shown are median values for comp group. Market data as of 03/31/20. All financials calendarized to a December year-end.
3.4x 15.0x
3.6x13.1x
5.1x14.3x
2.6x13.1x
1.4x7.1x
2.1x11.6x
2020E Revenue Multiple2020E EBITDA Multiple
Enterprise Value/2020E EBITDA
8
BrokerageInsurance Software
IT and BPO Services
Benefits Admin/ Payroll
Online Distribution
Data and Analytics
/
5.1x
3.6x 3.4x 2.6x
2.1x 1.4x
--
1.0x
2.0x
3.0x
4.0x
5.0x
6.0x
Data andAnalytics
Brokerage BenefitsAdmin/Payroll
InsuranceSoftware
OnlineDistribution
IT and BPOServices
15.0x 14.3x 13.1x 13.1x
11.6x
7.1x
--
4.0x
8.0x
12.0x
16.0x
BenefitsAdmin/Payroll
Data andAnalytics
InsuranceSoftware
Brokerage OnlineDistribution
IT and BPOServices
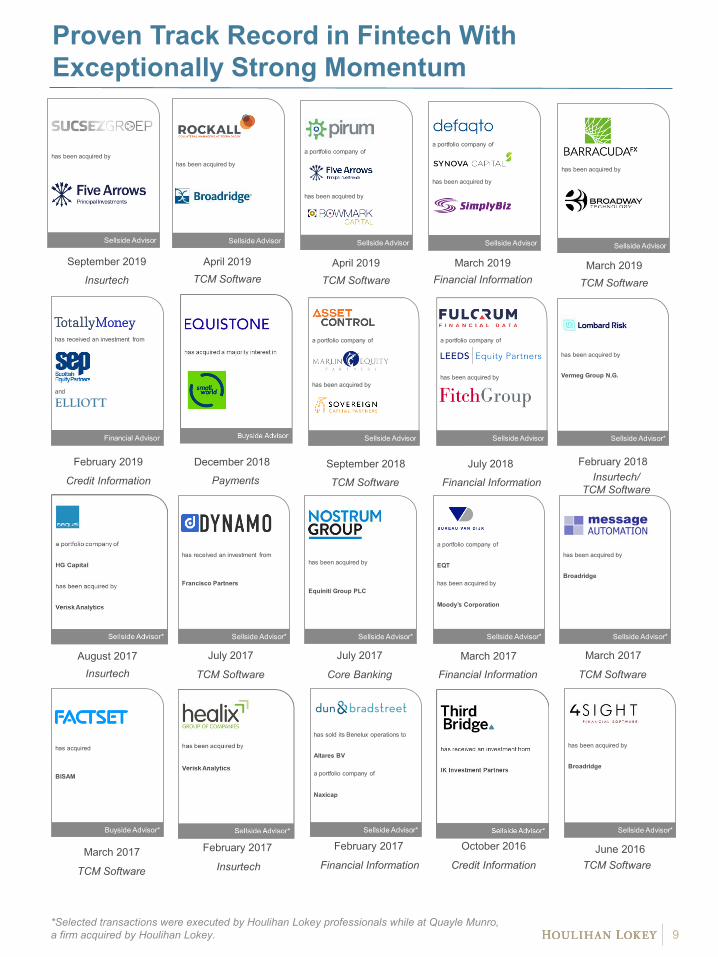
Proven Track Record in Fintech With Exceptionally Strong Momentum
*Selected transactions were executed by Houlihan Lokey professionals while at Quayle Munro, a firm acquired by Houlihan Lokey.
April 2019TCM Software
February 2019
Credit Information
Financial InformationMarch 2019 March 2019
TCM Software
April 2019TCM Software
December 2018
September 2019
July 2018September 2018 February 2018
Payments
Insurtech
Financial InformationTCM Software Insurtech/TCM Software
March 2017
March 2017July 2017July 2017 March 2017
TCM Software
TCM SoftwareFinancial InformationCore BankingTCM Software
October 2016February 2017
Credit InformationFinancial InformationJune 2016
TCM SoftwareFebruary 2017
Insurtech
August 2017Insurtech
has been acquired by
Broadridge
Sellside Advisor*
has sold its Benelux operations to
Altares BV
a portfolio company of
Naxicap
Sellside Advisor*
has acquired
BISAM
Buyside Advisor*
has been acquired by
Broadridge
Sellside Advisor*
a portfolio company of
EQT
has been acquired by
Moody’s Corporation
Sellside Advisor*
has been acquired by
Equiniti Group PLC
Sellside Advisor*
has received an investment from
Francisco Partners
Sellside Advisor*
has been acquired by
Vermeg Group N.G.
Sellside Advisor*
a portfolio company of
has been acquired by
Sellside Advisor
a portfolio company of
has been acquired by
Sellside Advisor
has been acquired by
Sellside Advisor
has been acquired by
Sellside Advisor
has been acquired by
Sellside Advisor
a portfolio company of
has been acquired by
Sellside Advisor
a portfolio company of
has been acquired by
Sellside Advisor
has received an investment from
and
ELLIOTT
Financial Advisor
9

Houlihan Lokey is the trusted advisor to more top decision-makers than any other independent global investment bank.
Corporate Finance Financial RestructuringFinancial and Valuation Advisory
No. 1 U.S. M&A Advisor
Top 10 Global M&A Advisor
Leading Capital Markets Advisor
No. 1 Global M&A Fairness Opinion Advisor Over the Past 20 Years
1,000+ Annual Valuation Engagements
No. 1 Global Investment Banking Restructuring Advisor
1,000+ Transactions Completed Valued at More Than$2.5 Trillion Collectively
Houlihan Lokey (NYSE:HLI) is a global investment bank with expertise in
mergers and acquisitions, capital markets, financial restructuring, and
valuation. The firm serves corporations, institutions, and governments
worldwide with offices in the United States, Europe, the Middle East, and
the Asia-Pacific region. Independent advice and intellectual rigor are
hallmarks of the firm’s commitment to client success across its advisory
services. Houlihan Lokey is the No. 1 M&A advisor for the past five
consecutive years in the U.S., the No. 1 global restructuring advisor for the
past six consecutive years, and the No. 1 global M&A fairness opinion
advisor over the past 20 years, all based on number of transactions and
according to data provided by Refinitiv (formerly Thomson Reuters).
Dedicated Industry Expertise
Business Services
Consumer, Food, and Retail
Data and Analytics
Energy
Financial Institutions
Healthcare
Industrials
Real Estate, Lodging, and Leisure
Technology, Media, and Telecom
2019 M&A Advisory Rankings All U.S. Transactions
Advisor Deals
1 Houlihan Lokey 184
2 Goldman Sachs & Co 167
3 JP Morgan 141
4 Morgan Stanley 122
5 Evercore Partners 112Source: Refinitiv(formerly known as Thomson Reuters
2000 to 2019 Global M&A Fairness Advisory Rankings
Adv isor Deals
1 Houlihan Lokey 1,057
2 JP Morgan 929
3 Duff & Phelps 734
4 Morgan Stanley 621
5 Bank of America Merrill Lynch 612Refinitiv (formerly known as Thomson Reuters). Announced or completed transactions.
2019 Global Distressed Debt & BankruptcyRestructuring Rankings
Adv isor Deals
1 Houlihan Lokey 76
2 PJT Partners Inc 43
3 Moelis & Co 36
4 Lazard 29
5 AlixPartners 19Source: Refinitiv (formerly known as Thomson Reuters)

Disclaimer
© 2020 Houlihan Lokey. All rights reserved. This material may not be reproduced in any format by any means or redistributed without the prior written consent of Houlihan Lokey.
Houlihan Lokey gathers its data from sources it considers reliable; however, it does not guarantee the accuracy or completeness of the information provided within this presentation. The material presented reflects information known to the authors at the time this presentation was written, and this information is subject to change. Houlihan Lokey makes no representations or warranties, expressed or implied, regarding the accuracy of this material. The views expressed in this material accurately reflect the personal views of the authors regarding the subject securities and issuers and do not necessarily coincide with those of Houlihan Lokey. Officers, directors, and partners in the Houlihan Lokey group of companies may have positions in the securities of the companies discussed. This presentation does not constitute advice or a recommendation, offer, or solicitation with respect to the securities of any company discussed herein, is not intended to provide information upon which to base an investment decision, and should not be construed as such. Houlihan Lokey or its affiliates may from time to time provide investment banking or related services to these companies. Like all Houlihan Lokey employees, the authors of this presentation receive compensation that is affected by overall firm profitability.
Houlihan Lokey is a trade name for Houlihan Lokey, Inc., and its subsidiaries and affiliates, which include those in (i) the United States: Houlihan Lokey Capital, Inc., an SEC-registered broker-dealer and member of FINRA (www.finra.org) and SIPC (www.sipc.org) (investment banking services); Houlihan Lokey Financial Advisors, Inc. (financial advisory services); HL Finance, LLC (syndicated leveraged finance platform); and Houlihan Lokey Real Estate Group, Inc. (real estate advisory services); (ii) Europe: Houlihan Lokey EMEA, LLP, and Houlihan Lokey (Corporate Finance) Limited, authorized and regulated by the U.K. Financial Conduct Authority; Houlihan Lokey S.p.A.; Houlihan Lokey GmbH; Houlihan Lokey (Netherlands) B.V.; Houlihan Lokey (España), S.A.; and Houlihan Lokey (Corporate Finance), S.A.; (iii) the United Arab Emirates, Dubai International Financial Centre (Dubai): Houlihan Lokey (MEA Financial Advisory) Limited, regulated by the Dubai Financial Services Authority for the provision of advising on financial products, arranging deals in investments, and arranging credit and advising on credit to professional clients only; (iv) Singapore: Houlihan Lokey (Singapore) Private Limited, an “exempt corporate finance adviser” able to provide exempt corporate finance advisory services to accredited investors only; (v) Hong Kong SAR: Houlihan Lokey (China) Limited, licensed in Hong Kong by the Securities and Futures Commission to conduct Type 1, 4, and 6 regulated activities to professional investors only; (vi) China: Houlihan Lokey Howard & ZukinInvestment Consulting (Beijing) Co., Limited (financial advisory services); (vii) Japan: Houlihan Lokey K.K. (financial advisory services); and (viii) Australia: Houlihan Lokey (Australia) Pty Limited (ABN 74 601 825 227), a company incorporated in Australia and licensed by the Australian Securities and Investments Commission (AFSL number 474953) in respect of financial services provided to wholesale clients only. In the European Economic Area (EEA), Dubai, Singapore, Hong Kong, and Australia, this communication is directed to intended recipients, including actual or potential professional clients (EEA and Dubai), accredited investors (Singapore), professional investors (Hong Kong), and wholesale clients (Australia), respectively. Other persons, such as retail clients, are NOT the intended recipients of our communications or services and should not act upon this communication.
11

CORPORATE FINANCE
FINANCIAL RESTRUCTURINGFINANCIAL AND VALUATION ADVISORY
HL.com