instructions for use - eprints.lib.hokudai.ac.jp · in this case, further downwind ... scalar...
TRANSCRIPT

Instructions for use
Title Size distributions of sprays produced by violent wave impacts on vertical sea walls
Author(s) Watanabe, Y.; Ingram, D. M.
Citation Proceedings of the royal society a-mathematical physical and engineering sciences, 472(2194): 20160423
Issue Date 2016-10-12
Doc URL http://hdl.handle.net/2115/67295
Type article (author version)
File Information RSPA_dropstats_f_YW_DMI.pdf
Hokkaido University Collection of Scholarly and Academic Papers : HUSCAP

rspa.royalsocietypublishing.org
Research
Article submitted to journal
Subject Areas:
Fluid Mechanics, Wave Motion,
Ocean Engineering
Keywords:
flip-through, wave impact, sea spray,
spray size distribution, droplet
number pdf
Author for correspondence:
Yasunori Watanabe
e-mail: [email protected]
Size distributions of spraysproduced by violent waveimpacts on vertical sea walls
Y. Watanabe1 and D. M. Ingram2
1Hokkaido University, Graduate School of Engineering,
North 13 West 8, Sapporo, Japan2School of Engineering, The University of Edinburgh,
Edinburgh EH9 3JL, United Kingdom
When a steep, breaking wave, hits a vertical sea wall,in shallow water, a flip-through event may occur,leading to the formation of an up-rushing planarjet. During such an event, a jet of water is ejectedat a speed many times larger than the approachingwave’s celerity. As the jet rises the bounded fluidsheet ruptures to form vertical ligaments whichsubsequently break up to form droplets, creating apolydisperse spray. Experiments in the Universityof Hokkaido’s 24m flume measured the resultingdroplet sizes using image analysis of high-speedvideo. Consideration of the mechanisms formingspray droplets shows that the number density ofdroplet sizes is directly proportional to a power p
of the droplet radius: where p=-5/2 during the earlybreakup stage, and p=-2 for the fully fragmented state.A result confirmed by the experimental observations.Here we show that the recorded droplet numberdensity follows the lognormal probability distributionwith parameters related to the elapsed time sincethe initial wave impact. This statistical model of thepolydisperse spray may provide a basis for modellingdroplet advection during wave overtopping events.Allowing the atmospheric processes leading tothe enhanced fluxes of mass, moisture, heat andmomentum in the spray-mediated marine boundarylayer over the coasts to be described.
c⃝ The Authors. Published by the Royal Society under the terms of the
Creative Commons Attribution License http://creativecommons.org/licenses/
by/4.0/, which permits unrestricted use, provided the original author and
source are credited.

2
rspa.royalsocietypublishing.orgP
rocR
Soc
A0000000
..........................................................
Figure 1. Sea spray created by the impact of large breaking waves on the breakwater of Iwanai Port, Japan (left), and
violent wave impact on a 10:1 battered wall in the large wave flume at UPC, Barcelona (right, after [5])
1. IntroductionSea sprays have important roles for meteorological and environmental processes; Examplesinclude the exchanges of gases, moisture and heat, transport of chemical materials [21] andthe dynamics of the marine atmospheric boundary layer [15]. The contributions of sea spraysto particular atmospheric processes depend on the size distributions of the spray. This in turndefines the total surface area, where mass exchanges occur via dissolution and evaporation, andthe concentration and residence time in the atmosphere, which modify momentum transportbetween air and water as additional drag forces. In the surf zone, there is a variety of sizeranges of the spray each determined by the multitude of primary spray production mechanisms.These range from the finest (sea spray aerosol) created by bubble-bursting at the sea surface [17],through larger spume droplets created by the tearing of wave crests by the wind [1,29], to thelargest droplets that are fragmented from finger jets formed by vorticity instability in plungingwaves [26,34]. Furthermore, during storm events, when large ocean waves impact on breakwatersand coastal cliffs, sea sprays rising several tens of meters into the air have been often observedin coasts (see Figure 1 left). In this case, further downwind transport of the sea sprays and longerresidence time, depending on the size distributions, from higher source levels may largely affectthe atmospheric dynamics in a thicker spray-mediated boundary layer. However, the spray sizedistribution associated with violent wave overtopping events has not yet been identified.
The free-surface dynamics of overtopping water waves was discussed in Watanabe andIngram [33] and may be summarised as follows: When a shoaling wave crest approaches avertical wall, the wall prevents the forward flow of water causing the water level at the wallto rise rapidly. The water surface between the rising wave trough and advancing crest convergesrapidly resulting in the violent ejection of a sheet, the so-called flip-through event [7,8]. Large andsmall scale experiments [5] and computer simulations [14] have shown that the velocity of the up-rushing jet can be eight to ten times the inshore wave celerity. As the sheet of water rises it evolvescusp like formations which are amplified to producing finger jets and ligaments subsequentlyfragmented into droplets (see Figure 1 right). The instability modes and mechanical processescausing this fragmentation are described in the companion paper [33]. This paper focuses on thequestion of which probability-density-function (PDF) best describes the spray droplet distributionin the polydisperse spray during this violent wave overtopping event.
Polydisperse sprays occur in many engineering applications including fuel injection,agricultural irrigation, the application of pesticides and herbicides, painting and coating surfaces,

3
rspa.royalsocietypublishing.orgP
rocR
Soc
A0000000
..........................................................
Figure 2. Experimental setup
spray drying etc. One approach to modelling the spray is to use a PDF to represent the probablenumber of droplets with certain diameters and velocities in a given region [12,13,16,28,32]. TheRosin-Rammler distribution was suggested [35] and has been found to be appropriate for manytypes of atomisation spray [2]. However, Eggers and Villermaux [10], and Villermaux et al. [31]suggests that the Gamma distribution is more appropriate for cases were droplets are torn fromfluid ligaments in a gas stream. In cases where there are multiple droplet collisions the lognormaldistribution has been suggested [9,11] to be appropriate. The lognormal distribution appliesin situations where the interactions of positive random variables are multiplicative rather thanadditive. Recent work has shown that the lognormal can also apply to additive, positive, randomscalar fields such as those found in turbulence [20].
While the Rossin-Rammler, Gamma and lognormal PDFs have all been proposed as modelsof spray sizes in polydisperse sprays the formation mechanisms for the polydisperse spraysare different from those in present case. Watanabe and Ingram [33] found that two distinctmechanisms govern the breakup of the rapidly ascending liquid sheet formed during a flip-through event: Initial amplification of undulations in the sheet thickness resulting in theformation of ligaments which fragment into droplets; and transverse deformations of the rimbounding the liquid sheet form finger jets which, due to capillary instability, also break up toform droplets. The reader is referred to the supplementary video accompanying [33] which showsthe breakup of the liquid sheet following a flip-through event. In this paper, the kinematic andgeometric features of droplets formed by the fragmentation of the unstable rim-sheet systemis discussed and an appropriate PDF identified to describe the polydisperse spray formed bythe wave impact. The results presented here continue the analysis presented in the companionpaper and are based on the same set of experiments. Here we consider the resulting spray, whereWatanabe and Ingram [33] describes the breakup of the up rushing sheet-rim system.
The paper is organised as follows. In Section 2, the experimental setup and conditions areexplained. Section 3 discusses the kinematic and geometric features of the droplets fragmentedfrom the unstable rim and sheet system observed experimentally following the wave impact.The probability density function describing the droplet size distribution is identified. Finally, theresults are summarised in Section 4.
2. ExperimentsThis section briefly explains the fundamentals experimental methods and conditions used tostudy the flip-through events. The experimental set-up is described in detail in our companionpaper [33] to which the reader is referred for more detail.

4
rspa.royalsocietypublishing.orgP
rocR
Soc
A0000000
..........................................................
Figure 3. Schematic illustrations of wave impact modes.
The experiments were conducted in the 24 m long wave flume at the University of Hokkaido.The 0.6 m wide, 1.0 m deep, flume is fitted with a piston type wave maker with active waveabsorption. A transparent, acrylic, rectangular, box 0.2 m long and 0.6 m wide with a height of1.0 m was installed on the 1/20 slope beach to form a breakwater with a vertical seaward face(see Figure 2). The model breakwater was weighted and anchored to the beach to achieving astationary wall.
The water in the flume was coloured using the fluorescence dye, Uranine (SodiumFluorescein), to enhance contrast of the liquid region. Uranine excites with blue light (absorbwavelength of 436 nm) and fluoresces with a green light (wavelength of 530 nm). A rectangularblue light-emitting-diode (LED) panel (200mm × 100 mm) was set on the back of the transparentfront wall of the model breakwater and used to illuminate the dyed water passing over it. An8-bit high-speed video camera recorded the illuminated area using a 45◦ angled reflector (seeFigure 2). A low-pass optical filter (≤ 450 nm) was fitted to the camera, to eliminate the fluorescentemissions from liquid and allow only the blue component, from the back light, to be recorded (seeFigure 4). The concentration of the dye, 0.11 mg l−1, was chosen to ensure that there would be nolight transmission across a 0.25 mm thick fluid film. The 8-bit, 1280× 1024 pixel images wererecorded at 500 Hz with an exposure time of 0.125 ms and were stored on a PC connected to thecamera as uncompressed bitmaps. We define the coordinate system for the experiment with theorigin at the point of wave breaking in the horizontal shoreward x axis, the nearside of the flumein the transverse, y, axis and at the still water level in the vertical z axis. The still water depth at theorigin x= 0 was 100 mm. Throughout the experiments monochromatic waves with the incidentwave height of 146 mm and a wave period of 1.9 s were used.
The resulting wave impact pressure is very sensitive to the incident wave shape at the impact[22], and consequently the surface behaviour of the vertical jets also depends strongly on thesurface shape of the wave face (or local wave steepness). In general, progressive waves withmild steepness reflect off the wall and behave like standing waves at the wall, while steeperwaves produce more violent impacts causing highly accelerated thin up-rushing fluid jets (seeFigure 3). The post breaking wave impact provides more complex fluid flows involving entrainedair bubbles and induced turbulence. During the experiments the model breakwater was locatedat x = -300, -200, -100 mm (in the pre-breaking region) , 0 mm (for the flip-through mode), and200 mm (for post-breaking region). The region illuminated by the LED panel was also traversedvertically from 50 mm above the still water level to +800 mm at 50 mm intervals to allow thevertical evolution of the jets to be examined. The 20 trials of the experiments were performed ateach level to allow a statistical analysis of the results.
Noise on the acquired images was reduced using a median filtering operation. Imagecoordinates were transformed to real coordinates using a linear image transformation, providingquantitative measures of the liquid surface on images at 0.10 mm/pixel resolution.
Each frame from the video was post processed using the energy fitting algorithm level-setmethod [6]. This allows the detection of both the boundaries of the liquid jet and individual spraydroplets. In the present results droplets are defined as regions having a closed boundary while

5
rspa.royalsocietypublishing.orgP
rocR
Soc
A0000000
..........................................................
Figure 4. The detected interface boundary for the typical back-light images of the jets (yellow line) and dispersed sprays
(blue line).
the jet boundary must intersect the edge of the image (see Figure 4). Liquid which is out of thefocal plane of the camera and which has the maximum absolute gradient of image intensity alongthe liquid boundaries lower than a given threshold, is removed from ensemble statistics. Thisapproach allows us to distinguish between the liquid jet and the spray droplets and, in this paper,concentrate our attention on the spray.
3. ResultsThe features of the ascending planar jet and those of the resulting spray population dependstrongly on the relative position of the vertical sea wall to the point at which the wave breaks.As the jet rises, undulations in the thickness of the fluid sheet are rapidly amplified and rupturedinto an array of vertical ligaments. While lateral undulations of the rim lead to the formation offinger jets that subsequently break up to form droplets and spray. The underlying processes aredescribed in detail in our companion paper [33]. In this section we describe impact of wall locationon the spray velocity and droplet population. A consideration of the processes leading to dropletformation are then described, characterising the spray size distributions observed following aflip-through event. Finally several of the probability density functions suggested as descriptionsof polydisperse sprays are considered and an appropriate model identified.
(a) Spray velocity and population
The spray formation depends strongly on whether the sea wall is impacted by a pre-breaking,breaking, or broken wave. No spray was observed in the wall location x<−100 mm. In thisregion a vertical planar sheet is stretched from crest of a standing wave as it runs up on the wall(see Figure 3 (a), also Fig. 8 (a) and (b) in Watanabe & Ingram [33]). In shallower locations, thespray population increases with relative wall distance x (see Figure 5 left), as the rim and sheetof the ascending jet successively breakup into droplets. In the flip-through case (x= 0), the initialhigh acceleration of the jets enhances both sheet stretch and the unstable surface behaviours,resulting in large number of spray droplets ascending at higher velocity (see Figure 5 right). Aparabolic increase of the spray population with vertical measurement level is observed in thiscase (Figure 5 left). The maximum population of spray droplets is achieved in the post breakingcase (x= 200 mm) where complex shaped jets are initially blow out by the collapse of an airpocket squeezed between the overturning jet and sea wall, and the additional spray production isenhanced through the bubble-bursting. In all cases where sea sprays are formed, the fragmented

6
rspa.royalsocietypublishing.orgP
rocR
Soc
A0000000
..........................................................
Figure 5. Spray population (left) and the ensemble mean rise velocities of the ascending jets (solid line) and sprays
(broken line) (right) with respect to the relative wall distance from the breaking location.
spray rises much faster than the jet at each measurement level (Figure 5 right); An analysis ofthe video images shows this is in the region of 1.3 to 1.5 times faster for x = -100 and 0 mm andbetween 1.6 and 2.7 times faster for x = 200 mm.
Whilst a study of the post-breaking spray, where the maximum population is achieved, wouldbe interesting, the mechanical parameters affecting the breakup of the jet, beyond capillarydynamics are unknown. Since the post breaking waves entrap an air pocket and entrain airbubbles before the impact [22,34], the bubble-bursting may become an additional mechanism forthe spray production, which is beyond the scope of this study. We have therefore left this case forfuture investigation and will focus on the flip-through case to identify the statistical features of thespray breakup resulting from consecutive unstable surface deformation described by Watanabe& Ingram [33].
(b) Spray size
In this section, we discuss the breakup mechanisms of the flip-through jets during the unstabledeformation of the rim-sheet system.
At the beginning of a flip-through event, as the sheet is ejected, a rim is formed at the leadingedge of the jet (Figure 6 top). This rim deforms transversally, forming finger jets during retractionprocess when the sheet is vertically stretched beneath the rim. Transverse undulations in sheetthickness are amplified, causing the sheet to rupture (Figure 6 middle). As the holes in the sheetextend, multiple vertical ligaments connected to the deformed rim form a rim-ligament system ofjets (Figure 6 bottom). Finally, capillary instabilities cause the sequential breakup of the ligamentsinto droplets. This process is illustrated in Figure 7.
According to Watanabe and Ingram [33], the maximum unstable growth appears in thelow wave-number range at the early stage of the flip-through event. As the flip-throughevent develops the unstable dimensionless wave-number, κmax = kmaxai, shifts toward higherwave-number, approaching 0.7, which corresponds to Rayleigh-Plateau mechanism. Here thedimensional wave-number kmax = 2π/lmax and ai is the initial rim radius. The most unstable(dimensional) wavelength, lmax, which governs the transverse spacings of the ligaments (seeFigure 7 left), is therefore a function of rim acceleration vri. It can be described using thetransitional unstable wave-number κmax(vri),
lmax =2π
κmaxai. (3.1)

7
rspa.royalsocietypublishing.orgP
rocR
Soc
A0000000
..........................................................
Figure 6. Transverse surface forms of the flip-through jet (left) and spray size distributions (right), defined by number of
spray droplets per m3 in a bin radius 1 µm versus spray radius for 20 trials; vertical level z = 50 mm (top), z = 150 mm
(middle) and z = 250 mm (bottom). The red and blue lines represent -5/2 and -2 slopes, respectively.
The number of ligaments in a transverse length L, nlf , can be written by
nlf ∼L/lmax ≈Lκ
2πa−1i . (3.2)
It can be assumed that the droplets are successively formed at frequency fd from a singleligament during the initial ligament breakup (see Figure 7 right) following the analogy of thecapillary breakup of a cylindrical jet [18]. The transitional number of the droplets formed alongthe ligament, nd, in the elapsed time t since the start of the breakup, is given by
nd ∼ fdt≈ σmaxt, (3.3)
the maximum growth rate σmax for the capillary instability is
σmax =Cd
(γ/ρb3i
)1/2, (3.4)
where γ, ρ and bi are the surface tension, liquid density and the initial ligament radius,respectively. For the Rayleigh-Plateau instability on a cylindrical liquid jet, the constant Cd isnumerically approximated as Cd ≈ 0.12 [18].
We can now write the steady-state droplet population, ndf , due to breakup at the most unstable(dimensional) wavelength λmax =Cdf bi, with ligament length M in the fully fragmented stage(see Figure 7 right) as
ndf ∼M/λmax ≈MC−1df b−1
i , (3.5)
where the constant Cdf for an unstable cylindrical jet is numerically estimated to be 9.02[18]. Equating this with equation (3.3) temporally integrated from the inception of breakup tothe time achieving fully fragmented state, we find the droplet formation occurs in the range

8
rspa.royalsocietypublishing.orgP
rocR
Soc
A0000000
..........................................................
Figure 7. Schematic illustration of the deformation and breakup of the flip-through jets; (a) a deformed rim connected to
vertical ligaments, resulted from instabilities of the rim-sheet system, and (b) breakup of the ligaments owing to capillary
instability.
0≤ t≤ (2M)1/2(CdCdfuc
)−1/2 of the breakup period, where capillary velocity uc =√
γ/ρbi.Furthermore, the integrated number of droplets formed in the rim-ligament system until t inthe early stages of the breakup process, Ne, can be estimated as
Ne ∼ nlfndt2/2≈Cea
−1i b
−3/2i t2 ≈Cea
−5/2i t2, (3.6)
assuming identical rim and ligament radii ai ≈ bi, where Ce is the constant. The temporalincrease of Ne is consistent with the observed parabolic increase of the spray population withmeasurement level, shown in Figure 5 (left). When the ligaments are fully fragmented intodroplets, the total number of the droplets formed in the rim-ligament system at the steady state,Ns, may be approximated as
Ns ∼ nlfndf ≈Csa−1i b−1
i ≈Csa−2i , (3.7)
where Cs is the constant.Rutland and Jameson [24] used theory to predict the volumes of the main and satellite droplets
fragmented from a liquid jet with radius ai and compared this with measured droplet sizes. Theyfound the theoretical droplet size associated with the most unstable wave-number, r = 1.89 ai. Asthe radius r can be assumed to be proportional to ai for equations (3.6) and (3.7), the total dropletnumbers are therefore related to the drop radius;
Ne ∝ r−5/2, (3.8)
Ns ∝ r−2. (3.9)
Figure 6 shows the droplet size distributions plotted on log-log axes as number density, Nd,(representing the number of droplets per m3 in each 1µm radius bin) against the equivalent radiusof droplet area detected on the experimental images, rd, together with the transverse surfaceforms of the flip-through jet at the corresponding level from z = 50 – 250 mm.
While there is active deformation of the unstable surface of the jet at the early stage of theflip-through event, the observed size distributions are similar, in a larger range than the radiuswith the maximum density, at all three measurement levels with lnNd decaying with ln rd, whilethe dispersions increase with rd. The plots show that the number densities in the larger radiusrange are well approximated by a -5/2 slope (denoted by a solid red line) and a -2 slope (a solidblue line). A result which is consistent with our estimates of the total droplet numbers given

9
rspa.royalsocietypublishing.orgP
rocR
Soc
A0000000
..........................................................
Figure 8. Transverse surface forms of the flip-through jet (left) and spray size distributions (right), defined by number of
spray droplets per m3 in a bin radius 1 µm versus spray radius for 20 trials; vertical level z = 350, 450, 600, 800 mm from
top to bottom. The red and blue lines represent -5/2 and -2 slopes, respectively.
by equations (3.8) and (3.9). The observed dispersion may be associated with nonlinear growthof the unstable deformations, formations of the satellite drops [24] and variable ligament sizes,all of which are neglected in our linear stability analysis of the rim-sheet system [33]. There arelarge changes in the exponential gradient of the experimental droplet sizes in the small size range(rd < 0.4mm), suggesting breakup of the small droplets is governed by dynamics, other thanthose described above, during sequential breakup process from larger droplets into smaller ones.The formation of smaller droplets is therefore likely to break the assumption made in the currentdroplet number models. Consequently the models are only applicable to the large droplets (rd >0.4 mm)
As the rim and sheet continue to disintegrate they are successively fragmented into spray(Figure 8). The spray then continues to ascend but no further breakup behaviour is observed.By z = 800mm, it is clear that the breakup process has been terminated before spray arrives atthis level as no ligaments from either the fragmented rim, or the sheet are observed. In this fullyfragmented state, the steady size distribution (3.9) provides a more appropriate approximation ofthe observed spray than the transitional model (3.8).
10
rspa.royalsocietypublishing.orgP
rocR
Soc
A0000000
..........................................................
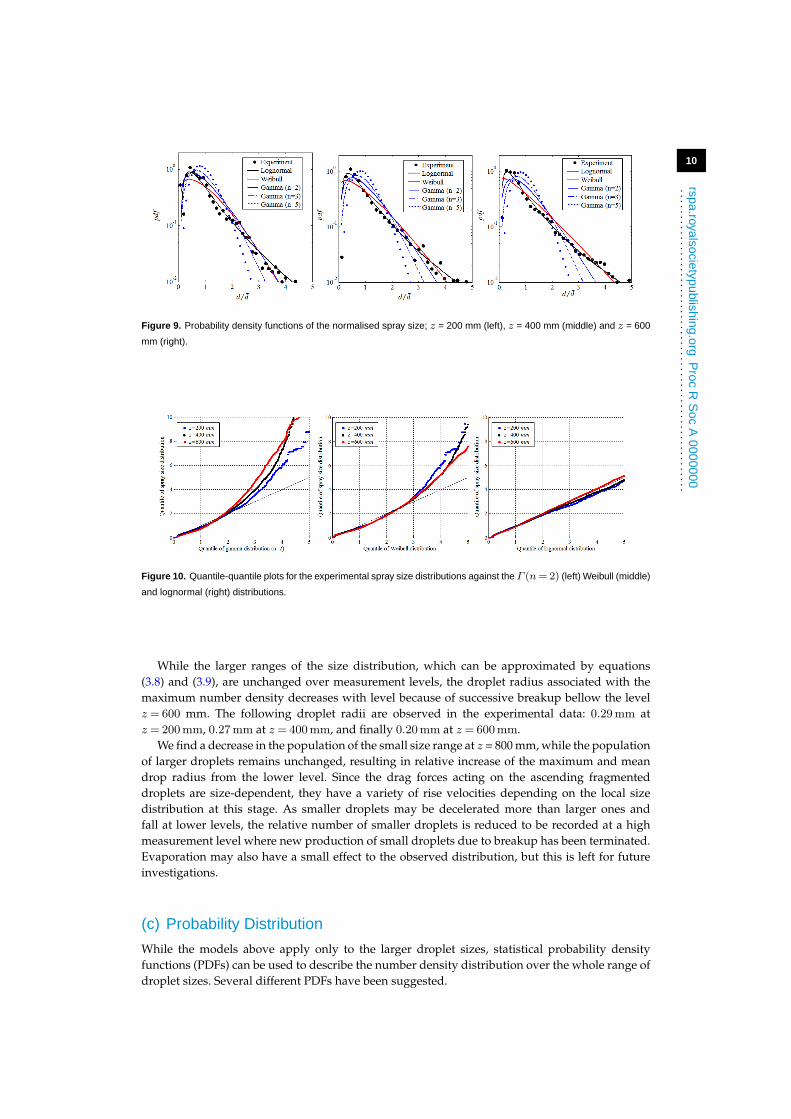
Figure 9. Probability density functions of the normalised spray size; z = 200 mm (left), z = 400 mm (middle) and z = 600
mm (right).
Figure 10. Quantile-quantile plots for the experimental spray size distributions against the Γ (n= 2) (left) Weibull (middle)
and lognormal (right) distributions.
While the larger ranges of the size distribution, which can be approximated by equations(3.8) and (3.9), are unchanged over measurement levels, the droplet radius associated with themaximum number density decreases with level because of successive breakup bellow the levelz = 600 mm. The following droplet radii are observed in the experimental data: 0.29mm atz = 200mm, 0.27mm at z = 400mm, and finally 0.20mm at z = 600mm.
We find a decrease in the population of the small size range at z = 800 mm, while the populationof larger droplets remains unchanged, resulting in relative increase of the maximum and meandrop radius from the lower level. Since the drag forces acting on the ascending fragmenteddroplets are size-dependent, they have a variety of rise velocities depending on the local sizedistribution at this stage. As smaller droplets may be decelerated more than larger ones andfall at lower levels, the relative number of smaller droplets is reduced to be recorded at a highmeasurement level where new production of small droplets due to breakup has been terminated.Evaporation may also have a small effect to the observed distribution, but this is left for futureinvestigations.
(c) Probability Distribution
While the models above apply only to the larger droplet sizes, statistical probability densityfunctions (PDFs) can be used to describe the number density distribution over the whole range ofdroplet sizes. Several different PDFs have been suggested.

11
rspa.royalsocietypublishing.orgP
rocR
Soc
A0000000
..........................................................
Villermaux et al. [31] found that the Γ distribution provides a good model for the PDF of thesize of spray droplets fragmented from ligaments torn off from the liquid jet in gas stream. Thesame distribution also been shown to provides a good model for the fragment sizes for liquidsheets resulting from the oblique collision of two cylindrical jets [4] and for an axisymmetricexpanding sheet formed by impact of steady gravity-driven circular jet and droplet onto ahorizontal upper surface of a solid cylinder [3,30]. The Γ distribution is
pΓ (x= d/d) =nn
Γ (n)xn−1 exp (−nx) (3.10)
where d is the spray diameter, d is the mean diameter. A parameter n is chosen for reflecting theinitial configuration of the ligaments. n∼ 4 to 5 is suggested in Bremond et al. [3].
Roisman et al. [25] proposed the Weibull distribution as an empirically approximation for thePDF of secondary droplets generated through the rim instability of crown splashes.
pW (x) =β
α
(xα
)β−1exp
(−(xα
)β)(3.11)
where the parameters α and β are again estimated empirically. Another alternative is thelognormal distribution,
pln(x) =1
xλ√2π
exp
(− (lnx− µ)2
2λ2
)(3.12)
where the logarithmic average µ and standard deviation λ are determined by fitting procedures.Figure 9 shows the pdfs for Γ , Weibull and lognormal distributions fitted to the experimental
data. The Γ distribution with n= 2, n= 3 or n= 5 provides a poor fit to the data, while the Weibulldistribution models performs well for large droplet sizes with d/d> 2 but performs poorlyfor smaller droplets. In contrast the lognormal distribution fits the data well across the wholed/d range. The deviation from the Γ and Weibull distributions indicates that the underlyingspray formation mechanisms are different from those discussed by [3] and [25]. There are majordifferences between the initial unstable behaviours in the flip-through events [33], undulatingliquid sheet [3] and crown splashes [25] which lead to different droplet size distributions. Thedynamics of the coupled rim-sheet, leading to the transitional rim-ligament system, discussed in(b), defines the distinct initial conditions for the number density of the droplets fragmented fromthe system.
Our initial investigation of which the three proposed PDFs fits the data begins by examiningquantile-quantile (QQ) plots of the measured and modelled spray size distributions. QQ plotsplot the ranked experimental data against the equivalent quantiles of the theoretical distribution.If the distribution provides a good fit for the data the observations will lie on the 45◦ line. Itshould be noted that even in the case of a good fit, the extreme values will often lie off theline. Figure 10 shows quantile-quantile (QQ) plots for the experimental spray size measurementsagainst the Γ (n= 2) (left) Weibull (middle) and lognormal (right) distributions. The QQ plotsfor the Γ (n= 2) and Weibull distributions clearly show that the quantiles of the distributionsdo not fit with those of the experimental data. In both values above the medians lie far fromthe line, indicating a poor fit. The QQ plots provide strong, graphical, evidence that neither theΓ (n= 2) or Weibull distributions provide good models for the probability density function ofthe spray size. The lognormal QQ plot, in contrast, shows good agreement between the modeland experimental distributions with very little deviance from the straight line at any of the threeelevations. This analysis indicates that the mechanisms for the breakup of the spray proposedby [31] and [25] are different from that associated with the flip-through case and suggests that thelognormal distribution may provide a good model for the spray size PDF.
Stronger statistical evidence of the goodness of fit is obtained by performing the, well-known,non-parametric, Kolmogorov-Smirnov test for the fit of a distribution. The Kolmogorov-Smirnovtests the null hypothesis that the specified distribution fits the data against the alternatehypothesis that it does not, if the calculated p-value is smaller than 0.05 then there is significant

12
rspa.royalsocietypublishing.orgP
rocR
Soc
A0000000
..........................................................
Figure 11. Evolution of the optimal parameters of the lognormal distribution.
statistical evidence to reject the hypothesis that the data fits the distribution. The test wasperformed using the R statistics package [23].
The calculated p-values from the tests for fitting the lognormal distribution at the threeelevations are: Pz=200 = 0.2132, Pz=400 = 0.2649, and Pz=600 = 0.644. In all three cases the p-value is greater than 0.05 so we conclude that at the 5% significance level there is insufficientstatistical evidence to reject the hypothesis that the lognormal distribution fits the spray size data.
Trietsch and Baker [27] report that while the normal distribution is usually a goodrepresentation of the interaction of n, independent, random variables (due to the central limittheorem) it is inadequate for strictly positive variables, since there is a finite probability of havinga negative value. They note that in such cases the lognormal distribution may be appropriate.Mouri [20] shows that the lognormal is also good approximation for small n. Since droplet sizemust be strictly positive and in the formation of the spray droplet collisions are likely to occurit seems likely that the conditions noted by Trietsch and Baker [27] and Mouri [20] are met.The lognormal distribution is widely accepted to describe populations of observed atmosphericaerosol particles including sea spray aerosol which exhibits multiple lognormal modes [19,36],which provides a consistent analogy with the present analysis, although the size range reportedis orders of magnitude smaller than those involved in this study.
In order to provide a general representation of the empirical parameters for the droplet sizePDF during the fragmentation process we introduce the dimensionless time
t∗ =tiτr
,
where ti is the arrival time of the jet at the vertical level z from the time to start the flip-through
and τr is the capillary time for the rim deformation, τr =√
ρa3i /γ. The normalised time t∗ thusprovides a relative measure of the evolution of the capillary deformation. Least-squares estimatesfor the lognormal parameter µ and λ are shown in Figure 11. In all cases linear relationshipsprovide a good fit between the scaled time and the distribution parameters.
The least-squares approximations for the free parameters of lognormal distribution are:
λ = 0.0074t∗ + 0.73 (3.13)
µ = −0.0068t∗ − 0.24 (3.14)
indicating that there is a small decreases in mean droplet diameter with increasing time while thestandard deviation increases. The temporal variations of µ and λ interpret the statistical features

13
rspa.royalsocietypublishing.orgP
rocR
Soc
A0000000
..........................................................
that the maximum spray number density increases and the prominent spray becomes finer due tothe successive breakup of the rims and ligaments into smaller droplets during the up rush stageof flip-through jet.
The present analysis provides a physical basis for a statistical model of sea sprays producedby violent wave impacts on sea walls, and other sheer vertical surfaces, along the coastline. Themodel may lead to further understanding of coastal atmospheric processes, occurring at the nexusof the natural and built environment in the marine boundary layer.
4. ConclusionsThe fragmentation into spray of the water jet created by flip-through events when a breakingwave impacts on vertical walls has been characterised using image analysis to measure dropletsizes during wave impact experiments and the resulting spray size distributions examined.
A theoretical consideration of the rim-ligament system created by instabilities in the rim-sheet system created by the wave impact [33], shows that for larger droplet sizes the numberdistribution decays with an exponential -5/2 slope for the early transitional stage of the flip-through and -2 slope in the steady, fully fragmented, stage. These estimates are consistent withthe experimental data collected.
A comparison of the probability density functions (PDFs) proposed for modelling polydispersesprays (Γ , Weibull and lognormal) shows that the lognormal distribution provides a goodstatistical fit for sprays resulting from flip-through events. The deviation from the Γ and Weibulldistributions is due to different underlying spray formation mechanisms from those for crownsplashes and undulating liquid sheets for which the first two distributions are proposed.
Furthermore, linear fits for the mean and standard deviation of the lognormal distribution asfunctions of rise time have been produced. These fits provide a statistical model that gives a gooddescription of the spray size distribution resulting from a flip-though event.
Coastal sea sprays affect both the dynamics within the marine boundary layer and thedownwind environment. Sea sprays produced by violent wave impacts on sea walls, especiallyduring storm events, may rise high into the air resulting in significant downwind transport of thespray aerosols and high residence times. Such high spray concentrations and long residence timesmay modify the dynamics of the atmospheric boundary layer. The present statistical model mayprovide useful, physically-rational, descriptions of spray aerosols along the coast, caused by waveimpacts on both man made structures and vertical sea cliffs, leading to improved understandingof coastal atmospheric processes and sea spray transport.
Authors’ contributions. Y.W. and D.I. conceived of the research, carried out the analyses, drafted themanuscript and approved the study for publication.
Data accessibility. This article is supported by the identical experimental image data used in thecompanion paper [33] containing the supplementary movie file of the original image data (Movie S1) athttp://rspa.royalsocietypublishing.org/content/471/2182/20150397.figures-only.
Acknowledgements. The authors thank S. Ishizaki for his help in conducting experiments.
Funding. This research was supported by JSPS Grant-in-Aid for Scientific Research (15H04043).
Competing interests. The authors declare that no competing interests exist.
References1. Anguelova M, Barber Jr. RP, Wu J. 1999 Spume drops produced by the wind tearing of wave
crests, Journal of Physical Oceanography 29, 1156–1164.2. Beck JC, Watkins AP. 2003 On the development of a spray model based on drop-size moments,
Proceedings of the Royal Society of London A: Mathematical, Physical and Engineering Science459, 1365–1394.

14
rspa.royalsocietypublishing.orgP
rocR
Soc
A0000000
..........................................................
3. Bremond N, Clanet C, Villermaux E. 2007 Atomisation of undulating liquid sheets, Journal ofFluid Mechanics 585, 421–56.
4. Bremond N, Villermaux E. 2006 Atomization by jet impact, Journal of Fluid Mechanics 549,273–306.
5. Bruce T, Pearson J, Allsop NWH. 2003 Hazards at coast and harbour seawalls – velocities andtrajectories of violent ovetopping jets, Coastal Engineering 2002: Solving Coastal Conundrums(J McKee Smith, ed.), vol. 2, World Scientific, 2216–2226.
6. Chan TF, Vese LA. 2001 An active contour model without edges, IEEE Transactions on ImageProcessing 10 (2), 266–277.
7. Cooker MJ, Peregrine DH. 1990 A model for breaking wave impact pressure, Proceedings ofthe 22nd International Conference on Coastal Engineering, 1473–1486.
8. Cooker MJ, Peregrine DH. 1995 Pressure-impulse theory for liquid impact problems, Journalof Fluid Mechanics 297, 193–214.
9. Efendiev Y. 2004 Modeling and simulation of multi-component aerosol dynamics,Computational & Applied Mathematics 23, no. 2–3, 401–423.
10. Eggers J, Villermaux E. 2008 Physics of liquid jets, Reports on progress in physics 71, no.036601, 79 pp.
11. Foissac A, Malet J, Mimouni S, Ruyer P, Feuillebois F, Simonin O. 2013 Eulerian simulation ofinteracting PWR sprays including droplet collisions, Nuclear Technology 181(1), 133–143.
12. Gorokhovski M, Jouanguy J, Chtab-Desportes A. 2009 Stochastic model of the near-to-injectorspray formation assisted by a high-speed coaxial gas jet, Fluid Dynamics Research 41, no.035509, 15 pp.
13. Gorokhovski M, Herrmann M. 2008 Modelling primary atomization, Annual Review of FluidMechanics 40, 343–366.
14. Ingram DM, Causon DM, Bruce T, Pearson J, Gao F, Mingham CG. 2005 Numerical andexperimental predictions of overtopping volumes for violent overtopping events, CoastalStructures ’03 (J Melby, ed.), ASCE, 631–642.
15. Kudryavtsev VN, Makin VK. 2011 Impact of ocean spray on the dynamics of the marineatmospheric boundary layer, Boundary-layer Meteorol, 140:383–410.
16. Lasheras JC and Hopfinger EJ. 2000 Liquid jet instability and atomization in a coaxial gasstream, Annual Review of Fluid Mechanics 32, 275–308.
17. Leeuw G, Neele FP, Hill M, Smith MH. 2000 Production of sea spray aerosol in the surf zone,Journal of Geophysical Research 105 (D24), 29397 - 29409.
18. Levich VG. 1962 Physicochemical Hydrodynamics, Prentice-Hall Inc., p. 700.19. Lewis ER, Schwartz SE 2004,Sea salt aerosol production, American Geophysical Union.20. Mouri H. 2013 Log-normal distribution from a process that is not multiplicative but is addi-
tive, Physical Review E 88(4), 042124.21. O’Dowd CD, Leeuw G. 2007 Marine aerosol production: a review of the current knowledge.
Phil. Trans. R. Soc. A. 365, 1753 – 1774.22. Peregrine DH. 2003 Water-wave impact on walls, Annu. Rev. Fluid Mech. 35, 23 – 43.23. R Core Team. 2014 R: A language and environment for statistical computing, R Foundation
for Statistical Computing, Vienna, Austria.24. Rutland DF, Jameson GJ. 1970 Theoretical prediction of the sizes of drops formed in the
breakup of capillary jets, Chemical Engineering Science 25, 1689 – 1698.25. Roisman IV, Horvat K, Tropea C. 2006 Spray impact: Rim traverse instability initiating
fingering and splash, Physics of Fluids 18, 102104.26. Saruwatari A, Watanabe Y, Ingram DM 2009. Scarifying and fingering surfaces of plunging
jets, Coastal Engineering 56, 1109 – 1122.27. Trietsch D, Baker KR, 2012 PERT 21: fitting PERT/CPM for use in the 21st century,
International Journal of Project Management 30(4), 490–502.28. Varga CM, Lasheras JC, Hopfinger EJ. 2003 Initial breakup of a small-diameter liquid jet by a
high-speed gas stream, Journal of Fluid Mechanics 497, 405–434.29. Veron F, Hpkins C, Harrison EL, Mueller JA. 2012 Sea spray spume droplet production in high
wind speeds, Geophysical Research Letters, 39, L16602, doi:10.1029/2012/2012GL052603.30. Villermaux E, Boosa B. 2011 Drop fragmentation on impact, Journal of Fluid Mechanics 668,
412–435.31. Villermaux E, Marmottant P, Duplat J. 2004 Ligament-mediated spray formation, Physical
review letters 92(7), 074501.

15
rspa.royalsocietypublishing.orgP
rocR
Soc
A0000000
..........................................................
32. Vinkovic I, Aguirre C, Simoens S, Gorokhovski M. 2006 Large eddy simulation of dropletdispersion from inhomogeneous turbulent wall ow, International Journal of Multiphase Flow32, 344–464.
33. Watanabe Y, Ingram DM. 2015 Transverse deformation of up-rushing jets formed during waveimpacts on vertical walls, Proceedings of the Royal Society A: Mathematical, Physical andEngineering Science, 471:20150397.
34. Watanabe Y, Saeki H, Hosking RJ 2005. Three-dimensional vortex structures under breakingwaves, Journal of Fluid Mechanics 545, 291 – 328.
35. Williams FA, 1961 Progress in spray-combustion analysis, Symposium (International) onCombustion 8 (1), 50–69.
36. Whitby KT, 1978 The physical characteristics of sulfur aerosols, Atmospheric Environment 12,135 – 159.