instructions for the week of june 8
TRANSCRIPT

Instructions for the Week of June 8
Every day you should be watching the assigned video and taking notes. When completing notes please
do so in your notebook or in a space that can be transferred to your math binder as these will be
important when we return to school. When taking notes on specific sections you are not required to do
the investigations however if you have some free time it may be fun to give them a try!
You are not required to send me your notes however all exercises must be submitted by the end of the
day two days after they were assigned. For example, Monday’s lesson is due by the end of the day
Wednesday. Thursday and Friday’s lesson is due by the end of the day Monday. These can be
submitted through turnitin by taking a picture or scanning your work and saving it as a word document
or pdf (pictures/scans should be compiled into one document to submit. This can be done by inserting
your pictures into a word document).
**ALL LATE WORK MUST BE SUBMITTED VIA E-MAIL. IF YOU COMPLETE IXL LATE YOU MUST E-MAIL
TO RECEIVE CREDIT**
Collaboration is not allowed.
Collaboration: To work jointly with others or together especially in an intellectual endeavor. When
collaboration takes place, all students must demonstrate understanding of the new material.
If you have any questions throughout the week please feel free to e -mail and set up a time to discuss by
phone if necessary!
Monday- Warch Video on Inverse Normal Distribution
Complete IXL Y.14 for Classwork (20 minutes or until mastery)
Complete 14K for Homework
Tuesday- Watch Video on Inverse Normal Day 2 Video
Complete IXL Y.15 for Classwork (20 minutes or until mastery)
Complete 14L for Homework
*IA Topic Due Today*
Wednesday- Watch Video on Inverse Normal Find M and SD
Complete 14M for Homework
Thursday- Watch Video on Chapter 14 Review
Complete Exam Style Questions (#16-26 pg 623-625) for Homework
Friday- Complete Chapter 14 Quiz Posted to Microsoft Teams- due by 11:59pm Friday June 12th
LATE WORK- All Quarter 4 Work is due by Wednesday June 17th
FINAL EXAM- Study Guide is attached- Final Exam will be Tuesday June 23rd
**Extra help is available on Microsoft Teams Monday at 2PM and Wednesday at 9AM. Attending
Extra Help will give you class participation points for the week**

Ms. Reynolds – Math IBSL1 Final Exam Study Guide 2019-2020
The final exam will consist of material from chapters 8, 10, 11, 12, 13, and 15 of the textbook. The
review sections at the end of each chapter make for good practice problems, as well as any
questions from the tests and quizzes taken thus far this year. You will be allowed to use a graphing
calculator for the exam. You are allowed to have a clean copy of the IB information packet with you
during the exam, but it cannot have any additional notes whatsoever. The following is a list of topics
that you should be familiar with prior to taking the exam:
• Chapter 8 – Univariate Analysis (question #’s 14, 15, 17, 19, 20, 21)
Presentation of data (i.e. frequency charts, histograms)
Measures of central tendency (mean, median, mode)
Analysis of cumulative frequency graphs
• Chapter 10 – Bivariate Analysis (question # 16, 18)
Analyzing correlation coefficients of scatter plots
Analyzing the line of best fit through a scatter plot
Understanding the regression line and limitations of its use
• Chapter 11 – Trigonometry (#’s 2, 4, 6, 7, 10)
Solving right triangles using SohCahToa
Solving trigonometric word problems involving true bearings and directional coordinates
Trigonometry on the coordinate plane
Solving triangles using Law of Sines or Law of Cosines
Interpreting the ambiguous case of Law of Sines
Calculating arc lengths on a circle as well as area sector

• Chapter 13 – Circular Functions (#’s 9, 11, 12, 13) Using the unit circle and its properties to evaluate trigonometric functions at given angles without
the use of a calculator
Evaluating trigonometric functions for double angles
Proving trigonometric identities
Graphing trigonometric functions on a coordinate plane as well as their transformations (translating,
stretching/compressing, reflecting)
Modeling sine and cosine functions
Solving trigonometric equations
• Chapter 3 – Probability (question #’s 1, 3, 5, 8)
Shading Venn diagrams Unions, intersections, and complements of simple events Calculation of independent and / or mutually exclusive events
Creating sample spaces Conditional probability of events Using tree diagrams to help in the aid of probability calculations
• Chapter 15 – Probability Distributions (#’s 22, 23, 24)
Finding probability distributions of discrete random variables
Finding expected values of a random variable
Probability, expected value, and variance in binomial distributions
Finding probability and parameters in a normal distribution

IBSL1 2018-2019 Final Exam Study Guide Sample Questions
1. The events B and C are dependent, where C is the event “a student takes Chemistry”, and B is the event “a student takes Biology”. It is known that
P(C) = 0.4, P(B | C) = 0.6, P(B | C) = 0.5.
(a)Complete the following tree diagram.
(b)Calculate the probability that a student takes Biology.
(c)Given that a student takes Biology, what is the probability that the student takes Chemistry?

2. In the following diagram, O is the center of the circle and (AT) is the tangent to the circle at T
Diagram not to scale
If OA = 12 cm, and the circle has a radius of 6 cm, find the area of the shaded region.
3. Events E and F are independent, with P(E) = and P(E F) = . Calculate
P(E∪F)′
O
T
A

4. (a) Express 2 cos2 x + sin x only terms of sin x
(b) Solve the equation 2 cos2 x + sin x = 2 for x in the interval 0 x , giving your
answers exactly
5. The events A and B are independent such that P(B) = 3P(A) and P(AB) = 0.68. Find P(B)
6. Solve the equation 2cos x = sin 2x, for 0 ≤ x ≤ 3π.

7. A ship leaves port A on a bearing of 30°. It sails a distance of 25 km to point B. At B, the ship changes direction to a bearing of 100°. It sails a distance of 40 km to reach point C.
A second ship leaves port A and sails directly to C.
(a) Find the distance the second ship will travel.
(b) Find the bearing of the course taken by the second ship.
8. Consider the events A and B, where P(A) = , P(B′) = and P(A B) = .
(a)Write down P(B).
(a) Find P(A B).
(b) Find P(A B).
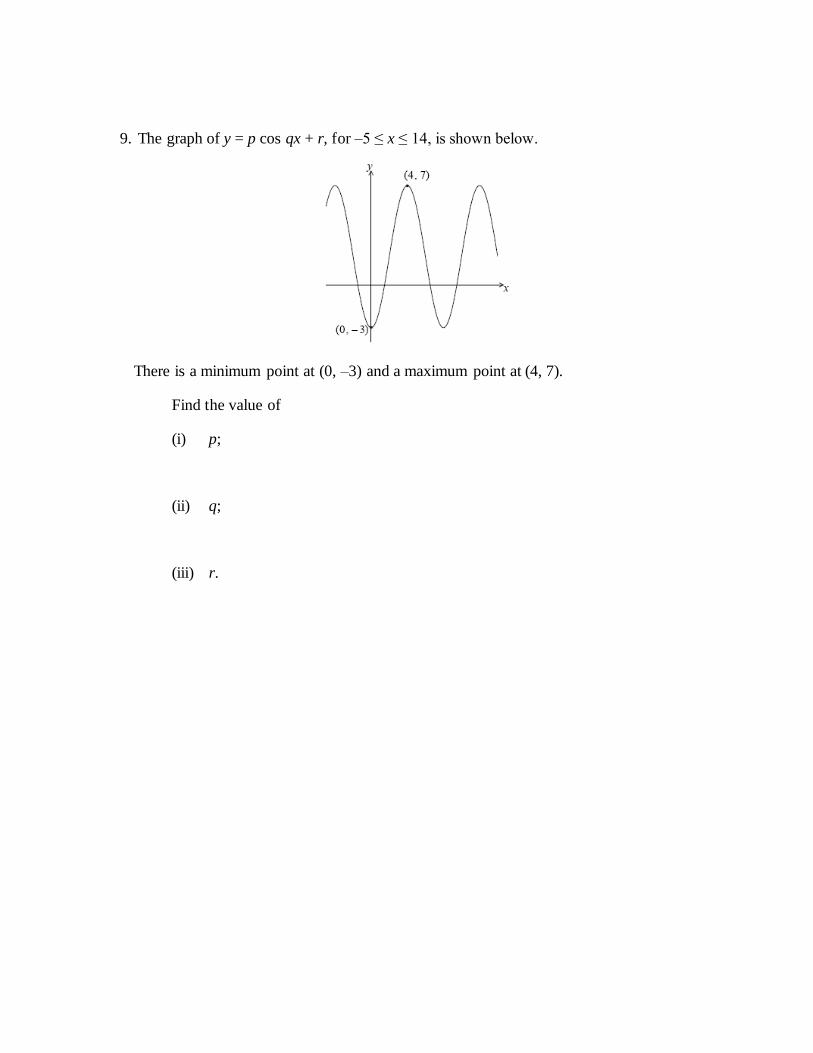
9. The graph of y = p cos qx + r, for –5 ≤ x ≤ 14, is shown below.
There is a minimum point at (0, –3) and a maximum point at (4, 7).
Find the value of
(i) p;
(ii) q;
(iii) r.

10. The following diagram shows a circle with centre O and radius 4 cm.
diagram not to scale
The points A, B and C lie on the circle. The point D is outside the circle, on (OC). Angle ADC = 0.3 radians and angle AOC = 0.8 radians.
(a) Find AD
(b) Find OD
(c) Find the area of sector OABC
(d) Find the area of region ABCD

11. A formula for the depth d metres of water in a harbour at a time t hours after midnight is
where P and Q are positive constants. In the following graph the point (6, 8.2) is a minimum point and the point (12, 14.6) is a maximum point.
(a) Find the value of
(i) Q
(ii) P
(b) Find the first time in the 24-hour period when the depth of the water is 10 meters.
(c) (i) Use the symmetry of the graph to find the next time when the depth of the water is 10 meters
(ii) Hence find the time intervals in the 24-hour period during which the water is less than 10 meters deep.
,240,6
cos
+= ttQPd
0 6 12 18 24
15
10.
5
d
t
(6, 8.2)
(12, 14.6)

12. Let f(t) = a cos b (t – c) + d, t ≥ 0. Part of the graph of y = f(t) is given below.
When t = 3, there is a maximum value of 29, at M. When t = 9 , there is a minimum value of 15.
(i) Find the value of a
(ii) Show that b =
(iii) Find the value of d
(iv) Write down a value for c
6
π

13. At an amusement park, a Ferris wheel with diameter 111 metres rotates at a constant speed.
The bottom of the wheel is k metres above the ground. A seat starts at the bottom of the wheel.
The wheel completes one revolution in 16 minutes.
a. After 8 minutes, the seat is 117 m above the ground. Find k.
b. After 𝑡 minutes, the height of the seat above ground is given by ℎ(𝑡) = acos (𝜋
8𝑡) for
the interval 0 ≤ 𝑡 ≤ 32. Find 𝑎
c. Find when the seat is 30m above the ground for the third time

14. Let a, b, c and d be integers such that a < b, b < c and c = d.
The mode of these four numbers is 11. The range of these four numbers is 8. The mean of these four numbers is 8.
Calculate the value of each of the integers a, b, c, d.
15. A fisherman catches 200 fish to sell. He measures the lengths, l cm of these fish, and the results are shown in the frequency table below.
Length l cm 0 ≤ l < 10 10 ≤ l < 20 20 ≤ l < 30 30 ≤ l < 40 40 ≤ l < 60 60 ≤ l < 75 75 ≤ l < 100
Frequency 30 40 50 30 33 11 6
A cumulative frequency diagram is given below for the lengths of the fish.
Use the graph to answer the following.
i. Estimate the interquartile range. ii. Given that 40 % of the fish have a length more than k cm, find the value of
k.

16. Several candy bars were purchased and the following table shows the weight and the cost of each bar.
Yummy Chox Marz Twin Chunx Lite BigC Bite
Weight (g) 60 85 80 65 95 50 100 45
Cost (Euros) 1.10 1.50 1.40 1.20 1.80 1.00 1.70 0.90
a. Given that sx = 19.2, sy = 0.307 and sxy = 5.81, find the correlation coefficient, r,
giving your answer correct to 3 decimal places.
b. Describe the correlation between the weight of a candy bar and its cost.
c. Calculate the equation of the regression line for y on x.
d. Use your equation to estimate the cost of a candy bar weighing 109 g.
17. A supermarket records the amount of money d spent by customers in their store during a busy period. The results are as follows:
Money in $ (d) 0–20 20–40 40–60 60–80 80–100 100–120 120–140
Number of customers (n) 24 16 22 40 18 10 4
Find an estimate for the mean amount of money spent by the customers, giving your answer to the nearest dollar ($).
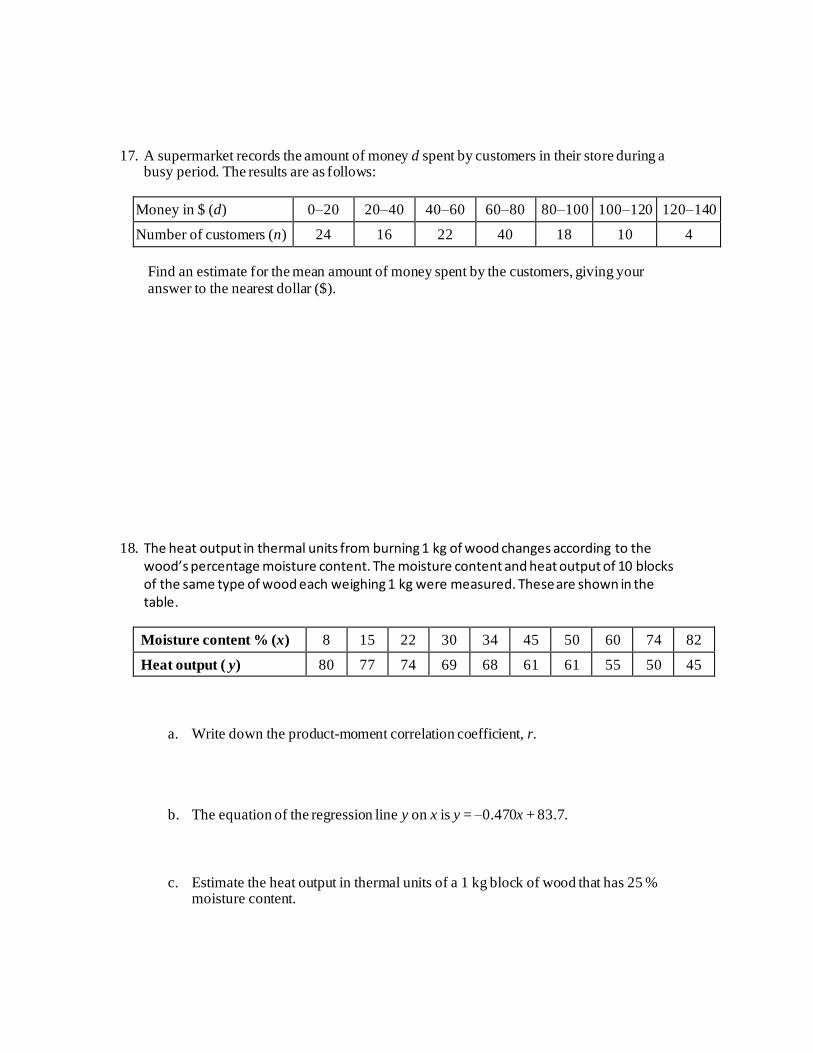
18. The heat output in thermal units from burning 1 kg of wood changes according to the wood’s percentage moisture content. The moisture content and heat output of 10 blocks of the same type of wood each weighing 1 kg were measured. These are shown in the table.
Moisture content % (x) 8 15 22 30 34 45 50 60 74 82
Heat output ( y) 80 77 74 69 68 61 61 55 50 45
a. Write down the product-moment correlation coefficient, r.
b. The equation of the regression line y on x is y = –0.470x + 83.7.
c. Estimate the heat output in thermal units of a 1 kg block of wood that has 25 % moisture content.

19. Given the following frequency distribution
Number (x) 1 2 3 4 5 6
Frequency (f ) 5 9 16 18 20 7
a. the median b. the mean.
20. Three positive integers a, b, and c, where a < b < c, are such that their median is 11, their mean is 9 and their range is 10. Find the value of a.

21. A student measured the diameters of 80 snail shells. His results are shown in the following
cumulative frequency graph. The lower quartile (LQ) is 14 mm and is marked clearly on the
graph.
On the graph, mark clearly in the same way and write down the value of
a. the median
b. the upper quartile
c. Write down the interquartile range
90
80
70
60
50
40
30
20
10
0
Cu
mu
lati
ve
freq
uen
cy
0 5 10 15LQ = 14
20 25 30 35 40 45
Diameter (mm)

22. A random variable X is distributed normally with mean 450. It is known that
.
a. Represent all this information on the following diagram.
b. Given that the standard deviation is 20, find a . Give your answer correct to the
nearest whole number
23. The heights of a group of seven-year-old children are normally distributed with mean
and standard deviation . A child is chosen at random from the group.
a. Find the probability that this child is taller than .
b. The heights of a group of seven-year-old children are normally distributed with mean
and standard deviation . A child is chosen at random from the group.
The probability that this child is shorter than is . Find the value of k .

24. The random variable is normally distributed with mean and standard deviation .
a. Find .
b. Given that , find the value of .