instream flows in the spokane river - idaho … river upstream from sullivan rd. bridge . 8/31/2009...
TRANSCRIPT
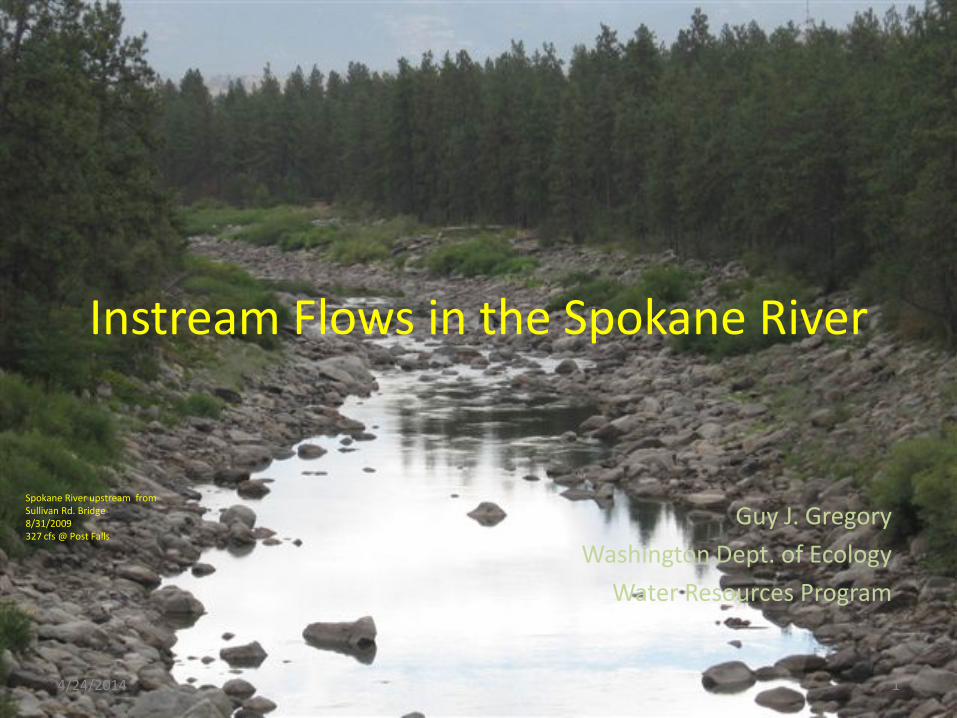
Spokane River upstream from Sullivan Rd. Bridge 8/31/2009 327 cfs @ Post Falls
Instream Flows in the Spokane River
Guy J. Gregory Washington Dept. of Ecology
Water Resources Program
4/24/2014 1

Purpose of Rule
4/24/2014 2
•Establish instream flow levels necessary to protect wildlife, fish, scenic, aesthetic, recreation, water quality and other environmental values, navigational values, and stock watering requirements;
• Meet water resource management objectives of the Spokane area watershed plans adopted under RCW 90.82;
• To protect existing water rights; and
• Establish and protect Washington State interests in the water resources of the Spokane River.

Why now?
• We’ve got the science now. – WRIA process – Avista 401 process – SVRPA study, etc.
• We’ve got the people now. – Most WRIA participants and informed people are still
here – Rule development staff within Ecology are here and
experienced – 10 years of outreach = an informed public
• We’ve got the authority now.
4/24/2014 3
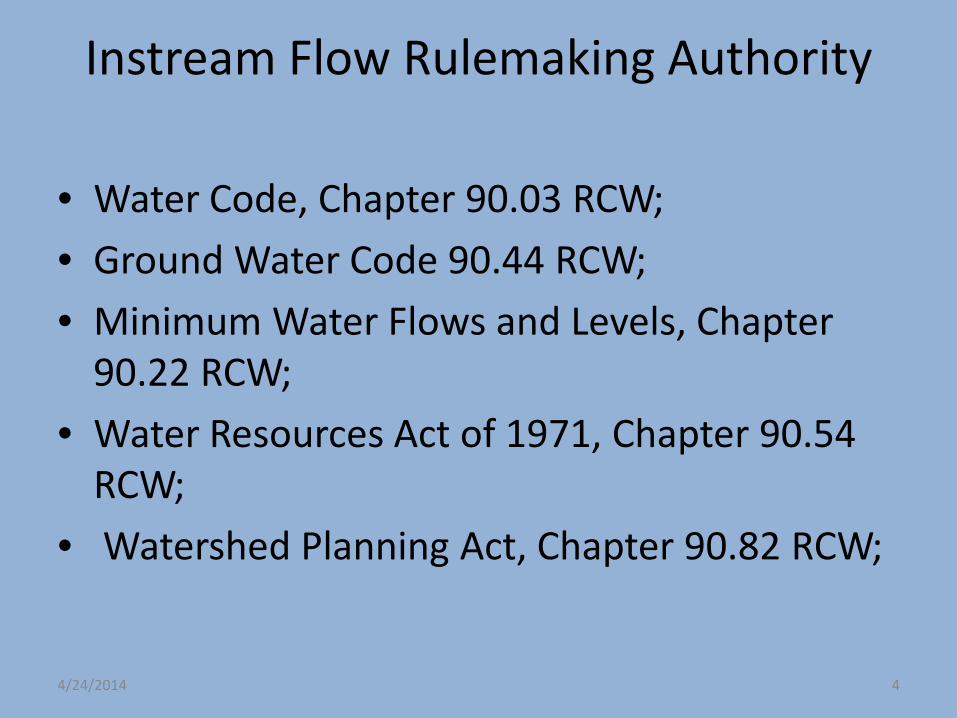
Instream Flow Rulemaking Authority
• Water Code, Chapter 90.03 RCW; • Ground Water Code 90.44 RCW; • Minimum Water Flows and Levels, Chapter
90.22 RCW; • Water Resources Act of 1971, Chapter 90.54
RCW; • Watershed Planning Act, Chapter 90.82 RCW;
4/24/2014 4

What setting an instream flow does and does not do:
• Does: – Establishes a “water right” for instream values. Rule = an appropriation of
water with priority date. – Newer rights are subject to the instream flows.
• Does not:
– Put water in streams. Setting flow ≠ achieving flow For example:
– Dry year: senior rights get water, instream flows are not met. Rights junior
to the instream flow are interrupted.
– Wet year: senior rights get water and the instream flow is attained.
4/24/2014 5

Applicability
4/24/2014 6

Rule Summary: Regulatory flows in Washington
4/24/2014 7
Date FERC License Flow at Spokane Gage
Proposed Instream Flow at Spokane Gage
Proposed Instream Flow at Barker Gage
October 1-March 31
1100 cfs 1700 cfs
April 1-June 15 TBD 6500 cfs
June 16-September 30
850 cfs 850 cfs 500 cfs

4/24/2014 8
0
2000
4000
6000
8000
10000
12000
14000
16000
O N D J F M A M J J A S
Proposed flows vs. 50% exceedance flows @ Spokane Gage
Proposed Instream Flows at Spokane gage
Proposed Instream Flows at Barker gage
Median daily flow (50% exceedance value), at Spokane 1986-2013

4/24/2014 9
0
1000
2000
3000
4000
5000
6000
7000
O N D J F M A M J J A S
Disc
harg
e (c
fs)
Spokane River Regulatory Flows
Proposed Instream Flows at Spokane gage
Proposed Instream Flows at Barker gage
IWRB License 95-08780 Spokane Instream Flows-Post Falls gage
FERC License Flows At Spokane gage

Timing and Process
– First notice: CR-101 – Filed January 21, 2014 – Draft Proposed Rule Language to Interested
Persons: April 17, 2014 – Workshop on Draft: May 14, 2014: Centerplace,
4-7 PM: Public input through May – Formal public process CR-102 begins late
summer 2014 – Public Hearing – Fall 2014 – Rule Adoption- Early 2015
4/24/2014 10

More information
• Ann Wessel – Rule writer Ecology-WRP 1440 10th St, Ste 102 Bellingham, WA 360-715-5215 [email protected] FAX: 360-715-5225
• Rusty Post – Watershed lead Ecology-SEAP ERO 4601 N Monroe Spokane, WA 509-329-3579 [email protected] FAX: 509-329-3529
4/24/2014 11
•Search Ecology webpage for Spokane River Rule •http://www.ecy.wa.gov/programs/wr/rules/557-ov.html •Sign up for listserv •Phone or talk to any of us

4/24/2014 12
Harvard Rd. Downstream 4/21/2006 19,200 cfs @ Post Falls
Thank you! Guy Gregory WDOE Eastern Region 509-939-1052 [email protected]

The following slides were not part of the formal presentation but were available as illustrations to help answer questions.

4/24/2014 14
200
400
600
800
1000
1200
1400
1600
1800
2000
2200
2400
2600
2800
1890 1900 1910 1920 1930 1940 1950 1960 1970 1980 1990 2000 2010
Dis
char
ge in
cfs
Spokane R at Spokane 7-Day Low Flow
June 1 thru Oct 31
Post Falls Dam, 1906
Lake CdA Summer Elev 2126.5';Irrigation CanalRamp-up in use Lake CdA
Summer Elev 2128' since 1941
Irrigation Canal discontinued operation in 1968

2005, -86-200
-100
0
100
200
300
400
500
600
700
800
1960 1970 1980 1990 2000 2010
Cub
ic F
eet p
er S
econ
dSpokane River September Differences
in Monthly Average Flows
At Spokane minus Post Falls September Monthly Average Flows
Irrigation Canal stopped in 1967
SVRP Aquifer's Contribution to the Flow in the Spokane River
4/24/2014 15

65%
70%
75%
80%
85%
90%
95%
100%
105%
0 200 400 600 800 1000 1200 1400 1600 1800 2000
cfs
Lower Spokane River Instream Flow DataCombined Percentages based on 'at Spokane' Flow
Weighted Proportionally to Reach Length(20% for 'at Spokane', 80% for Gun Club)
Rainbow Trout juv/ad Whitefish adult % of peak for combined RB juv/ad and WF ad
Flows from Gun Club data shifted 200 cfs
Four campaigns of fish science investigations 2000-2011 Result: June 16 -September 30 minimum flows to protect fish= 850 cfs.
4/24/2014 16
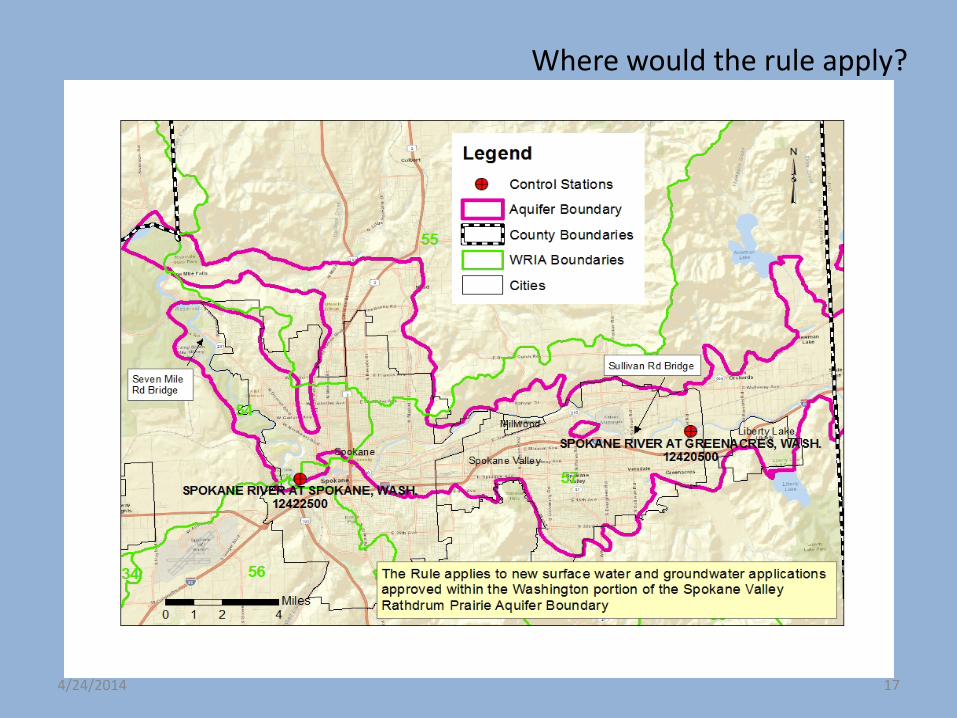
Where would the rule apply?
4/24/2014 17

How does this affect existing rights, and what about permit exempt wells?
4/24/2014 18

State Caucus Recommended Minimum Instream Flows
at the Spokane Gage
• October 1-March 31 1,700 cfs • April 1-June 15 6,500 cfs • June 16-September 30 850 cfs
4/24/2014 19


How do proposed flows relate to river flow now?
4/24/2014 21
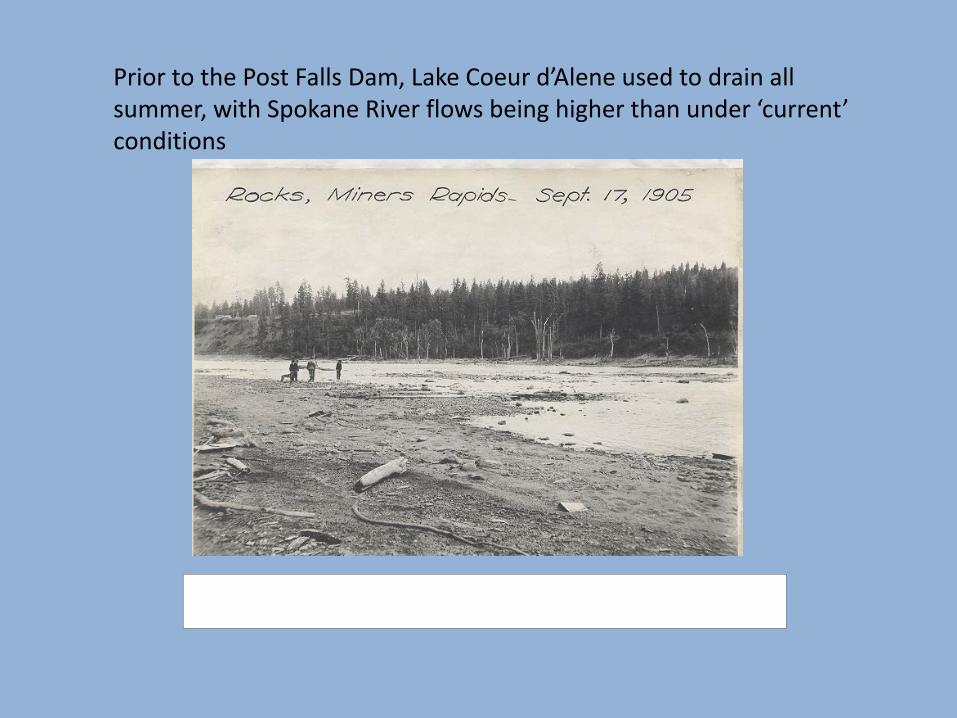
Prior to the Post Falls Dam, Lake Coeur d’Alene used to drain all summer, with Spokane River flows being higher than under ‘current’ conditions

0
5,000
10,000
15,000
20,000
25,000
30,000
35,000
10/6 11/5 12/5 1/4 2/3 3/5 4/4 5/4 6/3 7/3 8/2 9/1 10/1
Disc
harg
e in
cfs
Spokane R at Spokane Exceedance Curves 1891- 1906
90% 50% 10% Instream Flow

0
5,000
10,000
15,000
20,000
25,000
30,000
35,000
10/6 11/5 12/5 1/4 2/3 3/5 4/4 5/4 6/3 7/3 8/2 9/1 10/1
Dis
char
ge in
cfs
Spokane R at Spokane Exceedance Curves 1986 - 2008
90% 50% 10% Instream Flow

Post Falls Dam changed the seasonal hydrograph for both Lake Coeur d’Alene and the Spokane River

4/24/2014 26

y = 1.0033ln(x) + 2.5515 R² = 0.44
0
2
4
6
8
10
12
14
16
18
10 100 1000 10000 100000
Diss
olve
d O
xyge
n (m
g/l)
River Flow (cfs)
Dissolved Oxygen and River Flow: Stateline Ecology data:1959-2009
Oxygen (mg/l)
Log. (Oxygen (mg/l))
4/24/2014 27

y = 1.098ln(x) + 2.1917 R² = 0.3928
0
2
4
6
8
10
12
14
16
18
10 100 1000 10000 100000
Diss
olve
d O
xyge
n (m
g/l)
River Flow (CFS)
Dissolved Oxygen and River Flow-Riverside State Park Ecology data: 2003-2009
OXYGEN (mg/l)
Log. (OXYGEN (mg/l))
4/24/2014 28