institutional equity research mahanagar gas...
TRANSCRIPT

INSTITUTIONAL EQUITY RESEARCH
Page | 1 | PHILLIPCAPITAL INDIA RESEARCH
Mahanagar Gas Ltd
Attractive valuation, volume growth, the key driver INDIA | OIL & GAS | IPO Note
16 June 2016
MGL is the sole city gas distribution (CGD) entity in Greater Mumbai, Thane, Navi Mumbai, and Raigad. The Mumbai Metropolitan Region is a dense urban‐industrial cluster with a population of ~21mn, vehicle universe of ~2mn, and many commercial and industrial establishments. We have a positive view on the CGD sector and recommend investors SUBSCRIBE this issue. Investment case: (1) CGD is a stable monopolistic utility business with strong entry barriers and first‐mover advantage , (2) due to its clean and economic nature, CNG and PNG are widely promoted by the Government/Courts/policy makers in the form of necessary availability of cheap domestic gas, low taxation, compulsory conversions and expansion push, (3) with oil prices recovering towards US$ 50/bbl, economics of gas‐based fuels have improved considerably, which would lead to more substitution and higher volumes, (4) MGL is expanding into contiguous areas like Raigad which would provide significant longer‐term potential, (5) valuation at 11‐12x FY18 PE is attractive on near 20% RoE/RoCE, debt free balance sheet, healthy cash flows and peer group trading at 15x+.
Sole CGD operator in Mumbai area with minimal competitive threats MGL is the sole CGD operator in Mumbai area comprising of Greater Mumbai (GA1), Thane and Navi Mumbai (GA2), and Raigad district (GA3). MMR holds ~21mn people, ~3mn households, a vehicle universe of ~1.8mn, and many commercial and industrial enterprises. The Mumbai CGD market is expected to see 7‐8% CAGR in volumes for the next 2‐3 years. MGL aims to clock similar volume growth (in line with its historical CAGR). Due to strong entry barriers such as limited land availability, an already developed pipeline network, the commodity nature of natural gas, and inelastic supplier preference among PNG consumers, MGL has not faced any competition even after expiry of marketing exclusivity for its existing areas way back in January 2012. Its network exclusivity (ending in CY20/30 for GA1/GA2 as per regulations) could be extended by another 10 years.
CNG‐ and domestic PNG‐driven utility model, raw material gas costs to remain low About 86% of MGL’s volumes are CNG and domestic PNG – a B2C utility business with a stable demand outlook. The central and state governments promote city‐gas usage by keeping taxation much lower than alternate fuels and by providing cheap domestic gas to cater to 100% of requirements. In Mumbai, CNG is 51%/32% cheaper than petrol/diesel and the economics would improve with (1) oil prices near US$ 50/bbl and (2) domestic gas prices falling below US$ 3/mmbtu in 2HFY17. With the central government gradually phasing out LPG subsidy among the affluent classes, substitution to PNG would increase. Penetration of CNG/domestic PNG is still low at ~25%/~30% of the total population. As LNG economics have improved versus furnace oil, industrial PNG volumes are also likely to pick up. With raw‐material gas prices likely to remain low, MGL has significant headroom to retain/expand gross margins to recoup any opex escalation, thereby maintaining steady EBITDA margins.
Longer term growth opportunities in Raigad; focus on new areas under PNGRB bidding MGL had won Raigad district under fourth round of PNGRB bidding in CY15 and currently work is ongoing with an aim to start operations by the end of FY17. It plans to invest Rs 500mn annually over the next 5‐6 years, which, as per our channel checks, could earn it a volume of 0.2‐0.3mmscmd. While Raigad has significant longer‐term potential from the ‘smart city’ policy, planned townships, international airport, and the Trans‐Harbour Link, in the near term, MGL has identified 6‐7 industrial clusters accessible to the gas grid that can be tapped quickly through a concentrated network. It is also aggressive in its PNGRB bidding and aims to secure new GAs as part of its expansion drive. Capex guidance for existing areas and Raigad is Rs 2.5bn annually. The company intends to open 15‐20 CNG stations in FY17 and expand its network by 600‐700kms.
SUBSCRIBE COMPANY DATA
ISSUE OPENS 21‐Jun‐16
ISSUE CLOSES 23‐Jun‐16
PRE‐ISSUE EQUITY SHARES 99 mn
PRICE BAND Rs 380 to Rs 421
NO OF SHARES TO BE ISSUED upto 24.7 mn
P/E @ FY18E EARNINGS UPPER
PRICE BAND
12x
ISSUE SIZE Rs 9.4‐10.4bn
PROPOSED MKT CAP.
(AT UPPER BAND)
Rs 41.6bn
Pre‐IPO SHARE HOLDING PATTERN, %
Promoter group
GAIL (India) Ltd 45
BG Asia Pacific Holding Pte Ltd 45
Total Promoter group 90
Govt. Of Maharashtra 10
Total existing holders 100 KEY FINANCIALS Rs mn FY16 FY17E FY18ENet sales 20,653 19,840 21,475EBITDA 5,130 5,370 5,612Net profit 3,087 3,307 3,455EPS, Rs 34.6 33.5 35.0PER, x @421 12.2 12.6 12.0PER, x @380 11.0 11.4 10.9ROCE, % 21.9 20.3 18.8ROE, % 20.2 19.1 17.8
Source: PhillipCapital India Research Est.
Sabri Hazarika (+ 9122 6667 9756) [email protected]
MAHANAGAR GAS LTD IPO NOTE
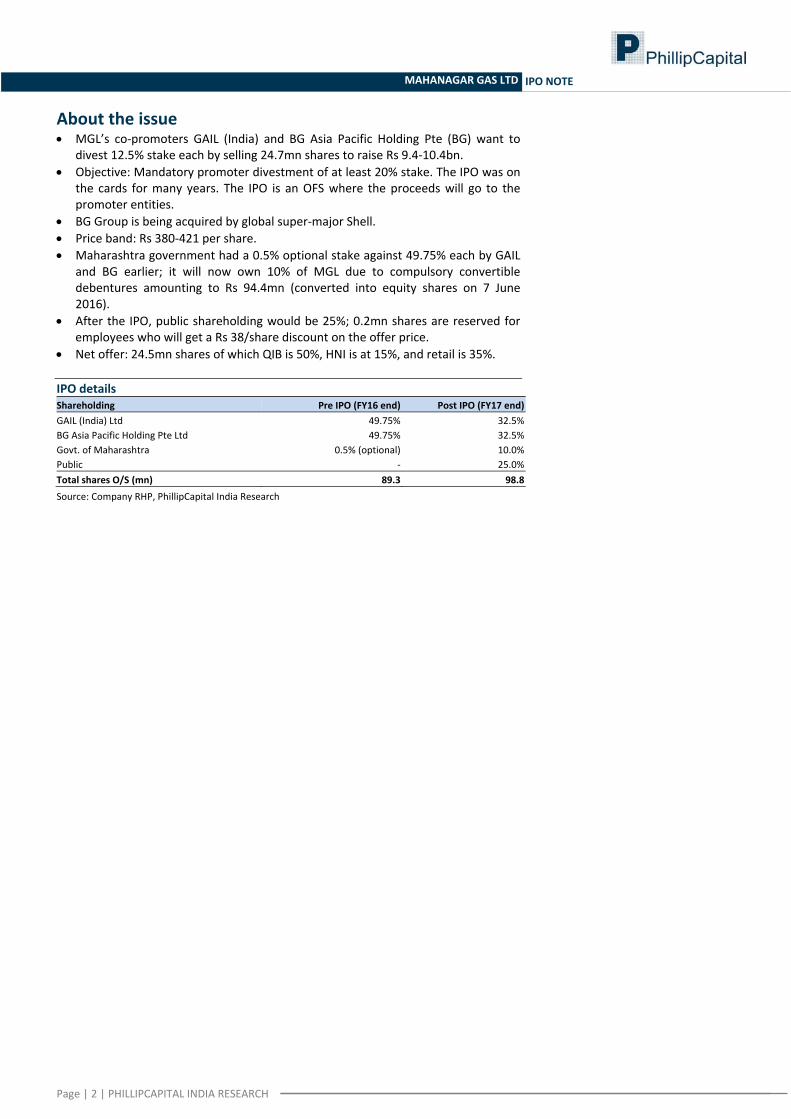
About the issue • MGL’s co‐promoters GAIL (India) and BG Asia Pacific Holding Pte (BG) want to
divest 12.5% stake each by selling 24.7mn shares to raise Rs 9.4‐10.4bn. • Objective: Mandatory promoter divestment of at least 20% stake. The IPO was on
the cards for many years. The IPO is an OFS where the proceeds will go to the promoter entities.
• BG Group is being acquired by global super‐major Shell. • Price band: Rs 380‐421 per share. • Maharashtra government had a 0.5% optional stake against 49.75% each by GAIL
and BG earlier; it will now own 10% of MGL due to compulsory convertible debentures amounting to Rs 94.4mn (converted into equity shares on 7 June 2016).
• After the IPO, public shareholding would be 25%; 0.2mn shares are reserved for employees who will get a Rs 38/share discount on the offer price.
• Net offer: 24.5mn shares of which QIB is 50%, HNI is at 15%, and retail is 35%.
IPO details Shareholding Pre IPO (FY16 end) Post IPO (FY17 end)GAIL (India) Ltd 49.75% 32.5%BG Asia Pacific Holding Pte Ltd 49.75% 32.5%Govt. of Maharashtra 0.5% (optional) 10.0%Public ‐ 25.0%Total shares O/S (mn) 89.3 98.8
Source: Company RHP, PhillipCapital India Research
Page | 2 | PHILLIPCAPITAL INDIA RESEARCH
MAHANAGAR GAS LTD IPO NOTE
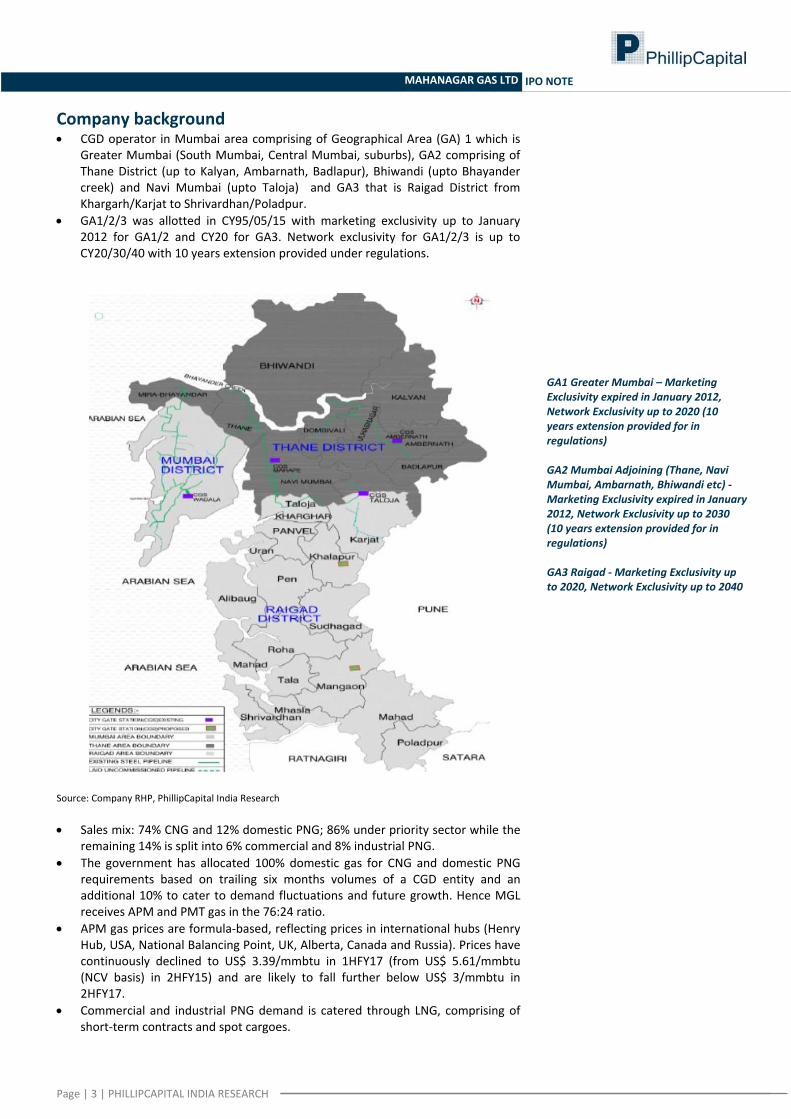
Company background • CGD operator in Mumbai area comprising of Geographical Area (GA) 1 which is
Greater Mumbai (South Mumbai, Central Mumbai, suburbs), GA2 comprising of Thane District (up to Kalyan, Ambarnath, Badlapur), Bhiwandi (upto Bhayander creek) and Navi Mumbai (upto Taloja) and GA3 that is Raigad District from Khargarh/Karjat to Shrivardhan/Poladpur.
• GA1/2/3 was allotted in CY95/05/15 with marketing exclusivity up to January 2012 for GA1/2 and CY20 for GA3. Network exclusivity for GA1/2/3 is up to CY20/30/40 with 10 years extension provided under regulations.
GA1 Greater Mumbai – Marketing Exclusivity expired in January 2012, Network Exclusivity up to 2020 (10 years extension provided for in regulations) GA2 Mumbai Adjoining (Thane, Navi Mumbai, Ambarnath, Bhiwandi etc) ‐ Marketing Exclusivity expired in January 2012, Network Exclusivity up to 2030 (10 years extension provided for in regulations) GA3 Raigad ‐ Marketing Exclusivity up to 2020, Network Exclusivity up to 2040
Source: Company RHP, PhillipCapital India Research • Sales mix: 74% CNG and 12% domestic PNG; 86% under priority sector while the
remaining 14% is split into 6% commercial and 8% industrial PNG. • The government has allocated 100% domestic gas for CNG and domestic PNG
requirements based on trailing six months volumes of a CGD entity and an additional 10% to cater to demand fluctuations and future growth. Hence MGL receives APM and PMT gas in the 76:24 ratio.
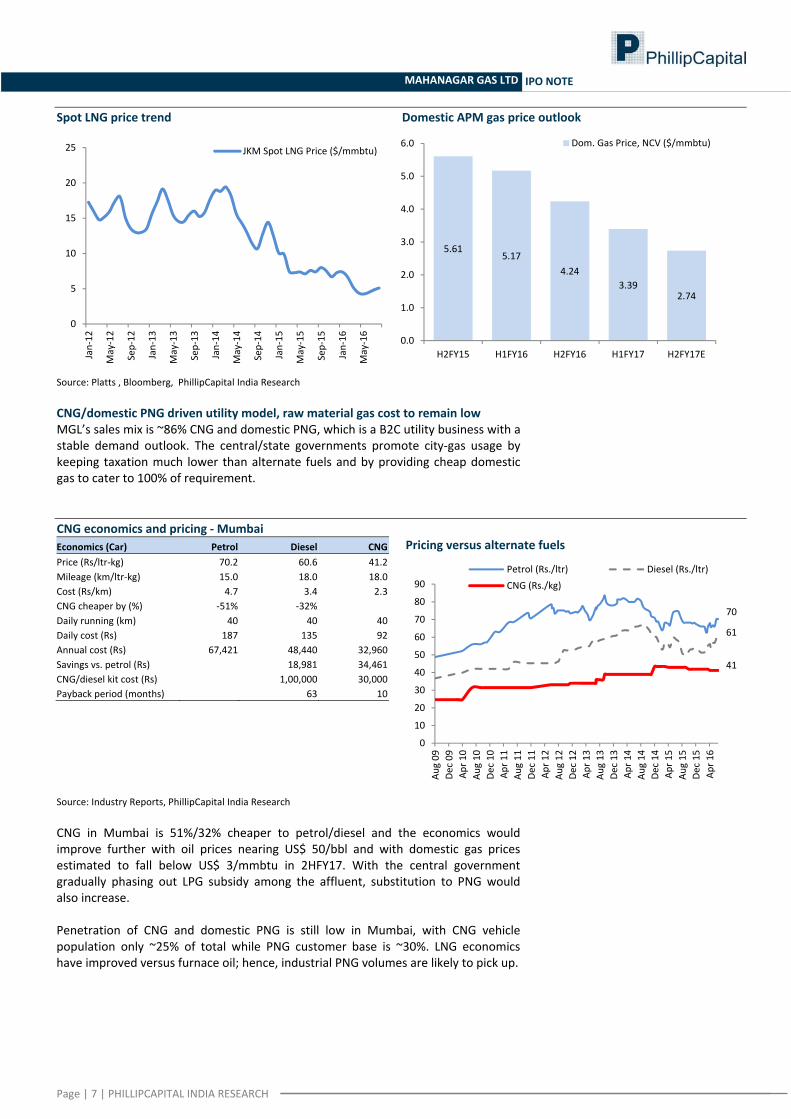
• APM gas prices are formula‐based, reflecting prices in international hubs (Henry Hub, USA, National Balancing Point, UK, Alberta, Canada and Russia). Prices have continuously declined to US$ 3.39/mmbtu in 1HFY17 (from US$ 5.61/mmbtu (NCV basis) in 2HFY15) and are likely to fall further below US$ 3/mmbtu in 2HFY17.
• Commercial and industrial PNG demand is catered through LNG, comprising of short‐term contracts and spot cargoes.
Page | 3 | PHILLIPCAPITAL INDIA RESEARCH

MAHANAGAR GAS LTD IPO NOTE
• MGL has term deals with BPCL, BG and Hazira LNG and purchases spot cargoes from GAIL, GSPC and HPCL. Its term contracts are short/medium and hence do not have long‐term floor pricing risks.
MGL’s sales mix is 86% under CNG/dom. PNG fully met by cheaper domestic gas
CNG, 1.80
Domestic PNG, 0.28
Commercial PNG, 0.15
Industrial PNG, 0.20
Gas Sales Mix (mmscmd)
APM, 1.61
PMT, 0.52
Non APM, 0.07
Mid/Short Term LNG,
0.15
Spot LNG, 0.14
Gas Sourcing Mix (mmscmd)
Source: Company RHP, PhillipCapital India Research • Infrastructure base: 188 CNG stations, with a compression capacity of
3.1mn.kg/day. CNG vehicle base of 0.47mn against a target market of 1.8mn vehicles. Has 0.865mn domestic PNG connections against 2.7mn total households in the Mumbai area. Has 2,866/60 commercial/industrial PNG customers with a steel/MDPE network of 415/4,646kms and 4 city gate stations.
• Employees: 499. Important parameters
FY11 FY12 FY13 FY14 FY15 FY16CNG Stations 144 150 160 169 180 188Compression Capacity (kg/d) 20,02,200 20,91,600 23,15,100 na 25,00,000 31,40,000 CNG Vehicles 2,14,036 2,39,915 2,90,616 3,59,100 4,21,300 4,70,500 Domestic PNG Connections 5,08,687 5,58,412 6,41,482 7,08,600 8,04,000 8,65,200 Commercial PNG Connections 1,240 1,540 1,940 2,289 2,600 2,866 Industrial PNG Customers 53 55 60 Steel Pipelines (kms) 294 329 351 na 407 415 MDPE Pipelines (km) 2,989 3,289 3,633 na 4,057 4,646
Source: Company RHP, PhillipCapital India Research
COCO, 13
OMCs, 136
DODO, 17
Bus Depot, 22
Types of CNG Stations ‐ FY16CNG outlet types ‐ FY13 Mother 18 Online 129 Daughter 13 Total 160
CNG vehicle breakup CY13‐14 Buses 3,400 LCVs etc 5,000 Autos 1,50,000 Taxis 57,000 Cars 97,000 Total 3,12,400
Source: Company RHP, PhillipCapital India Research
Page | 4 | PHILLIPCAPITAL INDIA RESEARCH
MAHANAGAR GAS LTD IPO NOTE
Board of Directors Dr. Ashutosh Karnatak, Non‐Executive Chairman (Nominee of GAIL)
Over 30 years of experience, Presently holds the position of Director (Projects) with GAIL, D. Phil, University of Petroleum & Energy Studies, Dehradun, M. Tech (Energy Studies), IIT Delhi
Mr. Rajeev Kumar Mathur, Managing Director (Nominee of GAIL)
Over 28 years of experience, Served 4 years as an Executive Director (Marketing) at GAIL, MBA from Jodhpur University and Bachelor’s degree in Mechanical Engineering from REC, Durgapur
Mr. Apurva Chandra, Non‐executive Director (Nominee of Government of Maharashtra)
Over 26 years of experience, including 7 years at MoPNG and belonged to the 1988 batch of IAS (Maharashtra Cadre), Also served on the Boards of GAIL and Petronet LNG, Master’s degree in Structural Engineering and Bachelor’s degree in Civil Engineering from IIT, Delhi
Ms. Susmita Sengupta, Technical Director (Nominee of BGAPH)
On the Board since February 2014, Has worked with DCP Midstream in Denver, Colorado and in Midland, Texas, Master’s degree in Chemical and Petroleum Engineering from the University of Calgary and Bachelor’s degree in Applied Sciences (Chemical Engineering) from the University of Waterloo
Mr. Akhil Mehrotra, Non‐Executive Director (Nominee of BGAPH)
On the Board since March 2016, Over 24 years of experience in the industry and is presently Director – Downstream business at BG India, Previously associated with the Reliance Group of Companies
Mr. Jainendar Kumar Jain, Independent Director
On the Board since January 2008, Served as Director (Finance) at GAIL from 1996 to 2005, Chartered Accountant and fellow member of ICAI and holds a Bachelor’s degree in Commerce from Vikram University, Ujjain
Mr. Arun Balakrishnan, Independent Director Over 35 years of experience and previously served as Chairman and Managing Director of HPCL, PGDM from IIM, Bangalore and Bachelor’s degree in Chemical Engineering from the University of Calicut
Dr. Basudeb Sen, Independent Director On the Board since March 2006, Previously served as Chairman and MD of the Industrial Investment Bank and Executive Director of Unit Trust of India, Doctorate from Indian Statistical Institute and Master’s degree in Economics from the University of Calcutta
Mr. Santosh Kumar, Independent Director On the board since July 2011 and served 3 years as Director (Projects) at GAIL, Previously held positions such as Chairman, Green Gas Ltd., Director on the Boards of Maharashtra Natural Gas and Central UP Gas Ltd., and Advisor with GSPL for 2009‐10, Bachelor’s degree in Electronic Engineering from the University of Allahabad
Mr. Raj Kishore Tewari, Independent Director
On the board since March 2015, Previously served as the Chairman of the Central Board of Direct Taxes in the Ministry of Finance, Govt. of India, M.Sc. (Fiscal Studies) from the University of Bath, UK, M.Sc. (Physics) from the University of Lucknow and Bachelor’s degree in Law from the University of Mumbai
Source: Company RHP Senior Management excluding Directors Mr. Sunil M Ranade, Chief Financial Officer Over 19 years of experience at MGL, Prior experience at Wander Ltd., Herdillia Polymers,
Goodlass Nerolac and Ashok Organic Industries Mr. Rajesh P Wagle, Head—Commercial Over 13 years of experience at MGL, Prior experience at GAIL, Quantum Information Systems
Limited and Enron India Private Limited Mr. Srinivasan Murali, Head‐ Operations and Maintenance Over 13 years of experience at MGL, Prior experience at Bilt Chemicals, Cabot India, Cement
Corporation of India and Indian Aluminium Company Mr. Shashwat Agarwal, Senior Vice President Functional head of the construction department, Prior experience at Engineers India Limited
and GSPC Gas Company Limited Mr. Alok Mishra, Company Secretary and Compliance Officer 4 years of experience at MGL; over 15 years of experience in legal and corporate secretarial
functions, Prior experience at ISS Integrated Facility Services, Go Airlines and Lafarge India
Source: Company RHP
Page | 5 | PHILLIPCAPITAL INDIA RESEARCH
MAHANAGAR GAS LTD IPO NOTE
Investment rationale
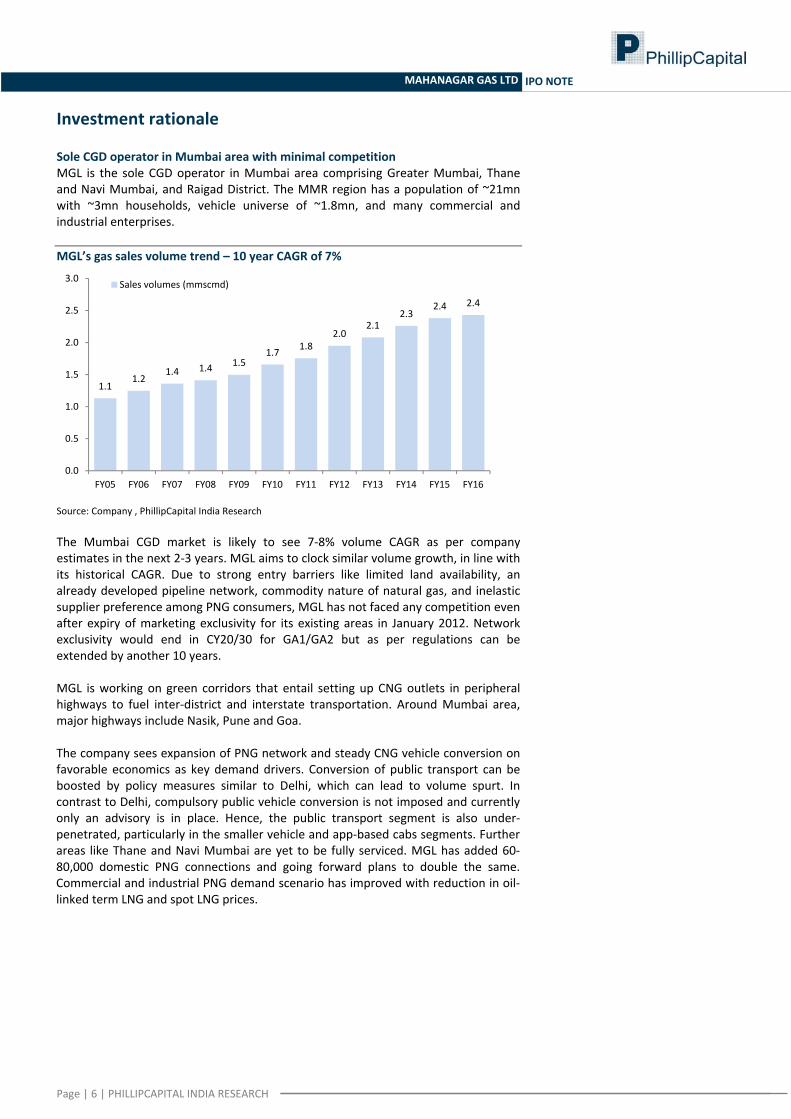
Sole CGD operator in Mumbai area with minimal competition MGL is the sole CGD operator in Mumbai area comprising Greater Mumbai, Thane and Navi Mumbai, and Raigad District. The MMR region has a population of ~21mn with ~3mn households, vehicle universe of ~1.8mn, and many commercial and industrial enterprises. MGL’s gas sales volume trend – 10 year CAGR of 7%
1.11.2
1.4 1.4 1.51.7 1.8
2.02.1
2.32.4 2.4
0.0
0.5
1.0
1.5
2.0
2.5
3.0
FY05 FY06 FY07 FY08 FY09 FY10 FY11 FY12 FY13 FY14 FY15 FY16
Sales volumes (mmscmd)
Source: Company , PhillipCapital India Research The Mumbai CGD market is likely to see 7‐8% volume CAGR as per company estimates in the next 2‐3 years. MGL aims to clock similar volume growth, in line with its historical CAGR. Due to strong entry barriers like limited land availability, an already developed pipeline network, commodity nature of natural gas, and inelastic supplier preference among PNG consumers, MGL has not faced any competition even after expiry of marketing exclusivity for its existing areas in January 2012. Network exclusivity would end in CY20/30 for GA1/GA2 but as per regulations can be extended by another 10 years. MGL is working on green corridors that entail setting up CNG outlets in peripheral highways to fuel inter‐district and interstate transportation. Around Mumbai area, major highways include Nasik, Pune and Goa. The company sees expansion of PNG network and steady CNG vehicle conversion on favorable economics as key demand drivers. Conversion of public transport can be boosted by policy measures similar to Delhi, which can lead to volume spurt. In contrast to Delhi, compulsory public vehicle conversion is not imposed and currently only an advisory is in place. Hence, the public transport segment is also under‐penetrated, particularly in the smaller vehicle and app‐based cabs segments. Further areas like Thane and Navi Mumbai are yet to be fully serviced. MGL has added 60‐80,000 domestic PNG connections and going forward plans to double the same. Commercial and industrial PNG demand scenario has improved with reduction in oil‐linked term LNG and spot LNG prices.
Page | 6 | PHILLIPCAPITAL INDIA RESEARCH
MAHANAGAR GAS LTD IPO NOTE
Spot LNG price trend Domestic APM gas price outlook
0
5
10
15
20
25
Jan‐12
May‐12
Sep‐12
Jan‐13
May‐13
Sep‐13
Jan‐14
May‐14
Sep‐14
Jan‐15
May‐15
Sep‐15
Jan‐16
May‐16
JKM Spot LNG Price ($/mmbtu)
5.615.17
4.243.39
2.74
0.0
1.0
2.0
3.0
4.0
5.0
6.0
H2FY15 H1FY16 H2FY16 H1FY17 H2FY17E
Dom. Gas Price, NCV ($/mmbtu)
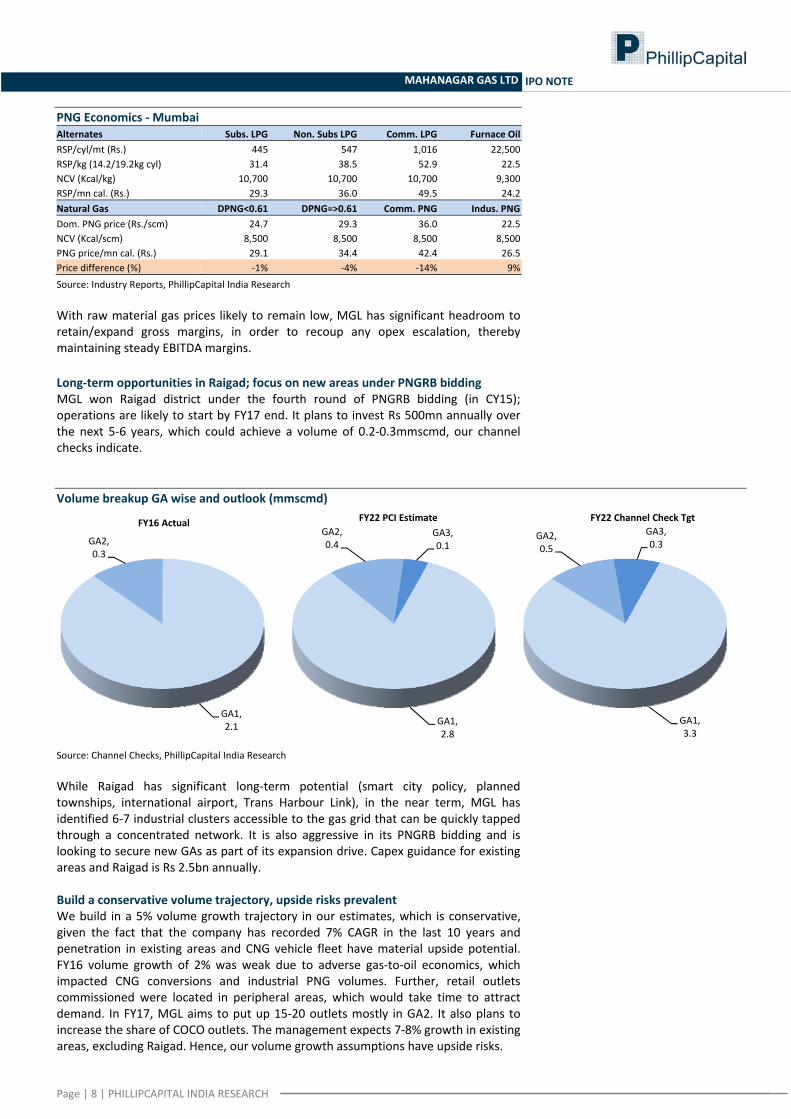
Source: Platts , Bloomberg, PhillipCapital India Research CNG/domestic PNG driven utility model, raw material gas cost to remain low MGL’s sales mix is ~86% CNG and domestic PNG, which is a B2C utility business with a stable demand outlook. The central/state governments promote city‐gas usage by keeping taxation much lower than alternate fuels and by providing cheap domestic gas to cater to 100% of requirement. CNG economics and pricing ‐ Mumbai Economics (Car) Petrol Diesel CNGPrice (Rs/ltr‐kg) 70.2 60.6 41.2 Mileage (km/ltr‐kg) 15.0 18.0 18.0 Cost (Rs/km) 4.7 3.4 2.3 CNG cheaper by (%) ‐51% ‐32% Daily running (km) 40 40 40 Daily cost (Rs) 187 135 92Annual cost (Rs) 67,421 48,440 32,960 Savings vs. petrol (Rs) 18,981 34,461 CNG/diesel kit cost (Rs) 1,00,000 30,000 Payback period (months) 63 10
Pricing versus alternate fuels
70
61
41
0
10
20
30
40
50
60
70
80
90
Aug 09
Dec 09
Apr 1
0Au
g 10
Dec 10
Apr 1
1Au
g 11
Dec 11
Apr 1
2Au
g 12
Dec 12
Apr 1
3Au
g 13
Dec 13
Apr 1
4Au
g 14
Dec 14
Apr 1
5Au
g 15
Dec 15
Apr 1
6
Petrol (Rs./ltr) Diesel (Rs./ltr)CNG (Rs./kg)
Source: Industry Reports, PhillipCapital India Research CNG in Mumbai is 51%/32% cheaper to petrol/diesel and the economics would improve further with oil prices nearing US$ 50/bbl and with domestic gas prices estimated to fall below US$ 3/mmbtu in 2HFY17. With the central government gradually phasing out LPG subsidy among the affluent, substitution to PNG would also increase. Penetration of CNG and domestic PNG is still low in Mumbai, with CNG vehicle population only ~25% of total while PNG customer base is ~30%. LNG economics have improved versus furnace oil; hence, industrial PNG volumes are likely to pick up.
Page | 7 | PHILLIPCAPITAL INDIA RESEARCH
MAHANAGAR GAS LTD IPO NOTE
PNG Economics ‐ Mumbai Alternates Subs. LPG Non. Subs LPG Comm. LPG Furnace OilRSP/cyl/mt (Rs.) 445 547 1,016 22,500 RSP/kg (14.2/19.2kg cyl) 31.4 38.5 52.9 22.5 NCV (Kcal/kg) 10,700 10,700 10,700 9,300 RSP/mn cal. (Rs.) 29.3 36.0 49.5 24.2 Natural Gas DPNG<0.61 DPNG=>0.61 Comm. PNG Indus. PNGDom. PNG price (Rs./scm) 24.7 29.3 36.0 22.5 NCV (Kcal/scm) 8,500 8,500 8,500 8,500 PNG price/mn cal. (Rs.) 29.1 34.4 42.4 26.5 Price difference (%) ‐1% ‐4% ‐14% 9%
Source: Industry Reports, PhillipCapital India Research With raw material gas prices likely to remain low, MGL has significant headroom to retain/expand gross margins, in order to recoup any opex escalation, thereby maintaining steady EBITDA margins.
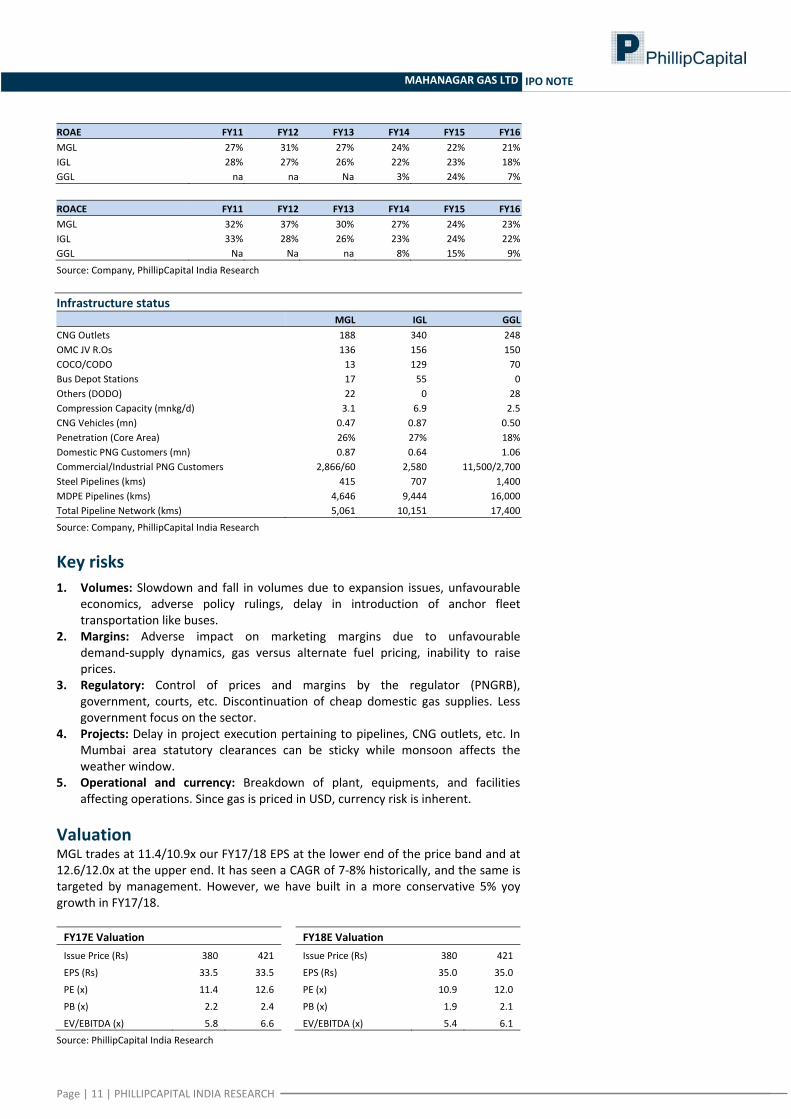
Long‐term opportunities in Raigad; focus on new areas under PNGRB bidding MGL won Raigad district under the fourth round of PNGRB bidding (in CY15); operations are likely to start by FY17 end. It plans to invest Rs 500mn annually over the next 5‐6 years, which could achieve a volume of 0.2‐0.3mmscmd, our channel checks indicate. Volume breakup GA wise and outlook (mmscmd)
GA1, 2.1
GA2, 0.3
FY16 Actual
GA1, 2.8
GA2, 0.4
GA3, 0.1
FY22 PCI Estimate
GA1, 3.3
GA2, 0.5
GA3, 0.3
FY22 Channel Check Tgt
Source: Channel Checks, PhillipCapital India Research While Raigad has significant long‐term potential (smart city policy, planned townships, international airport, Trans Harbour Link), in the near term, MGL has identified 6‐7 industrial clusters accessible to the gas grid that can be quickly tapped through a concentrated network. It is also aggressive in its PNGRB bidding and is looking to secure new GAs as part of its expansion drive. Capex guidance for existing areas and Raigad is Rs 2.5bn annually. Build a conservative volume trajectory, upside risks prevalent We build in a 5% volume growth trajectory in our estimates, which is conservative, given the fact that the company has recorded 7% CAGR in the last 10 years and penetration in existing areas and CNG vehicle fleet have material upside potential. FY16 volume growth of 2% was weak due to adverse gas‐to‐oil economics, which impacted CNG conversions and industrial PNG volumes. Further, retail outlets commissioned were located in peripheral areas, which would take time to attract demand. In FY17, MGL aims to put up 15‐20 outlets mostly in GA2. It also plans to increase the share of COCO outlets. The management expects 7‐8% growth in existing areas, excluding Raigad. Hence, our volume growth assumptions have upside risks.
Page | 8 | PHILLIPCAPITAL INDIA RESEARCH

MAHANAGAR GAS LTD IPO NOTE
MGL’s volume outlook
1.3 1.4 1.5 1.7 1.8 1.8 1.9 2.0
0.50.5
0.60.6
0.6 0.60.7
0.7
0.0
0.5
1.0
1.5
2.0
2.5
3.0
FY11 FY12 FY13 FY14 FY15 FY16 FY17E FY18E
mmscmd
CNG Sales PNG Sales
1.8 2.0 2.1 2.3 2.4 2.4 2.6 2.7
11%
6%
9%
5%
2%
5% 5%
0%
2%
4%
6%
8%
10%
12%
0.0
0.5
1.0
1.5
2.0
2.5
3.0
FY11 FY12 FY13 FY14 FY15 FY16 FY17E FY18E
mmscmd
Total Volumes YoY Growth
Source: Company RHP, PhillipCapital India Research With allocation of 100% domestic gas for CNG and domestic PNG, gas availability and affordability for CGD entities have improved significantly; earlier, expensive LNG used to eat into margins. The current formula for domestic/APM gas pricing has led to sharp reduction in gas prices from US$ 5.6/mmbtu in November 2014 to US$ 3.4/mmbtu currently. Going forward, prices would bottom out at under US$ 3/mmbtu during 2HFY17. MGL’s 86% priority sector volumes (CNG+dom. PNG) comprise of APM and PMT in the 76:24 ratio. PMT prices are fixed at US$ 5.7/mmbtu. Under a low raw material price scenario, MGL would have significant room to protect its margin right up to the EBITDA level. CGD companies have seen cost escalation resulting in higher unit opex, which gross margin expansion would help offset. MGL’s margin scenario
2.4 2.6 2.9 3.1 3.6 3.8 4.0 4.2
5.76.8 6.1 5.7 5.4 5.6 5.6 5.6
8.1
9.4 9.0 8.8 9.0 9.4 9.7 9.8
0.0
2.0
4.0
6.0
8.0
10.0
12.0
FY11 FY12 FY13 FY14 FY15 FY16 FY17E FY18E
Rs./scm
Opex Clean EBITDA Margin Gross Margin
Source: Company RHP, PhillipCapital India Research In the LNG mix, spot LNG prices have corrected significantly and currently hover at US$ 4‐5/mmbtu. MGL’s industrial PNG price is ~10% more expensive to comparable FO, but with oil strengthening, this can come at par going forward. Favorable commercial PNG economics can aid in margin expansion in this segment. With no regulatory control and favorable economics, we estimate MGL’s pricing power to remain strong resulting in stable and healthy margins. We build in a clean EBITDA/scm of Rs 5.6. Historically, in some instances, MGL’s margins have reached almost Rs 7 – but this was due to certain one‐offs like pipeline tariff reversal of Rs 400mn in FY12.
Page | 9 | PHILLIPCAPITAL INDIA RESEARCH

MAHANAGAR GAS LTD IPO NOTE
Capex, FCF and dividend outlook
2.1 2.2 2.11.7 1.9
2.22.5 2.5
0.7
1.7
2.32.1
2.3
2.0
1.5
2.1
0.0
0.5
1.0
1.5
2.0
2.5
3.0
FY11 FY12 FY13 FY14 FY15 FY16 FY17E FY18E
Rs.bn
Capex FCF
5.5 8.7 15.0 17.5 17.5 17.5 11.7 12.2
1.3%
2.1%
3.6%
4.2% 4.2% 4.2%
2.8% 2.9%
0%
1%
1%
2%
2%
3%
3%
4%
4%
5%
0
2
4
6
8
10
12
14
16
18
20
FY11 FY12 FY13 FY14 FY15 FY16 FY17E FY18E
Dividend Per Share (Rs.) Dividend Yield
Source: Company RHP, PhillipCapital India Research Comparative analysis (Indraprastha Gas & Gujarat Gas) CNG Volumes (mmscmd) FY11 FY12 FY13 FY14 FY15 FY16MGL 1.3 1.4 1.5 1.7 1.8 1.8Growth 9% 6% 9% 6% 2%IGL 2.2 2.6 2.8 2.8 2.9 3.1Growth 15% 7% 2% 4% 4%GGL 0.6 0.6 0.7 0.7 0.8 0.9Growth 10% 10% 10% 10% 10% PNG Volumes (mmscmd) FY11 FY12 FY13 FY14 FY15 FY16MGL 0.5 0.5 0.6 0.6 0.6 0.6Growth 18% 6% 7% 3% 2%IGL 0.5 0.8 0.9 1.0 0.9 0.9Growth 57% 18% 7% ‐7% 3%GGL 6.6 6.6 6.3 5.2 5.7 4.7Growth ‐1% ‐4% ‐17% 9% ‐18% Total Sales (mmscmd) FY11 FY12 FY13 FY14 FY15 FY16MGL 1.8 2.0 2.1 2.3 2.4 2.4Growth 11% 6% 9% 5% 2%IGL 2.7 3.3 3.7 3.8 3.8 4.0Growth 22% 10% 3% 1% 4%GGL 7.2 7.2 7.0 6.0 6.5 5.6Growth 0% ‐3% ‐14% 9% ‐14% Gross Margin (Rs./scm) FY11 FY12 FY13 FY14 FY15 FY16MGL 8.1 9.4 9.0 8.8 9.0 9.4IGL 7.6 8.0 8.7 9.2 9.5 9.5GGL 4.1 3.5 3.7 4.2 6.1 5.6 EBITDA Margin (Rs./scm) FY11 FY12 FY13 FY14 FY15 FY16MGL 5.7 7.0 6.4 5.9 5.6 5.8IGL 4.9 5.2 5.6 5.6 5.6 5.3GGL 2.4 2.3 2.3 2.3 4.4 3.4 PAT (Rs.bn) FY11 FY12 FY13 FY14 FY15 FY16MGL 2.3 3.1 3.0 3.0 3.0 3.1Growth 36% ‐3% 0% 1% 3%IGL 2.6 3.1 3.5 3.6 4.4 4.2Growth 18% 16% 2% 22% ‐3%GGL 4.2 3.7 3.2 0.3 4.4 1.5Growth ‐10% ‐14% ‐91% 1460% ‐66%
Page | 10 | PHILLIPCAPITAL INDIA RESEARCH
MAHANAGAR GAS LTD IPO NOTE
ROAE FY11 FY12 FY13 FY14 FY15 FY16MGL 27% 31% 27% 24% 22% 21%IGL 28% 27% 26% 22% 23% 18%GGL na na Na 3% 24% 7% ROACE FY11 FY12 FY13 FY14 FY15 FY16MGL 32% 37% 30% 27% 24% 23%IGL 33% 28% 26% 23% 24% 22%GGL Na Na na 8% 15% 9%
Source: Company, PhillipCapital India Research Infrastructure status MGL IGL GGLCNG Outlets 188 340 248OMC JV R.Os 136 156 150COCO/CODO 13 129 70Bus Depot Stations 17 55 0Others (DODO) 22 0 28Compression Capacity (mnkg/d) 3.1 6.9 2.5CNG Vehicles (mn) 0.47 0.87 0.50Penetration (Core Area) 26% 27% 18%Domestic PNG Customers (mn) 0.87 0.64 1.06Commercial/Industrial PNG Customers 2,866/60 2,580 11,500/2,700Steel Pipelines (kms) 415 707 1,400MDPE Pipelines (kms) 4,646 9,444 16,000Total Pipeline Network (kms) 5,061 10,151 17,400
Source: Company, PhillipCapital India Research
Key risks 1. Volumes: Slowdown and fall in volumes due to expansion issues, unfavourable
economics, adverse policy rulings, delay in introduction of anchor fleet transportation like buses.
2. Margins: Adverse impact on marketing margins due to unfavourable demand‐supply dynamics, gas versus alternate fuel pricing, inability to raise prices.
3. Regulatory: Control of prices and margins by the regulator (PNGRB), government, courts, etc. Discontinuation of cheap domestic gas supplies. Less government focus on the sector.
4. Projects: Delay in project execution pertaining to pipelines, CNG outlets, etc. In Mumbai area statutory clearances can be sticky while monsoon affects the weather window.
5. Operational and currency: Breakdown of plant, equipments, and facilities affecting operations. Since gas is priced in USD, currency risk is inherent.
Valuation MGL trades at 11.4/10.9x our FY17/18 EPS at the lower end of the price band and at 12.6/12.0x at the upper end. It has seen a CAGR of 7‐8% historically, and the same is targeted by management. However, we have built in a more conservative 5% yoy growth in FY17/18. FY17E Valuation Issue Price (Rs) 380 421
EPS (Rs) 33.5 33.5
PE (x) 11.4 12.6
PB (x) 2.2 2.4
EV/EBITDA (x) 5.8 6.6
FY18E Valuation Issue Price (Rs) 380 421
EPS (Rs) 35.0 35.0
PE (x) 10.9 12.0
PB (x) 1.9 2.1
EV/EBITDA (x) 5.4 6.1
Source: PhillipCapital India Research
Page | 11 | PHILLIPCAPITAL INDIA RESEARCH

MAHANAGAR GAS LTD IPO NOTE
Our channel checks indicate that 7‐8% growth assumption is reasonable; 5% is easily doable based on favorable economics, increase in domestic PNG connectivity, and its plans to set up 15‐20 CNG stations annually. We assume a conservative reported EBITDA/scm (including other operating income) of Rs 5.8/5.7 for FY17/18, which has upside risks if MGL cuts RSP of CNG and PNG lower than the reduction in APM gas and LNG prices – as seen in April 2016. Entry PE sensitivity to volume and margins scenario at upper end price of Rs 421/sh
EBITDA/scm (Rs.)
(x) 4.9 5.1 5.3 5.5 5.7 5.9 6.1
FY16
‐18E
Volum
e CA
GR
0.0% 16.1 15.3 14.7 14.1 13.5 13.0 12.5
1.5% 15.5 14.8 14.2 13.6 13.1 12.6 12.1
3.0% 15.0 14.3 13.7 13.2 12.7 12.2 11.7
5.0% 14.4 13.7 13.1 12.6 12.0 11.7 11.2
7.0% 13.8 13.2 12.6 12.1 11.6 11.2 10.8
8.5% 13.3 12.8 12.2 11.7 11.3 10.9 10.5
9.5% 13.1 12.5 12.0 11.5 11.0 10.6 10.3
10.0% 12.9 12.4 11.9 11.4 10.9 10.5 10.2
11.0% 12.7 12.1 11.6 11.2 10.7 10.3 10.0
Source: PhillipCapital India Research Valuation at 11x‐12x FY18 PE is attractive based on near 20% RoE/RoCE, debt‐free balance sheet, healthy cash flows, and peer group trading at 15x+. Volume growth remains the single‐biggest rerating trigger for the stock. We recommend SUBSCRIBE. Comparative valuation (MGL at Rs 421)
___Adj./Consol. PE (x)___ ________PB (x)________ _____EV/EBITDA (x)_____FY16 FY17E FY18E FY16 FY17E FY18E FY16 FY17E FY18E
MGL 13.5 12.6 12.0 2.5 2.4 2.1 6.2 6.6 6.1IGL (S) 18.4 16.7 15.1 3.6 3.1 2.8 10.4 9.8 8.7GGL 39.4 18.5 15.2 3.4 3.0 2.6 12.7 9.1 8.0
Source: PhillipCapital India Research, Please note IGL’s PB & EV/EBITDA are bloated due to standalone numbers, MGL’s FY16 share base does not include Maharashtra govt’s 10% stake Key financial snapshot (at Rs 421) Y/E, March 31 FY12 FY13 FY14 FY15 FY16 FY17E FY18ERevenues (Rs.mn) 13,090 15,144 18,852 20,949 20,789 19,977 21,613 EBITDA (Rs.mn) 4,987 4,830 4,882 4,897 5,130 5,370 5,612 Reported PAT (Rs.mn) 3,077 2,985 2,972 3,010 3,087 3,307 3,455 Adjusted PAT (Rs.mn) 2,806 2,985 2,972 3,010 3,087 3,307 3,455 Growth 6% 0% 1% 3% 7% 4%Reported EPS (Rs.) 34.4 33.4 33.3 33.7 34.6 33.5 35.0 Adjusted EPS (Rs.) 31.4 33.4 33.3 33.7 34.6 33.5 35.0 Reported PE (x) 12.2 12.6 12.7 12.5 12.2 12.6 12.0 Adjusted PE (x) 14.8 13.9 14.0 13.8 13.5 12.6 12.0 PB (x) 3.5 3.2 2.9 2.7 2.5 2.4 2.1 EV/EBITDA (x) 7.0 7.0 6.8 6.7 6.2 6.6 6.1 RoE 29% 25% 23% 21% 20% 19% 18%RoCE 34% 28% 25% 23% 22% 20% 19%Debt:Equity (x) 0.0 0.0 0.0 0.0 0.0 0.0 0.0 EBITDA/scm (Rs.) 7.0 6.4 5.9 5.6 5.8 5.8 5.7 Volumes (mmscmd) 2.0 2.1 2.3 2.4 2.4 2.6 2.7 Growth 6% 9% 5% 2% 5% 5%
Source: Company, PhillipCapital India Research
Page | 12 | PHILLIPCAPITAL INDIA RESEARCH

Page | 13 | PHILLIPCAPITAL INDIA RESEARCH
MAHANAGAR GAS LTD IPO NOTE
Financials
Income Statement Y/E Mar, Rs mn FY15 FY16 FY17e FY18eNet sales 20,778 20,653 19,840 21,475Growth, % 11 ‐1 ‐4 8Other income 171 136 137 139Total income 20,949 20,789 19,977 21,613Raw material expenses ‐12,957 ‐12,297 ‐10,839 ‐11,848Employee expenses ‐511 ‐537 ‐591 ‐650Other Operating expenses ‐2,584 ‐2,826 ‐3,177 ‐3,504EBITDA (Core) 4,897 5,130 5,370 5,612Growth, % 0 5 5 5Margin, % 23.4 24.7 26.9 26.0Depreciation ‐799 ‐841 ‐879 ‐975EBIT 4,098 4,289 4,491 4,637Growth, % 1 5 5 3Margin, % 19.6 20.6 22.5 21.5Interest paid ‐12 ‐29 ‐2 0Other Non‐Operating Income 407 427 446 520Non‐recurring Items 0 0 0 0Pre‐tax profit 4,493 4,686 4,936 5,156Tax provided ‐1,483 ‐1,600 ‐1,629 ‐1,702Profit after tax 3,010 3,087 3,307 3,455Net Profit 3,010 3,087 3,307 3,455Growth, % 1 3 7 4Net Profit (adjusted) 3,010 3,087 3,307 3,455Unadj. shares (m) 89 89 99 99Wtd avg shares (m) 89 89 99 99 Balance Sheet Y/E Mar, Rs mn FY15 FY16 FY17e FY18eCash & bank 1,449 1,721 2,269 3,348Marketable securities at cost 3,715 3,882 3,998 4,118Debtors 962 893 858 928Inventory 174 180 173 187Loans & advances 603 706 678 734Other current assets 299 286 275 297Total current assets 7,202 7,667 8,251 9,613Investments 18 11 11 12Gross fixed assets 16,715 18,450 20,607 22,736Less: Depreciation ‐6,074 ‐6,854 ‐7,733 ‐8,708Add: Capital WIP 3,796 4,289 4,632 5,002Net fixed assets 14,436 15,885 17,506 19,031Non‐current assets 0 0 0 0Total assets 21,656 23,563 25,769 28,656 Current liabilities 1,683 1,924 1,795 1,966Provisions 2,041 2,036 1,899 2,080Total current liabilities 3,724 3,960 3,694 4,047Non‐current liabilities 3,857 4,323 4,748 5,242Total liabilities 7,581 8,283 8,442 9,289Paid‐up capital 893 893 988 988Reserves & surplus 13,181 14,386 16,339 18,379Shareholders’ equity 14,075 15,280 17,327 19,367Total equity & liabilities 21,656 23,563 25,769 28,656 Source: Company, PhillipCapital India Research Estimates
Cash Flow Y/E Mar, Rs mn FY15 FY16 FY17e FY18ePre‐tax profit 4,198 4,443 4,491 4,637Depreciation 799 841 879 975Chg in working capital 660 471 124 530Total tax paid ‐1,390 ‐1,501 ‐1,473 ‐1,544Cash flow from operating activities 4,267 4,254 4,021 4,598Capital expenditure ‐1,975 ‐2,210 ‐2,500 ‐2,500Chg in investments ‐278 ‐127 ‐117 ‐121Other investing activities ‐354 51 446 520Cash flow from investing activities ‐2,607 ‐2,286 ‐2,171 ‐2,101Free cash flow 1,660 1,968 1,850 2,497Debt raised/(repaid) 76 ‐18 54 ‐3Dividend (incl. tax) ‐1,175 ‐1,679 ‐1,356 ‐1,415Cash flow from financing activities ‐1,099 ‐1,696 ‐1,302 ‐1,418Net chg in cash 561 272 548 1,079 Valuation Ratios
FY15 FY16 FY17e FY18ePer Share dataEPS (INR) 33.7 34.6 33.5 35.0Growth, % 1.3 2.6 (3.1) 4.5Book NAV/share (INR) 157.5 171.0 175.4 196.1FDEPS (INR) 33.7 34.6 33.5 35.0CEPS (INR) 42.6 44.0 42.4 44.8CFPS (INR) 26.0 21.9 15.3 21.4DPS (INR) 17.5 17.5 11.7 12.2Return ratiosReturn on assets (%) 18.0 16.7 16.0 15.2Return on equity (%) 21.4 20.2 19.1 17.8Return on capital employed (%) 22.9 21.9 20.3 18.8Turnover ratiosAsset turnover (x) 1.3 1.3 1.3 1.3Sales/Total assets (x) 1.2 1.1 0.9 0.9Sales/Net FA (x) 1.5 1.3 1.1 1.1Working capital/Sales (x) 0.2 0.2 0.2 0.2Receivable days 16.8 15.7 15.7 15.7Inventory days 3.0 3.2 3.2 3.2Payable days 25.5 26.1 26.1 26.1Working capital days (5.7) (7.3) (7.3) (7.3)Liquidity ratios Current ratio (x) 1.9 1.8 2.1 2.3Quick ratio (x) 1.7 1.6 1.9 2.1Interest cover (x) NA NA NA NADividend cover (x) NA NA NA NATotal debt/Equity (%) 0.0 0.0 0.0 0.0Net debt/Equity (%) (0.4) (0.4) (0.4) (0.4)Valuation PER (x) 12.5 12.2 12.6 12.0PEG (x) ‐ y‐o‐y growth 990.0 477.2 176.4 269.3Price/Book (x) 2.7 2.5 2.4 2.1Yield (%) NA NA NA NAEV/Net sales (x) 1.6 1.5 1.8 1.6EV/EBITDA (x) 6.7 6.2 6.6 6.1EV/EBIT (x) 8.0 7.5 7.9 7.4

MAHANAGAR GAS LTD IPO NOTE
Page | 14 | PHILLIPCAPITAL INDIA RESEARCH
Rating Methodology We rate stock on absolute return basis. Our target price for the stocks has an investment horizon of one year. Rating Criteria Definition
BUY >= +15% Target price is equal to or more than 15% of current market price
NEUTRAL ‐15% > to < +15% Target price is less than +15% but more than ‐15%
SELL <= ‐15% Target price is less than or equal to ‐15%.
Contact Information (Regional Member Companies)
SINGAPORE: Phillip Securities Pte Ltd 250 North Bridge Road, #06‐00 Raffles City Tower,
Singapore 179101 Tel : (65) 6533 6001 Fax: (65) 6535 3834
www.phillip.com.sg
MALAYSIA: Phillip Capital Management Sdn Bhd B‐3‐6 Block B Level 3, Megan Avenue II,
No. 12, Jalan Yap Kwan Seng, 50450 Kuala Lumpur Tel (60) 3 2162 8841 Fax (60) 3 2166 5099
www.poems.com.my
HONG KONG: Phillip Securities (HK) Ltd 11/F United Centre 95 Queensway Hong Kong Tel (852) 2277 6600 Fax: (852) 2868 5307
www.phillip.com.hk
JAPAN: Phillip Securities Japan, Ltd 4‐2 Nihonbashi Kabutocho, Chuo‐ku
Tokyo 103‐0026 Tel: (81) 3 3666 2101 Fax: (81) 3 3664 0141
www.phillip.co.jp
INDONESIA: PT Phillip Securities Indonesia ANZ Tower Level 23B, Jl Jend Sudirman Kav 33A,
Jakarta 10220, Indonesia Tel (62) 21 5790 0800 Fax: (62) 21 5790 0809
www.phillip.co.id
CHINA: Phillip Financial Advisory (Shanghai) Co. Ltd. No 550 Yan An East Road, Ocean Tower Unit 2318
Shanghai 200 001 Tel (86) 21 5169 9200 Fax: (86) 21 6351 2940
www.phillip.com.cn
THAILAND: Phillip Securities (Thailand) Public Co. Ltd. 15th Floor, Vorawat Building, 849 Silom Road,
Silom, Bangrak, Bangkok 10500 Thailand Tel (66) 2 2268 0999 Fax: (66) 2 2268 0921
www.phillip.co.th
FRANCE: King & Shaxson Capital Ltd. 3rd Floor, 35 Rue de la Bienfaisance
75008 Paris France Tel (33) 1 4563 3100 Fax : (33) 1 4563 6017
www.kingandshaxson.com
UNITED KINGDOM: King & Shaxson Ltd. 6th Floor, Candlewick House, 120 Cannon Street
London, EC4N 6AS Tel (44) 20 7929 5300 Fax: (44) 20 7283 6835
www.kingandshaxson.com
UNITED STATES: Phillip Futures Inc. 141 W Jackson Blvd Ste 3050
The Chicago Board of Trade Building Chicago, IL 60604 USA
Tel (1) 312 356 9000 Fax: (1) 312 356 9005
AUSTRALIA: PhillipCapital Australia Level 37, 530 Collins Street
Melbourne, Victoria 3000, Australia Tel: (61) 3 9629 8380 Fax: (61) 3 9614 8309
www.phillipcapital.com.au
SRI LANKA: Asha Phillip Securities Limited Level 4, Millennium House, 46/58 Navam Mawatha,
Colombo 2, Sri Lanka Tel: (94) 11 2429 100 Fax: (94) 11 2429 199
www.ashaphillip.net/home.htm
INDIA: PhillipCapital (India) Private Limited No. 1, 18th Floor, Urmi Estate, 95 Ganpatrao Kadam Marg, Lower Parel West, Mumbai 400013
Tel: (9122) 2300 2999 Fax: (9122) 6667 9955 www.phillipcapital.in
Management(91 22) 2483 1919
Kinshuk Bharti Tiwari (Head – Institutional Equity) (91 22) 6667 9946(91 22) 6667 9735
Research IT Services Pharma & Speciality Chem
Dhawal Doshi (9122) 6667 9769 Vibhor Singhal (9122) 6667 9949 Surya Patra (9122) 6667 9768Nitesh Sharma, CFA (9122) 6667 9965 Shyamal Dhruve (9122) 6667 9992 Mehul Sheth (9122) 6667 9996Banking, NBFCs Infrastructure StrategyManish Agarwalla (9122) 6667 9962 Vibhor Singhal (9122) 6667 9949 Naveen Kulkarni, CFA, FRM (9122) 6667 9947Pradeep Agrawal (9122) 6667 9953 Deepak Agarwal (9122) 6667 9944 Anindya Bhowmik (9122) 6667 9764Paresh Jain (9122) 6667 9948 Logistics, Transportation & Midcap TelecomConsumer & Retail Vikram Suryavanshi (9122) 6667 9951 Naveen Kulkarni, CFA, FRM (9122) 6667 9947Naveen Kulkarni, CFA, FRM (9122) 6667 9947 Media Manoj Behera (9122) 6667 9973Jubil Jain (9122) 6667 9766 Manoj Behera (9122) 6667 9973 TechnicalsPreeyam Tolia (9122) 6667 9950 Metals Subodh Gupta, CMT (9122) 6667 9762Cement Dhawal Doshi (9122) 6667 9769 Production ManagerVaibhav Agarwal (9122) 6667 9967 Yash Doshi (9122) 6667 9987 Ganesh Deorukhkar (9122) 6667 9966Economics Midcap EditorAnjali Verma (9122) 6667 9969 Amol Rao (9122) 6667 9952 Roshan Sony 98199 72726Engineering, Capital Goods Mid‐Caps & Database Manager Sr. Manager – Equities SupportJonas Bhutta (9122) 6667 9759 Deepak Agarwal (9122) 6667 9944 Rosie Ferns (9122) 6667 9971
Oil & GasSabri Hazarika (9122) 6667 9756
Sales & Distribution Ashvin Patil (9122) 6667 9991 Sales Trader Zarine Damania (9122) 6667 9976Shubhangi Agrawal (9122) 6667 9964 Dilesh Doshi (9122) 6667 9747 Kishor Binwal (9122) 6667 9989 Suniil Pandit (9122) 6667 9745Bhavin Shah (9122) 6667 9974Ashka Mehta Gulati (9122) 6667 9934 ExecutionArchan Vyas (9122) 6667 9785 Mayur Shah (9122) 6667 9945
Corporate Communications
Vineet Bhatnagar (Managing Director)
Jignesh Shah (Head – Equity Derivatives)
Automobiles

MAHANAGAR GAS LTD IPO NOTE
Disclosures and Disclaimers PhillipCapital (India) Pvt. Ltd. has three independent equity research groups: Institutional Equities, Institutional Equity Derivatives, and Private Client Group. This report has been prepared by Institutional Equities Group. The views and opinions expressed in this document may, may not match, or may be contrary at times with the views, estimates, rating, and target price of the other equity research groups of PhillipCapital (India) Pvt. Ltd.
This report is issued by PhillipCapital (India) Pvt. Ltd., which is regulated by the SEBI. PhillipCapital (India) Pvt. Ltd. is a subsidiary of Phillip (Mauritius) Pvt. Ltd. References to "PCIPL" in this report shall mean PhillipCapital (India) Pvt. Ltd unless otherwise stated. This report is prepared and distributed by PCIPL for information purposes only, and neither the information contained herein, nor any opinion expressed should be construed or deemed to be construed as solicitation or as offering advice for the purposes of the purchase or sale of any security, investment, or derivatives. The information and opinions contained in the report were considered by PCIPL to be valid when published. The report also contains information provided to PCIPL by third parties. The source of such information will usually be disclosed in the report. Whilst PCIPL has taken all reasonable steps to ensure that this information is correct, PCIPL does not offer any warranty as to the accuracy or completeness of such information. Any person placing reliance on the report to undertake trading does so entirely at his or her own risk and PCIPL does not accept any liability as a result. Securities and Derivatives markets may be subject to rapid and unexpected price movements and past performance is not necessarily an indication of future performance.
This report does not regard the specific investment objectives, financial situation, and the particular needs of any specific person who may receive this report. Investors must undertake independent analysis with their own legal, tax, and financial advisors and reach their own conclusions regarding the appropriateness of investing in any securities or investment strategies discussed or recommended in this report and should understand that statements regarding future prospects may not be realised. Under no circumstances can it be used or considered as an offer to sell or as a solicitation of any offer to buy or sell the securities mentioned within it. The information contained in the research reports may have been taken from trade and statistical services and other sources, which PCIL believe is reliable. PhillipCapital (India) Pvt. Ltd. or any of its group/associate/affiliate companies do not guarantee that such information is accurate or complete and it should not be relied upon as such. Any opinions expressed reflect judgments at this date and are subject to change without notice.
Important: These disclosures and disclaimers must be read in conjunction with the research report of which it forms part. Receipt and use of the research report is subject to all aspects of these disclosures and disclaimers. Additional information about the issuers and securities discussed in this research report is available on request.
Certifications: The research analyst(s) who prepared this research report hereby certifies that the views expressed in this research report accurately reflect the research analyst’s personal views about all of the subject issuers and/or securities, that the analyst(s) have no known conflict of interest and no part of the research analyst’s compensation was, is, or will be, directly or indirectly, related to the specific views or recommendations contained in this research report.
Additional Disclosures of Interest: Unless specifically mentioned in Point No. 9 below: 1. The Research Analyst(s), PCIL, or its associates or relatives of the Research Analyst does not have any financial interest in the company(ies) covered in
this report. 2. The Research Analyst, PCIL or its associates or relatives of the Research Analyst affiliates collectively do not hold more than 1% of the securities of the
company (ies)covered in this report as of the end of the month immediately preceding the distribution of the research report. 3. The Research Analyst, his/her associate, his/her relative, and PCIL, do not have any other material conflict of interest at the time of publication of this
research report. 4. The Research Analyst, PCIL, and its associates have not received compensation for investment banking or merchant banking or brokerage services or for
any other products or services from the company(ies) covered in this report, in the past twelve months. 5. The Research Analyst, PCIL or its associates have not managed or co‐managed in the previous twelve months, a private or public offering of securities for
the company (ies) covered in this report. 6. PCIL or its associates have not received compensation or other benefits from the company(ies) covered in this report or from any third party, in
connection with the research report. 7. The Research Analyst has not served as an Officer, Director, or employee of the company (ies) covered in the Research report. 8. The Research Analyst and PCIL has not been engaged in market making activity for the company(ies) covered in the Research report. 9. Details of PCIL, Research Analyst and its associates pertaining to the companies covered in the Research report: Sr. no. Particulars Yes/No
1 Whether compensation has been received from the company(ies) covered in the Research report in the past 12 months for investment banking transaction by PCIL
No
2 Whether Research Analyst, PCIL or its associates or relatives of the Research Analyst affiliates collectively hold more than 1% of thecompany(ies) covered in the Research report
No
3 Whether compensation has been received by PCIL or its associates from the company(ies) covered in the Research report No4 PCIL or its affiliates have managed or co‐managed in the previous twelve months a private or public offering of securities for the
company(ies) covered in the Research report No
5 Research Analyst, his associate, PCIL or its associates have received compensation for investment banking or merchant banking or brokerage services or for any other products or services from the company(ies) covered in the Research report, in the last twelve months
No
Independence: PhillipCapital (India) Pvt. Ltd. has not had an investment banking relationship with, and has not received any compensation for investment banking services from, the subject issuers in the past twelve (12) months, and PhillipCapital (India) Pvt. Ltd does not anticipate receiving or intend to seek compensation for investment banking services from the subject issuers in the next three (3) months. PhillipCapital (India) Pvt. Ltd is not a market maker in the securities mentioned in this research report, although it, or its affiliates/employees, may have positions in, purchase or sell, or be materially interested in any of the securities covered in the report.
Suitability and Risks: This research report is for informational purposes only and is not tailored to the specific investment objectives, financial situation or particular requirements of any individual recipient hereof. Certain securities may give rise to substantial risks and may not be suitable for certain investors. Each investor must make its own determination as to the appropriateness of any securities referred to in this research report based upon the legal, tax and accounting considerations applicable to such investor and its own investment objectives or strategy, its financial situation and its investing experience. The value of any security may be positively or adversely affected by changes in foreign exchange or interest rates, as well as by other financial, economic, or political factors. Past performance is not necessarily indicative of future performance or results.
Page | 15 | PHILLIPCAPITAL INDIA RESEARCH

Page | 16 | PHILLIPCAPITAL INDIA RESEARCH
MAHANAGAR GAS LTD IPO NOTE
Sources, Completeness and Accuracy: The material herein is based upon information obtained from sources that PCIPL and the research analyst believe to be reliable, but neither PCIPL nor the research analyst represents or guarantees that the information contained herein is accurate or complete and it should not be relied upon as such. Opinions expressed herein are current opinions as of the date appearing on this material, and are subject to change without notice. Furthermore, PCIPL is under no obligation to update or keep the information current. Without limiting any of the foregoing, in no event shall PCIL, any of its affiliates/employees or any third party involved in, or related to computing or compiling the information have any liability for any damages of any kind including but not limited to any direct or consequential loss or damage, however arising, from the use of this document.
Copyright: The copyright in this research report belongs exclusively to PCIPL. All rights are reserved. Any unauthorised use or disclosure is prohibited. No reprinting or reproduction, in whole or in part, is permitted without the PCIPL’s prior consent, except that a recipient may reprint it for internal circulation only and only if it is reprinted in its entirety.
Caution: Risk of loss in trading/investment can be substantial and even more than the amount / margin given by you. The recipient should carefully consider whether trading/investment is appropriate for the recipient in light of the recipient’s experience, objectives, financial resources and other relevant circumstances. PCIPL and any of its employees, directors, associates, group entities, or affiliates shall not be liable for losses, if any, incurred by the recipient. The recipient is further cautioned that trading/investments in financial markets are subject to market risks and are advised to seek trading/investment advice before investing. There is no guarantee/assurance as to returns or profits or capital protection or appreciation. PCIPL and any of its employees, directors, associates, group entities, affiliates are not inducing the recipient for trading/investing in the financial market(s). Trading/Investment decision is the sole responsibility of the recipient.
For U.S. persons only: This research report is a product of PhillipCapital (India) Pvt Ltd., which is the employer of the research analyst(s) who has prepared the research report. The research analyst(s) preparing the research report is/are resident outside the United States (U.S.) and are not associated persons of any U.S.‐regulated broker‐dealer and therefore the analyst(s) is/are not subject to supervision by a U.S. broker‐dealer, and is/are not required to satisfy the regulatory licensing requirements of FINRA or required to otherwise comply with U.S. rules or regulations regarding, among other things, communications with a subject company, public appearances, and trading securities held by a research analyst account.
This report is intended for distribution by PhillipCapital (India) Pvt Ltd. only to "Major Institutional Investors" as defined by Rule 15a‐6(b)(4) of the U.S. Securities and Exchange Act, 1934 (the Exchange Act) and interpretations thereof by the U.S. Securities and Exchange Commission (SEC) in reliance on Rule 15a 6(a)(2). If the recipient of this report is not a Major Institutional Investor as specified above, then it should not act upon this report and return the same to the sender. Further, this report may not be copied, duplicated, and/or transmitted onward to any U.S. person, which is not a Major Institutional Investor. In reliance on the exemption from registration provided by Rule 15a‐6 of the Exchange Act and interpretations thereof by the SEC in order to conduct certain business with Major Institutional Investors, PhillipCapital (India) Pvt Ltd. has entered into an agreement with a U.S. registered broker‐dealer, Decker & Co, LLC. Transactions in securities discussed in this research report should be effected through Decker & Co, LLC or another U.S. registered broker dealer. If Distribution is to Australian Investors This report is produced by PhillipCapital (India) Pvt Ltd and is being distributed in Australia by Phillip Capital Limited (Australian Financial Services Licence No. 246827). This report contains general securities advice and does not take into account your personal objectives, situation and needs. Please read the Disclosures and Disclaimers set out above. By receiving or reading this report, you agree to be bound by the terms and limitations set out above. Any failure to comply with these terms and limitations may constitute a violation of law. This report has been provided to you for personal use only and shall not be reproduced, distributed or published by you in whole or in part, for any purpose. If you have received this report by mistake, please delete or destroy it, and notify the sender immediately. PhillipCapital (India) Pvt. Ltd. Registered office: No. 1, 18th Floor, Urmi Estate, 95 Ganpatrao Kadam Marg, Lower Parel West, Mumbai 400013