institutional equity research orient paper & industries...
TRANSCRIPT
INSTITUTIONAL EQUITY RESEARCH
Page | 1 | PHILLIPCAPITAL INDIA RESEARCH
Orient Paper & Industries Ltd (OPI IN)
Demerger to unlock tremendous value
INDIA | MIDCAP | Initiating Coverage
4 January 2018
Read this report to see how tremendous changes in OPIL will effect a rerating:
Electricals will be demerged from OPIL by way of a classical demerger with mirror shareholding. The demerger of its electrical businesses will unlock value for both businesses.
The soon-to-be demerged Orient Electric Ltd (OEL, 70% of OPIL’s revenue) has a strong business model and is available at a 35% discount to the industry average.
Its brand Orient PSPO is one of India’s oldest, and holds a leadership position. It has spruced up its brand with a new logo and aggressive spending at 3% of sales, which we expect will increase to 4% over the next 2-3 years. In fans, it is the second largest domestic player with 60% share in India’s exports. In LED lamps, it is the second largest in India after PHILIPS. In appliances and switchgears, it is moving towards profitability. With an improvement in product mix, this business’ revenue CAGR should be 15% over 2-3 years and its margins should improve by 200bps over FY18-20.
The paper business (OPIL-P) has turned positive. Moving up the chain into premium-grade products such as tissue papers has increased realisations. Also, its increased capacity in tissue papers has made OPIL-P a market leader. Strong turnaround in the segment (we expect 22% revenue CAGR over FY18-20; 1HFY18 revenue growth was 35% and OPM was 17%). With an improvement in profitability, the paper business will become self-sustaining and start generating cash flow by FY19.
We initiate coverage on OPIL (OEL + OPIL-P) with a Buy recommendation and a target of Rs 200 based on an SOTP valuation of Rs 50 for paper and Rs 150 for electricals. OEL: Market leader in fans, diversifying its products basket Soon-to-be-demerged Orient Electric Ltd (OEL) is a leading player in consumer electric products and has added lighting, appliances, and switchgears to its portfolio; its market share has been increasing. Currently, about 70% of the revenue comes from fans, which remains its bastion. It has increased its presence in premium fans and is currently a market leader in this segment. Each of these product groups provides huge market potential and scope for accelerated growth. We expect this division’s revenue CAGR at 15% over the next 2-3 years. OPIL-P: The paper business is likely to rerate In the last two years, OPIL’s paper business has achieved a strong turnaround with an impressive increase in profitability. The improvement was majorly because of improving demand in the paper industry, strong cost control by the company, and better product mix (from the higher-margin tissue segment). In FY17 company has reported EBITDA of Rs 367mn vs. Rs90mn in FY16. We expect EBIT CAGR of 57% over next 3 years. Outlook and valuation OPIL’s CMP implies that the electricals business (OEL) is trading at 23x PE and 1.2x MCap/Sales on FY20 numbers vs. peer average of 35x PE and 4x MCap/sales (V-guard, Havells, CG) while OPIL-P is trading at 6x EV/EBITDA. With its operational strength, financial soundness, and strong brand and distribution, we believe that the valuation gap between OEL and its peers will narrow. We assign a FY20 target PE of 30x to OEL’s earnings to arrive at a per share value of Rs 150. We expect measures taken by the company to lead to robust cash flow generation and improvement in the return profile to support the rerating. Our multiple is at a 15% discount to its peers. We value OPIL-P on EV/EBITDA at 7x FY20 to arrive at a per-share value of Rs 50. Our target for OPIL (electricals + paper) is Rs 200, implying 30% upside. Initiate coverage with a BUY.
BUY CMP Rs 154
TARGET RS 200 (+30%) COMPANY DATA
O/S SHARES (MN) : 212
MARKET CAP (RSBN) : 34
MARKET CAP (USDBN) : 0.5
52 - WK HI/LO (RS) : 165 / 65
LIQUIDITY 3M (USDMN) : 1.2
PAR VALUE (RS) : 2
SHARE HOLDING PATTERN, %
Sep 17 Jun17 Mar 17
PROMOTERS : 38.7 38.7 38.7
FII / NRI : 1.9 3.5 3.8
FI / MF : 17.2 18.0 17.9
NON PRO : 26.5 24.0 23.0
PUBLIC & OTHERS : 15.8 15.9 16.6
PRICE PERFORMANCE, %
1MTH 3MTH 1YR
ABS 24.0 58.5 124.0
REL TO BSE 21.0 51.2 97.2
PRICE VS. SENSEX
Source: Phillip Capital India Research
KEY FINANCIALS
Rs mn FY17 FY18E FY19E
Net Sales 18,752 22,320 25,966
EBIDTA 1,222 2,019 2,681
Net Profit 506 1,019 1,450
EPS, Rs 2.4 4.8 6.8
PER, x 64.6 32.1 22.5
EV/EBIDTA, x 29.7 17.6 13.0
P/BV, x 6.4 5.4 4.6
ROE, % 11.0 18.7 22.8
Source: PhillipCapital India Research Est.
Deepak Agarwal (+ 9122 6246 4112) [email protected]
80
130
180
230
280
330
380
430
Apr-16 Nov-16 Jun-17
Orient Paper BSE Sensex
Page | 2 | PHILLIPCAPITAL INDIA RESEARCH
ORIENT PAPER & INDUSTRIES LTD INITIATING COVERAGE
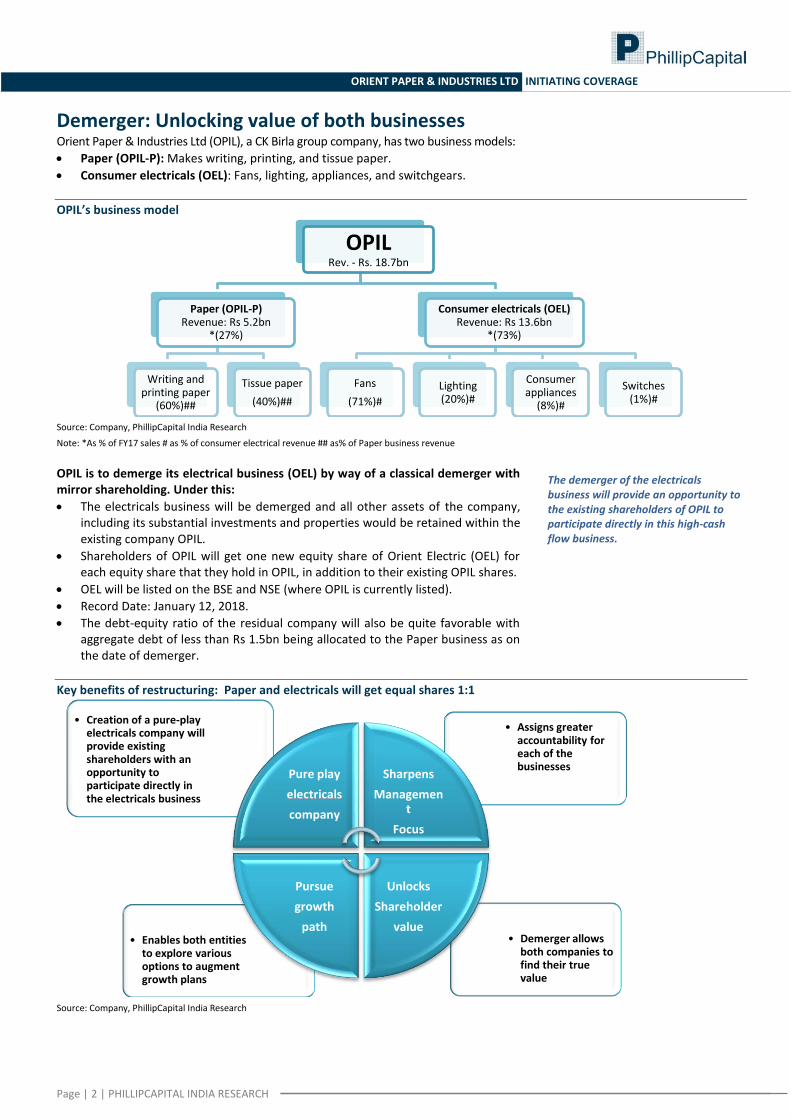
Demerger: Unlocking value of both businesses Orient Paper & Industries Ltd (OPIL), a CK Birla group company, has two business models:
Paper (OPIL-P): Makes writing, printing, and tissue paper.
Consumer electricals (OEL): Fans, lighting, appliances, and switchgears.
OPIL’s business model
Source: Company, PhillipCapital India Research
Note: *As % of FY17 sales # as % of consumer electrical revenue ## as% of Paper business revenue
OPIL is to demerge its electrical business (OEL) by way of a classical demerger with mirror shareholding. Under this:
The electricals business will be demerged and all other assets of the company, including its substantial investments and properties would be retained within the existing company OPIL.
Shareholders of OPIL will get one new equity share of Orient Electric (OEL) for each equity share that they hold in OPIL, in addition to their existing OPIL shares.
OEL will be listed on the BSE and NSE (where OPIL is currently listed).
Record Date: January 12, 2018.
The debt-equity ratio of the residual company will also be quite favorable with aggregate debt of less than Rs 1.5bn being allocated to the Paper business as on the date of demerger.
Key benefits of restructuring: Paper and electricals will get equal shares 1:1
Source: Company, PhillipCapital India Research
OPIL Rev. - Rs. 18.7bn
Paper (OPIL-P) Revenue: Rs 5.2bn
*(27%)
Writing and printing paper
(60%)##
Tissue paper
(40%)##
Consumer electricals (OEL) Revenue: Rs 13.6bn
*(73%)
Fans
(71%)#
Lighting (20%)#
Consumer appliances
(8%)#
Switches (1%)#
• Demerger allows both companies to find their true value
• Enables both entities to explore various options to augment growth plans
• Assigns greater accountability for each of the businesses
• Creation of a pure‐play electricals company will provide existing shareholders with an opportunity to participate directly in the electricals business
Pure play
electricals
company
Sharpens
Management
Focus
Unlocks
Shareholder
value
Pursue
growth
path
The demerger of the electricals business will provide an opportunity to the existing shareholders of OPIL to participate directly in this high-cash flow business.
Page | 3 | PHILLIPCAPITAL INDIA RESEARCH
ORIENT PAPER & INDUSTRIES LTD INITIATING COVERAGE
A comparison between OPIL and Crompton Greaves CG and Orient are among the oldest brands in India. CG is a market leader in fans followed by Orient, and both companies have been able to maintain their shares over the last five years.
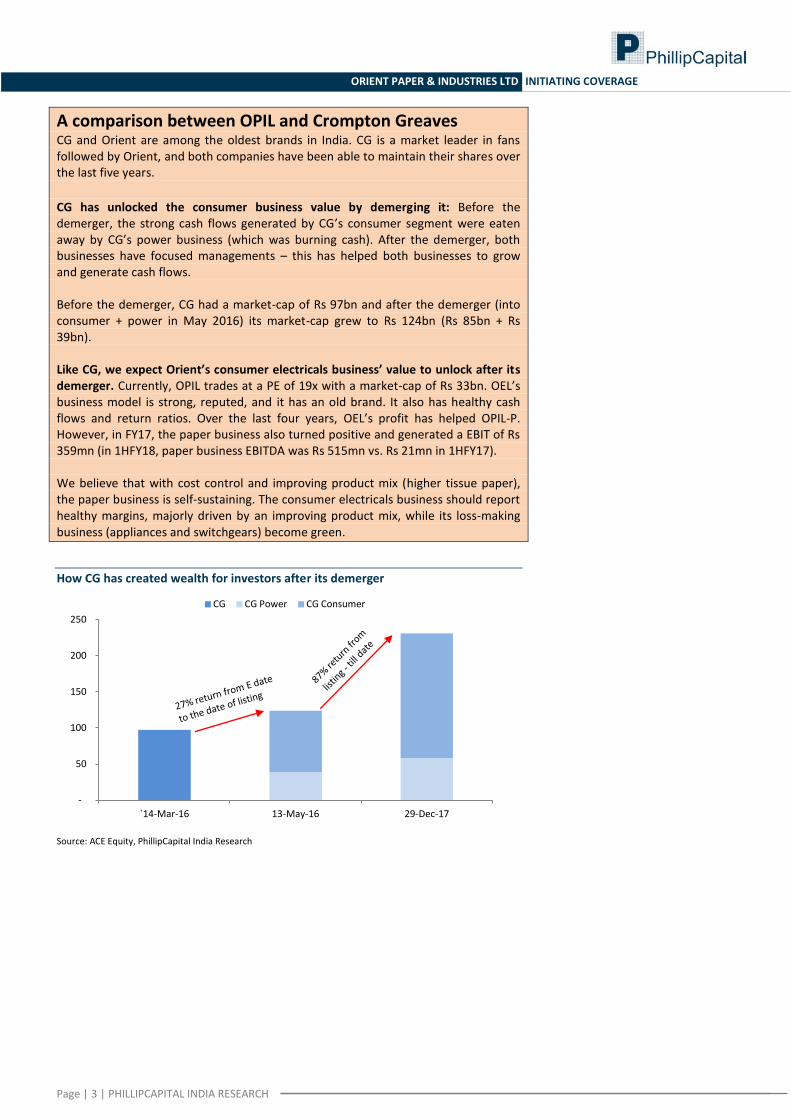
CG has unlocked the consumer business value by demerging it: Before the demerger, the strong cash flows generated by CG’s consumer segment were eaten away by CG’s power business (which was burning cash). After the demerger, both businesses have focused managements – this has helped both businesses to grow and generate cash flows. Before the demerger, CG had a market-cap of Rs 97bn and after the demerger (into consumer + power in May 2016) its market-cap grew to Rs 124bn (Rs 85bn + Rs 39bn). Like CG, we expect Orient’s consumer electricals business’ value to unlock after its demerger. Currently, OPIL trades at a PE of 19x with a market-cap of Rs 33bn. OEL’s business model is strong, reputed, and it has an old brand. It also has healthy cash flows and return ratios. Over the last four years, OEL’s profit has helped OPIL-P. However, in FY17, the paper business also turned positive and generated a EBIT of Rs 359mn (in 1HFY18, paper business EBITDA was Rs 515mn vs. Rs 21mn in 1HFY17). We believe that with cost control and improving product mix (higher tissue paper), the paper business is self-sustaining. The consumer electricals business should report healthy margins, majorly driven by an improving product mix, while its loss-making business (appliances and switchgears) become green.
How CG has created wealth for investors after its demerger
Source: ACE Equity, PhillipCapital India Research
-
50
100
150
200
250
`14-Mar-16 13-May-16 29-Dec-17
CG CG Power CG Consumer
Page | 4 | PHILLIPCAPITAL INDIA RESEARCH
ORIENT PAPER & INDUSTRIES LTD INITIATING COVERAGE
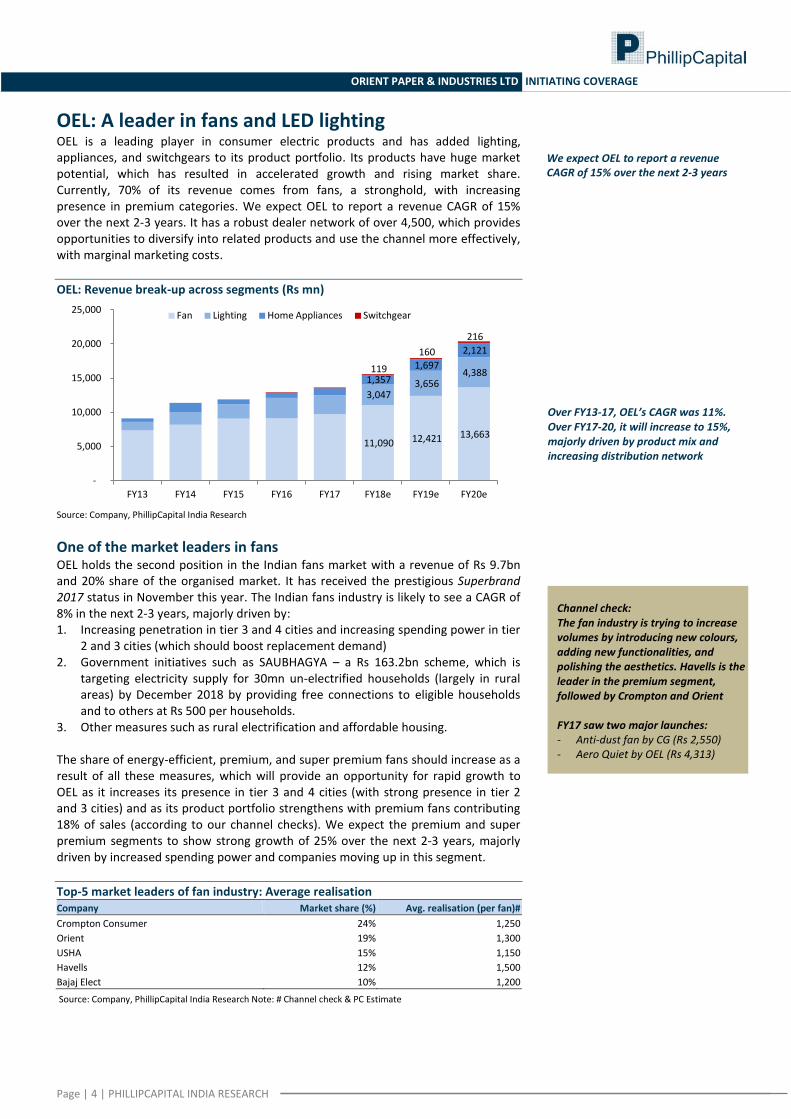
OEL: A leader in fans and LED lighting OEL is a leading player in consumer electric products and has added lighting, appliances, and switchgears to its product portfolio. Its products have huge market potential, which has resulted in accelerated growth and rising market share. Currently, 70% of its revenue comes from fans, a stronghold, with increasing presence in premium categories. We expect OEL to report a revenue CAGR of 15% over the next 2-3 years. It has a robust dealer network of over 4,500, which provides opportunities to diversify into related products and use the channel more effectively, with marginal marketing costs.
OEL: Revenue break-up across segments (Rs mn)
Source: Company, PhillipCapital India Research
One of the market leaders in fans OEL holds the second position in the Indian fans market with a revenue of Rs 9.7bn and 20% share of the organised market. It has received the prestigious Superbrand 2017 status in November this year. The Indian fans industry is likely to see a CAGR of 8% in the next 2-3 years, majorly driven by: 1. Increasing penetration in tier 3 and 4 cities and increasing spending power in tier
2 and 3 cities (which should boost replacement demand) 2. Government initiatives such as SAUBHAGYA – a Rs 163.2bn scheme, which is
targeting electricity supply for 30mn un-electrified households (largely in rural areas) by December 2018 by providing free connections to eligible households and to others at Rs 500 per households.
3. Other measures such as rural electrification and affordable housing.
The share of energy-efficient, premium, and super premium fans should increase as a result of all these measures, which will provide an opportunity for rapid growth to OEL as it increases its presence in tier 3 and 4 cities (with strong presence in tier 2 and 3 cities) and as its product portfolio strengthens with premium fans contributing 18% of sales (according to our channel checks). We expect the premium and super premium segments to show strong growth of 25% over the next 2-3 years, majorly driven by increased spending power and companies moving up in this segment.
Top-5 market leaders of fan industry: Average realisation Company Market share (%) Avg. realisation (per fan)#
Crompton Consumer 24% 1,250
Orient 19% 1,300
USHA 15% 1,150
Havells 12% 1,500
Bajaj Elect 10% 1,200
Source: Company, PhillipCapital India Research Note: # Channel check & PC Estimate
11,090 12,421 13,663
3,047 3,656
4,388 1,357
1,697
2,121
119
160
216
-
5,000
10,000
15,000
20,000
25,000
FY13 FY14 FY15 FY16 FY17 FY18e FY19e FY20e
Fan Lighting Home Appliances Switchgear
Over FY13-17, OEL’s CAGR was 11%. Over FY17-20, it will increase to 15%, majorly driven by product mix and increasing distribution network
Channel check: The fan industry is trying to increase volumes by introducing new colours, adding new functionalities, and polishing the aesthetics. Havells is the leader in the premium segment, followed by Crompton and Orient FY17 saw two major launches: - Anti-dust fan by CG (Rs 2,550) - Aero Quiet by OEL (Rs 4,313)
We expect OEL to report a revenue CAGR of 15% over the next 2-3 years
Page | 5 | PHILLIPCAPITAL INDIA RESEARCH
ORIENT PAPER & INDUSTRIES LTD INITIATING COVERAGE
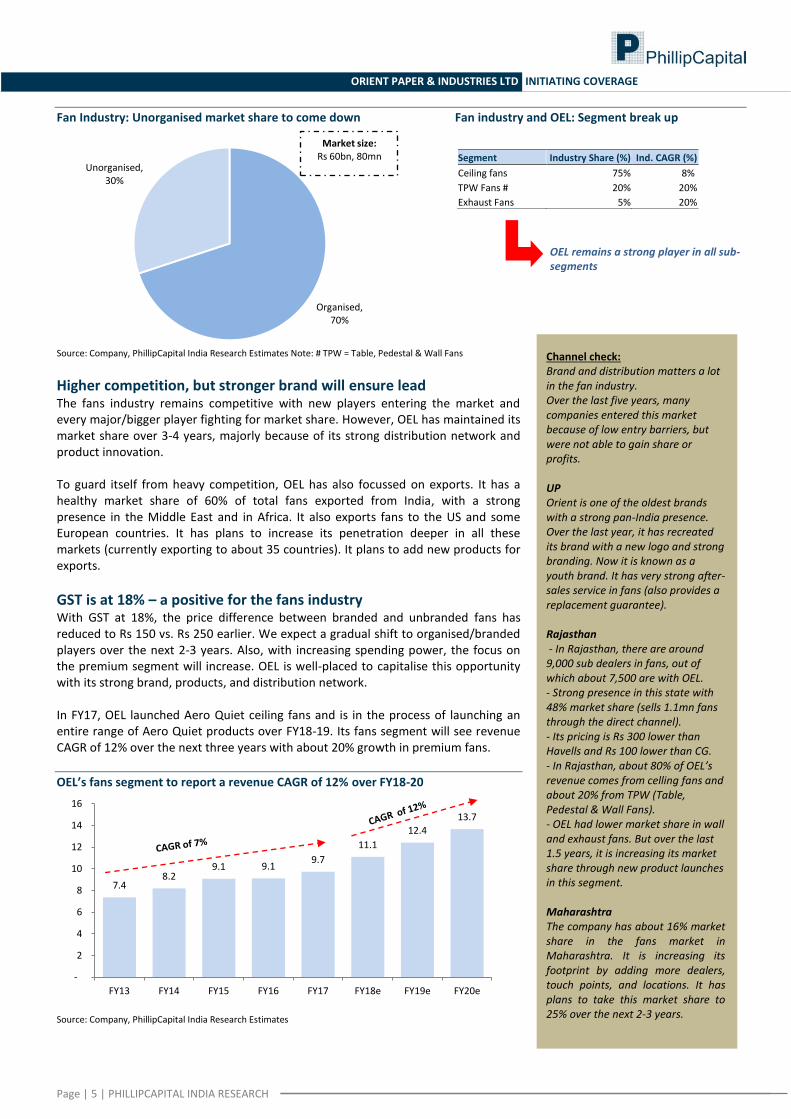
Fan Industry: Unorganised market share to come down Fan industry and OEL: Segment break up
Source: Company, PhillipCapital India Research Estimates Note: # TPW = Table, Pedestal & Wall Fans
Higher competition, but stronger brand will ensure lead The fans industry remains competitive with new players entering the market and every major/bigger player fighting for market share. However, OEL has maintained its market share over 3-4 years, majorly because of its strong distribution network and product innovation. To guard itself from heavy competition, OEL has also focussed on exports. It has a healthy market share of 60% of total fans exported from India, with a strong presence in the Middle East and in Africa. It also exports fans to the US and some European countries. It has plans to increase its penetration deeper in all these markets (currently exporting to about 35 countries). It plans to add new products for exports.
GST is at 18% – a positive for the fans industry With GST at 18%, the price difference between branded and unbranded fans has reduced to Rs 150 vs. Rs 250 earlier. We expect a gradual shift to organised/branded players over the next 2-3 years. Also, with increasing spending power, the focus on the premium segment will increase. OEL is well-placed to capitalise this opportunity with its strong brand, products, and distribution network. In FY17, OEL launched Aero Quiet ceiling fans and is in the process of launching an entire range of Aero Quiet products over FY18-19. Its fans segment will see revenue CAGR of 12% over the next three years with about 20% growth in premium fans.
OEL’s fans segment to report a revenue CAGR of 12% over FY18-20
Source: Company, PhillipCapital India Research Estimates
Organised, 70%
Unorganised, 30%
Market size: Rs 60bn, 80mn
7.4 8.2
9.1 9.1 9.7
11.1
12.4
13.7
-
2
4
6
8
10
12
14
16
FY13 FY14 FY15 FY16 FY17 FY18e FY19e FY20e
Segment Industry Share (%) Ind. CAGR (%)
Ceiling fans 75% 8%
TPW Fans # 20% 20%
Exhaust Fans 5% 20%
OEL remains a strong player in all sub-segments
Channel check: Brand and distribution matters a lot in the fan industry. Over the last five years, many companies entered this market because of low entry barriers, but were not able to gain share or profits. UP Orient is one of the oldest brands with a strong pan-India presence. Over the last year, it has recreated its brand with a new logo and strong branding. Now it is known as a youth brand. It has very strong after-sales service in fans (also provides a replacement guarantee). Rajasthan - In Rajasthan, there are around 9,000 sub dealers in fans, out of which about 7,500 are with OEL. - Strong presence in this state with 48% market share (sells 1.1mn fans through the direct channel). - Its pricing is Rs 300 lower than Havells and Rs 100 lower than CG. - In Rajasthan, about 80% of OEL’s revenue comes from celling fans and about 20% from TPW (Table, Pedestal & Wall Fans). - OEL had lower market share in wall and exhaust fans. But over the last 1.5 years, it is increasing its market share through new product launches in this segment. Maharashtra The company has about 16% market share in the fans market in Maharashtra. It is increasing its footprint by adding more dealers, touch points, and locations. It has plans to take this market share to 25% over the next 2-3 years.
Page | 6 | PHILLIPCAPITAL INDIA RESEARCH
ORIENT PAPER & INDUSTRIES LTD INITIATING COVERAGE
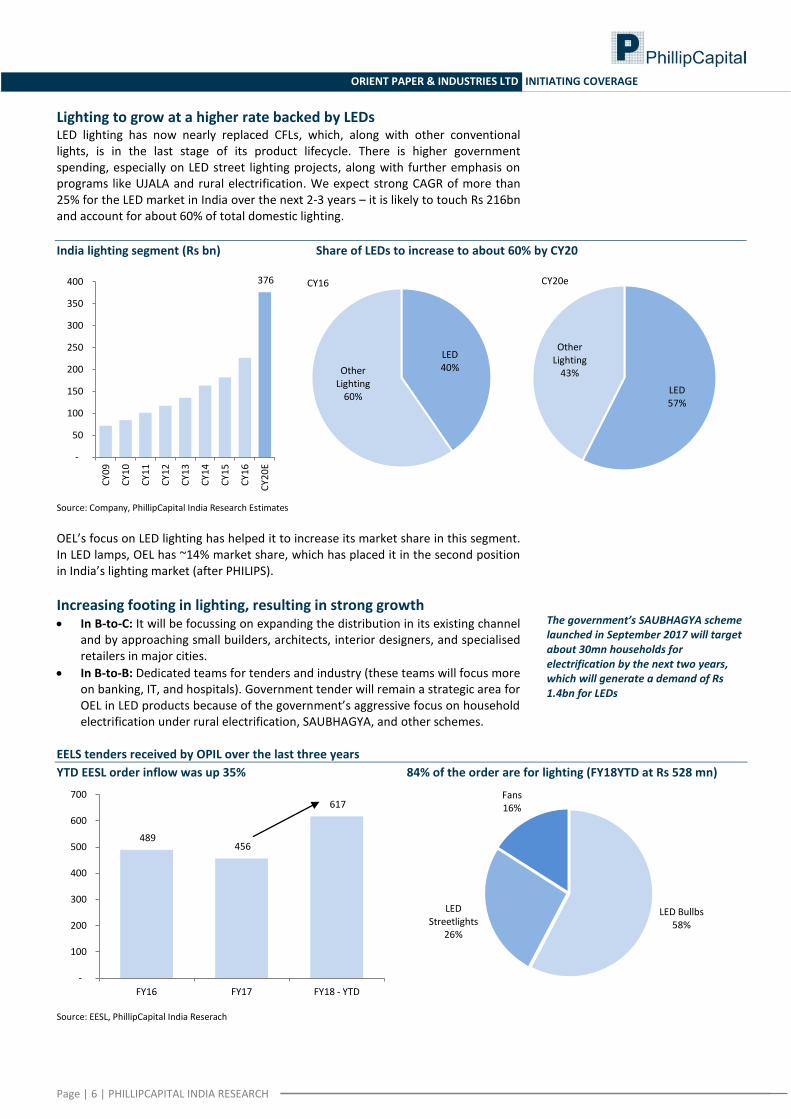
Lighting to grow at a higher rate backed by LEDs LED lighting has now nearly replaced CFLs, which, along with other conventional lights, is in the last stage of its product lifecycle. There is higher government spending, especially on LED street lighting projects, along with further emphasis on programs like UJALA and rural electrification. We expect strong CAGR of more than 25% for the LED market in India over the next 2-3 years – it is likely to touch Rs 216bn and account for about 60% of total domestic lighting.
India lighting segment (Rs bn) Share of LEDs to increase to about 60% by CY20
Source: Company, PhillipCapital India Research Estimates
OEL’s focus on LED lighting has helped it to increase its market share in this segment. In LED lamps, OEL has ~14% market share, which has placed it in the second position in India’s lighting market (after PHILIPS).
Increasing footing in lighting, resulting in strong growth In B-to-C: It will be focussing on expanding the distribution in its existing channel
and by approaching small builders, architects, interior designers, and specialised retailers in major cities.
In B-to-B: Dedicated teams for tenders and industry (these teams will focus more on banking, IT, and hospitals). Government tender will remain a strategic area for OEL in LED products because of the government’s aggressive focus on household electrification under rural electrification, SAUBHAGYA, and other schemes.
EELS tenders received by OPIL over the last three years
YTD EESL order inflow was up 35% 84% of the order are for lighting (FY18YTD at Rs 528 mn)
Source: EESL, PhillipCapital India Reserach
376
-
50
100
150
200
250
300
350
400
CY0
9
CY1
0
CY1
1
CY1
2
CY1
3
CY1
4
CY1
5
CY1
6
CY2
0E
LED 40% Other
Lighting 60%
CY16
LED 57%
Other Lighting
43%
CY20e
489 456
617
-
100
200
300
400
500
600
700
FY16 FY17 FY18 - YTD
LED Bullbs 58%
LED Streetlights
26%
Fans 16%
The government’s SAUBHAGYA scheme launched in September 2017 will target about 30mn households for electrification by the next two years, which will generate a demand of Rs 1.4bn for LEDs
Page | 7 | PHILLIPCAPITAL INDIA RESEARCH
ORIENT PAPER & INDUSTRIES LTD INITIATING COVERAGE
OEL has plans to increase its lighting business through more efficient manufacturing (innovative products), better channel management (increasing penetration), and by focussing more on professional lighting. Moving up in high-margin products in the lighting segment: 1) Street lighting: OEL has successfully entered into street lighting with the
execution of 20,000 streetlights across four states in India. This segment earns margins of about 14%.
2) Luminaries business: Increasing footprint and gaining market share in consumer and professional applications (in LED lamps, OEL has about 14% market share and in LED luminaries it has 2% share).
3) LED tubes: This is an emerging segment and OEL is setting up an automatic high-tech manufacturing facility at Noida. With this facility coming on stream, OEL’s market share in this segment should also increase.
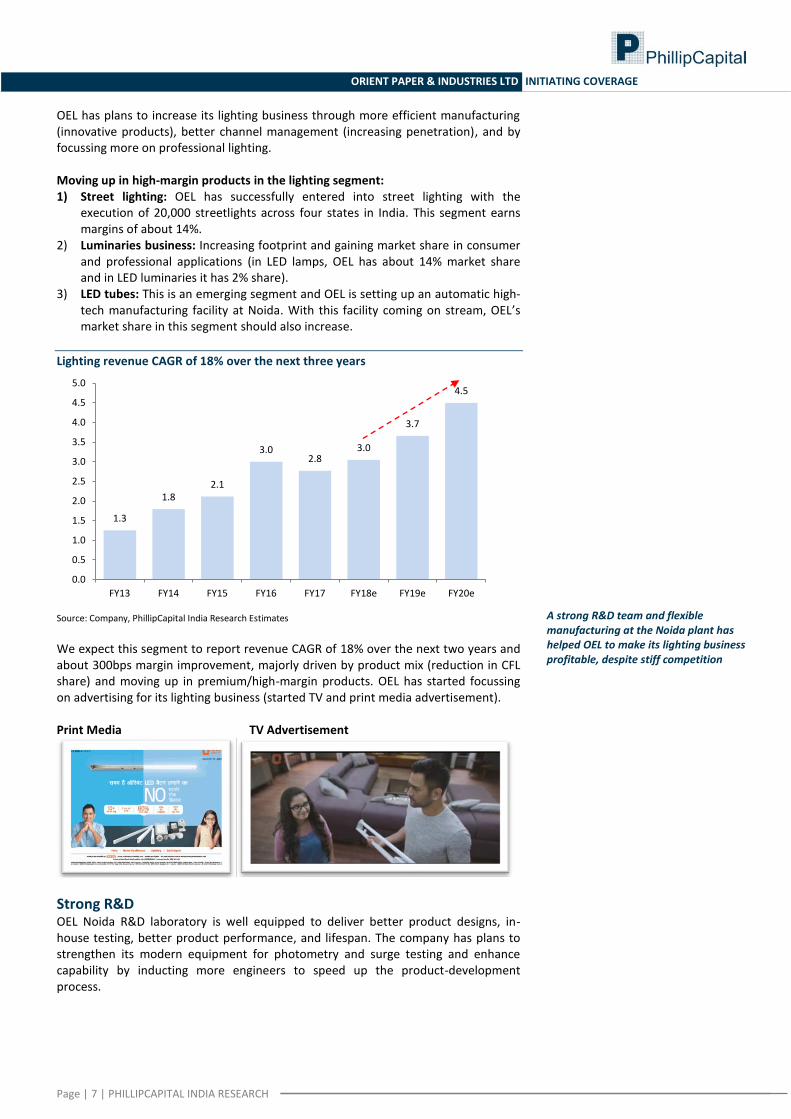
Lighting revenue CAGR of 18% over the next three years
Source: Company, PhillipCapital India Research Estimates
We expect this segment to report revenue CAGR of 18% over the next two years and about 300bps margin improvement, majorly driven by product mix (reduction in CFL share) and moving up in premium/high-margin products. OEL has started focussing on advertising for its lighting business (started TV and print media advertisement). Print Media TV Advertisement
Strong R&D OEL Noida R&D laboratory is well equipped to deliver better product designs, in-house testing, better product performance, and lifespan. The company has plans to strengthen its modern equipment for photometry and surge testing and enhance capability by inducting more engineers to speed up the product-development process.
1.3
1.8 2.1
3.0 2.8
3.0
3.7
4.5
0.0
0.5
1.0
1.5
2.0
2.5
3.0
3.5
4.0
4.5
5.0
FY13 FY14 FY15 FY16 FY17 FY18e FY19e FY20e
A strong R&D team and flexible manufacturing at the Noida plant has helped OEL to make its lighting business profitable, despite stiff competition
Page | 8 | PHILLIPCAPITAL INDIA RESEARCH
ORIENT PAPER & INDUSTRIES LTD INITIATING COVERAGE
Appliances is a fast-growing segment
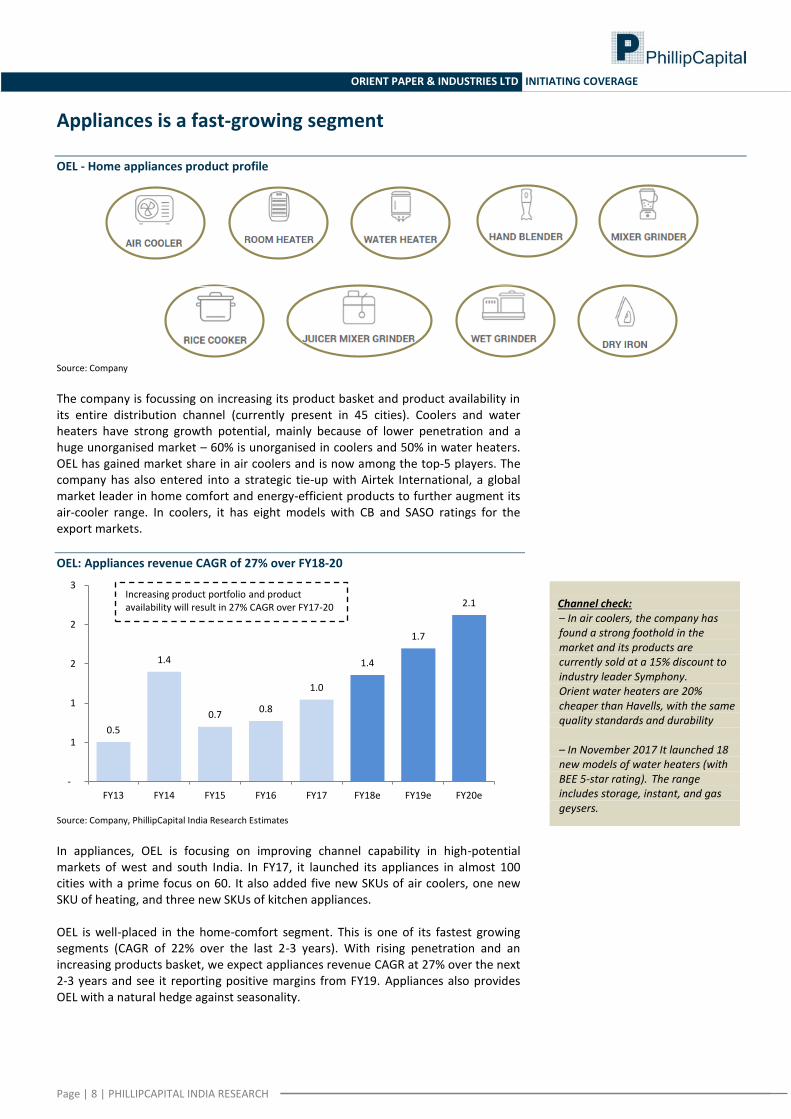
OEL - Home appliances product profile
Source: Company
The company is focussing on increasing its product basket and product availability in its entire distribution channel (currently present in 45 cities). Coolers and water heaters have strong growth potential, mainly because of lower penetration and a huge unorganised market – 60% is unorganised in coolers and 50% in water heaters. OEL has gained market share in air coolers and is now among the top-5 players. The company has also entered into a strategic tie-up with Airtek International, a global market leader in home comfort and energy-efficient products to further augment its air-cooler range. In coolers, it has eight models with CB and SASO ratings for the export markets.
OEL: Appliances revenue CAGR of 27% over FY18-20
Source: Company, PhillipCapital India Research Estimates
In appliances, OEL is focusing on improving channel capability in high-potential markets of west and south India. In FY17, it launched its appliances in almost 100 cities with a prime focus on 60. It also added five new SKUs of air coolers, one new SKU of heating, and three new SKUs of kitchen appliances. OEL is well-placed in the home-comfort segment. This is one of its fastest growing segments (CAGR of 22% over the last 2-3 years). With rising penetration and an increasing products basket, we expect appliances revenue CAGR at 27% over the next 2-3 years and see it reporting positive margins from FY19. Appliances also provides OEL with a natural hedge against seasonality.
0.5
1.4
0.7 0.8
1.0
1.4
1.7
2.1
-
1
1
2
2
3
FY13 FY14 FY15 FY16 FY17 FY18e FY19e FY20e
Increasing product portfolio and product availability will result in 27% CAGR over FY17-20
Channel check:
- – In air coolers, the company has found a strong foothold in the market and its products are currently sold at a 15% discount to industry leader Symphony.
- Orient water heaters are 20% cheaper than Havells, with the same quality standards and durability
- - – In November 2017 It launched 18
new models of water heaters (with BEE 5-star rating). The range includes storage, instant, and gas geysers.
Page | 9 | PHILLIPCAPITAL INDIA RESEARCH
ORIENT PAPER & INDUSTRIES LTD INITIATING COVERAGE
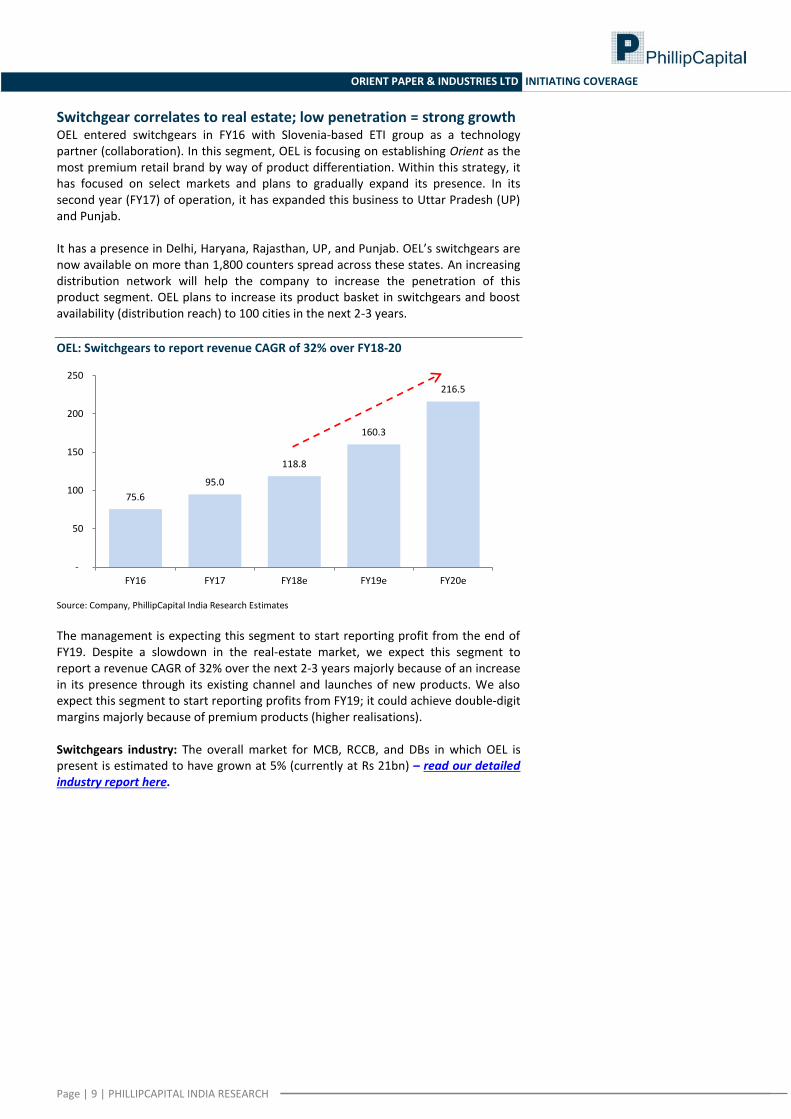
Switchgear correlates to real estate; low penetration = strong growth OEL entered switchgears in FY16 with Slovenia-based ETI group as a technology partner (collaboration). In this segment, OEL is focusing on establishing Orient as the most premium retail brand by way of product differentiation. Within this strategy, it has focused on select markets and plans to gradually expand its presence. In its second year (FY17) of operation, it has expanded this business to Uttar Pradesh (UP) and Punjab. It has a presence in Delhi, Haryana, Rajasthan, UP, and Punjab. OEL’s switchgears are now available on more than 1,800 counters spread across these states. An increasing distribution network will help the company to increase the penetration of this product segment. OEL plans to increase its product basket in switchgears and boost availability (distribution reach) to 100 cities in the next 2-3 years.
OEL: Switchgears to report revenue CAGR of 32% over FY18-20
Source: Company, PhillipCapital India Research Estimates
The management is expecting this segment to start reporting profit from the end of FY19. Despite a slowdown in the real-estate market, we expect this segment to report a revenue CAGR of 32% over the next 2-3 years majorly because of an increase in its presence through its existing channel and launches of new products. We also expect this segment to start reporting profits from FY19; it could achieve double-digit margins majorly because of premium products (higher realisations). Switchgears industry: The overall market for MCB, RCCB, and DBs in which OEL is present is estimated to have grown at 5% (currently at Rs 21bn) – read our detailed industry report here.
75.6
95.0
118.8
160.3
216.5
-
50
100
150
200
250
FY16 FY17 FY18e FY19e FY20e
Page | 10 | PHILLIPCAPITAL INDIA RESEARCH
ORIENT PAPER & INDUSTRIES LTD INITIATING COVERAGE
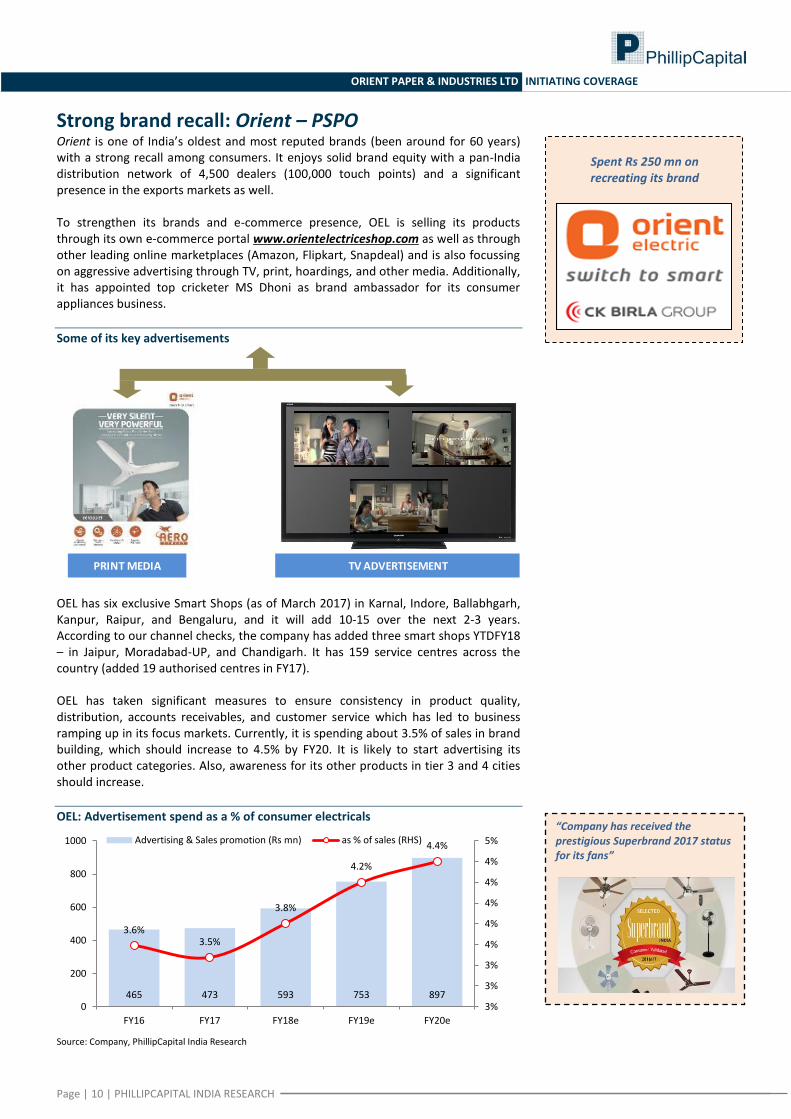
Strong brand recall: Orient – PSPO Orient is one of India’s oldest and most reputed brands (been around for 60 years) with a strong recall among consumers. It enjoys solid brand equity with a pan-India distribution network of 4,500 dealers (100,000 touch points) and a significant presence in the exports markets as well. To strengthen its brands and e-commerce presence, OEL is selling its products through its own e-commerce portal www.orientelectriceshop.com as well as through other leading online marketplaces (Amazon, Flipkart, Snapdeal) and is also focussing on aggressive advertising through TV, print, hoardings, and other media. Additionally, it has appointed top cricketer MS Dhoni as brand ambassador for its consumer appliances business.
Some of its key advertisements
OEL has six exclusive Smart Shops (as of March 2017) in Karnal, Indore, Ballabhgarh, Kanpur, Raipur, and Bengaluru, and it will add 10-15 over the next 2-3 years. According to our channel checks, the company has added three smart shops YTDFY18 – in Jaipur, Moradabad-UP, and Chandigarh. It has 159 service centres across the country (added 19 authorised centres in FY17). OEL has taken significant measures to ensure consistency in product quality, distribution, accounts receivables, and customer service which has led to business ramping up in its focus markets. Currently, it is spending about 3.5% of sales in brand building, which should increase to 4.5% by FY20. It is likely to start advertising its other product categories. Also, awareness for its other products in tier 3 and 4 cities should increase.
OEL: Advertisement spend as a % of consumer electricals
Source: Company, PhillipCapital India Research
PRINT MEDIA TV ADVERTISEMENT
465 473 593 753 897
3.6% 3.5%
3.8%
4.2%
4.4%
3%
3%
3%
4%
4%
4%
4%
4%
5%
0
200
400
600
800
1000
FY16 FY17 FY18e FY19e FY20e
Advertising & Sales promotion (Rs mn) as % of sales (RHS)
Spent Rs 250 mn on recreating its brand
“Company has received the prestigious Superbrand 2017 status for its fans”
Page | 11 | PHILLIPCAPITAL INDIA RESEARCH
ORIENT PAPER & INDUSTRIES LTD INITIATING COVERAGE
Orient Electric: Channel check We spoke to 10 of OEL’s channel partners in Maharashtra, Rajasthan, UP, and Delhi. Here are the key takeaways: • It is a market leader in fans, and also has strong brand recall in the middle and
upper middle class. • Over the last 1.5 years, it is focussing on recreating its brand (by changing the
brand logo and through aggressive branding). It is now known as a ‘youth brand’. • The new management is more focused and has aggressive plans. • It is using its strong network (channel) for new products verticals such as
appliances and switches. • It is giving more focus to quality and after-sales services. It gives replacement
guarantee for products such as fans. • In lighting, it is aggressively increasing its footprint (distribution network). • Its appliances do not yet have a strong presence.
Financials: OEL is cash rich Over FY12-17, OEL’s revenue CAGR was 13% and OPM was 7% in FY17. We expect this segment’s revenue CAGR at about 15% over FY17-20 with increasing product availability (channel sweating), improving product mix (new launches and moving up in premium products), and superior focus of the management on the businesses. We also expect a 200bps improvement in margins, majorly driven by lighting and home appliances based on two factors: • In lighting, the lower-margin CFL business’ share fell and the share of other high-
margin products such as LED and street lighting share will increase (these products enjoy higher margins of 10-15%).
• In home appliances, the launch of new products and increasing penetration will result in a 300bps improvement in margins over the next 2-3 years.
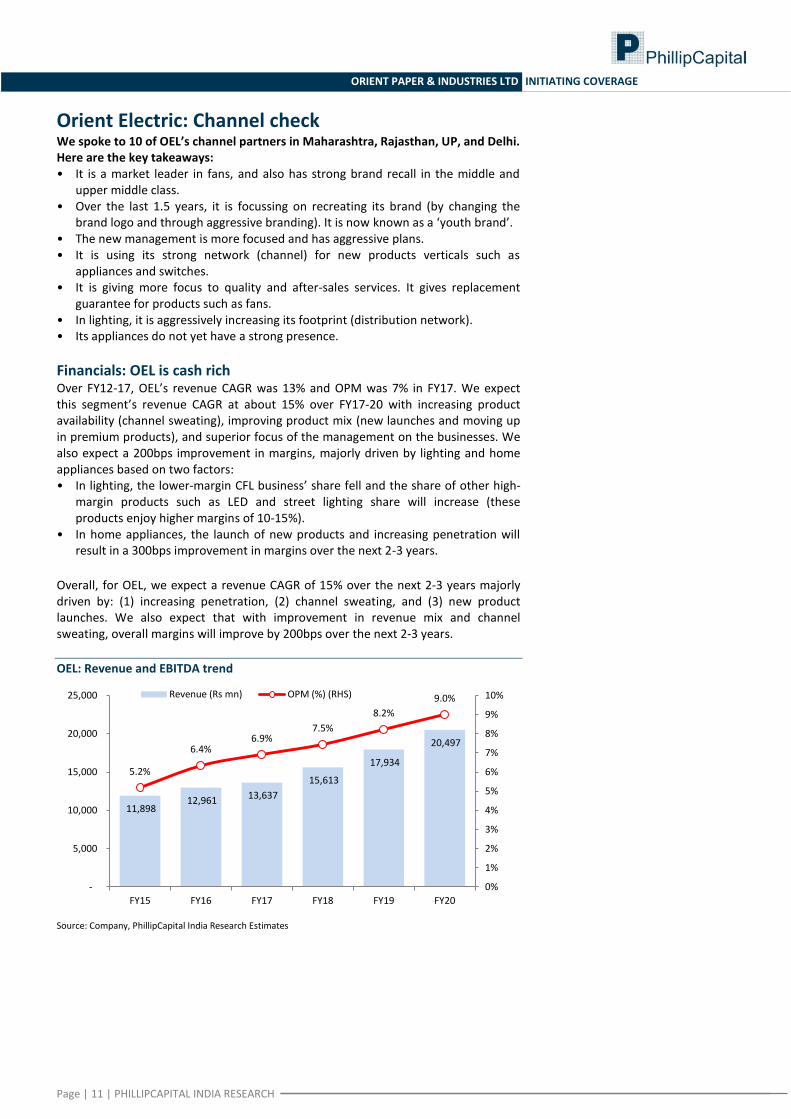
Overall, for OEL, we expect a revenue CAGR of 15% over the next 2-3 years majorly driven by: (1) increasing penetration, (2) channel sweating, and (3) new product launches. We also expect that with improvement in revenue mix and channel sweating, overall margins will improve by 200bps over the next 2-3 years.
OEL: Revenue and EBITDA trend
Source: Company, PhillipCapital India Research Estimates
11,898 12,961 13,637
15,613
17,934
20,497
5.2%
6.4% 6.9%
7.5%
8.2%
9.0%
0%
1%
2%
3%
4%
5%
6%
7%
8%
9%
10%
-
5,000
10,000
15,000
20,000
25,000
FY15 FY16 FY17 FY18 FY19 FY20
Revenue (Rs mn) OPM (%) (RHS)
Page | 12 | PHILLIPCAPITAL INDIA RESEARCH
ORIENT PAPER & INDUSTRIES LTD INITIATING COVERAGE
Segment-wise revenue of consumer durables Rs mn FY14 FY15 FY16 FY17 FY18e FY19e FY20e
Fan 8,195 9,084 9,116 9,728 11,090 12,421 13,663
Growth (%) 11% 11% 0% 7% 14% 12% 10%
Lighting 1,793 2,114 2,998 2,770 3,047 3,656 4,497
Growth (%) 43% 18% 42% -8% 10% 20% 23%
Home Appliances 1,397 699 772 1,044 1,357 1,697 2,121
Growth (%) 178% -50% 10% 35% 30% 25% 25%
Switchgear - - 76 95 119 160 216
Growth (%)
26% 25% 35% 35%
Total 11,385 11,898 12,961 13,637 15,613 17,934 20,497
Growth (%) 25% 4% 9% 5% 14% 15% 14%
Operating Margin ( Rs mn)*
617 824 943 1,164 1,478 1,846
OPM (%)*
5.2% 6.4% 6.9% 7.5% 8.2% 9.0%
Source: Company, PhillipCapital India Research Note:* PhillipCapital Estimate
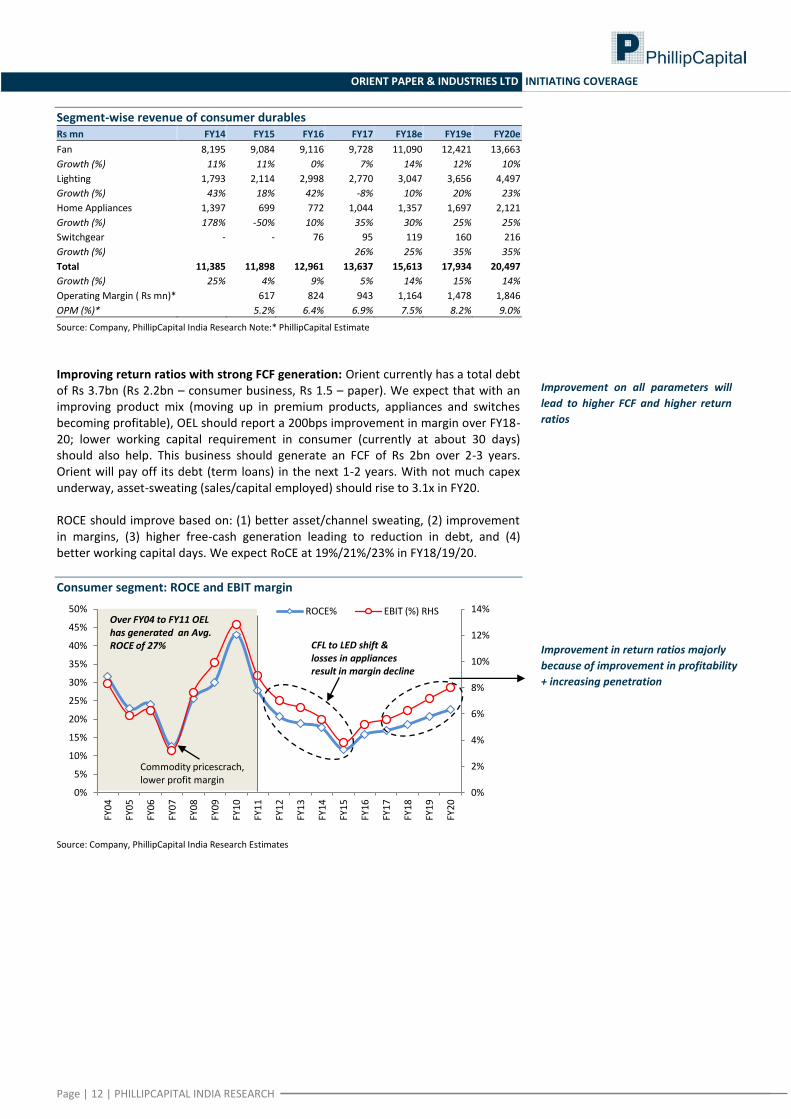
Improving return ratios with strong FCF generation: Orient currently has a total debt of Rs 3.7bn (Rs 2.2bn – consumer business, Rs 1.5 – paper). We expect that with an improving product mix (moving up in premium products, appliances and switches becoming profitable), OEL should report a 200bps improvement in margin over FY18-20; lower working capital requirement in consumer (currently at about 30 days) should also help. This business should generate an FCF of Rs 2bn over 2-3 years. Orient will pay off its debt (term loans) in the next 1-2 years. With not much capex underway, asset-sweating (sales/capital employed) should rise to 3.1x in FY20. ROCE should improve based on: (1) better asset/channel sweating, (2) improvement in margins, (3) higher free-cash generation leading to reduction in debt, and (4) better working capital days. We expect RoCE at 19%/21%/23% in FY18/19/20.
Consumer segment: ROCE and EBIT margin
Source: Company, PhillipCapital India Research Estimates
0%
2%
4%
6%
8%
10%
12%
14%
0%
5%
10%
15%
20%
25%
30%
35%
40%
45%
50%
FY0
4
FY0
5
FY0
6
FY0
7
FY0
8
FY0
9
FY1
0
FY1
1
FY1
2
FY1
3
FY1
4
FY1
5
FY1
6
FY1
7
FY1
8
FY1
9
FY2
0
ROCE% EBIT (%) RHS
CFL to LED shift & losses in appliances result in margin decline
Commodity pricescrach, lower profit margin
Over FY04 to FY11 OEL has generated an Avg. ROCE of 27%
Improvement on all parameters will
lead to higher FCF and higher return
ratios
Improvement in return ratios majorly
because of improvement in profitability
+ increasing penetration
Page | 13 | PHILLIPCAPITAL INDIA RESEARCH
ORIENT PAPER & INDUSTRIES LTD INITIATING COVERAGE
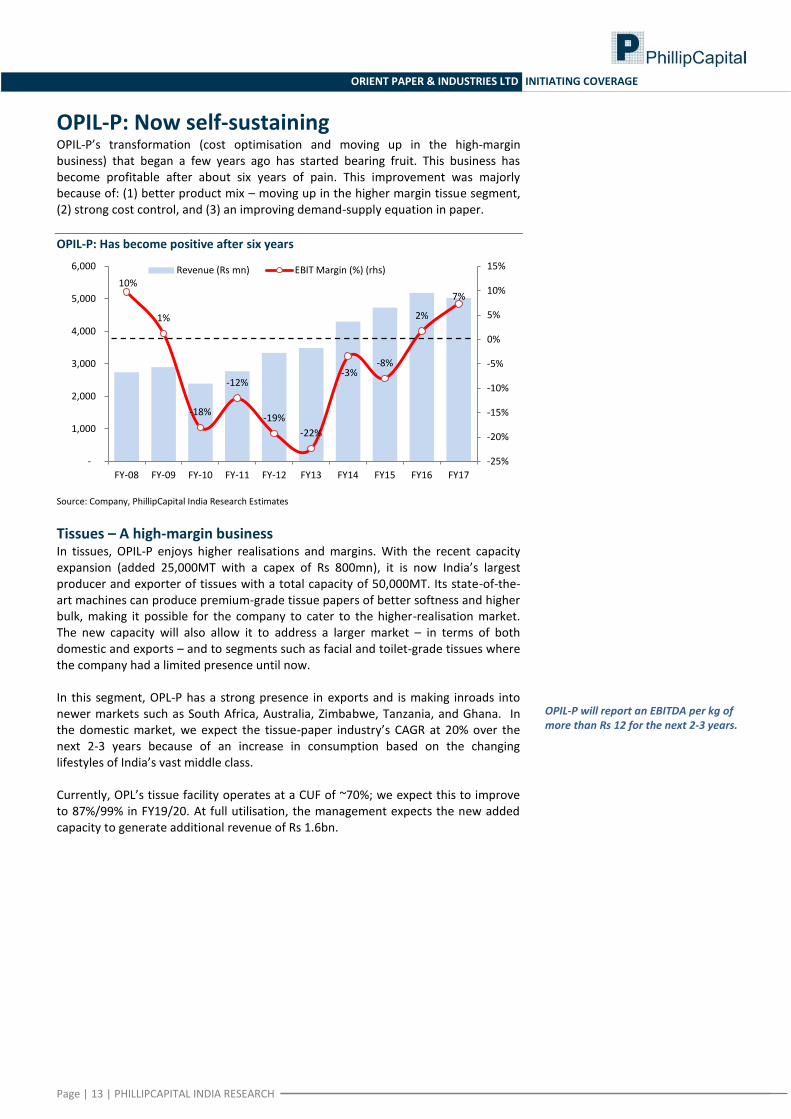
OPIL-P: Now self-sustaining OPIL-P’s transformation (cost optimisation and moving up in the high-margin business) that began a few years ago has started bearing fruit. This business has become profitable after about six years of pain. This improvement was majorly because of: (1) better product mix – moving up in the higher margin tissue segment, (2) strong cost control, and (3) an improving demand-supply equation in paper.
OPIL-P: Has become positive after six years
Source: Company, PhillipCapital India Research Estimates
Tissues – A high-margin business In tissues, OPIL-P enjoys higher realisations and margins. With the recent capacity expansion (added 25,000MT with a capex of Rs 800mn), it is now India’s largest producer and exporter of tissues with a total capacity of 50,000MT. Its state-of-the-art machines can produce premium-grade tissue papers of better softness and higher bulk, making it possible for the company to cater to the higher-realisation market. The new capacity will also allow it to address a larger market – in terms of both domestic and exports – and to segments such as facial and toilet-grade tissues where the company had a limited presence until now. In this segment, OPL-P has a strong presence in exports and is making inroads into newer markets such as South Africa, Australia, Zimbabwe, Tanzania, and Ghana. In the domestic market, we expect the tissue-paper industry’s CAGR at 20% over the next 2-3 years because of an increase in consumption based on the changing lifestyles of India’s vast middle class. Currently, OPL’s tissue facility operates at a CUF of ~70%; we expect this to improve to 87%/99% in FY19/20. At full utilisation, the management expects the new added capacity to generate additional revenue of Rs 1.6bn.
10%
1%
-18%
-12%
-19%
-22%
-3% -8%
2%
7%
-25%
-20%
-15%
-10%
-5%
0%
5%
10%
15%
-
1,000
2,000
3,000
4,000
5,000
6,000
FY-08 FY-09 FY-10 FY-11 FY-12 FY13 FY14 FY15 FY16 FY17
Revenue (Rs mn) EBIT Margin (%) (rhs)
OPIL-P will report an EBITDA per kg of more than Rs 12 for the next 2-3 years.
Page | 14 | PHILLIPCAPITAL INDIA RESEARCH
ORIENT PAPER & INDUSTRIES LTD INITIATING COVERAGE
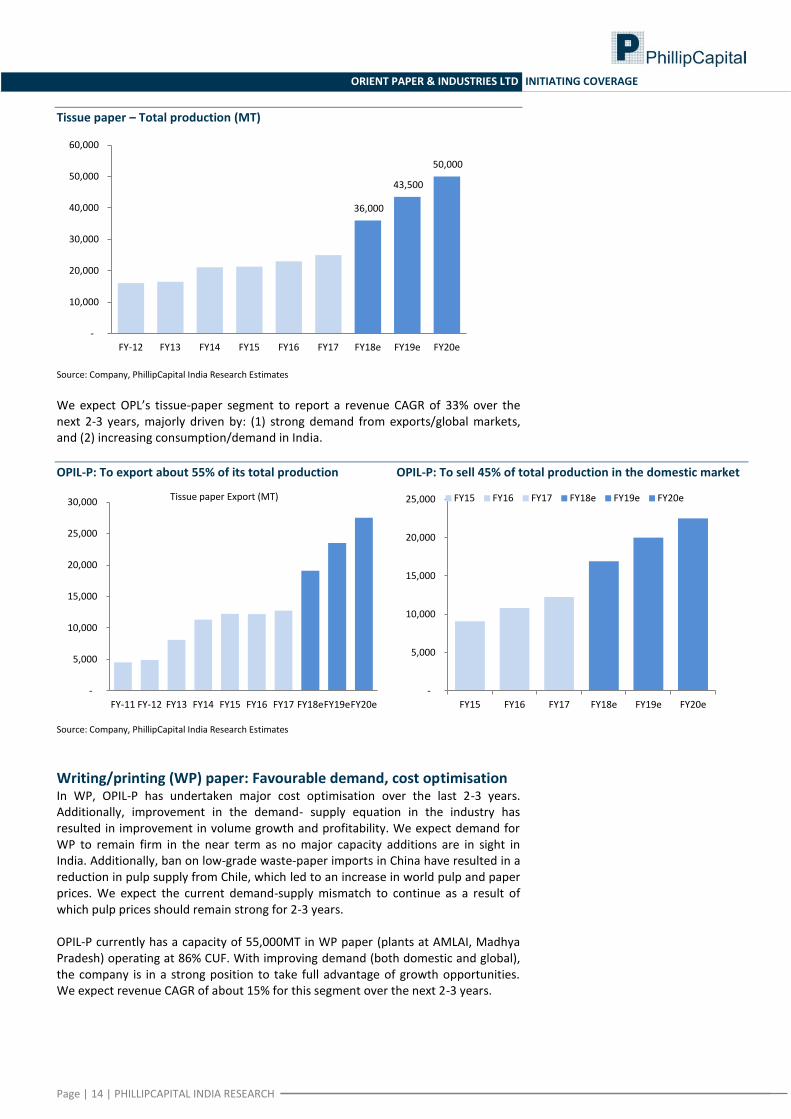
Tissue paper – Total production (MT)
Source: Company, PhillipCapital India Research Estimates
We expect OPL’s tissue-paper segment to report a revenue CAGR of 33% over the next 2-3 years, majorly driven by: (1) strong demand from exports/global markets, and (2) increasing consumption/demand in India.
OPIL-P: To export about 55% of its total production OPIL-P: To sell 45% of total production in the domestic market
Source: Company, PhillipCapital India Research Estimates
Writing/printing (WP) paper: Favourable demand, cost optimisation In WP, OPIL-P has undertaken major cost optimisation over the last 2-3 years. Additionally, improvement in the demand- supply equation in the industry has resulted in improvement in volume growth and profitability. We expect demand for WP to remain firm in the near term as no major capacity additions are in sight in India. Additionally, ban on low-grade waste-paper imports in China have resulted in a reduction in pulp supply from Chile, which led to an increase in world pulp and paper prices. We expect the current demand-supply mismatch to continue as a result of which pulp prices should remain strong for 2-3 years. OPIL-P currently has a capacity of 55,000MT in WP paper (plants at AMLAI, Madhya Pradesh) operating at 86% CUF. With improving demand (both domestic and global), the company is in a strong position to take full advantage of growth opportunities. We expect revenue CAGR of about 15% for this segment over the next 2-3 years.
36,000
43,500
50,000
-
10,000
20,000
30,000
40,000
50,000
60,000
FY-12 FY13 FY14 FY15 FY16 FY17 FY18e FY19e FY20e
-
5,000
10,000
15,000
20,000
25,000
30,000
FY-11 FY-12 FY13 FY14 FY15 FY16 FY17 FY18e FY19e FY20e
Tissue paper Export (MT)
-
5,000
10,000
15,000
20,000
25,000
FY15 FY16 FY17 FY18e FY19e FY20e
FY15 FY16 FY17 FY18e FY19e FY20e
Page | 15 | PHILLIPCAPITAL INDIA RESEARCH
ORIENT PAPER & INDUSTRIES LTD INITIATING COVERAGE
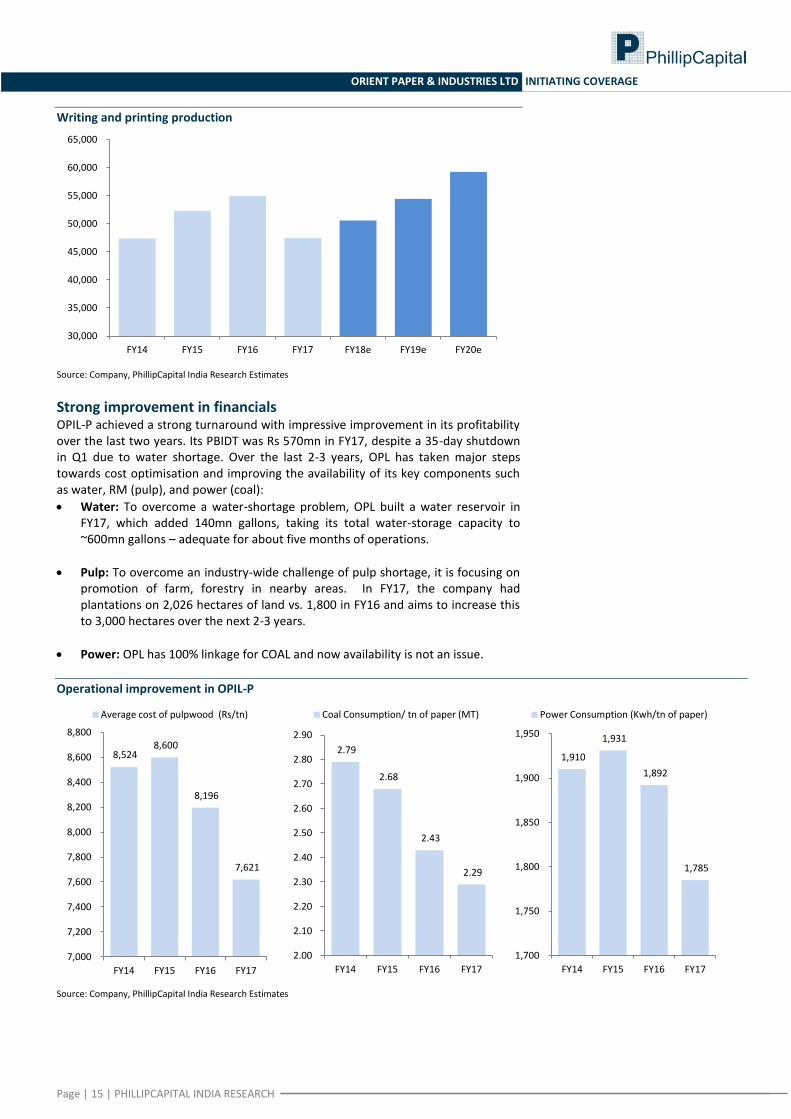
Writing and printing production
Source: Company, PhillipCapital India Research Estimates
Strong improvement in financials OPIL-P achieved a strong turnaround with impressive improvement in its profitability over the last two years. Its PBIDT was Rs 570mn in FY17, despite a 35-day shutdown in Q1 due to water shortage. Over the last 2-3 years, OPL has taken major steps towards cost optimisation and improving the availability of its key components such as water, RM (pulp), and power (coal):
Water: To overcome a water-shortage problem, OPL built a water reservoir in FY17, which added 140mn gallons, taking its total water-storage capacity to ~600mn gallons – adequate for about five months of operations.
Pulp: To overcome an industry-wide challenge of pulp shortage, it is focusing on promotion of farm, forestry in nearby areas. In FY17, the company had plantations on 2,026 hectares of land vs. 1,800 in FY16 and aims to increase this to 3,000 hectares over the next 2-3 years.
Power: OPL has 100% linkage for COAL and now availability is not an issue.
Operational improvement in OPIL-P
Source: Company, PhillipCapital India Research Estimates
30,000
35,000
40,000
45,000
50,000
55,000
60,000
65,000
FY14 FY15 FY16 FY17 FY18e FY19e FY20e
8,524 8,600
8,196
7,621
7,000
7,200
7,400
7,600
7,800
8,000
8,200
8,400
8,600
8,800
FY14 FY15 FY16 FY17
Average cost of pulpwood (Rs/tn)
2.79
2.68
2.43
2.29
2.00
2.10
2.20
2.30
2.40
2.50
2.60
2.70
2.80
2.90
FY14 FY15 FY16 FY17
Coal Consumption/ tn of paper (MT)
1,910
1,931
1,892
1,785
1,700
1,750
1,800
1,850
1,900
1,950
FY14 FY15 FY16 FY17
Power Consumption (Kwh/tn of paper)
Page | 16 | PHILLIPCAPITAL INDIA RESEARCH
ORIENT PAPER & INDUSTRIES LTD INITIATING COVERAGE
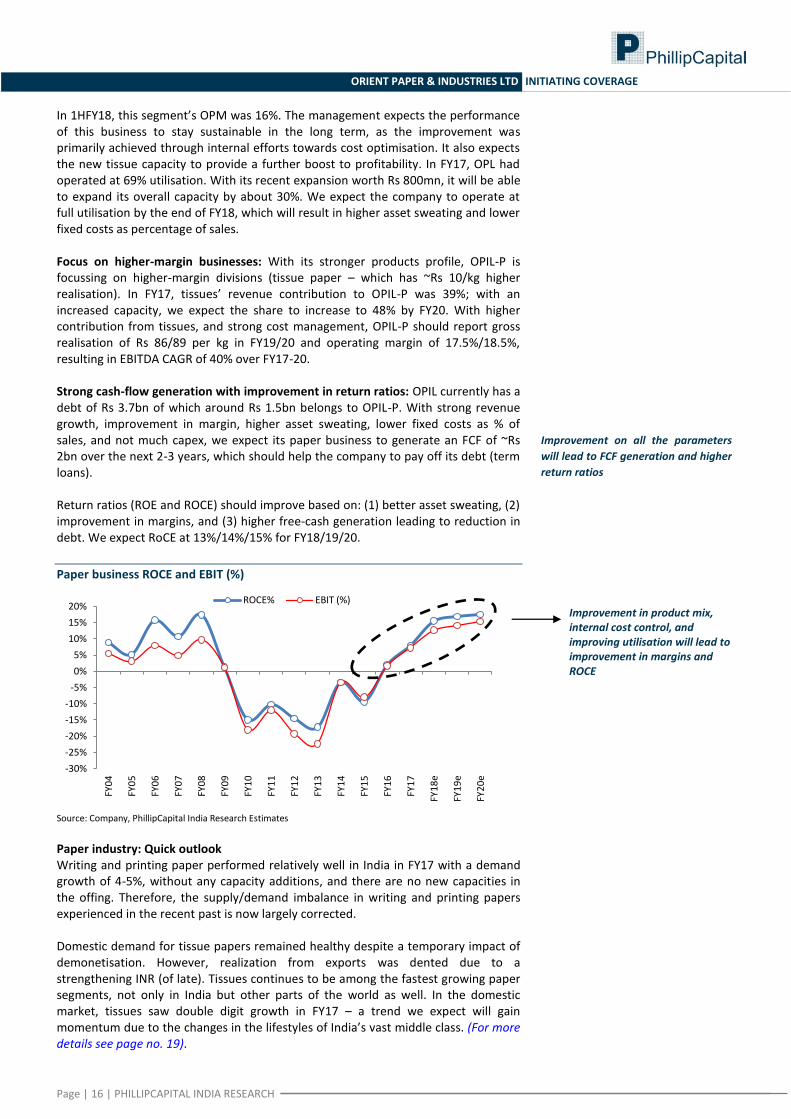
In 1HFY18, this segment’s OPM was 16%. The management expects the performance of this business to stay sustainable in the long term, as the improvement was primarily achieved through internal efforts towards cost optimisation. It also expects the new tissue capacity to provide a further boost to profitability. In FY17, OPL had operated at 69% utilisation. With its recent expansion worth Rs 800mn, it will be able to expand its overall capacity by about 30%. We expect the company to operate at full utilisation by the end of FY18, which will result in higher asset sweating and lower fixed costs as percentage of sales. Focus on higher-margin businesses: With its stronger products profile, OPIL-P is focussing on higher-margin divisions (tissue paper – which has ~Rs 10/kg higher realisation). In FY17, tissues’ revenue contribution to OPIL-P was 39%; with an increased capacity, we expect the share to increase to 48% by FY20. With higher contribution from tissues, and strong cost management, OPIL-P should report gross realisation of Rs 86/89 per kg in FY19/20 and operating margin of 17.5%/18.5%, resulting in EBITDA CAGR of 40% over FY17-20. Strong cash-flow generation with improvement in return ratios: OPIL currently has a debt of Rs 3.7bn of which around Rs 1.5bn belongs to OPIL-P. With strong revenue growth, improvement in margin, higher asset sweating, lower fixed costs as % of sales, and not much capex, we expect its paper business to generate an FCF of ~Rs 2bn over the next 2-3 years, which should help the company to pay off its debt (term loans). Return ratios (ROE and ROCE) should improve based on: (1) better asset sweating, (2) improvement in margins, and (3) higher free-cash generation leading to reduction in debt. We expect RoCE at 13%/14%/15% for FY18/19/20.
Paper business ROCE and EBIT (%)
Source: Company, PhillipCapital India Research Estimates
Paper industry: Quick outlook Writing and printing paper performed relatively well in India in FY17 with a demand growth of 4-5%, without any capacity additions, and there are no new capacities in the offing. Therefore, the supply/demand imbalance in writing and printing papers experienced in the recent past is now largely corrected. Domestic demand for tissue papers remained healthy despite a temporary impact of demonetisation. However, realization from exports was dented due to a strengthening INR (of late). Tissues continues to be among the fastest growing paper segments, not only in India but other parts of the world as well. In the domestic market, tissues saw double digit growth in FY17 – a trend we expect will gain momentum due to the changes in the lifestyles of India’s vast middle class. (For more details see page no. 19).
-30%
-25%
-20%
-15%
-10%
-5%
0%
5%
10%
15%
20%
FY0
4
FY0
5
FY0
6
FY0
7
FY0
8
FY0
9
FY1
0
FY1
1
FY1
2
FY1
3
FY1
4
FY1
5
FY1
6
FY1
7
FY1
8e
FY1
9e
FY2
0e
ROCE% EBIT (%)
Improvement on all the parameters
will lead to FCF generation and higher
return ratios
Improvement in product mix, internal cost control, and improving utilisation will lead to improvement in margins and ROCE
Page | 17 | PHILLIPCAPITAL INDIA RESEARCH
ORIENT PAPER & INDUSTRIES LTD INITIATING COVERAGE
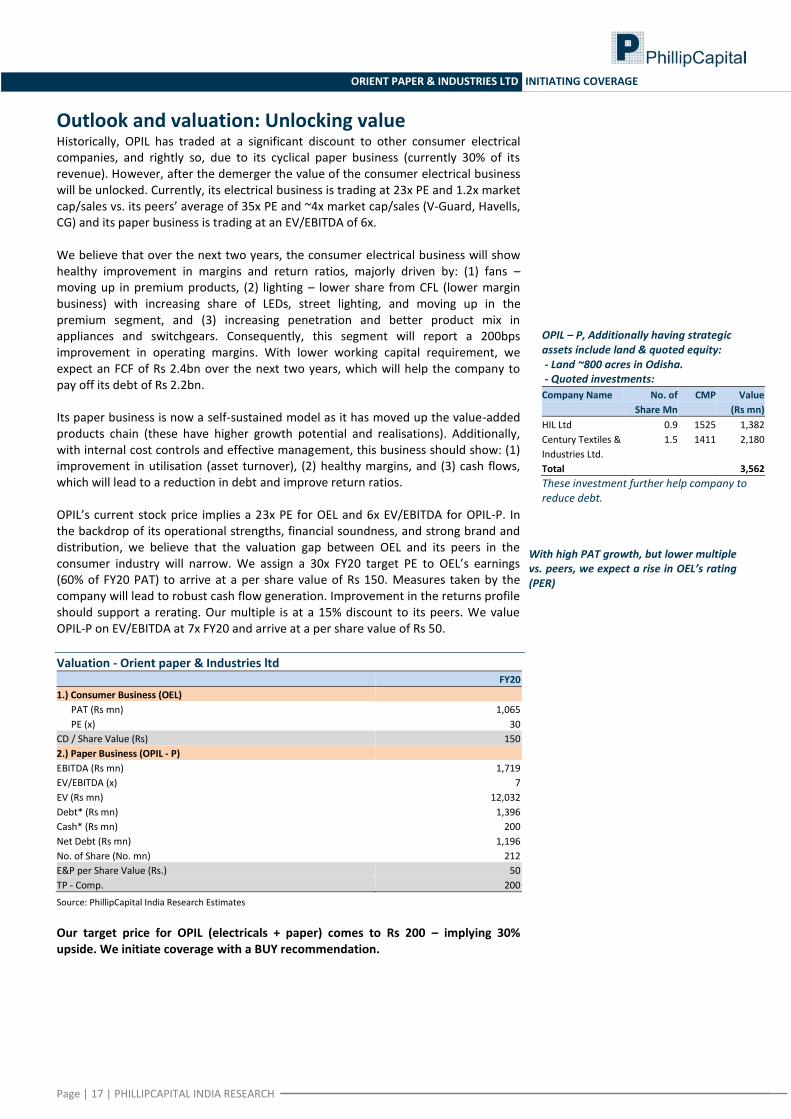
Outlook and valuation: Unlocking value Historically, OPIL has traded at a significant discount to other consumer electrical companies, and rightly so, due to its cyclical paper business (currently 30% of its revenue). However, after the demerger the value of the consumer electrical business will be unlocked. Currently, its electrical business is trading at 23x PE and 1.2x market cap/sales vs. its peers’ average of 35x PE and ~4x market cap/sales (V-Guard, Havells, CG) and its paper business is trading at an EV/EBITDA of 6x. We believe that over the next two years, the consumer electrical business will show healthy improvement in margins and return ratios, majorly driven by: (1) fans – moving up in premium products, (2) lighting – lower share from CFL (lower margin business) with increasing share of LEDs, street lighting, and moving up in the premium segment, and (3) increasing penetration and better product mix in appliances and switchgears. Consequently, this segment will report a 200bps improvement in operating margins. With lower working capital requirement, we expect an FCF of Rs 2.4bn over the next two years, which will help the company to pay off its debt of Rs 2.2bn. Its paper business is now a self-sustained model as it has moved up the value-added products chain (these have higher growth potential and realisations). Additionally, with internal cost controls and effective management, this business should show: (1) improvement in utilisation (asset turnover), (2) healthy margins, and (3) cash flows, which will lead to a reduction in debt and improve return ratios. OPIL’s current stock price implies a 23x PE for OEL and 6x EV/EBITDA for OPIL-P. In the backdrop of its operational strengths, financial soundness, and strong brand and distribution, we believe that the valuation gap between OEL and its peers in the consumer industry will narrow. We assign a 30x FY20 target PE to OEL’s earnings (60% of FY20 PAT) to arrive at a per share value of Rs 150. Measures taken by the company will lead to robust cash flow generation. Improvement in the returns profile should support a rerating. Our multiple is at a 15% discount to its peers. We value OPIL-P on EV/EBITDA at 7x FY20 and arrive at a per share value of Rs 50.
Valuation - Orient paper & Industries ltd
FY20
1.) Consumer Business (OEL)
PAT (Rs mn) 1,065
PE (x) 30
CD / Share Value (Rs) 150
2.) Paper Business (OPIL - P)
EBITDA (Rs mn) 1,719
EV/EBITDA (x) 7
EV (Rs mn) 12,032
Debt* (Rs mn) 1,396
Cash* (Rs mn) 200
Net Debt (Rs mn) 1,196
No. of Share (No. mn) 212
E&P per Share Value (Rs.) 50
TP - Comp. 200
Source: PhillipCapital India Research Estimates
Our target price for OPIL (electricals + paper) comes to Rs 200 – implying 30% upside. We initiate coverage with a BUY recommendation.
With high PAT growth, but lower multiple vs. peers, we expect a rise in OEL’s rating (PER)
OPIL – P, Additionally having strategic assets include land & quoted equity: - Land ~800 acres in Odisha. - Quoted investments:
Company Name No. of
Share Mn
CMP
Value
(Rs mn)
HIL Ltd 0.9 1525 1,382
Century Textiles &
Industries Ltd.
1.5 1411 2,180
Total 3,562
These investment further help company to reduce debt.
Page | 18 | PHILLIPCAPITAL INDIA RESEARCH
ORIENT PAPER & INDUSTRIES LTD INITIATING COVERAGE
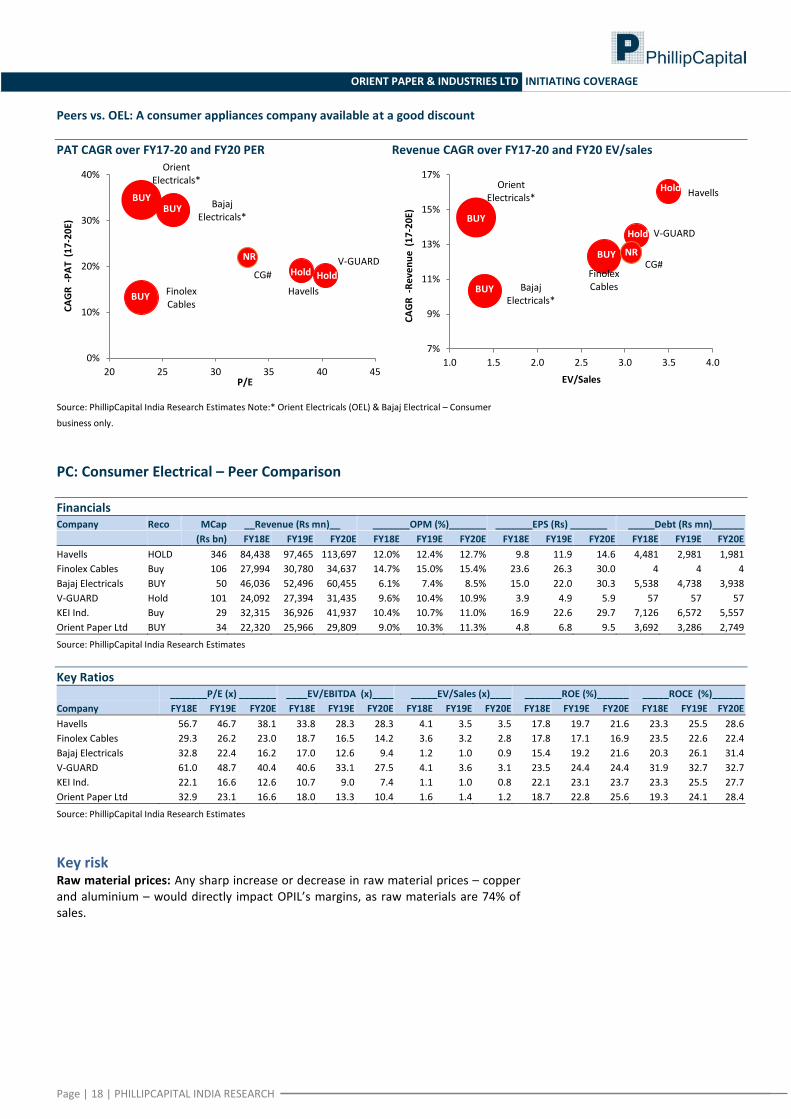
Peers vs. OEL: A consumer appliances company available at a good discount
PAT CAGR over FY17-20 and FY20 PER Revenue CAGR over FY17-20 and FY20 EV/sales
Source: PhillipCapital India Research Estimates Note:* Orient Electricals (OEL) & Bajaj Electrical – Consumer
business only.
PC: Consumer Electrical – Peer Comparison
Financials Company Reco MCap
(Rs bn)
__Revenue (Rs mn)__ _______OPM (%)_______ _______EPS (Rs) _______ _____Debt (Rs mn)______
FY18E FY19E FY20E FY18E FY19E FY20E FY18E FY19E FY20E FY18E FY19E FY20E
Havells HOLD 346 84,438 97,465 113,697 12.0% 12.4% 12.7% 9.8 11.9 14.6 4,481 2,981 1,981
Finolex Cables Buy 106 27,994 30,780 34,637 14.7% 15.0% 15.4% 23.6 26.3 30.0 4 4 4
Bajaj Electricals BUY 50 46,036 52,496 60,455 6.1% 7.4% 8.5% 15.0 22.0 30.3 5,538 4,738 3,938
V-GUARD Hold 101 24,092 27,394 31,435 9.6% 10.4% 10.9% 3.9 4.9 5.9 57 57 57
KEI Ind. Buy 29 32,315 36,926 41,937 10.4% 10.7% 11.0% 16.9 22.6 29.7 7,126 6,572 5,557
Orient Paper Ltd BUY 34 22,320 25,966 29,809 9.0% 10.3% 11.3% 4.8 6.8 9.5 3,692 3,286 2,749
Source: PhillipCapital India Research Estimates
Key Ratios
_______P/E (x) _______ ____EV/EBITDA (x)____ _____EV/Sales (x)____ _______ROE (%)______ _____ROCE (%)______
Company FY18E FY19E FY20E FY18E FY19E FY20E FY18E FY19E FY20E FY18E FY19E FY20E FY18E FY19E FY20E
Havells 56.7 46.7 38.1 33.8 28.3 28.3 4.1 3.5 3.5 17.8 19.7 21.6 23.3 25.5 28.6
Finolex Cables 29.3 26.2 23.0 18.7 16.5 14.2 3.6 3.2 2.8 17.8 17.1 16.9 23.5 22.6 22.4
Bajaj Electricals 32.8 22.4 16.2 17.0 12.6 9.4 1.2 1.0 0.9 15.4 19.2 21.6 20.3 26.1 31.4
V-GUARD 61.0 48.7 40.4 40.6 33.1 27.5 4.1 3.6 3.1 23.5 24.4 24.4 31.9 32.7 32.7
KEI Ind. 22.1 16.6 12.6 10.7 9.0 7.4 1.1 1.0 0.8 22.1 23.1 23.7 23.3 25.5 27.7
Orient Paper Ltd 32.9 23.1 16.6 18.0 13.3 10.4 1.6 1.4 1.2 18.7 22.8 25.6 19.3 24.1 28.4
Source: PhillipCapital India Research Estimates
Key risk Raw material prices: Any sharp increase or decrease in raw material prices – copper and aluminium – would directly impact OPIL’s margins, as raw materials are 74% of sales.
Havells Finolex Cables
Bajaj Electricals*
V-GUARD
Orient Electricals*
CG#
0%
10%
20%
30%
40%
20 25 30 35 40 45
CA
GR
-P
AT
(1
7-2
0E)
P/E
BUY
Hold
BUY
Hold
NR
BUY
Havells
Finolex Cables Bajaj
Electricals*
V-GUARD
Orient Electricals*
CG#
7%
9%
11%
13%
15%
17%
1.0 1.5 2.0 2.5 3.0 3.5 4.0
CA
GR
-R
eve
nu
e (
17
-20
E)
EV/Sales
BUY
BUY
Hold
BUY
Hold
NR
Page | 19 | PHILLIPCAPITAL INDIA RESEARCH
ORIENT PAPER & INDUSTRIES LTD INITIATING COVERAGE
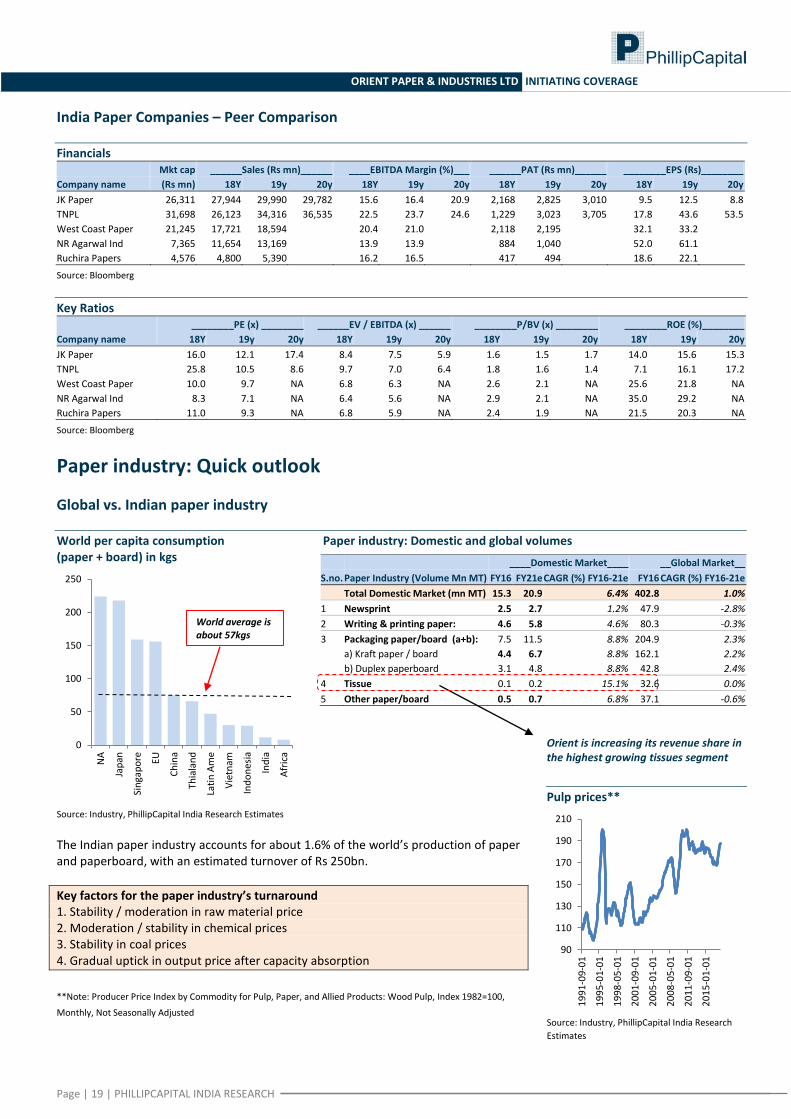
India Paper Companies – Peer Comparison
Financials Mkt cap ______Sales (Rs mn)______ ____EBITDA Margin (%)___ ______PAT (Rs mn)______ ________EPS (Rs)________
Company name (Rs mn) 18Y 19y 20y 18Y 19y 20y 18Y 19y 20y 18Y 19y 20y
JK Paper 26,311 27,944 29,990 29,782 15.6 16.4 20.9 2,168 2,825 3,010 9.5 12.5 8.8
TNPL 31,698 26,123 34,316 36,535 22.5 23.7 24.6 1,229 3,023 3,705 17.8 43.6 53.5
West Coast Paper 21,245 17,721 18,594
20.4 21.0
2,118 2,195
32.1 33.2
NR Agarwal Ind 7,365 11,654 13,169
13.9 13.9
884 1,040
52.0 61.1
Ruchira Papers 4,576 4,800 5,390
16.2 16.5
417 494
18.6 22.1
Source: Bloomberg
Key Ratios ________PE (x) ________ ______EV / EBITDA (x) ______ ________P/BV (x) ________ ________ROE (%)________
Company name 18Y 19y 20y 18Y 19y 20y 18Y 19y 20y 18Y 19y 20y
JK Paper 16.0 12.1 17.4 8.4 7.5 5.9 1.6 1.5 1.7 14.0 15.6 15.3
TNPL 25.8 10.5 8.6 9.7 7.0 6.4 1.8 1.6 1.4 7.1 16.1 17.2
West Coast Paper 10.0 9.7 NA 6.8 6.3 NA 2.6 2.1 NA 25.6 21.8 NA
NR Agarwal Ind 8.3 7.1 NA 6.4 5.6 NA 2.9 2.1 NA 35.0 29.2 NA
Ruchira Papers 11.0 9.3 NA 6.8 5.9 NA 2.4 1.9 NA 21.5 20.3 NA
Source: Bloomberg
Paper industry: Quick outlook
Global vs. Indian paper industry
World per capita consumption Paper industry: Domestic and global volumes (paper + board) in kgs
Source: Industry, PhillipCapital India Research Estimates
The Indian paper industry accounts for about 1.6% of the world’s production of paper and paperboard, with an estimated turnover of Rs 250bn.
Key factors for the paper industry’s turnaround 1. Stability / moderation in raw material price 2. Moderation / stability in chemical prices 3. Stability in coal prices 4. Gradual uptick in output price after capacity absorption
**Note: Producer Price Index by Commodity for Pulp, Paper, and Allied Products: Wood Pulp, Index 1982=100,
Monthly, Not Seasonally Adjusted
0
50
100
150
200
250
NA
Jap
an
Sin
gap
ore
EU
Ch
ina
Thia
lan
d
Lati
n A
me
Vie
tnam
Ind
on
esia
Ind
ia
Afr
ica
World average is about 57kgs
S.no. Paper Industry (Volume Mn MT)
____Domestic Market____ __Global Market__
FY16 FY21e CAGR (%) FY16-21e FY16 CAGR (%) FY16-21e
Total Domestic Market (mn MT) 15.3 20.9 6.4% 402.8 1.0%
1 Newsprint 2.5 2.7 1.2% 47.9 -2.8%
2 Writing & printing paper: 4.6 5.8 4.6% 80.3 -0.3%
3 Packaging paper/board (a+b): 7.5 11.5 8.8% 204.9 2.3%
a) Kraft paper / board 4.4 6.7 8.8% 162.1 2.2%
b) Duplex paperboard 3.1 4.8 8.8% 42.8 2.4%
4 Tissue 0.1 0.2 15.1% 32.6 0.0%
5 Other paper/board 0.5 0.7 6.8% 37.1 -0.6%
Orient is increasing its revenue share in the highest growing tissues segment Pulp prices**
Source: Industry, PhillipCapital India Research
Estimates
90
110
130
150
170
190
210
19
91
-09
-01
19
95
-01
-01
19
98
-05
-01
20
01
-09
-01
20
05
-01
-01
20
08
-05
-01
20
11
-09
-01
20
15
-01
-01
Page | 20 | PHILLIPCAPITAL INDIA RESEARCH
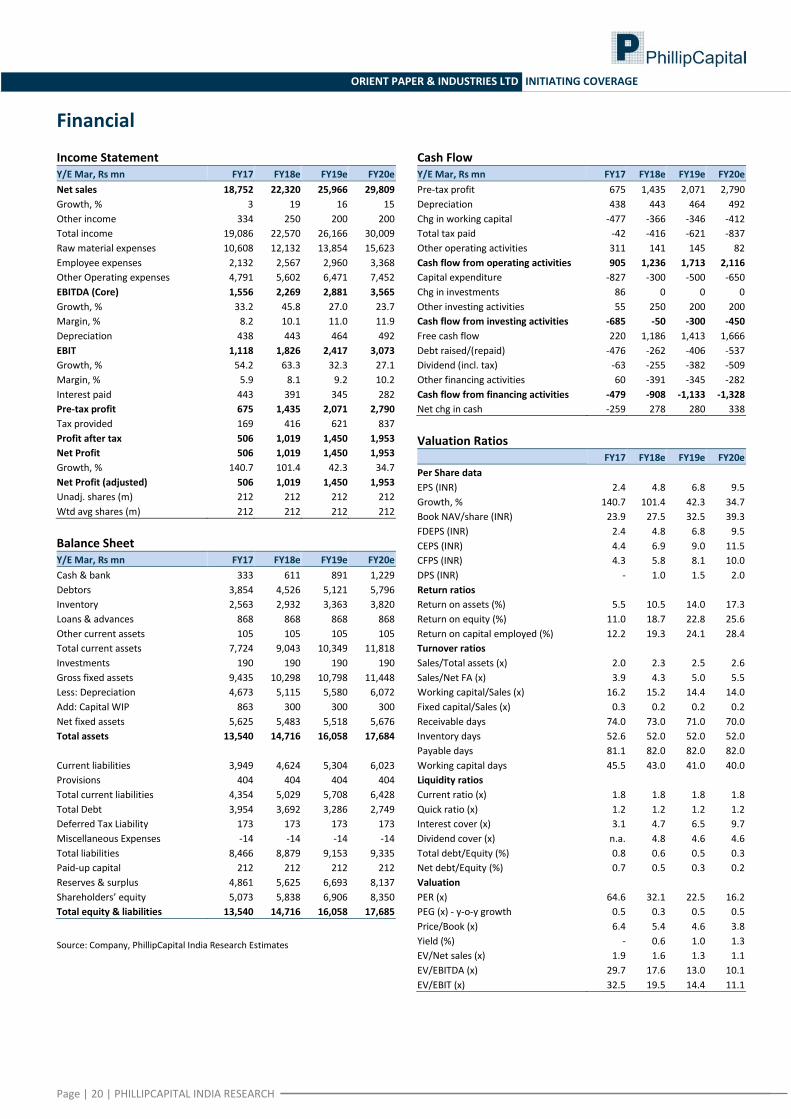
ORIENT PAPER & INDUSTRIES LTD INITIATING COVERAGE
Financial Income Statement Y/E Mar, Rs mn FY17 FY18e FY19e FY20e
Net sales 18,752 22,320 25,966 29,809
Growth, % 3 19 16 15
Other income 334 250 200 200
Total income 19,086 22,570 26,166 30,009
Raw material expenses 10,608 12,132 13,854 15,623
Employee expenses 2,132 2,567 2,960 3,368
Other Operating expenses 4,791 5,602 6,471 7,452
EBITDA (Core) 1,556 2,269 2,881 3,565
Growth, % 33.2 45.8 27.0 23.7
Margin, % 8.2 10.1 11.0 11.9
Depreciation 438 443 464 492
EBIT 1,118 1,826 2,417 3,073
Growth, % 54.2 63.3 32.3 27.1
Margin, % 5.9 8.1 9.2 10.2
Interest paid 443 391 345 282
Pre-tax profit 675 1,435 2,071 2,790
Tax provided 169 416 621 837
Profit after tax 506 1,019 1,450 1,953
Net Profit 506 1,019 1,450 1,953
Growth, % 140.7 101.4 42.3 34.7
Net Profit (adjusted) 506 1,019 1,450 1,953
Unadj. shares (m) 212 212 212 212
Wtd avg shares (m) 212 212 212 212
Balance Sheet Y/E Mar, Rs mn FY17 FY18e FY19e FY20e
Cash & bank 333 611 891 1,229
Debtors 3,854 4,526 5,121 5,796
Inventory 2,563 2,932 3,363 3,820
Loans & advances 868 868 868 868
Other current assets 105 105 105 105
Total current assets 7,724 9,043 10,349 11,818
Investments 190 190 190 190
Gross fixed assets 9,435 10,298 10,798 11,448
Less: Depreciation 4,673 5,115 5,580 6,072
Add: Capital WIP 863 300 300 300
Net fixed assets 5,625 5,483 5,518 5,676
Total assets 13,540 14,716 16,058 17,684
Current liabilities 3,949 4,624 5,304 6,023
Provisions 404 404 404 404
Total current liabilities 4,354 5,029 5,708 6,428
Total Debt 3,954 3,692 3,286 2,749
Deferred Tax Liability 173 173 173 173
Miscellaneous Expenses -14 -14 -14 -14
Total liabilities 8,466 8,879 9,153 9,335
Paid-up capital 212 212 212 212
Reserves & surplus 4,861 5,625 6,693 8,137
Shareholders’ equity 5,073 5,838 6,906 8,350
Total equity & liabilities 13,540 14,716 16,058 17,685
Source: Company, PhillipCapital India Research Estimates
Cash Flow Y/E Mar, Rs mn FY17 FY18e FY19e FY20e
Pre-tax profit 675 1,435 2,071 2,790
Depreciation 438 443 464 492
Chg in working capital -477 -366 -346 -412
Total tax paid -42 -416 -621 -837
Other operating activities 311 141 145 82
Cash flow from operating activities 905 1,236 1,713 2,116
Capital expenditure -827 -300 -500 -650
Chg in investments 86 0 0 0
Other investing activities 55 250 200 200
Cash flow from investing activities -685 -50 -300 -450
Free cash flow 220 1,186 1,413 1,666
Debt raised/(repaid) -476 -262 -406 -537
Dividend (incl. tax) -63 -255 -382 -509
Other financing activities 60 -391 -345 -282
Cash flow from financing activities -479 -908 -1,133 -1,328
Net chg in cash -259 278 280 338
Valuation Ratios
FY17 FY18e FY19e FY20e
Per Share data
EPS (INR) 2.4 4.8 6.8 9.5
Growth, % 140.7 101.4 42.3 34.7
Book NAV/share (INR) 23.9 27.5 32.5 39.3
FDEPS (INR) 2.4 4.8 6.8 9.5
CEPS (INR) 4.4 6.9 9.0 11.5
CFPS (INR) 4.3 5.8 8.1 10.0
DPS (INR) - 1.0 1.5 2.0
Return ratios
Return on assets (%) 5.5 10.5 14.0 17.3
Return on equity (%) 11.0 18.7 22.8 25.6
Return on capital employed (%) 12.2 19.3 24.1 28.4
Turnover ratios
Sales/Total assets (x) 2.0 2.3 2.5 2.6
Sales/Net FA (x) 3.9 4.3 5.0 5.5
Working capital/Sales (x) 16.2 15.2 14.4 14.0
Fixed capital/Sales (x) 0.3 0.2 0.2 0.2
Receivable days 74.0 73.0 71.0 70.0
Inventory days 52.6 52.0 52.0 52.0
Payable days 81.1 82.0 82.0 82.0
Working capital days 45.5 43.0 41.0 40.0
Liquidity ratios
Current ratio (x) 1.8 1.8 1.8 1.8
Quick ratio (x) 1.2 1.2 1.2 1.2
Interest cover (x) 3.1 4.7 6.5 9.7
Dividend cover (x) n.a. 4.8 4.6 4.6
Total debt/Equity (%) 0.8 0.6 0.5 0.3
Net debt/Equity (%) 0.7 0.5 0.3 0.2
Valuation
PER (x) 64.6 32.1 22.5 16.2
PEG (x) - y-o-y growth 0.5 0.3 0.5 0.5
Price/Book (x) 6.4 5.4 4.6 3.8
Yield (%) - 0.6 1.0 1.3
EV/Net sales (x) 1.9 1.6 1.3 1.1
EV/EBITDA (x) 29.7 17.6 13.0 10.1
EV/EBIT (x) 32.5 19.5 14.4 11.1
Page | 21 | PHILLIPCAPITAL INDIA RESEARCH
ORIENT PAPER & INDUSTRIES LTD INITIATING COVERAGE
Rating Methodology We rate stock on absolute return basis. Our target price for the stocks has an investment horizon of one year.
Rating Criteria Definition
BUY >= +15% Target price is equal to or more than 15% of current market price
NEUTRAL -15% > to < +15% Target price is less than +15% but more than -15%
SELL <= -15% Target price is less than or equal to -15%.
Management Vineet Bhatnagar (Managing Director) (91 22) 2483 1919
Kinshuk Bharti Tiwari (Head – Institutional Equity) (91 22) 6246 4101
Jignesh Shah (Head – Equity Derivatives) (91 22) 6667 9735
Research
Automobiles
Engineering, Capital Goods
Pharma & Specialty Chem
Dhawal Doshi (9122) 6246 4128
Jonas Bhutta (9122) 6246 4119
Surya Patra (9122) 6246 4121
Nitesh Sharma, CFA (9122) 6246 4126
Vikram Rawat (9122) 6246 4120
Mehul Sheth (9122) 6246 4123
Banking, NBFCs
IT Services & Infrastructure
Strategy
Manish Agarwalla (9122) 6246 4125
Vibhor Singhal (9122) 6246 4109
Naveen Kulkarni, CFA, FRM (9122) 6246 4122
Pradeep Agrawal (9122) 6246 4113
Shyamal Dhruve (9122) 6246 4110
Neeraj Chadawar (9122) 6246 4116
Paresh Jain (9122) 6246 4114
Logistics, Transportation & Midcap
Telecom
Consumer & Retail
Vikram Suryavanshi (9122) 6246 4111
Naveen Kulkarni, CFA, FRM (9122) 6246 4122
Naveen Kulkarni, CFA, FRM (9122) 6246 4122
Media
Preeyam Tolia (9122) 6246 4129
Naveen Kulkarni, CFA, FRM (9122) 6246 4122
Technicals
Vishal Gutka (9122) 6246 4118
Vishal Gutka (9122) 6246 4118
Subodh Gupta, CMT (9122) 6246 4136
Cement
Metals
Production Manager
Vaibhav Agarwal (9122) 6246 4124
Dhawal Doshi (9122) 6246 4128
Ganesh Deorukhkar (9122) 6667 9966
Economics
Vipul Agrawal (9122) 6246 4127
Editor
Anjali Verma (9122) 6246 4115
Mid-Caps
Roshan Sony 98199 72726
Deepak Agarwal (9122) 6246 4112
Sr. Manager – Equities Support
Rosie Ferns (9122) 6667 9971
Sales & Distribution
Corporate Communications
Ashvin Patil (9122) 6246 4105
Asia Sales
Zarine Damania (9122) 6667 9976
Kishor Binwal (9122) 6246 4106
Dhawal Shah 8522 277 6747
Bhavin Shah (9122) 6246 4102
Sales Trader
Ashka Mehta Gulati (9122) 6246 4108
Dilesh Doshi (9122) 6667 9747
Execution
Archan Vyas (9122) 6246 4107
Suniil Pandit (9122) 6667 9745
Mayur Shah (9122) 6667 9945
Contact Information (Regional Member Companies)
SINGAPORE: Phillip Securities Pte Ltd
250 North Bridge Road, #06-00 RafflesCityTower,
Singapore 179101
Tel : (65) 6533 6001 Fax: (65) 6535 3834
www.phillip.com.sg
MALAYSIA: Phillip Capital Management Sdn Bhd
B-3-6 Block B Level 3, Megan Avenue II,
No. 12, Jalan Yap Kwan Seng, 50450 Kuala Lumpur
Tel (60) 3 2162 8841 Fax (60) 3 2166 5099
www.poems.com.my
HONG KONG: Phillip Securities (HK) Ltd
11/F United Centre 95 Queensway Hong Kong
Tel (852) 2277 6600 Fax: (852) 2868 5307
www.phillip.com.hk
JAPAN: Phillip Securities Japan, Ltd
4-2 Nihonbashi Kabutocho, Chuo-ku
Tokyo 103-0026
Tel: (81) 3 3666 2101 Fax: (81) 3 3664 0141
www.phillip.co.jp
INDONESIA: PT Phillip Securities Indonesia
ANZTower Level 23B, Jl Jend Sudirman Kav 33A,
Jakarta 10220, Indonesia
Tel (62) 21 5790 0800 Fax: (62) 21 5790 0809
www.phillip.co.id
CHINA: Phillip Financial Advisory (Shanghai) Co. Ltd.
No 550 Yan An East Road, OceanTower Unit 2318
Shanghai 200 001
Tel (86) 21 5169 9200 Fax: (86) 21 6351 2940
www.phillip.com.cn
THAILAND: Phillip Securities (Thailand) Public Co. Ltd.
15th Floor, VorawatBuilding, 849 Silom Road,
Silom, Bangrak, Bangkok 10500 Thailand
Tel (66) 2 2268 0999 Fax: (66) 2 2268 0921
www.phillip.co.th
FRANCE: King & Shaxson Capital Ltd.
3rd Floor, 35 Rue de la Bienfaisance
75008 Paris France
Tel (33) 1 4563 3100 Fax : (33) 1 4563 6017
www.kingandshaxson.com
UNITED KINGDOM: King & Shaxson Ltd.
6th Floor, Candlewick House, 120 Cannon Street
London, EC4N 6AS
Tel (44) 20 7929 5300 Fax: (44) 20 7283 6835
www.kingandshaxson.com
UNITED STATES: Phillip Futures Inc.
141 W Jackson Blvd Ste 3050
The Chicago Board of TradeBuilding
Chicago, IL 60604 USA
Tel (1) 312 356 9000 Fax: (1) 312 356 9005
AUSTRALIA: PhillipCapital Australia
Level 10, 330 Collins Street
Melbourne, VIC 3000, Australia
Tel: (61) 3 8633 9800 Fax: (61) 3 8633 9899
www.phillipcapital.com.au
SRI LANKA: Asha Phillip Securities Limited
Level 4, Millennium House, 46/58 Navam Mawatha,
Colombo 2, Sri Lanka
Tel: (94) 11 2429 100 Fax: (94) 11 2429 199
www.ashaphillip.net/home.htm
INDIA
PhillipCapital (India) Private Limited
No. 1, 18th Floor, Urmi Estate, 95 Ganpatrao Kadam Marg, Lower Parel West, Mumbai 400013 Tel: (9122) 2483 1919 Fax: (9122) 6667 9955 www.phillipcapital.in
Page | 22 | PHILLIPCAPITAL INDIA RESEARCH
ORIENT PAPER & INDUSTRIES LTD INITIATING COVERAGE
Disclosures and Disclaimers PhillipCapital (India) Pvt. Ltd. has three independent equity research groups: Institutional Equities, Institutional Equity Derivatives, and Private Client Group. This report has been prepared by Institutional Equities Group. The views and opinions expressed in this document may, may not match, or may be contrary at times with the views, estimates, rating, and target price of the other equity research groups of PhillipCapital (India) Pvt. Ltd.
This report is issued by PhillipCapital (India) Pvt. Ltd., which is regulated by the SEBI. PhillipCapital (India) Pvt. Ltd. is a subsidiary of Phillip (Mauritius) Pvt. Ltd. References to "PCIPL" in this report shall mean PhillipCapital (India) Pvt. Ltd unless otherwise stated. This report is prepared and distributed by PCIPL for information purposes only, and neither the information contained herein, nor any opinion expressed should be construed or deemed to be construed as solicitation or as offering advice for the purposes of the purchase or sale of any security, investment, or derivatives. The information and opinions contained in the report were considered by PCIPL to be valid when published. The report also contains information provided to PCIPL by third parties. The source of such information will usually be disclosed in the report. Whilst PCIPL has taken all reasonable steps to ensure that this information is correct, PCIPL does not offer any warranty as to the accuracy or completeness of such information. Any person placing reliance on the report to undertake trading does so entirely at his or her own risk and PCIPL does not accept any liability as a result. Securities and Derivatives markets may be subject to rapid and unexpected price movements and past performance is not necessarily an indication of future performance.
This report does not regard the specific investment objectives, financial situation, and the particular needs of any specific person who may receive this report. Investors must undertake independent analysis with their own legal, tax, and financial advisors and reach their own conclusions regarding the appropriateness of investing in any securities or investment strategies discussed or recommended in this report and should understand that statements regarding future prospects may not be realised. Under no circumstances can it be used or considered as an offer to sell or as a solicitation of any offer to buy or sell the securities mentioned within it. The information contained in the research reports may have been taken from trade and statistical services and other sources, which PCIL believe is reliable. PhillipCapital (India) Pvt. Ltd. or any of its group/associate/affiliate companies do not guarantee that such information is accurate or complete and it should not be relied upon as such. Any opinions expressed reflect judgments at this date and are subject to change without notice.
Important: These disclosures and disclaimers must be read in conjunction with the research report of which it forms part. Receipt and use of the research report is subject to all aspects of these disclosures and disclaimers. Additional information about the issuers and securities discussed in this research report is available on request.
Certifications: The research analyst(s) who prepared this research report hereby certifies that the views expressed in this research report accurately reflect the research analyst’s personal views about all of the subject issuers and/or securities, that the analyst(s) have no known conflict of interest and no part of the research analyst’s compensation was, is, or will be, directly or indirectly, related to the specific views or recommendations contained in this research report.
Additional Disclosures of Interest: Unless specifically mentioned in Point No. 9 below: 1. The Research Analyst(s), PCIL, or its associates or relatives of the Research Analyst does not have any financial interest in the company(ies) covered in
this report. 2. The Research Analyst, PCIL or its associates or relatives of the Research Analyst affiliates collectively do not hold more than 1% of the securities of the
company (ies)covered in this report as of the end of the month immediately preceding the distribution of the research report. 3. The Research Analyst, his/her associate, his/her relative, and PCIL, do not have any other material conflict of interest at the time of publication of this
research report. 4. The Research Analyst, PCIL, and its associates have not received compensation for investment banking or merchant banking or brokerage services or for
any other products or services from the company(ies) covered in this report, in the past twelve months. 5. The Research Analyst, PCIL or its associates have not managed or co-managed in the previous twelve months, a private or public offering of securities for
the company (ies) covered in this report. 6. PCIL or its associates have not received compensation or other benefits from the company(ies) covered in this report or from any third party, in
connection with the research report. 7. The Research Analyst has not served as an Officer, Director, or employee of the company (ies) covered in the Research report. 8. The Research Analyst and PCIL has not been engaged in market making activity for the company(ies) covered in the Research report. 9. Details of PCIL, Research Analyst and its associates pertaining to the companies covered in the Research report:
Sr. no. Particulars Yes/No
1 Whether compensation has been received from the company(ies) covered in the Research report in the past 12 months for investment banking transaction by PCIL
No
2 Whether Research Analyst, PCIL or its associates or relatives of the Research Analyst affiliates collectively hold more than 1% of the company(ies) covered in the Research report
No
3 Whether compensation has been received by PCIL or its associates from the company(ies) covered in the Research report No
4 PCIL or its affiliates have managed or co-managed in the previous twelve months a private or public offering of securities for the company(ies) covered in the Research report
No
5 Research Analyst, his associate, PCIL or its associates have received compensation for investment banking or merchant banking or brokerage services or for any other products or services from the company(ies) covered in the Research report, in the last twelve months
No
Independence: PhillipCapital (India) Pvt. Ltd. has not had an investment banking relationship with, and has not received any compensation for investment banking services from, the subject issuers in the past twelve (12) months, and PhillipCapital (India) Pvt. Ltd does not anticipate receiving or intend to seek compensation for investment banking services from the subject issuers in the next three (3) months. PhillipCapital (India) Pvt. Ltd is not a market maker in the securities mentioned in this research report, although it, or its affiliates/employees, may have positions in, purchase or sell, or be materially interested in any of the securities covered in the report.
Suitability and Risks: This research report is for informational purposes only and is not tailored to the specific investment objectives, financial situation or particular requirements of any individual recipient hereof. Certain securities may give rise to substantial risks and may not be suitable for certain investors. Each investor must make its own determination as to the appropriateness of any securities referred to in this research report based upon the legal, tax and accounting considerations applicable to such investor and its own investment objectives or strategy, its financial situation and its investing experience. The value of any security may be positively or adversely affected by changes in foreign exchange or interest rates, as well as by other financial, economic, or political factors. Past performance is not necessarily indicative of future performance or results.
Page | 23 | PHILLIPCAPITAL INDIA RESEARCH
ORIENT PAPER & INDUSTRIES LTD INITIATING COVERAGE
Sources, Completeness and Accuracy: The material herein is based upon information obtained from sources that PCIPL and the research analyst believe to be reliable, but neither PCIPL nor the research analyst represents or guarantees that the information contained herein is accurate or complete and it should not be relied upon as such. Opinions expressed herein are current opinions as of the date appearing on this material, and are subject to change without notice. Furthermore, PCIPL is under no obligation to update or keep the information current. Without limiting any of the foregoing, in no event shall PCIL, any of its affiliates/employees or any third party involved in, or related to computing or compiling the information have any liability for any damages of any kind including but not limited to any direct or consequential loss or damage, however arising, from the use of this document.
Copyright: The copyright in this research report belongs exclusively to PCIPL. All rights are reserved. Any unauthorised use or disclosure is prohibited. No reprinting or reproduction, in whole or in part, is permitted without the PCIPL’s prior consent, except that a recipient may reprint it for internal circulation only and only if it is reprinted in its entirety.
Caution: Risk of loss in trading/investment can be substantial and even more than the amount / margin given by you. Investment in securities market are subject to market risks, you are requested to read all the related documents carefully before investing. You should carefully consider whether trading/investment is appropriate for you in light of your experience, objectives, financial resources and other relevant circumstances. PhillipCapital and any of its employees, directors, associates, group entities, or affiliates shall not be liable for losses, if any, incurred by you. You are further cautioned that trading/investments in financial markets are subject to market risks and are advised to seek independent third party trading/investment advice outside PhillipCapital/group/associates/affiliates/directors/employees before and during your trading/investment. There is no guarantee/assurance as to returns or profits or capital protection or appreciation. PhillipCapital and any of its employees, directors, associates, and/or employees, directors, associates of PhillipCapital’s group entities or affiliates is not inducing you for trading/investing in the financial market(s). Trading/Investment decision is your sole responsibility. You must also read the Risk Disclosure Document and Do’s and Don’ts before investing.
Kindly note that past performance is not necessarily a guide to future performance.
For Detailed Disclaimer: Please visit our website www.phillipcapital.in
For U.S. persons only: This research report is a product of PhillipCapital (India) Pvt Ltd., which is the employer of the research analyst(s) who has prepared the research report. The research analyst(s) preparing the research report is/are resident outside the United States (U.S.) and are not associated persons of any U.S.-regulated broker-dealer and therefore the analyst(s) is/are not subject to supervision by a U.S. broker-dealer, and is/are not required to satisfy the regulatory licensing requirements of FINRA or required to otherwise comply with U.S. rules or regulations regarding, among other things, communications with a subject company, public appearances, and trading securities held by a research analyst account.
This report is intended for distribution by PhillipCapital (India) Pvt Ltd. only to "Major Institutional Investors" as defined by Rule 15a-6(b)(4) of the U.S. Securities and Exchange Act, 1934 (the Exchange Act) and interpretations thereof by the U.S. Securities and Exchange Commission (SEC) in reliance on Rule 15a 6(a)(2). If the recipient of this report is not a Major Institutional Investor as specified above, then it should not act upon this report and return the same to the sender. Further, this report may not be copied, duplicated, and/or transmitted onward to any U.S. person, which is not a Major Institutional Investor. In reliance on the exemption from registration provided by Rule 15a-6 of the Exchange Act and interpretations thereof by the SEC in order to conduct certain
business with Major Institutional Investors, PhillipCapital (India) Pvt Ltd. has entered into an agreement with a U.S. registered broker-dealer, Decker & Co, LLC. Transactions in securities discussed in this research report should be effected through Decker & Co, LLC or another U.S. registered broker dealer.
If Distribution is to Australian Investors This report is produced by PhillipCapital (India) Pvt Ltd and is being distributed in Australia by Phillip Capital Limited (Australian Financial Services Licence No. 246827).
This report contains general securities advice and does not take into account your personal objectives, situation and needs. Please read the Disclosures and Disclaimers set out above. By receiving or reading this report, you agree to be bound by the terms and limitations set out above. Any failure to comply with
these terms and limitations may constitute a violation of law. This report has been provided to you for personal use only and shall not be reproduced, distributed or published by you in whole or in part, for any purpose. If you have received this report by mistake, please delete or destroy it, and notify the sender immediately.
PhillipCapital (India) Pvt. Ltd. Registered office: No. 1, 18th Floor, Urmi Estate, 95 Ganpatrao Kadam Marg, Lower Parel West, Mumbai 400013