institutional equity research consumer...
TRANSCRIPT

INSTITUTIONAL EQUITY RESEARCH
Page | 1 | PHILLIPCAPITAL INDIA RESEARCH
Consumer sector
Most FMCGs to see single-digit sales declines
INDIA | FMCG | Q3FY17 Results Preview
4 January 2017
In Q3FY17, we expect most major FMCG companies to report subdued numbers because of loss
of sales due to the Indian government’s demonetisation move on 8th November. We expect our
consumer universe (ex Nestle, ITC) to show 2% revenue/EBITDA decline.
Key themes
Demonetisation to hit sales of all consumer companies, albeit to different extents: Our channel
checks across the country indicate that in the two weeks after demonetisation, secondary sales
were down by 30-40% for most FMCGs. However, since the last week of November, and in
December, sales recovered, and were down 5-15% on an average at the secondary level
(distributor-to-traders) for larger players. Smaller players, local brands, and unorganised players
– which have a larger exposure to the wholesale channel – have been hit harder with a decline of
more than 15% due to lower financial muscle and direct distribution reach, and higher financial
stress after demonetisation.
Channel filing in December to aid Q3 performance: Our channel checks indicate that primary
sales (company to distributors/dealers) may be higher than secondary sales in December because
of an increase in inventory with distributors/dealers. This may have helped the sales force in
some companies to manage their quarterly targets. The difference between primary sales growth
and secondary sales growth will be a key metric to track in Q3/Q4 to understand the level of sales
recovery.
Decline in ad spends to aid EBITDA: Due to demonetisation, many companies including Dabur
and HUL, have cut down on ad-spends in November and December for cost optimisation. This will
help mitigate the negative impact on profits due to sales loss. However, we believe that despite
lower advertising spends, the share of voice for most large FMCG companies would have stayed
unchanged as the entire FMCG industry’s advertising intensity would have reduced.
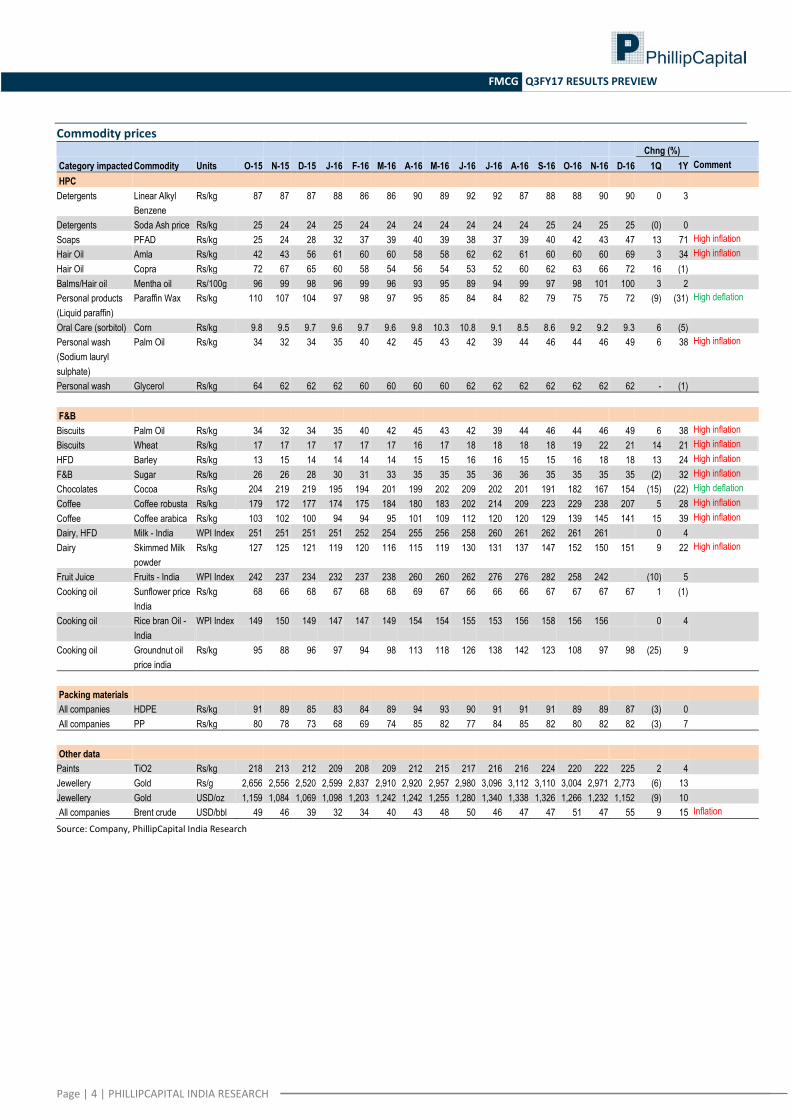
Input costs continue on upward trajectory: In Q3, prices of crude oil/palm oil/sugar/wheat
moved +9%/+12%/-1%/+14% qoq and +14%/+37%/+35%/+21% yoy. This will limit gross margin
expansion for most HPC companies and may even lead to a gross margin reduction in F&B
companies (Britannia).
Cigarettes to see a revival and volume growth to improve sequentially: ITC’s cigarettes business
growth was impacted in Q1FY17 due to confusion over larger pictorial warnings and due to price
hikes initiated after the budget. As per our channel checks, its business has stabilised and volume
growth for ITC’s cigarettes business is expected to be flattish in Q3FY17 in spite of
demonetisation.
Q3FY17 results outlook:
We expect all FMCG companies in the PC Universe to report single-digit declines in
sales, except ITC (strong cigarette volumes), Nestle (low base) and GCPL (high
international share)
We expect a double-digit decline in EBITDA for Britannia (rising input costs) and Bajaj
Corp (higher sales decline), a single digit EBITDA decline for HUL, Dabur, Emami, and
GSK Consumer, and flattish EBITDA for GCPL, Marico, Colgate, and ITC on strong sales
growth or margin expansion
Nestle will show strong growth in topline and bottomline due to favourable base
(Q3FY16 was impacted by the Maggi issue)
Titan is likely to post strong topline and bottomline growth because of strong sales
before 9th November and a strong wedding season
Top picks: Our top Buy picks are ITC and Colgate – on improving growth visibility, valuation
comfort, and lower impact from demonetisation. We expect Jubilant Foodworks, Bajaj Corp, and
Britannia to underperform vs. the sector in Q3FY17.
Naveen Kulkarni, CFA, FRM (+ 9122 6667 9947) [email protected] Jubil Jain (+ 9122 6667 9766) [email protected] Preeyam Tolia (+ 9122 6667 9950) [email protected]

Page | 2 | PHILLIPCAPITAL INDIA RESEARCH
FMCG Q3FY17 RESULTS PREVIEW
Consumer sector overview
PC Consumer universe
(Rs mn)
Dec-16e Sep -16 qoq (%) Dec-15 yoy (%) Result update highlights
Revenues 378,785 384,945 -1.6% 377,938 0.2% Not comparable with previous quarters due to Nestle’s Maggi issue
EBITDA 87,009 88,075 -1.2% 86,300 0.8%
PAT 61,137 61,642 -0.8% 60,587 0.9%
PC Consumer universe
ex Nestle, ITC (Rs mn)
Dec-16e Sep -16 qoq (%) Dec-15 yoy (%) Result update highlights
Sales (ex Nestle,ITC) 265,654 266,128 -0.2% 270,544 -1.8% Sales to grow -2% yoy vs. 4%/4%/5%/5% in Q3/Q4FY16/Q1FY17/Q2
EBITDA (ex Nestle, ITC) 46,831 47,058 -0.5% 47,768 -2.0% EBITDA to grow -2% yoy vs. 18%/14%/13%/9% in Q3/Q4FY16/Q1FY17/Q2
PAT (ex Nestle, ITC) 33,121 33,948 -2.4% 33,554 -1.3% PAT to grow -1% yoy vs. 15%/14%/11%/10% in Q3/Q4FY16/Q1FY17/Q2
Earnings Estimates
(Rs mn) Dec-16e Sep -16 qoq (%) Dec-15 yoy (%) Result Update highlights
ITC
Volume growth (est.) 0.0 5.0 (5.0)
Revenues 89,652 95,355 -6.0% 87,930 2.0% - 0%/5% volume/price growth in cigarettes
- EBITDA decline to be in line with revenue decline as we expect ad spends
to reduce by 5%
- Earnings growth to be in line with EBITDA
EBITDA 35,456 36,300 -2.3% 34,746 2.0%
EBITDA margin (%) 39.5 38.1 39.5
PAT 25,417 25,000 1.7% 25,038 1.5%
EPS (Rs) 2.1 2.1 1.7% 2.1 1.5%
Hindustan Unilever
Volume growth (6.0) (1.0) 6.0
Revenues 73,523 76,976 -4.5% 76,058 -3.3% - Volumes/price to fall by -6%/0%
- EBIDTA growth will be driven by savings in input costs
- Earnings growth to be similar to EBITDA growth
EBITDA 13,703 14,046 -2.4% 14,302 -4.2%
EBITDA margin (%) 18.6 18.2 18.8
PAT 9,918 10,820 -8.3% 10,240 -3.1%
EPS (Rs) 4.6 5.0 -8.3% 4.7 -3.1%
Dabur India Ltd
Volume growth (4.0) 4.5 4.0
Revenues 19,379 19,757 -1.9% 20,137 -3.8% - Domestic volumes/price to fall by -4%/0%
- EBITDA decline to not be steep as we expect ad spends to reduce by 3%
- Earnings decline to be in line with EBITDA
EBITDA 3,581 4,087 -12.4% 3,778 -5.2%
EBITDA margin (%) 18.5 20.7 18.8
PAT 3,012 3,573 -15.7% 3,176 -5.2%
EPS (Rs) 1.7 2.0 -15.7% 1.8 -5.3%
Godrej Cons. Products **
Revenues 23,688 23,575 0.5% 23,535 0.6% - 10% growth in international business and 7% growth in domestic business
- EBITDA growth to be driven by gross margin expansion and operating
leverage
- Earnings growth to be muted due to muted sales growth
EBITDA 4,712 4,658 1.1% 4,580 2.9%
EBITDA margin (%) 19.9 19.8 19.5
PAT 3,483 3,186 9.3% 3,414 2.0%
EPS (Rs) 10.2 9.4 9.3% 10.0 2.0%
Marico Industries
Volume growth (5.0) 3.0 10.5
Revenues 14,540 14,390 1.0% 15,270 -4.8% - Domestic volume/price to decline by 5%/3% and international business to
grow by 10%
- EBITDA growth to be driven by lower RM costs and 5% drop in ad spends
- Earnings growth to be lower than EBITDA growth as we expect higher tax
rate than the base quarter
EBITDA 2,876 2,531 13.7% 2,899 -0.8%
EBITDA margin (%) 19.8 17.6 19.0
PAT 2,038 1,769 15.2% 2,090 -2.5%
EPS (Rs) 1.6 1.4 15.2% 1.6 -2.5%
Jubilant Foodworks
SSSG (5.0) 4.2 2.0
Revenues 6,496 6,654 -2.4% 6,338 2.5% - -5% SSSG
- EBITDA growth to be impacted by negative operating leverage
- Earnings to decline on poor SSSG
EBITDA 559 643 -13.0% 727 -23.1%
EBITDA margin (%) 8.6 9.7 11.5
PAT 189 216 -12.5% 327 -42.3%
EPS (Rs) 2.9 3.3 -12.5% 5.0 -42.4%
Colgate
Volume growth (6.0) 4.0 1.0
Revenues 9,963 11,949 -16.6% 10,064 -1.0% - -6%/5% volume/price growth
- EBITDA growth to be driven by lower input costs and 3% drop
expectations in Ad spends
- Earnings growth to be lower due to very low tax rate in base
EBITDA 2,454 2,748 -10.7% 2,314 6.0%
EBITDA margin (%) 24.6 23.0 23.0
PAT 1,476 1,672 -11.7% 1,594 -7.4%
EPS (Rs) 5.4 6.1 -11.7% 5.9 -7.4%
Page | 3 | PHILLIPCAPITAL INDIA RESEARCH
FMCG Q3FY17 RESULTS PREVIEW
(Rs mn) Dec-16e Sep -16 qoq (%) Dec-15 yoy (%) Result Update highlights
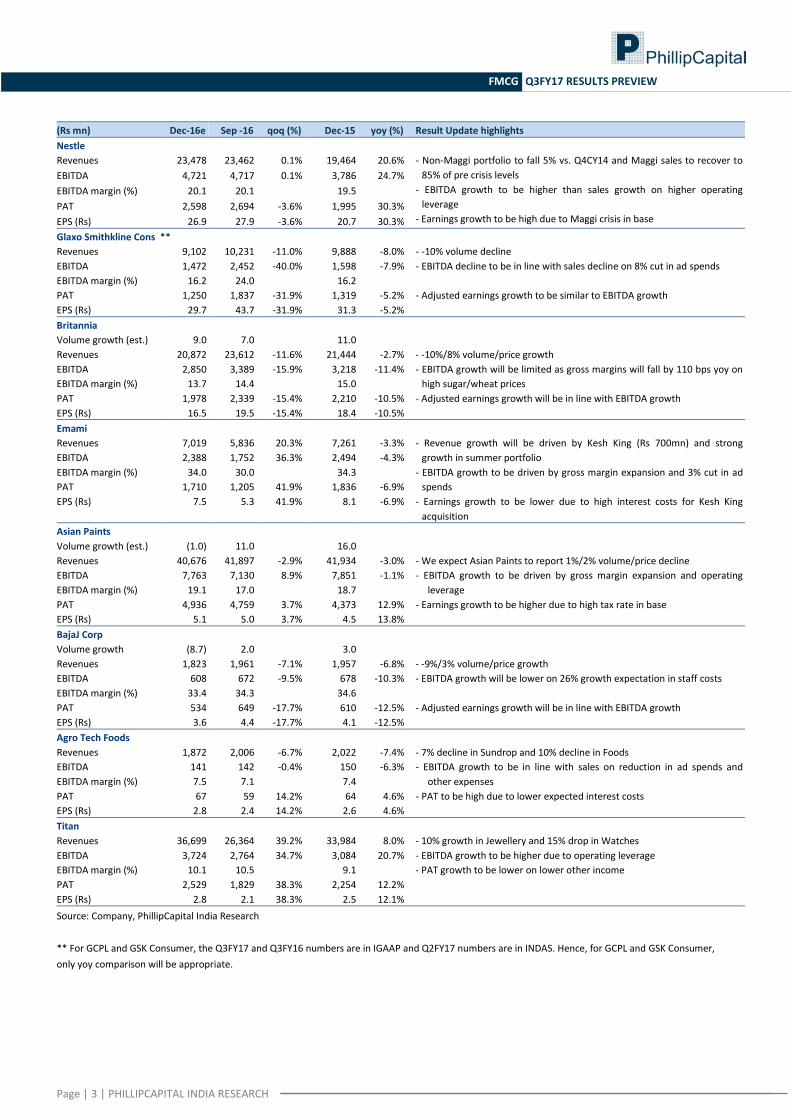
Nestle
Revenues 23,478 23,462 0.1% 19,464 20.6% - Non-Maggi portfolio to fall 5% vs. Q4CY14 and Maggi sales to recover to
85% of pre crisis levels
- EBITDA growth to be higher than sales growth on higher operating
leverage
- Earnings growth to be high due to Maggi crisis in base
EBITDA 4,721 4,717 0.1% 3,786 24.7%
EBITDA margin (%) 20.1 20.1 19.5
PAT 2,598 2,694 -3.6% 1,995 30.3%
EPS (Rs) 26.9 27.9 -3.6% 20.7 30.3%
Glaxo Smithkline Cons **
Revenues 9,102 10,231 -11.0% 9,888 -8.0% - -10% volume decline
EBITDA 1,472 2,452 -40.0% 1,598 -7.9% - EBITDA decline to be in line with sales decline on 8% cut in ad spends
EBITDA margin (%) 16.2 24.0 16.2
PAT 1,250 1,837 -31.9% 1,319 -5.2% - Adjusted earnings growth to be similar to EBITDA growth
EPS (Rs) 29.7 43.7 -31.9% 31.3 -5.2%
Britannia
Volume growth (est.) 9.0 7.0 11.0
Revenues 20,872 23,612 -11.6% 21,444 -2.7% - -10%/8% volume/price growth
- EBITDA growth will be limited as gross margins will fall by 110 bps yoy on
high sugar/wheat prices
- Adjusted earnings growth will be in line with EBITDA growth
EBITDA 2,850 3,389 -15.9% 3,218 -11.4%
EBITDA margin (%) 13.7 14.4 15.0
PAT 1,978 2,339 -15.4% 2,210 -10.5%
EPS (Rs) 16.5 19.5 -15.4% 18.4 -10.5%
Emami
Revenues 7,019 5,836 20.3% 7,261 -3.3% - Revenue growth will be driven by Kesh King (Rs 700mn) and strong
growth in summer portfolio
- EBITDA growth to be driven by gross margin expansion and 3% cut in ad
spends
- Earnings growth to be lower due to high interest costs for Kesh King
acquisition
EBITDA 2,388 1,752 36.3% 2,494 -4.3%
EBITDA margin (%) 34.0 30.0 34.3
PAT 1,710 1,205 41.9% 1,836 -6.9%
EPS (Rs) 7.5 5.3 41.9% 8.1 -6.9%
Asian Paints
Volume growth (est.) (1.0) 11.0 16.0
Revenues 40,676 41,897 -2.9% 41,934 -3.0% - We expect Asian Paints to report 1%/2% volume/price decline
- EBITDA growth to be driven by gross margin expansion and operating
leverage
- Earnings growth to be higher due to high tax rate in base
EBITDA 7,763 7,130 8.9% 7,851 -1.1%
EBITDA margin (%) 19.1 17.0 18.7
PAT 4,936 4,759 3.7% 4,373 12.9%
EPS (Rs) 5.1 5.0 3.7% 4.5 13.8%
BajaJ Corp
Volume growth (8.7) 2.0 3.0
Revenues 1,823 1,961 -7.1% 1,957 -6.8% - -9%/3% volume/price growth
- EBITDA growth will be lower on 26% growth expectation in staff costs
- Adjusted earnings growth will be in line with EBITDA growth
EBITDA 608 672 -9.5% 678 -10.3%
EBITDA margin (%) 33.4 34.3 34.6
PAT 534 649 -17.7% 610 -12.5%
EPS (Rs) 3.6 4.4 -17.7% 4.1 -12.5%
Agro Tech Foods
Revenues 1,872 2,006 -6.7% 2,022 -7.4% - 7% decline in Sundrop and 10% decline in Foods
- EBITDA growth to be in line with sales on reduction in ad spends and
other expenses
- PAT to be high due to lower expected interest costs
EBITDA 141 142 -0.4% 150 -6.3%
EBITDA margin (%) 7.5 7.1 7.4
PAT 67 59 14.2% 64 4.6%
EPS (Rs) 2.8 2.4 14.2% 2.6 4.6%
Titan
Revenues 36,699 26,364 39.2% 33,984 8.0% - 10% growth in Jewellery and 15% drop in Watches
- EBITDA growth to be higher due to operating leverage
- PAT growth to be lower on lower other income
EBITDA 3,724 2,764 34.7% 3,084 20.7%
EBITDA margin (%) 10.1 10.5 9.1
PAT 2,529 1,829 38.3% 2,254 12.2%
EPS (Rs) 2.8 2.1 38.3% 2.5 12.1%
Source: Company, PhillipCapital India Research
** For GCPL and GSK Consumer, the Q3FY17 and Q3FY16 numbers are in IGAAP and Q2FY17 numbers are in INDAS. Hence, for GCPL and GSK Consumer,
only yoy comparison will be appropriate.
Page | 4 | PHILLIPCAPITAL INDIA RESEARCH
FMCG Q3FY17 RESULTS PREVIEW
Commodity prices Chng (%)
Category impacted Commodity Units O-15 N-15 D-15 J-16 F-16 M-16 A-16 M-16 J-16 J-16 A-16 S-16 O-16 N-16 D-16 1Q 1Y Comment
HPC
Detergents Linear Alkyl
Benzene
Rs/kg 87 87 87 88 86 86 90 89 92 92 87 88 88 90 90 0 3
Detergents Soda Ash price Rs/kg 25 24 24 25 24 24 24 24 24 24 24 25 24 25 25 (0) 0
Soaps PFAD Rs/kg 25 24 28 32 37 39 40 39 38 37 39 40 42 43 47 13 71 High inflation
Hair Oil Amla Rs/kg 42 43 56 61 60 60 58 58 62 62 61 60 60 60 69 3 34 High inflation
Hair Oil Copra Rs/kg 72 67 65 60 58 54 56 54 53 52 60 62 63 66 72 16 (1)
Balms/Hair oil Mentha oil Rs/100g 96 99 98 96 99 96 93 95 89 94 99 97 98 101 100 3 2
Personal products
(Liquid paraffin)
Paraffin Wax Rs/kg 110 107 104 97 98 97 95 85 84 84 82 79 75 75 72 (9) (31) High deflation
Oral Care (sorbitol) Corn Rs/kg 9.8 9.5 9.7 9.6 9.7 9.6 9.8 10.3 10.8 9.1 8.5 8.6 9.2 9.2 9.3 6 (5)
Personal wash
(Sodium lauryl
sulphate)
Palm Oil Rs/kg 34 32 34 35 40 42 45 43 42 39 44 46 44 46 49 6 38 High inflation
Personal wash Glycerol Rs/kg 64 62 62 62 60 60 60 60 62 62 62 62 62 62 62 - (1)
F&B
Biscuits Palm Oil Rs/kg 34 32 34 35 40 42 45 43 42 39 44 46 44 46 49 6 38 High inflation
Biscuits Wheat Rs/kg 17 17 17 17 17 17 16 17 18 18 18 18 19 22 21 14 21 High inflation
HFD Barley Rs/kg 13 15 14 14 14 14 15 15 16 16 15 15 16 18 18 13 24 High inflation
F&B Sugar Rs/kg 26 26 28 30 31 33 35 35 35 36 36 35 35 35 35 (2) 32 High inflation
Chocolates Cocoa Rs/kg 204 219 219 195 194 201 199 202 209 202 201 191 182 167 154 (15) (22) High deflation
Coffee Coffee robusta Rs/kg 179 172 177 174 175 184 180 183 202 214 209 223 229 238 207 5 28 High inflation
Coffee Coffee arabica Rs/kg 103 102 100 94 94 95 101 109 112 120 120 129 139 145 141 15 39 High inflation
Dairy, HFD Milk - India WPI Index 251 251 251 251 252 254 255 256 258 260 261 262 261 261 0 4
Dairy Skimmed Milk
powder
Rs/kg 127 125 121 119 120 116 115 119 130 131 137 147 152 150 151 9 22 High inflation
Fruit Juice Fruits - India WPI Index 242 237 234 232 237 238 260 260 262 276 276 282 258 242 (10) 5
Cooking oil Sunflower price
India
Rs/kg 68 66 68 67 68 68 69 67 66 66 66 67 67 67 67 1 (1)
Cooking oil Rice bran Oil -
India
WPI Index 149 150 149 147 147 149 154 154 155 153 156 158 156 156 0 4
Cooking oil Groundnut oil
price india
Rs/kg 95 88 96 97 94 98 113 118 126 138 142 123 108 97 98 (25) 9
Packing materials
All companies HDPE Rs/kg 91 89 85 83 84 89 94 93 90 91 91 91 89 89 87 (3) 0
All companies PP Rs/kg 80 78 73 68 69 74 85 82 77 84 85 82 80 82 82 (3) 7
Other data
Paints TiO2 Rs/kg 218 213 212 209 208 209 212 215 217 216 216 224 220 222 225 2 4
Jewellery Gold Rs/g 2,656 2,556 2,520 2,599 2,837 2,910 2,920 2,957 2,980 3,096 3,112 3,110 3,004 2,971 2,773 (6) 13
Jewellery Gold USD/oz 1,159 1,084 1,069 1,098 1,203 1,242 1,242 1,255 1,280 1,340 1,338 1,326 1,266 1,232 1,152 (9) 10
All companies Brent crude USD/bbl 49 46 39 32 34 40 43 48 50 46 47 47 51 47 55 9 15 Inflation
Source: Company, PhillipCapital India Research

Page | 5 | PHILLIPCAPITAL INDIA RESEARCH
FMCG Q3FY17 RESULTS PREVIEW
Rating Methodology We rate stock on absolute return basis. Our target price for the stocks has an investment horizon of one year.
Rating Criteria Definition
BUY >= +15% Target price is equal to or more than 15% of current market price
NEUTRAL -15% > to < +15% Target price is less than +15% but more than -15%
SELL <= -15% Target price is less than or equal to -15%.
Contact Information (Regional Member Companies)
SINGAPORE: Phillip Securities Pte Ltd
250 North Bridge Road, #06-00 RafflesCityTower,
Singapore 179101
Tel : (65) 6533 6001 Fax: (65) 6535 3834
www.phillip.com.sg
MALAYSIA: Phillip Capital Management Sdn Bhd
B-3-6 Block B Level 3, Megan Avenue II,
No. 12, Jalan Yap Kwan Seng, 50450 Kuala Lumpur
Tel (60) 3 2162 8841 Fax (60) 3 2166 5099
www.poems.com.my
HONG KONG: Phillip Securities (HK) Ltd
11/F United Centre 95 Queensway Hong Kong
Tel (852) 2277 6600 Fax: (852) 2868 5307
www.phillip.com.hk
JAPAN: Phillip Securities Japan, Ltd
4-2 Nihonbashi Kabutocho, Chuo-ku
Tokyo 103-0026
Tel: (81) 3 3666 2101 Fax: (81) 3 3664 0141
www.phillip.co.jp
INDONESIA: PT Phillip Securities Indonesia
ANZTower Level 23B, Jl Jend Sudirman Kav 33A,
Jakarta 10220, Indonesia
Tel (62) 21 5790 0800 Fax: (62) 21 5790 0809
www.phillip.co.id
CHINA: Phillip Financial Advisory (Shanghai) Co. Ltd.
No 550 Yan An East Road, OceanTower Unit 2318
Shanghai 200 001
Tel (86) 21 5169 9200 Fax: (86) 21 6351 2940
www.phillip.com.cn
THAILAND: Phillip Securities (Thailand) Public Co. Ltd.
15th Floor, VorawatBuilding, 849 Silom Road,
Silom, Bangrak, Bangkok 10500 Thailand
Tel (66) 2 2268 0999 Fax: (66) 2 2268 0921
www.phillip.co.th
FRANCE: King & Shaxson Capital Ltd.
3rd Floor, 35 Rue de la Bienfaisance
75008 Paris France
Tel (33) 1 4563 3100 Fax : (33) 1 4563 6017
www.kingandshaxson.com
UNITED KINGDOM: King & Shaxson Ltd.
6th Floor, Candlewick House, 120 Cannon Street
London, EC4N 6AS
Tel (44) 20 7929 5300 Fax: (44) 20 7283 6835
www.kingandshaxson.com
UNITED STATES: Phillip Futures Inc.
141 W Jackson Blvd Ste 3050
The Chicago Board of TradeBuilding
Chicago, IL 60604 USA
Tel (1) 312 356 9000 Fax: (1) 312 356 9005
AUSTRALIA: PhillipCapital Australia
Level 10, 330 Collins Street
Melbourne, VIC 3000, Australia
Tel: (61) 3 8633 9800 Fax: (61) 3 8633 9899
www.phillipcapital.com.au
SRI LANKA: Asha Phillip Securities Limited
Level 4, Millennium House, 46/58 Navam Mawatha,
Colombo 2, Sri Lanka
Tel: (94) 11 2429 100 Fax: (94) 11 2429 199
www.ashaphillip.net/home.htm
INDIA
PhillipCapital (India) Private Limited
No. 1, 18th Floor, Urmi Estate, 95 Ganpatrao Kadam Marg, Lower Parel West, Mumbai 400013
Tel: (9122) 2300 2999 Fax: (9122) 6667 9955 www.phillipcapital.in
Management(91 22) 2483 1919
Kinshuk Bharti Tiwari (Head – Institutional Equity) (91 22) 6667 9946
(91 22) 6667 9735
Research IT Services Pharma & Speciality Chem
Dhawal Doshi (9122) 6667 9769 Vibhor Singhal (9122) 6667 9949 Surya Patra (9122) 6667 9768
Nitesh Sharma, CFA (9122) 6667 9965 Shyamal Dhruve (9122) 6667 9992 Mehul Sheth (9122) 6667 9996
Banking, NBFCs Infrastructure Strategy
Manish Agarwalla (9122) 6667 9962 Vibhor Singhal (9122) 6667 9949 Naveen Kulkarni, CFA, FRM (9122) 6667 9947
Pradeep Agrawal (9122) 6667 9953 Deepak Agarwal (9122) 6667 9944 Aashima Mutneja (9122) 6667 9764
Paresh Jain (9122) 6667 9948 Logistics, Transportation & Midcap Telecom
Consumer & Retail Vikram Suryavanshi (9122) 6667 9951 Naveen Kulkarni, CFA, FRM (9122) 6667 9947
Naveen Kulkarni, CFA, FRM (9122) 6667 9947 Media Manoj Behera (9122) 6667 9973
Jubil Jain (9122) 6667 9766 Manoj Behera (9122) 6667 9973 Technicals
Preeyam Tolia (9122) 6667 9950 Metals Subodh Gupta, CMT (9122) 6667 9762
Cement Dhawal Doshi (9122) 6667 9769 Production Manager
Vaibhav Agarwal (9122) 6667 9967 Yash Doshi (9122) 6667 9987 Ganesh Deorukhkar (9122) 6667 9966
Economics Mid-Caps & Database Manager Editor
Anjali Verma (9122) 6667 9969 Deepak Agarwal (9122) 6667 9944 Roshan Sony 98199 72726
Engineering, Capital Goods Oil & Gas Sr. Manager – Equities Support
Jonas Bhutta (9122) 6667 9759 Sabri Hazarika (9122) 6667 9756 Rosie Ferns (9122) 6667 9971
Vikram Rawat (9122) 6667 9986
Sales & Distribution Ashvin Patil (9122) 6667 9991 Sales Trader Zarine Damania (9122) 6667 9976
Shubhangi Agrawal (9122) 6667 9964 Dilesh Doshi (9122) 6667 9747 Bharati Ponda (9122) 6667 9943
Kishor Binwal (9122) 6667 9989 Suniil Pandit (9122) 6667 9745
Bhavin Shah (9122) 6667 9974
Ashka Mehta Gulati (9122) 6667 9934 Execution
Archan Vyas (9122) 6667 9785 Mayur Shah (9122) 6667 9945
Corporate Communications
Vineet Bhatnagar (Managing Director)
Jignesh Shah (Head – Equity Derivatives)
Automobiles
Page | 6 | PHILLIPCAPITAL INDIA RESEARCH
FMCG Q3FY17 RESULTS PREVIEW
Disclosures and Disclaimers PhillipCapital (India) Pvt. Ltd. has three independent equity research groups: Institutional Equities, Institutional Equity Derivatives, and Private Client Group. This report has been prepared by Institutional Equities Group. The views and opinions expressed in this document may, may not match, or may be contrary at times with the views, estimates, rating, and target price of the other equity research groups of PhillipCapital (India) Pvt. Ltd.
This report is issued by PhillipCapital (India) Pvt. Ltd., which is regulated by the SEBI. PhillipCapital (India) Pvt. Ltd. is a subsidiary of Phillip (Mauritius) Pvt. Ltd. References to "PCIPL" in this report shall mean PhillipCapital (India) Pvt. Ltd unless otherwise stated. This report is prepared and distributed by PCIPL for information purposes only, and neither the information contained herein, nor any opinion expressed should be construed or deemed to be construed as solicitation or as offering advice for the purposes of the purchase or sale of any security, investment, or derivatives. The information and opinions contained in the report were considered by PCIPL to be valid when published. The report also contains information provided to PCIPL by third parties. The source of such information will usually be disclosed in the report. Whilst PCIPL has taken all reasonable steps to ensure that this information is correct, PCIPL does not offer any warranty as to the accuracy or completeness of such information. Any person placing reliance on the report to undertake trading does so entirely at his or her own risk and PCIPL does not accept any liability as a result. Securities and Derivatives markets may be subject to rapid and unexpected price movements and past performance is not necessarily an indication of future performance.
This report does not regard the specific investment objectives, financial situation, and the particular needs of any specific person who may receive this report. Investors must undertake independent analysis with their own legal, tax, and financial advisors and reach their own conclusions regarding the appropriateness of investing in any securities or investment strategies discussed or recommended in this report and should understand that statements regarding future prospects may not be realised. Under no circumstances can it be used or considered as an offer to sell or as a solicitation of any offer to buy or sell the securities mentioned within it. The information contained in the research reports may have been taken from trade and statistical services and other sources, which PCIL believe is reliable. PhillipCapital (India) Pvt. Ltd. or any of its group/associate/affiliate companies do not guarantee that such information is accurate or complete and it should not be relied upon as such. Any opinions expressed reflect judgments at this date and are subject to change without notice.
Important: These disclosures and disclaimers must be read in conjunction with the research report of which it forms part. Receipt and use of the research report is subject to all aspects of these disclosures and disclaimers. Additional information about the issuers and securities discussed in this research report is available on request.
Certifications: The research analyst(s) who prepared this research report hereby certifies that the views expressed in this research report accurately reflect the research analyst’s personal views about all of the subject issuers and/or securities, that the analyst(s) have no known conflict of interest and no part of the research analyst’s compensation was, is, or will be, directly or indirectly, related to the specific views or recommendations contained in this research report.
Additional Disclosures of Interest: Unless specifically mentioned in Point No. 9 below: 1. The Research Analyst(s), PCIL, or its associates or relatives of the Research Analyst does not have any financial interest in the company(ies) covered in
this report. 2. The Research Analyst, PCIL or its associates or relatives of the Research Analyst affiliates collectively do not hold more than 1% of the securities of the
company (ies)covered in this report as of the end of the month immediately preceding the distribution of the research report. 3. The Research Analyst, his/her associate, his/her relative, and PCIL, do not have any other material conflict of interest at the time of publication of this
research report. 4. The Research Analyst, PCIL, and its associates have not received compensation for investment banking or merchant banking or brokerage services or for
any other products or services from the company(ies) covered in this report, in the past twelve months. 5. The Research Analyst, PCIL or its associates have not managed or co-managed in the previous twelve months, a private or public offering of securities for
the company (ies) covered in this report. 6. PCIL or its associates have not received compensation or other benefits from the company(ies) covered in this report or from any third party, in
connection with the research report. 7. The Research Analyst has not served as an Officer, Director, or employee of the company (ies) covered in the Research report. 8. The Research Analyst and PCIL has not been engaged in market making activity for the company(ies) covered in the Research report. 9. Details of PCIL, Research Analyst and its associates pertaining to the companies covered in the Research report:
Sr. no. Particulars Yes/No
1 Whether compensation has been received from the company(ies) covered in the Research report in the past 12 months for investment banking transaction by PCIL
No
2 Whether Research Analyst, PCIL or its associates or relatives of the Research Analyst affiliates collectively hold more than 1% of the company(ies) covered in the Research report
No
3 Whether compensation has been received by PCIL or its associates from the company(ies) covered in the Research report No
4 PCIL or its affiliates have managed or co-managed in the previous twelve months a private or public offering of securities for the company(ies) covered in the Research report
No
5 Research Analyst, his associate, PCIL or its associates have received compensation for investment banking or merchant banking or brokerage services or for any other products or services from the company(ies) covered in the Research report, in the last twelve months
No
Independence: PhillipCapital (India) Pvt. Ltd. has not had an investment banking relationship with, and has not received any compensation for investment banking services from, the subject issuers in the past twelve (12) months, and PhillipCapital (India) Pvt. Ltd does not anticipate receiving or intend to seek compensation for investment banking services from the subject issuers in the next three (3) months. PhillipCapital (India) Pvt. Ltd is not a market maker in the securities mentioned in this research report, although it, or its affiliates/employees, may have positions in, purchase or sell, or be materially interested in any of the securities covered in the report.
Suitability and Risks: This research report is for informational purposes only and is not tailored to the specific investment objectives, financial situation or particular requirements of any individual recipient hereof. Certain securities may give rise to substantial risks and may not be suitable for certain investors. Each investor must make its own determination as to the appropriateness of any securities referred to in this research report based upon the legal, tax and accounting considerations applicable to such investor and its own investment objectives or strategy, its financial situation and its investing experience. The value of any security may be positively or adversely affected by changes in foreign exchange or interest rates, as well as by other financial, economic, or political factors. Past performance is not necessarily indicative of future performance or results.
Page | 7 | PHILLIPCAPITAL INDIA RESEARCH
FMCG Q3FY17 RESULTS PREVIEW
Sources, Completeness and Accuracy: The material herein is based upon information obtained from sources that PCIPL and the research analyst believe to be reliable, but neither PCIPL nor the research analyst represents or guarantees that the information contained herein is accurate or complete and it should not be relied upon as such. Opinions expressed herein are current opinions as of the date appearing on this material, and are subject to change without notice. Furthermore, PCIPL is under no obligation to update or keep the information current. Without limiting any of the foregoing, in no event shall PCIL, any of its affiliates/employees or any third party involved in, or related to computing or compiling the information have any liability for any damages of any kind including but not limited to any direct or consequential loss or damage, however arising, from the use of this document.
Copyright: The copyright in this research report belongs exclusively to PCIPL. All rights are reserved. Any unauthorised use or disclosure is prohibited. No reprinting or reproduction, in whole or in part, is permitted without the PCIPL’s prior consent, except that a recipient may reprint it for internal circulation only and only if it is reprinted in its entirety.
Caution: Risk of loss in trading/investment can be substantial and even more than the amount / margin given by you. The recipient should carefully consider whether trading/investment is appropriate for the recipient in light of the recipient’s experience, objectives, financial resources and other relevant circumstances. PCIPL and any of its employees, directors, associates, group entities, or affiliates shall not be liable for losses, if any, incurred by the recipient. The recipient is further cautioned that trading/investments in financial markets are subject to market risks and are advised to seek independent third party trading/investment advice outside PhillipCapital/group/associates/affiliates/directors/employees before and during your trading/investment. There is no guarantee/assurance as to returns or profits or capital protection or appreciation. PCIPL and any of its employees, directors, associates, group entities, affiliates are not inducing the recipient for trading/investing in the financial market(s). Trading/Investment decision is the sole responsibility of the recipient. For Detailed Disclaimer: Please visit our website www.phillipcapital.in
For U.S. persons only: This research report is a product of PhillipCapital (India) Pvt Ltd., which is the employer of the research analyst(s) who has prepared the research report. The research analyst(s) preparing the research report is/are resident outside the United States (U.S.) and are not associated persons of any U.S.-regulated broker-dealer and therefore the analyst(s) is/are not subject to supervision by a U.S. broker-dealer, and is/are not required to satisfy the regulatory licensing requirements of FINRA or required to otherwise comply with U.S. rules or regulations regarding, among other things, communications with a subject company, public appearances, and trading securities held by a research analyst account.
This report is intended for distribution by PhillipCapital (India) Pvt Ltd. only to "Major Institutional Investors" as defined by Rule 15a-6(b)(4) of the U.S. Securities and Exchange Act, 1934 (the Exchange Act) and interpretations thereof by the U.S. Securities and Exchange Commission (SEC) in reliance on Rule 15a 6(a)(2). If the recipient of this report is not a Major Institutional Investor as specified above, then it should not act upon this report and return the same to the sender. Further, this report may not be copied, duplicated, and/or transmitted onward to any U.S. person, which is not a Major Institutional Investor. In reliance on the exemption from registration provided by Rule 15a-6 of the Exchange Act and interpretations thereof by the SEC in order to conduct certain
business with Major Institutional Investors, PhillipCapital (India) Pvt Ltd. has entered into an agreement with a U.S. registered broker-dealer, Decker & Co, LLC. Transactions in securities discussed in this research report should be effected through Decker & Co, LLC or another U.S. registered broker dealer.
If Distribution is to Australian Investors This report is produced by PhillipCapital (India) Pvt Ltd and is being distributed in Australia by Phillip Capital Limited (Australian Financial Services Licence No. 246827).
This report contains general securities advice and does not take into account your personal objectives, situation and needs. Please read the Disclosures and Disclaimers set out above. By receiving or reading this report, you agree to be bound by the terms and limitations set out above. Any failure to comply with
these terms and limitations may constitute a violation of law. This report has been provided to you for personal use only and shall not be reproduced, distributed or published by you in whole or in part, for any purpose. If you have received this report by mistake, please delete or destroy it, and notify the sender immediately.
PhillipCapital (India) Pvt. Ltd. Registered office: No. 1, 18th Floor, Urmi Estate, 95 Ganpatrao Kadam Marg, Lower Parel West, Mumbai 400013