institutional equity research - cfig · find cibc research on bloomberg, reuters, firstcall.com and...
TRANSCRIPT

Find CIBC research on Bloomberg, Reuters, firstcall.com
and ResearchCentral.cibcwm.com CIBC World Markets Inc., P.O. Box 500, 161 Bay Street, Brookfield Place, Toronto, Canada M5J 2S8 (416) 594-7000
INSTITUTIONAL EQUITY RESEARCH Perry Caicco 1 (416) 594-7279 [email protected]
Mark Petrie, CFA 1 (416) 956-3278 [email protected]
John Zamparo, CFA, CPA, CA 1 (416) 956-6108 [email protected]
Matt Bank 1 (416) 594-7831 [email protected]
Merchandising C H A N G E I N R A T I N G - U P G R A D E
All figures in Canadian dollars, unless otherwise stated. 15-137478 © 2015
CIBC World Markets does and seeks to do business with companies covered in its research reports. As a result, investors
should be aware that the firm may have a conflict of interest that could affect the objectivity of this report.
Investors should consider this report as only a single factor in making their investment decision.
See "Important Disclosures" section at the end of this report for important required disclosures, including potential conflicts of
interest. See "Price Target Calculation" and "Key Risks to Price Target" sections at the end of this report, or at the end of each
section hereof, where applicable.
Glory Days
Supermarkets Headed For Another Great Year In
2016
August 12, 2015
Sector Weighting: M A R K E T W E I G H T
What's Changed
So far 2015 has been excellent, and it looks like 2016 will be another great year for grocers: the Canadian consumer is holding in and spending up; square footage growth should stay at about the pace of tonnage growth; the Canadian dollar will
likely eventually be less of a headwind (and thus USD-driven cost increases should moderate); the Target (TGT-NYSE) space will mostly not be re-deployed for food; and a recovering Ontario should add materially to grocer profitability. As a result, grocers should be able to continue to engineer strong inflation, and more than cover their
increased costs.
Implications
The multiples of grocery companies are generally higher than historical averages.
However, given the calm conditions of the market and the post-consolidation pricing stability, there could be outsized earnings expansion for the next 18-24 months. There are issues, but they are longer-term in nature: suppliers are in cost-cutting
mode, putting vendor funds at risk; Wal-Mart (WMT-NYSE) is becoming a better
grocer, as are independents; and Aldi or Lidl will arrive sooner or later.
Valuation
We are upgrading Loblaw and Metro to Sector Outperformer and maintaining Empire as Sector Performer. Our Loblaw price target moves from $71 to $89 and our Metro price target, as detailed in our Metro note today, increases from $37.50 to $42.

Glo
ry D
ays - A
ug
ust 1
2, 2
01
5
2
Supermarket Industry Earnings Outlook
Earnings per Share
12-18 Month Annual Earnings per Share Quarterly Earnings per Share
Price Target Rating Year One Year Two Year Three Year Four Year One Year Two
Ticker Price Prior Current Prior Curr FYE Year Prior Current Prior Current Prior Current Prior Current Qtr Prior Current Prior Current
L (2a, 2c, 2e, 2g) 71.60 71.00 89.00 SP SO Dec 2013 -- 2.60A -- 3.18A -- 3.41E -- 3.89E Q3-13 -- 0.77A -- 0.89A
MRU (2a, 2c, 2e, 2g) 36.57 37.50 42.00 SP SO Sep 2013 -- 1.65A 1.70A 1.74A 2.03E 2.08E 2.30E 2.41E Q4-13 -- 0.40A 0.44A 0.46A
Source: Company notes and CIBC World Markets Inc.
All figures in Canadian dollars, unless otherwise stated.
Important disclosure footnotes that correspond to the footnotes in this table may be found in the "Key to Important Disclosure Footnotes" section of this report.

Glory Days - August 12, 2015
3
OVERVIEW
Great Year So Far
2015 has been, predictably, a great year for Canadian grocers. After several
years of heavy competitive square footage growth, new entrants, acquisitions,
unstable systems and a discount-oriented consumer, most signals have turned
positive and results have generally followed. There have been a few issues –
measured tonnage has not been growing, the CAD has been a challenge to
margins, and some regions are unsteady. But as square footage growth has
moderated, so has competition. And with less competition, grocers have been
able to inflate prices as needed, both on shelf and on promotion. Strong
earnings growth has followed.
Another Coming in 2016
It now looks like the glory days will extend into 2016, and possibly beyond. The
Canadian consumer seems in reasonable shape despite a somewhat stagnant
economy, and seems a little more willing to pay up for better quality and
healthier food. The recent announcement by Loblaw (L-SO) of the closure of 52
stores implies the removal of 500,000 sq.ft. of grocery space and contains 2016
square footage growth at just 1.7%, not much higher than annual tonnage
growth. These days, that tonnage growth converts to a higher rate of revenue
growth due to rampant inflation, so we see virtually no productivity issues in the
Canadian marketplace for this year or next.
Three other major positives for the industry in 2016 are as follows:
1. The low probability of a further CAD headwind;
2. The low probability of Target’s 3 million square feet of grocery space
getting re-purposed in food;
3. Ontario is turning from a highly competitive market to a highly lucrative
market due to the combination of a better economy and proportionately
larger square footage reductions.
Any Issues Are Longer Term
Although foreign hard discount competitors such as Aldi or Lidl are likely to
eventually reach Canada, their impact is years away. And any shift to online
grocery ordering and delivery is minor and shouldn’t affect overall industry
volumes—investors should only be concerned that grocers don’t over-spend to
chase this complex topic.
Certainly, Wal-Mart is becoming a better grocer and is adding square footage
quickly; Costco (COST-NASDAQ) continues to add boxes; and independent
grocers (both ethnic and non-ethnic) are thriving. Mainstream grocers have
ramped up capital spending on stores (mostly conventional), some of which are
extravagant, but sales in those renovated stores are ramping up and the
probable poor overall ROI numbers are years in the future.
Over the next two or three years, there will likely be a severe restructuring of
the CPG industry, based on the ―zero-based-budgeting‖ principles introduced by
Kraft-Heinz (KHC-NASDAQ) owner, 3G Capital. That should result in lower levels
of trade support, which is critical to Canadian supermarket profitability. But we
do not see that having a material impact on grocer profitability until 2017 or
2018.
Long-term, the arrival of a European hard discounter certainly puts a dent in the
Canadian supermarket industry. But even if Aldi or Lidl were to arrive tomorrow,
it would take several years for market share to be impacted.

Glory Days - August 12, 2015
4
In the meantime, 2015, 2016 and probably 2017 might one day be remembered
as the glory days of Canadian supermarkets.
Upgrades
Concurrent with this report, we are upgrading Metro and Loblaw to Sector
Outperformer; and maintaining Empire at Sector Performer. Our new price
target for Metro is $42, up from $37.50; and for Loblaw is $89, up from $71.
Loblaw and Metro are benefitting from generally improved conditions and
generally better operations. Empire is only held back by its leverage to the
west, and by the complexity of the next steps in its Safeway integration.
Consumer: Steady And Spending Although there has not been much growth in disposable income, notoriously
cautious Canadian consumers are spending a little more on food. They are still
very deal-conscious, still buying close to 36% of food on promotion, but those
promotions are less deep-discount than before.
Unemployment remains close to a six-year low, and lower prices for energy and
motor fuel have combined with low debt servicing costs to keep consumers from
severe belt-tightening.
Exhibit 1. Canadian unemployment rate
Source: Statistics Canada and CIBC World Markets Inc.
Lower gas prices have probably put about $10 billion in Canadians’ pockets vs
last year. Those lower fuel prices have generally benefitted the entire food
industry, with restaurant sales boosted first and foremost; and then a
meaningful amount trickling into food for home consumption.

Glory Days - August 12, 2015
5
Exhibit 2. Canadian inflation – by component
Source: Statistics Canada and CIBC World Markets Inc.
A portion of this increased spending on food has been eaten up by inflation,
resulting in some pullback on tonnage consumption, but other than a bit of
trade-down in the slowing Alberta economy, the situation has been manageable.
There continues to be fear of a recession (or whatever the current definition of
recession is), and the country is having trouble with non-energy exports despite
the very low Canadian dollar. As yet, this has not turned up in any increased
fear of job loss outside of Alberta, and house values have not declined so home
equity seems solid. As mentioned, the carrying costs of loans are very low, and
Canadians seem to be paying off non-mortgage debt relatively quickly.
It’s probable that the situation in Alberta worsens, or that interest and fuel costs
rise, but at this point it seems that the Canadian consumer will not generally be
a big concern for grocers over the next couple of years.
Changing Consumers
As grocers contemplate consumers over the next few years, there are a few
situations that need to be considered:
Growing ethnicity. Since we published our landmark Ethnic Consumer
study in 2010, the ―visible minority‖ population of Canada has probably
risen from 16% to 20% of Canadians, as the entry of 250,000
immigrants per year continues to push Canada into greater diversity.
Asian and South Asian countries are still the largest sources of
immigrants. Since immigration is Canada’s only real source of
population growth, and since ―family‖ immigrants are the fastest-
growing class, we see no reason that this trend will slow down.
o All grocers have taken a strategic stance on the topic— Loblaw
purchased T&T, an Indian wholesaler and Arz; Metro bought
Adonis; and Empire aimed FreshCo straight at local ethnic
groups. But the bigger question remains— how to serve these
populations in all stores, not just in ethnic-themed locations.
Growing interest in healthy eating. Growing at 10-15% per year,
organic products are one of the bellwethers of a changing consumer.
Organic products are now about 4% of Canadian food sales. But healthy
eating – an obvious by-product of an aging population – also manifests
itself in a greater interest in produce, local foods, product origins,
specialty products and general food knowledge. Location and price will

Glory Days - August 12, 2015
6
always be numbers 1 and 1A for consumers, but selection and healthy
alternatives are growing as key attributes.
The Three Variables: Square Footage, CAD and Inflation
Everything Results In Pricing
The single most important factor in Canadian supermarket profitability is pricing.
If a grocer can take prices up faster than costs, the grocer makes more money.
If competition forces a grocer to lower prices or not take increases, the grocer
obviously makes less money. Small changes in pricing – up or down – can alter
profitability much faster than changes to operating costs.
Square Footage The Biggest Driver
The ability to raise or lower prices depends almost entirely on competition—
specifically, the change in competition. There are two ways competition
increases:
1. If square footage growth rises faster than consumption; or
2. If unproductive grocery space is made materially more productive.
The second factor has happened a few times—examples include the replacement
of Price Chopper with FreshCo, the temporary replacement of Zellers with
Target, and the re-branding of Extra Foods to No Frills.
But the biggest, and most measurable, driver is square footage growth. 2015
has been one of the lowest years on record for square footage growth, largely
due to the exit of Target and the closures of numerous Sobeys stores. 2016
should see more square footage growth, but thanks to Loblaw’s planned
closures, the overall projected growth of 1.7% is only marginally above
consumption growth.
Exhibit 3. Grocery square footage growth
Source: Company reports and CIBC World Markets Inc.
It is also worth noting that most of the 3 million square feet of food selling space
that Target walked away from in early 2015 will likely not be re-purposed for
food use. In fact, only about 350,000 sq.ft., or just over 10% of the original
amount, should eventually turn up for food-selling purposes. The fact that the
square footage will be operated primarily by Walmart would normally be of
concern, but it’s a drop in the bucket in the overall 200 million sq.ft. Canadian
food space.

Glory Days - August 12, 2015
7
Getting Prices Up
In this type of environment, competition has eased materially, and price inflation
has been steady and strong. In a low square footage growth environment, price
inflation is as much about softer promotional programs as about actual shelf
price increases.
Exhibit 4. Inflation trends
Source: Company reports, Statistics Canada and CIBC World Markets Inc.
Indeed, weekly ads have been much softer as 2015 has progressed.
Conventional stores are focusing on breadth rather than depth – almost a
competition for who can put the most items on the front page, to compensate
for the lack of deep discount prices. A recent mid-June example in Ontario had
conventional stores offering a huge number of front page items. This is a prime
example of an industry on cruise control.
Exhibit 5. June 12 Flyers: Metro 19 items, Sobeys 16, Loblaws 14
Source: Company flyers.

Glory Days - August 12, 2015
8
CAD Headwind Should Dissipate
We suspect that even without cost inflation, grocers would have taken
advantage of an easier market to raise prices, although maybe not to the
current extent.
Inflation has been critical in order to cover off both spiraling protein prices and,
more importantly, the low CAD. A low year-over-year Canadian dollar continues
to be a problem, seriously inflating the cost of imported produce (which is
necessary for 10 months of the year). Other residual negative impacts of a low
CAD include the ingredient costs in private label products, and the increased
transfer prices to the Canadian division of CPG companies. These cost increases
all put pressure on grocers to take net effective prices up. The good news is
that grocers have been able to cover most of these increases with inflation
because real competition is minimal.
Exhibit 6. CAD/USD
Source: Company reports and CIBC World Markets Inc.
In considering the different types of inflation, certain protein costs have risen
materially this year. But price increases in commodity proteins such as beef and
pork are easier to take to the retail price – consumers expect commodity costs
to move around and shift their consumption (such as this year to chicken and
fish). When chicken prices begin to rise, expect consumers to shift back to beef
and pork.
The severe CAD decline has been tougher to manage and it’s not clear that even
with high inflation, these cost increases have been entirely covered just yet,
which means more inflation to come.
It is difficult to see the CAD having a third year where it is materially below the
levels of the previous year. Our economists are forecasting a 2016 CAD at
$0.77 US, which would mean about flat to 2015. This would materially ease the
cost pressures in the market, and would mean that to the extent grocers
engineer any inflation in 2016, most of it will roll right to the bottom line.
A market with limited cost pressures, little competition, and therefore decent
opportunities for inflation would be almost a perfect world for serious profit
growth. Welcome to 2016.
The Benefits of Consolidation The big consolidations of 2014 should finally begin to bear fruit in 2016. Not just
the synergies and the systems, but more importantly, the blending of
merchandising and pricing strategies. Already, we have seen some coordination
of advertising programs to avoid direct item conflicts, and of course the private

Glory Days - August 12, 2015
9
label products of the acquirers are steadily flowing into the stores of their
acquired business units.
By 2016, the most important element – pricing strategy – should be determined
and coordinated, offering opportunities to improve and refine gross margins.
But more importantly, the reduction in the number of competitors in both drug
and food makes price checking and price signaling that much easier; it
eliminates a couple of potential advertising wild cards; and it fosters a much
calmer, more coordinated market.
Exhibit 7. Loblaw + Empire Control 51% of Food
Source: Company reports and CIBC World Markets Inc.
Loblaw has a lot of work to do to find the proper pricing level of both its private
labels and its identical CPG products between Shoppers and the various Loblaw
banners, and that should take most of the rest of this year to sort out. Sobeys
will likely completely coordinate the pricing programs between the Sobeys and
Safeway banners before converting Safeways to Sobeys. But either way, 2016
should be the culmination of consolidation: a distinctly less competitive
marketplace, and an easier time period to generate strong and stable gross
margins.
The Role Of Wal-Mart…And Others
Wal-Mart Better But Still Small
Investors are right to be concerned about the rising role of Walmart and Costco
in Canada. Wal-Mart’s share of the growth in food square footage is 5x its
actual share of square footage. As well, the company is quickly transforming
into a real grocer. Its weekly ads are much improved and always relevant.
They recently ―won‖ the August long weekend by easily beating everybody on
the local corn price (22-cents each) and running strong deals on hot dogs, buns,
watermelon, soft drinks, water and chicken. It was easily the best ad in the
marketplace.
2015 Who's Who in Canadian RetailGeneral
Retailer Food Drug & HBA Merchandise Apparel TOTAL Share
Loblaw/Shoppers $28,077 $12,584 $3,037 $731 $44,428 15.6%
Sobeys/SWY $20,833 $3,300 $428 $0 $24,561 8.6%
Walmart $6,577 $4,451 $8,134 $3,124 $22,286 7.8%
Costco $9,238 $926 $7,023 $473 $17,659 6.2%
Canadian Tire $0 $0 $15,839 $1,141 $16,981 6.0%
Metro $10,125 $1,911 $158 $0 $12,194 4.3%
Home Depot $0 $0 $6,050 $0 $6,050 2.1%
RONA $0 $0 $5,371 $0 $5,371 1.9%
Jean Coutu $268 $4,049 $53 $0 $4,369 1.5%
Co-ops $3,504 $153 $408 $0 $4,065 1.4%
Sears $0 $0 $1,946 $1,280 $3,226 1.1%
Overwaitea $2,618 $500 $0 $0 $3,118 1.1%
HBC $10 $0 $852 $1,958 $2,820 1.0%
Dollarama $486 $356 $1,511 $238 $2,591 0.9%
TJX $0 $0 $0 $1,368 $1,368 0.5%
Target $82 $68 $227 $194 $572 0.2%
Other $14,175 $12,866 $68,699 $17,588 $113,327 39.8%
TOTAL $95,993 $41,164 $119,734 $28,094 $284,985 100%

Glory Days - August 12, 2015
1 0
Exhibit 8. Wal-Mart’s August long weekend flyer
Source: Walmart.ca.
On top of that, they have improved their merchandising, with better and fresher
produce, a stronger meat program (including 100% Canadian beef), and
statements on products such as artisan breads and seasonal produce.
This is all important, but the issue is that they are coming from a small base.
Walmart only has just over 5.7% of the food square footage in the country, and
a food market share of about 7.8%. Even the 13 Target stores the company
acquired will take their square footage share to only 6.1% by the end of 2016.
Walmart may be aggressive at adding square footage, but its tiny base means
that it cannot transform the market. Its 10% increase in square footage next
year only drives an overall 0.5% growth in total food square footage in Canada.
By contrast, if Loblaw were to drive 10% square footage growth, total industry
food square footage would grow by over 2%, and the market would fall into
disarray.
Others to Watch
The rapid consolidation of the major players, the resultant site divestitures,
growing immigrant populations, and a wealth of experienced operators who have
been forced out of mergers have all fueled a re-invigoration of the independent
grocer in Canada. By independent, we do not mean the franchised operations of
the major companies, or their controlled banners. We mean the well-capitalized
and successful ethnic operators (mostly Asian, Middle Eastern and European);
rising fresh-focused concepts (Farm Boy, Quality Foods, Coleman’s, Longo’s,
etc.); and numerous specialty operators in niches such as organic/natural, bulk,
meat, produce and local. The fresh-focused and specialty operators have been
driven by consumers’ needs for better, healthier, more origin-focused offerings –
this is the same trend that has driven the rise of farmers markets in Canada.

Glory Days - August 12, 2015
1 1
Exhibit 9. Farm Boy
Source: CIBC World Markets Inc.
These types of stores are usually better at merchandising, selection, freshness
and service than larger chains stores. Indeed, we recently walked into an
independent whose entire tomato section – 12 SKUs – were all Ontario-grown.
The nearby chain store had exactly two SKUs of Ontario tomatoes, no doubt
waiting for its contracted produce supplier to move through its stock of non-
Canadian product before the local stuff could be shipped.
Although the rise of these types of stores will always take a dent out of larger
operators and, over time, they should be a force in the marketplace, today they
represent only about 15% of the market. Like Walmart, they are too small a
force to have any immediate impact on the industry, but over five or ten years,
they could begin to take serious market share.
One excellent case study is the growth of full-size ethnic grocery stores in the
Greater Toronto Area. There are now over 100 full-size ethnic independents in
the region, growing at over 15% per year and currently at a 10% market share.
They are generally modern, clean, excellent operators and scoop up over 50% of
the GTA sales growth. Mainstream grocers have to watch prices and products
carefully, and decide whether or not to respond. But general traffic congestion
prevents serious cross-shopping and store switching, and so grocers can still
engineer inflation and rely on excellent sites and population density to protect
business and deliver margin.

Glory Days - August 12, 2015
1 2
Exhibit 10. Modern Cheese Counter at Oceans (Asian grocer)
Source: Company reports and CIBC World Markets Inc.
The Four Big Shifts There are four big shifts taking place in the Canadian grocery industry, all of
which have both near-term and long-term profit implications for supermarkets:
1. FROM CENTER-STORE TO FRESH. New and renovated stores always
expand the fresh departments. Traffic is configured to ensure customers
spend time and money on fresh products before even finding the
shrinking and muted grocery departments.
Short-term Implications
Boost to revenues through higher-priced, value-added products;
some boost to initial margins; offset by higher labour and shrink.
Long-Term Implications
Over-investment in overall lower-profit categories hurts total store
returns; shrinking grocery departments and tonnage depress vital
flow of funds from CPG suppliers.
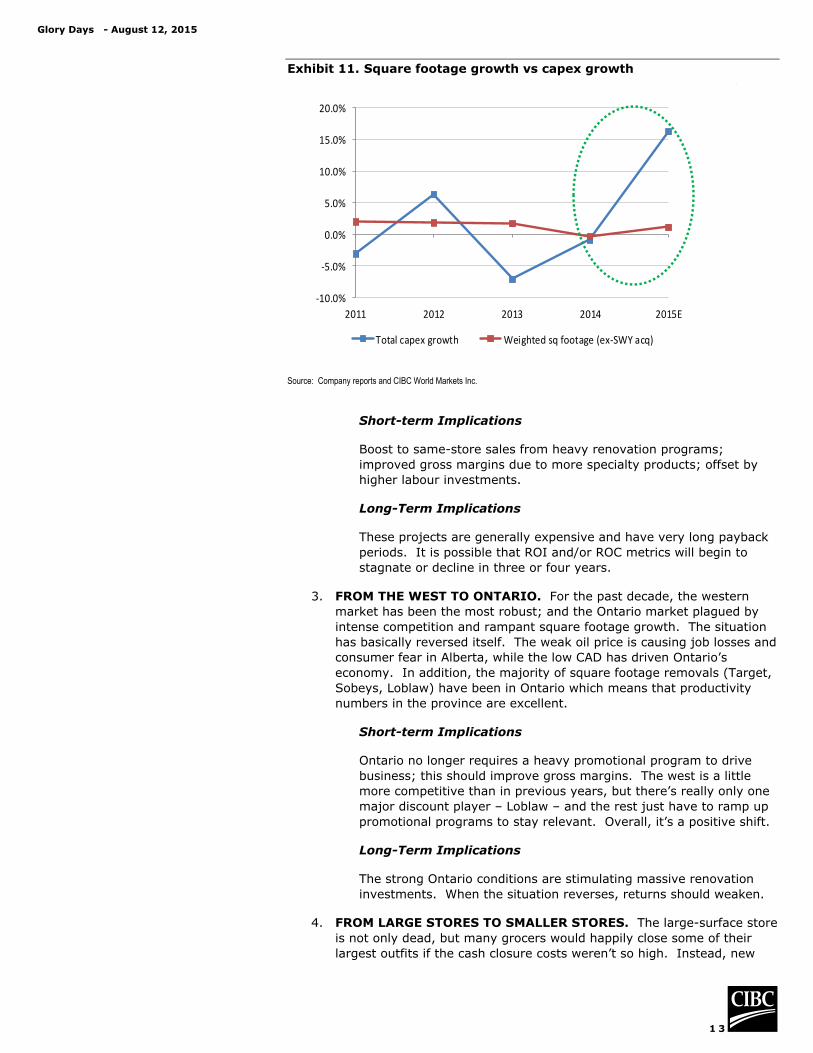
2. FROM DISCOUNT TO CONVENTIONAL. The price gap between
discount and conventional has shrunk over the past five years. Discount
stores have added SKUs, categories, premium private labels, ambience
and loyalty programs. This has boosted the average ticket at discount
stores, but at the expense of traffic. In the meantime, conventional
stores, which had relied on great locations and promotional programs to
stay relevant, have begun heavily renovating. This shows clearly in a
comparison between store-specific capex growth and weighted square
footage growth: capex-per-sq.ft. is soaring, which represents the heavy
investments in conventional assets.
Glory Days - August 12, 2015
1 3
Exhibit 11. Square footage growth vs capex growth
Source: Company reports and CIBC World Markets Inc.
Short-term Implications
Boost to same-store sales from heavy renovation programs;
improved gross margins due to more specialty products; offset by
higher labour investments.
Long-Term Implications
These projects are generally expensive and have very long payback
periods. It is possible that ROI and/or ROC metrics will begin to
stagnate or decline in three or four years.
3. FROM THE WEST TO ONTARIO. For the past decade, the western
market has been the most robust; and the Ontario market plagued by
intense competition and rampant square footage growth. The situation
has basically reversed itself. The weak oil price is causing job losses and
consumer fear in Alberta, while the low CAD has driven Ontario’s
economy. In addition, the majority of square footage removals (Target,
Sobeys, Loblaw) have been in Ontario which means that productivity
numbers in the province are excellent.
Short-term Implications
Ontario no longer requires a heavy promotional program to drive
business; this should improve gross margins. The west is a little
more competitive than in previous years, but there’s really only one
major discount player – Loblaw – and the rest just have to ramp up
promotional programs to stay relevant. Overall, it’s a positive shift.
Long-Term Implications
The strong Ontario conditions are stimulating massive renovation
investments. When the situation reverses, returns should weaken.
4. FROM LARGE STORES TO SMALLER STORES. The large-surface store
is not only dead, but many grocers would happily close some of their
largest outfits if the cash closure costs weren’t so high. Instead, new
-10.0%
-5.0%
0.0%
5.0%
10.0%
15.0%
20.0%
2011 2012 2013 2014 2015E
Total capex growth Weighted sq footage (ex-SWY acq)
Glory Days - August 12, 2015
1 4
stores tend to be ―mid-sized‖ if they are suburban stores, or very small
urban units.
Short-term Implications
None. It takes a lot of small stores to add meaningful results to your
business, and the development cycle is very long because most are
linked to urban developments.
Long-Term Implications
Because rents are huge, investment per-sq-ft is heavy, access is
tight and marketing difficult, urban stores are very ―hit-or-miss‖.
For every three that open, one will probably never be profitable and
will be headed for closure.
Other Supermarket Issues
Disappearing Tonnage
Most grocers are reporting same-store sales that are behind their inflation
numbers, suggesting that same-store ―tonnage‖ is slipping. But to be clear,
there are different definitions of tonnage. The tonnage that grocers care about
―holding‖ or ―gaining‖ is tonnage as tracked by AC Nielsen. Nielsen tonnage is
heavily weighted to center-store goods. Center-store goods are, these days, in
general decline as consumers shift to fresh categories, so it is possible that a
grocer could have had an actual tonnage volume decline, but a tonnage market
share gain.
This particular definition of tonnage matters to grocers, because the CPG
companies supplying the center-store goods also supply vendor monies
representing a substantial portion of EBITDA. If tonnage market share is
declining, it is increasingly difficult to hold out a hand for vendor contributions.
Therefore, grocers may be experiencing negative overall tonnage, while gaining
or holding tonnage share. Adding that to the highly consolidated grocery market
should be enough to keep vendor monies flowing (at least until 3G gets a hold of
them – see below).
It is also worth noting that internal inflation numbers are boosted these days by
the fact that promotional weights are much lighter than last year. In other
words, net effective volume-weighted retail prices are higher because
promotional depths are shallower (the ratio of items moving through on promo –
the ―mix‖ – has not changed, but the promotional prices are not as low). This is
the type of inflation that directly impacts tonnage. Promotional strategy is a
huge factor in Canadian retailing. If your promotions are lighter, you move less
volume. In the short-term, grocers don’t care because inflation is driving
revenues up.
Also, there is an ongoing mix shift from center-store to fresh. The average fresh
item is more expensive than the average center-store item. This mix shift
inflates the basket without boosting tonnage.
As the supermarket mix shifts from center-store to fresh departments, it is
possible that the gap between price inflation and same-store sales is systemic
and will become permanent. With the exception of temporary recovery
situations (i.e. Food Basics at Metro), the trend of customers paying more for
the same tonnage (exchanging cheese slices for aged cheddar) creates a
systemic gap between inflation and same-store sales. In other words, center-
store tonnage may decline faster than the tonnage rises in higher-priced fresh
departments. That’s not a bad thing, if grocers can keep jacking big dollars out
of CPG companies operating in a declining environment. It is also not a bad

Glory Days - August 12, 2015
1 5
thing because they make a lot more money on artisanal cheese, although it is
more expensive to service and shrinks like crazy.
Loyalty Programs
Loyalty programs continue to generate reams of customer data, and the use of
this data has not yet resulted in any meaningful improvement in operating
results. Theoretically, direct-marketing efforts through e-mail and social media
should replace the weekly flyer programs. However, there is no evidence that
flyer programs have been reduced, while spending on direct-consumer programs
climbs. Suppliers have been sold packages of consumer data and consumer
access, but these funds should NOT be considered as revenue that offsets
program costs. Instead, those funds are just a re-direction of trade funds that
would probably end up in the grocer’s pockets some other way.
Although flyer composition, promotional programs and store layouts have been
tweaked using consumer data, their benefits have not yet outweighed the
substantial program costs. We believe that material operating profit upside from
the operation and use of these programs is still many years away.
3G’ing the Suppliers
We expect CPG companies will either get bought by 3G, or re-make themselves
in 3G principles. 3G’s Kraft-Heinz company, for instance, has indicated that it
will be going after inefficient trade spending. That is an ominous signal for
grocers. Already, consultants are selling programs to ―3G‖ your consumer
product company, and embedded in all the ―ZBB‖ methods is an implication that
trade spending must be analyzed from scratch. Among other things, this
should result in less trade support for grocers. And trade support is a huge
amount of EBITDA. We believe these programs will play out slowly over the
next 3-4 years, and could have serious implications in 2018 and beyond.
New Hard Discounters
We believe that one or both of Aldi or Lidl will enter Canada in the next 2 or 3
years, and possibly sooner. Given the damage they have done to grocers in the
UK and Australia, this is of prime concern. However, starting from scratch, and
with small stores, it would probably take them 5-7 years to even dent the
productivity of existing players.
Online Grocery
We are of the opinion that, with current technologies and logistics, the
economics of online grocery selling will prevent the segment from expanding
profitably. Both configurations – click-and-collect and home delivery – are
inefficient and costly, with numerous consumer and logistical issues. This likely
will not prevent grocers from making the investment, but if investors think these
investments will generate any return in the next five years, they will probably be
disappointed. Indeed, we are concerned that continued spending on the topic
will partially suppress otherwise strong earnings growth.
Valuations And Price Target Calculations
Stability Drives Valuation
If we look at the long-term trading multiples for the Canadian grocers, we see
that every grocer is trading above its average EV/LTM EBITDA multiple. Only
Metro is near its all-time high, but Metro is probably the grocer with the greatest
probability of positive earnings revisions.

Glory Days - August 12, 2015
1 6
Exhibit 12. Grocers’ historical multiples
Source: Company reports and CIBC World Markets Inc.
Kroger (KR-NYSE) – the gold standard among US grocers – is also in the same position, trading well above its average. Whole Foods (WFM-NASDAQ) has fallen as its SSS have weakened materially and competition in its space is building.
Tesco (TSCO-L), formerly a high-flyer, is a strategic mess in a very tough grocery environment.
Canada remains one of the most favourable markets in the world for supermarkets. Sometimes, multiples can be reflective of the weak
denominators, but at this point, the grocers are actually in strong earnings recovery and momentum, and the multiples are predicting – rightly so, we believe – the possibility of positive earnings revisions. As mentioned, we are a
few months into what is likely to be a sustained strong operating environment, with remaining headwinds disappearing as we get into 2016.
Price Target Calculation – Loblaw
We value Loblaw using a Net Asset Value calculation that projects the values in
2016, and values each piece of the business separately. The REIT is valued at
the CIBC World Markets price target of $12.50. Loblaw also has properties not
in the REIT and has stated that over time they expect to sell these into the REIT.
Based on available public information [including the value of Choice (CHP.UN-
SP)], and our own internal estimates, we use a 7.19% cap rate and $12.26 cash
rent for these properties, giving them a $1.17 billion valuation.
As mentioned previously, the company no longer dissects EBITDA between the
two different parts of retail (grocery and pharmacy).
In considering the two parts of the company, Kroger – the current gold
standard among North American supermarkets – trades for 8.6x this
year’s EBITDA. Kroger does not have a standalone drugstore division, so
that’s a good proxy for a supermarket in a strong position. To that end,
we would use 8.5x EBITDA for Loblaw’s food operations.
For the drugstore operations, Jean Coutu (PJC.A-SP) trades at 12.0x this
year’s EBITDA; the three US drugstores trade at an average of 12.4x
EBITDA. In Canada, drug reform is continuing (albeit at a lesser pace),
so we would value Canadian drugstores at about 11.5x EBITDA.
As a result, we are raising our EBITDA multiple for combined operations
from 9.0x EBITDA to 10.0x EBITDA.
(Note that combined retail EBITDA is reduced by the estimated cash rent for the
non-REIT properties).
For the Financial Services business, we use an EPS calculation and a 10x
multiple, removing the FS debt from the total debt.
The net debt is projected at $3,165 million at the end of 2016, which is reduced
by free cash flow generation between now and then. Our NAV calculation
computes a gross NAV of $92; a 3% discount yields a net NAV of $89.
L MRU EMP KR WFM TSCO
EV / LTM EBITDA
Avg 9.5x 7.2x 5.8x 6.8x 13.0x 9.8x
Low 6.1x 4.5x 4.4x 5.0x 4.6x 7.9x
High 20.3x 13.5x 14.6x 18.3x 26.6x 18.2x
Now 11.2x 12.1x 7.9x 8.6x 8.2x 9.4x
Glory Days - August 12, 2015
1 7
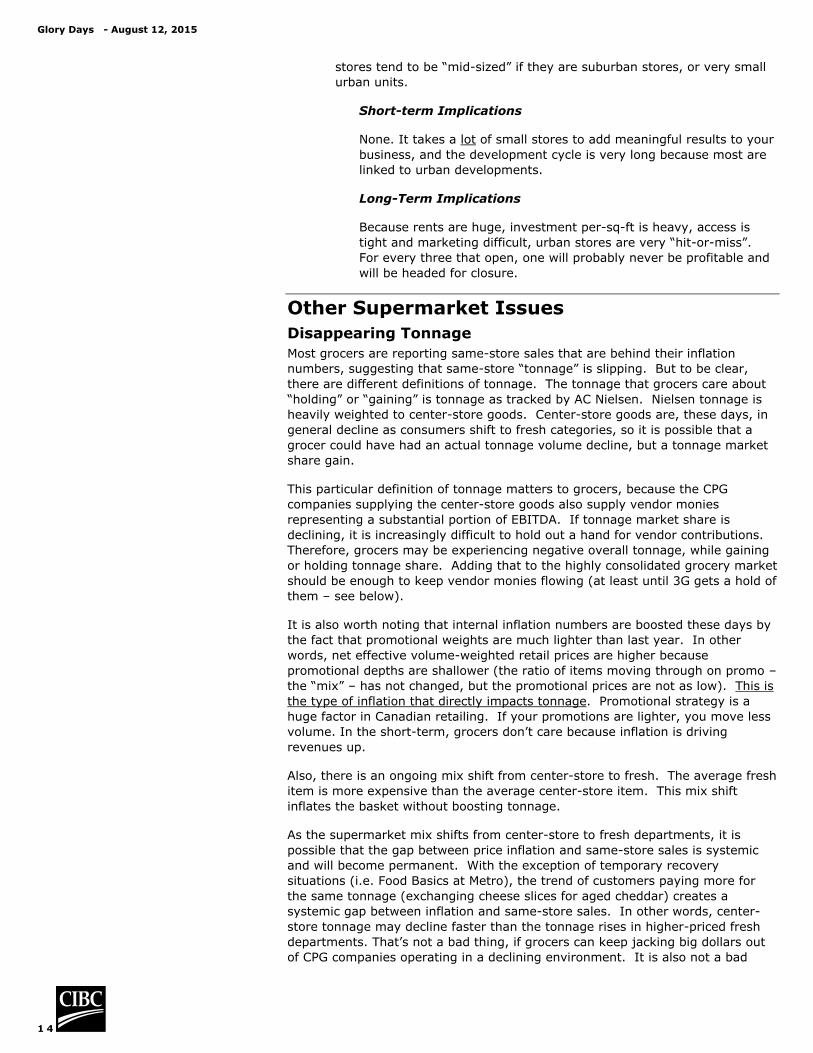
Exhibit 13. Loblaw NAV
Source: Company reports and CIBC World Markets Inc.
Our price target moves from $71 to $89 and Loblaw is now SO-rated.
Price Target Calculation – Choice Properties
At $11.50, Choice trades at 12.0x 2015E FFO, a 4% discount to our $12 NAV
estimate at a 5.75% cap rate, and yields 5.7%. Our 12- to 18-month price
target is $12.50, equating to a 13.0x 2015E FFO multiple and a modest 4%
premium to NAV. We continue to rate Choice Properties REIT Sector Performer.
Key Risks to Price Target – Loblaw
Key risks to our price target include the following: Loblaw’s EBITDA forecast
could be below our estimate; Loblaw’s share price is tied to the value of another
publicly-traded entity (CHP.UN) – changes in the CHP share price can have a
positive or negative impact on the Loblaw share price; properties not in the REIT
could be worth less than what we have estimated; rent on the properties could
be higher than what we have predicted (negatively impacting Loblaw’s EBITDA
and NAV); comparable valuations for supermarkets may decrease; higher
interest rates would negatively impact securitization (financing) rates in the
financial services businesses, negatively impacting real estate valuations as well
as the consumer; changes in generic drug pricing regulations would negatively
impact Shoppers’ EBITDA; the company may not realize synergies on the
Shoppers deal as expected; and multiples of drugstore companies could
compress.
Key Risks to Price Target – Choice Properties
Company-specific risks include: extremely high tenant concentration and credit
exposure to Loblaw; interest rate risk on debt refinancing; potential non-
renewals of leases by Loblaw upon lease expiries; the inability to achieve
economically viable rents (including anticipated increases in rents); competition
from, or the oversupply of, other similar properties, among others, are the
major risks faced by Choice.
General risks include the potential for an unanticipated increase in interest rates,
the diversion of investors’ capital flows away from high-yielding real estate
equities towards other asset classes and the functional obsolescence of real
estate.
Loblaw + SC 2016e NAV
(in millions) per share
Shares Price
Loblaw REIT (CHP.UN) 337.1 12.50$ 4,214$ 10.11$
Loblaw real estate not in REIT 1,174$ 2.82$
Retail business
2016e Retail EBITDA (Grocery + Shoppers) 3,602
less: Estimated rent expense (real estate outside REIT) 84
2016e Retail EBITDA, net 3,517$
add: Non-cash rent (outside REIT) 6
2016e Retail EBITDA, net (ex. Non-cash rent) 3,523$
Retail EV/EBITDA multiple 10.0x
Retail enterprise value 35,234$ 84.55$
EPS P/E Multiple
Financial Services 0.24$ 10.0x 981$ 2.35$
Total enterprise value 41,603$ 99.84$
Less: Net debt (cash), 2016e 3,165$ 7.60$
2016e Net Asset Value 38,438$ 92.24$
Total Equity Value, at 3% discount to NAV 89.48$
# of shares 416.7

Glory Days - August 12, 2015
1 8
Price Target Calculation – Metro
Metro continues to do everything in its power to engineer earnings as well as
responsible returns for shareholders. That discipline is reflected in very strong
multiples, and the combination of continued dividend increases and sizeable
share buybacks has commanded respect from investors.
On a P/E basis, Metro currently trades at 18.3x LTM, which is not far from the
highest seen in the past twenty years (21.4x), and 15.2x our F2016 EPS
forecast of $2.41. On an EV/EBITDA basis (without backing out the Couche-
Tard (ATD.B-SO) shares from EV), it is trading at 12.1x trailing, with 13.5x
being the peak over the past ten years. This is obviously reflective of both the
massive shift into retail/consumer stocks, and Metro’s own performance.
Multiple expansion has been at least as big a driver of share price appreciation
as has EBITDA or earnings growth.
The industry and company are experiencing an excellent 2015 with all signs
pointing to a strong 2016 as well (see our industry outlook, Glory Days, for more
detail on this). Square footage growth is minimal, the weak CAD should
eventually stop its slide, international players like Aldi and Lidl are years away
from having a material impact, and the company is firing on all cylinders by
engineering price inflation, increasing the gross margin rate, managing spending
well and making disciplined investments of capital in all the right places. In that
context, we could give Metro an EPS multiple of 18x forward, which would yield
a valuation of $43 based on F2016.
Given the position in Couche-Tard, we also use an NAV calculation as a valuation
method. In this approach, we use EV/EBITDA. Peak forward EV/EBITDA has
been in the 10x range, and Kroger (the gold standard right now) is trading for
8.6x next year’s EBITDA. If we give the grocery operations a strong multiple –
say 9.5x (up from 8.5x) – we get a $41 target price.
Exhibit 14. NAV
Source: Company reports and CIBC World Markets Inc.
Averaging the two methods, we get $42, which is our new price target, up from
$37.50, and Metro is upgraded to Sector Outperformer.
Key Risks to Price Target – Metro
Key risks to our price target include cost over-runs or execution issues, potential
for ongoing price wards, changes to the market situation in Quebec, cost
inflation with the inability to pass cost increases on to customers, as well as any
underlying operational and sales issues that could impact earnings.
Furthermore, earnings multiples among consumer staples stocks could be
negatively impacted by fund flows into other sectors.
Price Target Calculation – ATD.B
In our valuation, we ―normalize‖ the gas margins. Gas margins fluctuate from
quarter to quarter, but are relatively stable over the longer term. We value the
stock as if these margins will be at historical norms. US gas margins have
F2016E
Value Per Share
CIBC Price Target
Couche Tard share ownership 32.3 million shares at 64.00$ 2,069.9$ 8.86$
EBITDA Target Multiple
Metro Grocery Operations - 2016E 916.5$ 9.5x 8,707.0$ 37.29$
Net Debt 1,122.4$ 4.81$
Metro Common Equity 9,654.5$ 41.35$
Glory Days - August 12, 2015
1 9
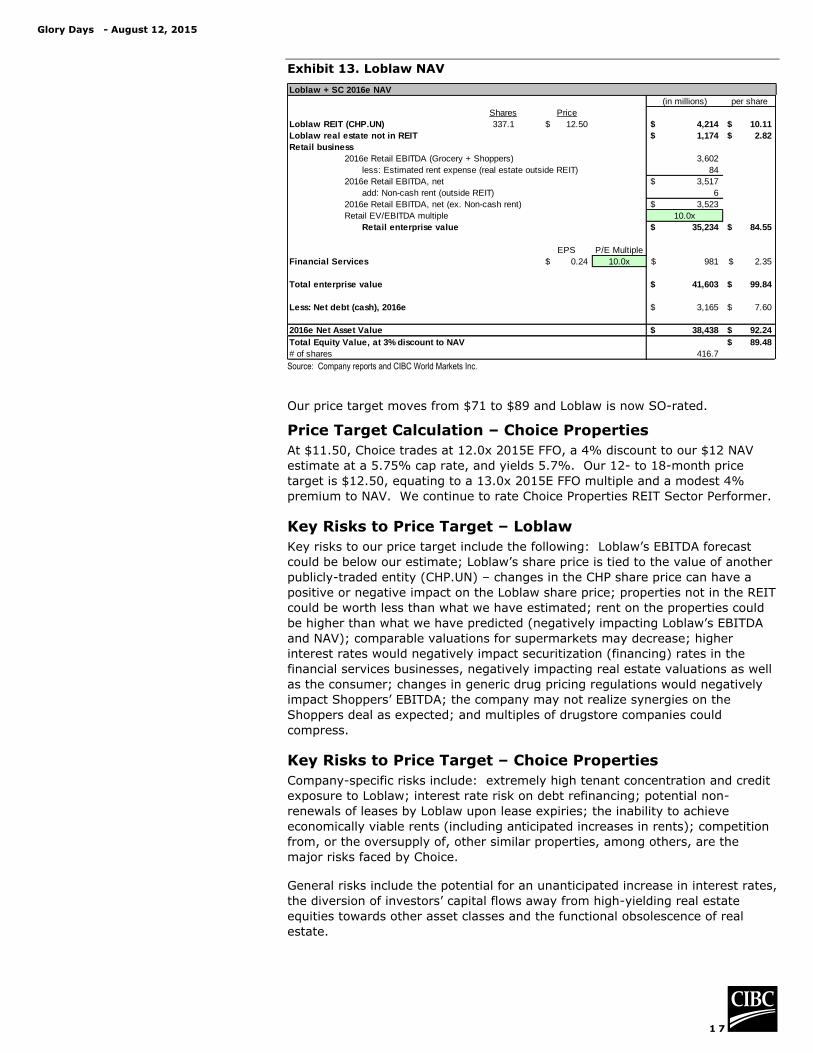
averaged about 22 cents per gallon over the last four quarters and are currently
tracking to about 17 cents in FQ1 – we therefore use a ―normalized margin‖ of
20 cents. We have increased our target EPS multiple from 20x to 22x to reflect
the increase seen in the sector, both in the US and internationally. With our
―normalized margin‖ and new multiple, the base valuation for F2016 is $55 as
seen below. If we were to look even further ahead to F2017 (with a full year of
all the newly-acquired stores), our valuation would be about $73.
Exhibit 15. Valuation
Source: Company reports and CIBC World Markets Inc.
At this point, with some risk in the fuel margins, but recognizing that there are
likely acquisitions ahead, we will use a valuation based on an average of the two
years. On that basis, our price target is $64 and ATD.B remains SO-rated.
Key Risks to Price Target – ATD.B
Key risks to our price target include the following: new store remodels fail to
deliver the expected top-line performance, due to some combination of
management’s inability to roll out the remodels as expected or aggressive price
competition from competitors; performance of the acquired SFR, Pantry and
Shell assets is below expectations; fuel margins are significantly below our
estimates or historical norms; the inability to grow in-store traffic as a result of
lower fuel volumes; and the loss of key senior management, including the CEO,
CFO, and/or COO.
F2016e F2017e
EPS forecast, US$ 1.88$ 2.69$
Adjust for $0.2/gallon US fuel margins 0.13 -
Normalized EPS, US$ 2.01$ 2.69$
CAD/USD exchange rate 1.25 1.23
Normalized EPS forecast, C$ 2.51$ 3.31$
P/E ratio 22.0x 22.0x
Equity value per share, C$ 55.29$ 72.82$

Glory Days - August 12, 2015
2 0
Source: Company reports and CIBC World Markets Inc.
Metro Inc. Sector OutperformerMRU-TSX 8/12/15 $36.57 Perry Caicco (416-594-7279) [email protected]
12- To 18- Month Price Target: $42.00 Mark Petrie, CFA (416-956-3278) [email protected]
Merchandising John Zamparo, CFA, CPA, CA (416-956-6108) [email protected]
Sector Weighting: Market Weight Matt Bank (416-594-7831) [email protected]
All figures in Canadian millions, except per share data.
P/E Ratio LY TY NY Company Profile
Metro 21.1x 17.6x 15.2x
Canadian peers 20.1x 17.3x 15.0x
US peers 21.0x 18.5x 16.9x
Average 20.8x 17.8x 15.7x
EV/EBITDA LY TY NY Investment Thesis
Metro, ex. ATD 10.3x 9.3x 8.9x
Canadian peers 10.3x 9.1x 8.6x
US peers 8.5x 8.3x 7.8x
Average 9.7x 8.9x 8.4x
Key Financial Metrics F2014A F2015E F2016E
ROE 16.6% 19.3% 20.9%
ROA 8.8% 9.7% 10.3%
After-Tax ROIC 13.2% 14.4% 23.5%
Net debt-to-EBITDA 1.3x 1.2x 1.2x
BV/Share $10.12 $11.01 $11.41
FCF 241.9 484.6 511.1
Income Statement F2014A F2015E F2016E Market Information
Same-Store Sales Growth Shares Outstanding 250.1
Total 1.2% 4.2% 2.4% Float 172.1
MRU est. Food Inflation 1.0% 3.4% 1.8% Market Capitalization $9,146.2
Square Footage Growth Net Debt $1,095.8
Total 0.7% 0.5% 0.7% Enterprise Value $10,242.0
Management
Total Sales 11,590.4 12,245.6 12,630.4
Eric La Fleche President and CEO
Gross Margin 2,214.8 2,418.7 2,519.2 François Thibault SVP, CFO and Treasurer
% of Sales 19.11% 19.75% 19.95% Christian Boubonniere SVP, Quebec Div ision
Carmen Fortino SVP, Ontario Div ision
SG&A * 1,419.4 1,543.3 1,602.7
% of Sales 12.25% 12.60% 12.69% New Store Development F2014A F2015E F2016E
EBITDA, excl ATD * 795.4 875.4 916.5 Total Sq Ft. (Mlns) 20.1 20.2 20.3
% of Sales 6.86% 7.15% 7.26% Y/Y Increase in Sq ft. 0.7% 0.5% 0.7%
2016 NAV Valuation
D&A 175.8 173.5 174.8 CIBC Price Target Value Per Share
Finance Expense 49.1 60.4 55.3 ATD Ownership 32.3 mln shares @ $64.00 $2,069.9 8.86$
Couche-Tard Earnings 49.8 59.1 82.9
Tax Expense 152.0 164.7 178.5 2016E EBITDA Target Multiple
Minority Interest 9.1 13.1 17.1 Metro Grocery Ops. $916.5 9.5x $8,707.0 37.29$
Net Earnings * 459.2 522.7 573.8 Net Debt $1,122.4 4.81$
EPS, Diluted * $1.73 $2.08 $2.41 Metro Common Equity - 2016E $9,654.5 41.35$
Apply ing 18x P/E Multiple to 2016E EPS 43.35$
SSS Growth Tonnage Growth (SSS, ex. Inflation)
* F2014 results adjusted to remove non-cash impairment expenses
Metro is a leading food retailer in Quebec with about 300 stores. It also operates over 250 stores under
numerous banners across Ontario.
Metro has the best defensive real estate position in Canada.
Its urban assets allow it to raise prices quickly to preserve margins. It has been updating both
conventional and discount stores in order to drive sales increases.
Metro is best positioned among the grocers to take advantage of what should be an excellent operating
environment in 2015 and 2016. Square footage growth is minimal, the CAD headwinds should at
some point subside, the entry from competitors like Aldi and Lidl should be years away, and from an
execution point of v iew, the company is firing on all cy linders.
Metro’s strong cash generation puts it in position to return cash to shareholders or participate in
Canadian market consolidation.
-4.0%
-2.0%
0.0%
2.0%
4.0%
6.0%
8.0%
-1.5%
-1.0%
-0.5%
0.0%
0.5%
1.0%
1.5%

Glory Days - August 12, 2015
2 1
Source: Company reports and CIBC World Markets Inc.
Loblaw Companies Limited Sector OutperformerL-TSX 8/12/15 $71.60 Perry Caicco (416-594-7279) [email protected]
12- To 18- Month Price Target: $89.00 Mark Petrie, CFA (416-956-3278) [email protected]
Merchandising John Zamparo, CFA (416-956-6108) [email protected]
Sector Weighting: Market Weight Matt Bank (416-594-7831) [email protected]
All figures in Canadian millions, except per share data.
P/E Ratio LY TY NY
Loblaw 22.5x 21.0x 18.4x
Canadian Peers 10.0x 15.0x 13.6x
US Peers 8.2x 17.9x 16.3x
Global Average 8.7x 17.4x 15.3x
EV/EBITDA LY TY NY
Loblaw 11.0x 10.7x 10.0x
Canadian Peers 10.0x 9.2x 9.0x
US Peers 8.2x 8.0x 7.6x
Global Average 8.7x 7.8x 7.4x
Key Financial Metrics F2014A F2015E F2016E
ROE 10.2% 11.1% 12.7%
ROA 3.8% 4.2% 4.8%
After-Tax ROIC 6.8% 7.2% 7.9%
Net debt-to-EBITDA (excluding FS and Choice) 2.6x 2.5x 1.6x
BV/Share $30.18 $33.08 $35.81
FCF 1,144.0 1,386.6 1,684.1
Income Statement (excl Choice) F2014A F2015E F2016E
SSS growth, Loblaw 2.1% 2.8% 1.5% Shares Outstanding 412.0
L est. Food Inflation 2.6% 2.8% 1.5% Float 216.6
Total square footage growth 0.7% 0.2% 0.4% Market Capitalization $29,499.2
Net Debt $8,378.0
SSS growth - pharmacy 2.7% 3.5% 3.0% Enterprise Value $37,877.2
SSS growth - front-end 2.5% 3.3% 2.5%
Galen Weston Executive Chairman and President
PC Financial - total revenue growth 9.6% 6.7% 5.1% Richard Dufresne CFO
Mike Motz President, Shoppers Drug Mart
Total Revenue (incl Financial Services) 45,059.0 45,219.3 46,239.1
Gross Margin 12,475.0 12,511.1 12,850.5 Shares Price Enterprise Value Per L Share
% of Sales 27.69% 27.67% 27.79% Loblaw REIT (CHP.UN) 337.1 $12.50 $4,214 $10.11
Loblaw real estate not in REIT $1,174 $2.82
SG&A 9,045.6 8,962.9 9,048.5
% of Sales 20.08% 19.82% 19.57% 2016e Retail EBITDA (Grocery + Shoppers) $3,602
less: Estimated rent expense (real estate outside REIT) $84
EBITDA 3,429.4 3,548.2 3,802.1 2016e Retail EBITDA, net $3,517
% of Sales 7.61% 7.85% 8.22% add: Non-cash rent (outside REIT) $6
2016e Retail EBITDA, net (ex. Non-cash rent) $3,523
D&A 1,128.0 1,104.5 1,144.8 Retail EV/EBITDA multiple 10.0x
Interest Expense 559.0 500.0 449.2 Retail enterprise value $35,234 $84.55
Tax Expense 116.5 526.3 585.1 Financial Serv ices EPS - 2016E $0.24
10.0x $981 $2.35
Adjusted Net Earnings 1,207.4 1,422.3 1,622.9 Total Enterprise Value $41,603 $99.84
Less: Net debt (cash), 2016e $3,165 $7.60
Adjusted Diluted EPS $3.18 $3.41 $3.89 Total Net Asset Value $38,438 $92.24
Equity Value @ 3% Discount $89.48
Loblaw - SSS Growth and Tonnage Growth (SSS, ex. Inflation) Shoppers Drug Mart - SSS-Pharmacy and SSS-Front End
Market Information
Management
2016e NAV
Company Profile
Loblaw Companies, majority-owned by George Weston, has more than $40 billion in sales and is the largest food
retailer in Canada, with operations in every prov ince. The company has the largest grocery in Canada as well
as the largest pharmacy. Loblaw also owns a majority stake in Choice Properties REIT and has a Financial
Serv ices business.
Investment Thesis
Loblaw is now a holding company with investments in real estate, grocery, drugstores and financial serv ices.
The core grocery business has moderate square footage growth and is capitalizing off food price inflation, though
generating same-store tonnage growth has been challenging.
The integration of Shoppers is well under way and synergies are being captured faster than the targeted rate.
Driv ing future revenue synergies is in question.
A relatively uncompetitive market in the near-term should allow for growth in the grocery div ision, but regulatory
reform will be an ongoing headwind at Shoppers.
-4%
-2%
0%
2%
4%
Same Store Sales Estimated Tonnage Growth
-2%
0%
2%
4%
6%
8%
SSS-pharmacy SSS-front-end

Glory Days - August 12, 2015
2 2
IMPORTANT DISCLOSURES:
Analyst Certification: Each CIBC World Markets research analyst named on the front page of this research report, or
at the beginning of any subsection hereof, hereby certifies that (i) the recommendations and opinions expressed herein
accurately reflect such research analyst's personal views about the company and securities that are the subject of this
report and all other companies and securities mentioned in this report that are covered by such research analyst and (ii)
no part of the research analyst's compensation was, is, or will be, directly or indirectly, related to the specific
recommendations or views expressed by such research analyst in this report.
Potential Conflicts of Interest: Equity research analysts employed by CIBC World Markets are compensated from
revenues generated by various CIBC World Markets businesses, including the CIBC World Markets Investment Banking
Department. Research analysts do not receive compensation based upon revenues from specific investment banking
transactions. CIBC World Markets generally prohibits any research analyst and any member of his or her household from
executing trades in the securities of a company that such research analyst covers. Additionally, CIBC World Markets
generally prohibits any research analyst from serving as an officer, director or advisory board member of a company that
such analyst covers.
In addition to 1% ownership positions in covered companies that are required to be specifically disclosed in this report,
CIBC World Markets may have a long position of less than 1% or a short position or deal as principal in the securities
discussed herein, related securities or in options, futures or other derivative instruments based thereon.
Recipients of this report are advised that any or all of the foregoing arrangements, as well as more specific disclosures
set forth below, may at times give rise to potential conflicts of interest.
Important Disclosure Footnotes for Companies Mentioned in this Report that Are Covered
by CIBC World Markets Inc.:
Stock Prices as of 08/12/2015:
Alimentation Couche-Tard Inc. (2g, 7, 12) (ATD.B-TSX, $58.36, Sector Outperformer)
Canadian Tire Corporation, Ltd. (2g, 7, 13) (CTC.A-TSX, $130.47, Sector Outperformer)
Choice Properties REIT (2a, 2c, 2e, 2g) (CHP.UN-TSX, $11.50, Sector Performer)
Crombie REIT (2a, 2e, 2g) (CRR.UN-TSX, $13.13, Sector Outperformer)
Dollarama Inc. (2a, 2e, 2g) (DOL-TSX, $78.58, Sector Outperformer)
Empire Company Limited (2g, 9, 13) (EMP.A-TSX, $91.56, Sector Performer)
Hudson's Bay Co. (2g) (HBC-TSX, $25.58, Sector Outperformer)
Jean Coutu Group (PJC) Inc. (2g, 7, 12) (PJC.A-TSX, $20.83, Sector Performer)
Loblaw Companies Limited (2a, 2c, 2e, 2g) (L-TSX, $71.60, Sector Outperformer)
Metro Inc. (2a, 2c, 2e, 2g) (MRU-TSX, $36.57, Sector Outperformer)
RONA Inc. (2g) (RON-TSX, $15.32, Sector Underperformer)
Sears Canada Inc. (2g) (SCC-TSX, $7.26, Sector Performer)
Companies Mentioned in this Report that Are Not Covered by CIBC World Markets Inc.:
Stock Prices as of 08/12/2015:
Costco Wholesale Corp. (COST-NASDAQ, US$146.49, Not Rated)
Home Depot (HD-NYSE, US$117.69, Not Rated)
Kraft Heinz (KHC-NASDAQ, US$76.69, Not Rated)
Kroger Co. (KR-NYSE, US$37.80, Not Rated)
Target Corp. (TGT-NYSE, US$79.00, Not Rated)
Tesco Plc. (TSCO-L, p2.05, Not Rated)
TJX Companies, Inc. (TJX-NYSE, US$70.07, Not Rated)

Glory Days - August 12, 2015
2 3
Companies Mentioned in this Report that Are Not Covered by CIBC World Markets Inc.:
(Continued)
Stock Prices as of 08/12/2015:
Wal-Mart (WMT-NYSE, US$72.58, Not Rated)
Whole Foods Market, Inc. (WFM-NASDAQ, US$34.27, Not Rated)
Important disclosure footnotes that correspond to the footnotes in this table may be found in the "Key to
Important Disclosure Footnotes" section of this report.
Glory Days - August 12, 2015
2 4
Key to Important Disclosure Footnotes:
1 CIBC World Markets Corp. makes a market in the securities of this company.
1a CIBC WM Corp. makes a market in the securities of this company
1b CIBC WM Corp. makes a market in the securities of this company
1c CIBC WM Corp. makes a market in the securities of this company
2a This company is a client for which a CIBC World Markets company has performed investment banking services
in the past 12 months.
2b CIBC World Markets Corp. has managed or co-managed a public offering of securities for this company in the
past 12 months.
2c CIBC World Markets Inc. has managed or co-managed a public offering of securities for this company in the
past 12 months.
2d CIBC World Markets Corp. has received compensation for investment banking services from this company in
the past 12 months.
2e CIBC World Markets Inc. has received compensation for investment banking services from this company in the
past 12 months.
2f CIBC World Markets Corp. expects to receive or intends to seek compensation for investment banking services
from this company in the next 3 months.
2g CIBC World Markets Inc. expects to receive or intends to seek compensation for investment banking services
from this company in the next 3 months.
3a This company is a client for which a CIBC World Markets company has performed non-investment banking,
securities-related services in the past 12 months.
3b CIBC World Markets Corp. has received compensation for non-investment banking, securities-related services
from this company in the past 12 months.
3c CIBC World Markets Inc. has received compensation for non-investment banking, securities-related services
from this company in the past 12 months.
4a This company is a client for which a CIBC World Markets company has performed non-investment banking,
non-securities-related services in the past 12 months.
4b CIBC World Markets Corp. has received compensation for non-investment banking, non-securities-related
services from this company in the past 12 months.
4c CIBC World Markets Inc. has received compensation for non-investment banking, non-securities-related
services from this company in the past 12 months.
5a The CIBC World Markets Corp. analyst(s) who covers this company also has a long position in its common
equity securities.
5b A member of the household of a CIBC World Markets Corp. research analyst who covers this company has a
long position in the common equity securities of this company.
6a The CIBC World Markets Inc. fundamental analyst(s) who covers this company also has a long position in its
common equity securities.
6b A member of the household of a CIBC World Markets Inc. fundamental research analyst who covers this
company has a long position in the common equity securities of this company.
7 CIBC World Markets Corp., CIBC World Markets Inc., and their affiliates, in the aggregate, beneficially own 1%
or more of a class of equity securities issued by this company.
8 An executive of CIBC World Markets Inc. or any analyst involved in the preparation of this research report has
provided services to this company for remuneration in the past 12 months.
9 An executive committee member or director of Canadian Imperial Bank of Commerce (―CIBC‖), the parent
company to CIBC World Markets Inc. and CIBC World Markets Corp., or a member of his/her household is an
officer, director or advisory board member of this company or one of its subsidiaries.
10 Canadian Imperial Bank of Commerce ("CIBC"), the parent company to CIBC World Markets Inc. and CIBC
World Markets Corp., has a significant credit relationship with this company.
11 The equity securities of this company are restricted voting shares.
12 The equity securities of this company are subordinate voting shares.
13 The equity securities of this company are non-voting shares.
14 The equity securities of this company are limited voting shares.

Glory Days - August 12, 2015
2 5
CIBC World Markets Inc. Stock Rating System
Abbreviation Rating Description
Stock Ratings
SO Sector Outperformer Stock is expected to outperform the sector during the next 12-18 months.
SP Sector Performer Stock is expected to perform in line with the sector during the next 12-18 months.
SU Sector Underperformer Stock is expected to underperform the sector during the next 12-18 months.
NR Not Rated CIBC World Markets does not maintain an investment recommendation on the stock.
R Restricted CIBC World Markets is restricted (due to potential conflict of interest) from rating the stock.
Sector Weightings (note: Broader market averages refer to S&P 500 in the U.S. and S&P/TSX Composite in Canada.)
O Overweight Sector is expected to outperform the broader market averages.
M Market Weight Sector is expected to equal the performance of the broader market averages.
U Underweight Sector is expected to underperform the broader market averages.
NA None Sector rating is not applicable.
"Speculative" indicates that an investment in this security involves a high amount of risk due to volatility and/or liquidity issues.
Ratings Distribution*: CIBC World Markets Inc. Coverage Universe
(as of 12 Aug 2015) Count Percent Inv. Banking Relationships Count Percent
Sector Outperformer (Buy) 154 42.3% Sector Outperformer (Buy) 146 94.8%
Sector Performer (Hold/Neutral) 164 45.1% Sector Performer (Hold/Neutral) 154 93.9%
Sector Underperformer (Sell) 37 10.2% Sector Underperformer (Sell) 33 89.2%
Restricted 8 2.2% Restricted 8 100.0%
Ratings Distribution: Merchandising Coverage Universe
(as of 12 Aug 2015) Count Percent Inv. Banking Relationships Count Percent
Sector Outperformer (Buy) 5 38.5% Sector Outperformer (Buy) 5 100.0%
Sector Performer (Hold/Neutral) 7 53.8% Sector Performer (Hold/Neutral) 7 100.0%
Sector Underperformer (Sell) 1 7.7% Sector Underperformer (Sell) 1 100.0%
Restricted 0 0.0% Restricted 0 0.0%
Merchandising Sector includes the following tickers: CTC.A, DOL, EMP.A, HBC, L, LIQ, MRU, NWC, PJC.A, RET.A, RON, SCC, WN.
*Although the investment recommendations within the three-tiered, relative stock rating system utilized by CIBC World Markets Inc.
do not correlate to buy, hold and sell recommendations, for the purposes of complying with NYSE and NASD rules, CIBC World
Markets Inc. has assigned buy ratings to securities rated Sector Outperformer, hold ratings to securities rated Sector Performer, and
sell ratings to securities rated Sector Underperformer without taking into consideration the analyst's sector weighting.
Important disclosures required by IIROC Rule 3400, can be obtained by visiting CIBC World Markets Inc. on the web at http://researchcentral.cibcwm.com. Important disclosures for each issuer can be found using the "Coverage" tab on the
top left of the Research Central home page. Access to the system for rating investment opportunities and our dissemination policy, can be found under 'Quick Links' on bottom right side of the Research Central homepage. These important disclosures can also be obtained by writing to CIBC World Markets Inc., Brookfield Place, 161 Bay Street, 4th
Floor, Toronto, Ontario M5J 2S8, Attention: Research Disclosures Request
CIBC World Markets Inc. Price Chart
For price and performance information charts required under NYSE and NASD rules, please visit CIBC on the web at http://apps.cibcwm.com/sec2711 or write to CIBC World Markets Inc., Brookfield Place, 161 Bay Street, 4th Floor, Toronto, Ontario M5J 2S8, Attn: Research Disclosure Chart Request.

Glory Days - August 12, 2015
2 6
Legal Disclaimer
This report is issued and approved for distribution by (a) in Canada, CIBC World Markets Inc., a member of the
Investment Industry Regulatory Organization of Canada (―IIROC‖), the Toronto Stock Exchange, the TSX Venture
Exchange and a Member of the Canadian Investor Protection Fund, (b) in the United Kingdom, CIBC World Markets plc, is
Authorised by the Prudential Regulation Authority and regulated by the Financial Conduct Authority and the Prudential
Regulation Authority, (c) in Australia to wholesale clients only, CIBC Australia Ltd, a company regulated by the ASIC with
AFSL license number 240603 and ACN 000 067 256, and (d) in Japan, CIBC World Markets (Japan) Inc., a registered
Type 1 Financial product provider with the registration number Director General of Kanto Finance Bureau #218
(collectively, ―CIBC World Markets‖) and (e) in the United States either by (i) CIBC World Markets Inc. for distribution
only to U.S. Major Institutional Investors (―MII‖) (as such term is defined in SEC Rule 15a-6) or (ii) CIBC World Markets
Corp., a member of the Financial Industry Regulatory Authority (―FINRA‖). U.S. MIIs receiving this report from CIBC
World Markets Inc. (the Canadian broker-dealer) are required to effect transactions (other than negotiating their terms)
in securities discussed in the report through CIBC World Markets Corp. (the U.S. broker-dealer).
This report is provided, for informational purposes only, to institutional investor and retail clients of CIBC World
Markets in Canada, and does not constitute an offer or solicitation to buy or sell any securities discussed herein in any
jurisdiction where such offer or solicitation would be prohibited. This document and any of the products and information
contained herein are not intended for the use of Retail investors in the United Kingdom. Such investors will not be able to
enter into agreements or purchase products mentioned herein from CIBC World Markets plc. The comments and views
expressed in this document are meant for the general interests of wholesale clients of CIBC Australia Ltd.
This report has been prepared by the CIBC group and is issued in Hong Kong by Canadian Imperial Bank of
Commerce, Hong Kong Branch, a registered institution under the Securities and Futures Ordinance, Cap 571 (the ―SFO‖).
This report is intended for ―professional investors‖ only (within the meaning of the SFO) and has been prepared for
general circulation and does not take into account the objectives, financial situation or needs of any recipient. Any
recipient in Hong Kong who has any questions or requires further information on any matter arising from or relating to
this report should contact Canadian Imperial Bank of Commerce, Hong Kong Branch at Suite 3602, Cheung Kong Centre,
2 Queen's Road Central, Hong Kong (telephone number: +852 2841 6111). Orders for Hong Kong listed securities will be
executed by Canadian Imperial Bank of Commerce, Hong Kong Branch. Canadian Imperial Bank of Commerce, Hong
Kong Branch has entered into an arrangement with its broker-dealer affiliates worldwide to execute orders for securities
listed outside of Hong Kong for Hong Kong clients.
This report is intended for distribution in Singapore solely to ―institutional investors‖ (within the meanings of the
Financial Advisers Act (Chapter 110 of Singapore)).
The securities mentioned in this report may not be suitable for all types of investors. This report does not take into
account the investment objectives, financial situation or specific needs of any particular client of CIBC World Markets.
Recipients should consider this report as only a single factor in making an investment decision and should not rely solely
on investment recommendations contained herein, if any, as a substitution for the exercise of independent judgment of
the merits and risks of investments. The analyst writing the report is not a person or company with actual, implied or
apparent authority to act on behalf of any issuer mentioned in the report. Before making an investment decision with
respect to any security recommended in this report, the recipient should consider whether such recommendation is
appropriate given the recipient's particular investment needs, objectives and financial circumstances. CIBC World
Markets suggests that, prior to acting on any of the recommendations herein, Canadian retail clients of CIBC World
Markets contact one of our client advisers in your jurisdiction to discuss your particular circumstances. Non-client
recipients of this report who are not institutional investor clients of CIBC World Markets should consult with an
independent financial advisor prior to making any investment decision based on this report or for any necessary
explanation of its contents. CIBC World Markets will not treat non-client recipients as its clients solely by virtue of their
receiving this report.
Past performance is not a guarantee of future results, and no representation or warranty, express or implied, is
made regarding future performance of any security mentioned in this report. The price of the securities mentioned in this
report and the income they produce may fluctuate and/or be adversely affected by exchange rates, and investors may
realize losses on investments in such securities, including the loss of investment principal. CIBC World Markets accepts
no liability for any loss arising from the use of information contained in this report, except to the extent that liability may
arise under specific statutes or regulations applicable to CIBC World Markets.
Information, opinions and statistical data contained in this report were obtained or derived from sources believed to
be reliable, but CIBC World Markets does not represent that any such information, opinion or statistical data is accurate
or complete (with the exception of information contained in the Important Disclosures section of this report provided by
CIBC World Markets or individual research analysts), and they should not be relied upon as such. All estimates, opinions
and recommendations expressed herein constitute judgments as of the date of this report

Glory Days - August 12, 2015
2 7
Legal Disclaimer (Continued)
and are subject to change without notice.
Nothing in this report constitutes legal, accounting or tax advice. Since the levels and bases of taxation can change,
any reference in this report to the impact of taxation should not be construed as offering tax advice on the tax
consequences of investments. As with any investment having potential tax implications, clients should consult with their
own independent tax adviser.
This report may provide addresses of, or contain hyperlinks to, Internet web sites. CIBC World Markets has not
reviewed the linked Internet web site of any third party and takes no responsibility for the contents thereof. Each such
address or hyperlink is provided solely for the recipient's convenience and information, and the content of linked third
party web sites is not in any way incorporated into this document. Recipients who choose to access such third-party web
sites or follow such hyperlinks do so at their own risk.
Although each company issuing this report is a wholly owned subsidiary of Canadian Imperial Bank of Commerce
(―CIBC‖), each is solely responsible for its contractual obligations and commitments, and any securities products offered
or recommended to or purchased or sold in any client accounts (i) will not be insured by the Federal Deposit Insurance
Corporation (―FDIC‖), the Canada Deposit Insurance Corporation or other similar deposit insurance, (ii) will not be
deposits or other obligations of CIBC, (iii) will not be endorsed or guaranteed by CIBC, and (iv) will be subject to
investment risks, including possible loss of the principal invested. The CIBC trademark is used under license.
© 2015 CIBC World Markets Inc. All rights reserved. Unauthorized use, distribution, duplication or disclosure
without the prior written permission of CIBC World Markets is prohibited by law and may result in prosecution.