institutional delivery service utilization and associated
TRANSCRIPT

Page 1/35
Institutional Delivery Service Utilization and Associated Factors inEthiopia: A Systematic Review and Meta AnalysisAdane Nigusie ( [email protected] )
University of Gondar https://orcid.org/0000-0003-0321-8542Telake Azale
University of GondarMezgebu Yitayal
University of Gondar
Research article
Keywords: skilled birth attendance, women, facility-based delivery
Posted Date: May 15th, 2020
DOI: https://doi.org/10.21203/rs.2.13059/v3
License: This work is licensed under a Creative Commons Attribution 4.0 International License. Read Full License
Version of Record: A version of this preprint was published on June 15th, 2020. See the published version athttps://doi.org/10.1186/s12884-020-03032-5.

Page 2/35
AbstractBackground: Different primary studies in Ethiopia showed the weight of institutional delivery service utilization and the factorsassociated with it. However, variation among those studies was seen. This study was aimed to estimate the pooled nationalprevalence and associated factors of Institutional delivery service utilization in Ethiopia.
Methods: PubMed, Cochrane library, Web of Science, and Google Scholar were searched. A funnel plot and Egger’s regression testwere used to see publication bias. I-squared statistic was applied to check heterogeneity of studies. A weighted Dersimonian lairedrandom effect model was applied to estimate the pooled national prevalence and the effect size of associated factors.
Result: A total of twenty four studies were included in this review. The pooled prevalence of Institutional delivery service utilizationwas 31% (95% Con�dence interval (CI): 30%, 31.2%; I 2 = 0.00%). Attitude towards institutional delivery of 3 studies(Adjusted OddRatio (AOR)=2.83; 95% CI 1.35,5.92 ), maternal age at �rst pregnancy of 4 studies(AOR= 3.59; 95% CI 2.27,5.69 ), residence setting of7 studies (AOR= 3.84; 95% CI 1.31, 11.25), educational status of 5 studies(AOR=2.91;95% 1.88,4.52), availability of informationsource of 6 studies(AOR= 1.80;95% CI 1.16,2.78), ANC follow-up of 13 studies((AOR= 2.57 95% CI 1.46,4.54 )), frequency of ANCfollow up of 4 studies(AOR= 4.04;95% CI 1.21,13.46), knowledge of institutional delivery & danger signs during pregnancy of 11studies((AOR=3.04;95% CI 1.76 ,5.24 )) and place of birth the most recent birth of 4 studies(AOR=8.44;95% CI 5.75,12.39) wereidenti�ed factors of institutional delivery service utilization.
Conclusions: The �ndings of this review found several modi�able factors such as empowering women through education, promotingantenatal care to prevent home delivery, increasing awareness of women through mass media and making services more accessiblewould likely to increase utilization of institutional delivery.
BackgroundGlobally, in the 25 years between 1990 and 2015 a total of 13.6 million women have died due to complications during and followingpregnancy and child birth [1]. Majority of maternal health complications and deaths occurred in low and middle income countries.And 75% of the deaths are due to preventable direct obstetric complications [2-6].Institutional delivery service utilization ensures safebirth, reduce both actual and potential complications and maternal death and increase the survival `of most mothers and newborns.But most deliveries in developing countries occur at home without skilled birth attendants[1, 7]. Even though many developingcountries tried their best to optimize key and effective maternal health interventions to improve maternal health[8] the progress madewas low.
Behavioral intention (BI) is an indication of a person's readiness to perform a given behavior or action. Intention of pregnant womento utilize institutional delivery is affected by socio-demographic variables; household monthly income, health institution, motheroccupation and husband occupation had signi�cant effect on the odds of giving birth at health institutions and �ve variables(perceived susceptibility, perceived barriers, self-e�cacy, being able to make decision on her own and being informed where to deliverwere predictors of the probability of giving birth at health institution[9]. In 2014, about 71 % of women delivered with the support of askilled birth attendant which is better as compared to 59 % in 1990 worldwide.
On the other hand, there is little progress in closing the gap in antenatal care between urban and rural women[10]. The risk ofmaternal death is now increasingly concentrated in sub-Saharan Africa as a result of high fertility rates combined with inadequateaccess to quality antenatal care and skilled attendance at birth. To achieve the goal of ending preventable maternal, new born andchild deaths in the Sustainable Development Goals (SDG) it will be essential to bring about signi�cant improvements in levels ofcoverage, and quality of care provided before, during and after birth. The type of assistance a woman receives during childbirth hasimportant health consequences for both the mother and child[11]. Since most maternal deaths and obstetric complications clusteraround the time of delivery [7] and cannot be predicted a priori, skilled attendance at birth remains the most important intervention inreducing maternal mortality and complications. Skilled attendance during labor, delivery and the early post-partum period couldreduce an estimated 13-33% of maternal deaths [12]. Recent data, however, suggest that the skilled attendance at birth (SBA) rate isvery low in many settings, especially in sub-Saharan African and South Asian countries. A �nding from Uttarakh and India showsthat only 33% of study participants delivered their index child in health facility[13].On the other hand a �nding from Ethiopia showsthat only 11.3%women were delivered their index child in health facility[14].

Page 3/35
In sub-Saharan Africa, a woman’s risk of dying from treatable or preventable complications of pregnancy and childbirth over thecourse of her lifetime is 1 in 22, compared to 1 in 7,300 in the developed regions [15] Even though the maternal mortality of Ethiopia shows improvement from 2011 Ethiopian Demographic and Health Survey (EDHS), still it is one of the highest �gure, accounting 412 deaths per 100,000 live births [16].
The health care seeking behavior of a woman regarding institutional delivery affects her chances of accessing and receivinginstitutional delivery care, particularly in developing countries where an equitable health care system is yet to be set up. Mothers withlow health care seeking behavior regarding institutional delivery have a disproportionate burden of maternal deaths. Therefore, thissystematic review and meta-analysis was aimed, �rstly, to estimate the pooled prevalence of institutional delivery service utilizationand secondly, to estimate the effect size of associated factors of Institutional delivery service utilization in Ethiopian context, therebymaking the available evidence accessible for decision makers (Figure 1).
MethodsReview protocol were developed/prepared based on the Preferred Reporting Items for Systematic Reviews and Meta-Analyses(PRISMA-P), 2015 [17] ,submitted and published in PROSPERO with an ID= CRD42019124210. Database was searched for the samesystematic review to avoid duplications. The website (http://www.library.UCSF.edu), PROSPERO and Cochrane/Wiley library exploredto con�rm whether previous systematic review or meta-analysis exists.
Inclusion and exclusion criteria
Cross-sectional, case-control, and cohort studies were included. Those studies had reported the prevalence and/or at least oneassociated factors of institutional delivery service utilization and published in English were considered. Studies conducted in allregion of Ethiopia(Amhara,Oromiya,SNNPR,Tigray,Bie.Guz,Afar,Gambiela,Somalia,Harari,Dirie Dawa and Addis Abeba) since 2010 upto December 30/2018 were considered for the review. The main reason for the year 2010 was selected as the starting point as homedelivery free (HDF) strategy (including free maternal services, availability of ambulance etc...) was not clearly available in all parts ofEthiopia prior to this. Citations without abstract and/ or full-text, anonymous reports, editorials, and qualitative studies were excludedfrom the analysis.
Population/Participants....... reproductive aged women (15–49 years) who were bringing a child in the last two years and wholive in Ethiopia.
Interventions/Exposure.........Institutional delivery
Outcome........Institutional delivery service utilization
Study design...... Cross-sectional, case-control, and cohort studies
Searching strategy and information sources
Pub Med, Web of Science, Cochrane library, Google, and Google Scholar were accessed. Articles with incomplete reported data werehandled through contacting authors. The core search terms and phrases were Institutional delivery health facility deliveryservice factors associated reproductive age women 15-49 year’s women and Ethiopia . The search strategies were
developed using different Boolean operators.
Particularly, to �t advanced PubMed database, the following search strategy was applied:
[(Institutional delivery) [All Fields] OR Institutional delivery [MeSH Terms])] AND [service) [All Fields] OR service [MeSH Terms])] AND[factors) [All Fields] OR factors [MeSH Terms])] AND [reproductive age women) [All Fields] OR reproductive age women [MeSHTerms]) OR 15-49 years women) [All Fields] OR 15-49 years women [MeSH Terms]] AND [Ethiopia].
Data extraction
Two independent reviewers extracted data using a structured data extraction form. Whenever variations of extracted data observed,the phase was repeated. If discrepancies between data extractors continued, third reviewer was involved. The name of the �rst

Page 4/35
author and year, the study region, the study design, the target population, the sample size, prevalence of institutional delivery serviceutilization, and Adjusted Odd Ratio (AOR) with Con�dence interval (CI) of associated factors were collected.
Study selection
Retrieved studies were exported to reference manager software, Endnote version 7 to remove duplicate studies; in which 203 articleswere removed. Three independent reviewers screened the title and abstract. The disagreement between the reviewers was handledbased on established article selection criteria. Fifty four (54) articles/studies title and abstracts’ is not �t (is not relate) with ourreview i.e. studies title without abstract and or full text so that excluded from full text assessment. Forty three (43) articles weregoing for full text assessment of the eligibility and 19 of them were excluded from synthesis because the outcome variable andstudy subject are not the same with our review objectives. Twenty four (24) studies/articles were included in the prevalence and/orassociated factor estimation (Figure 2). Three independent authors conducted the abstract and full-text review.
Quality assessment/critical appraisal
Three independent authors appraised the quality of individual studies. The Joanna Briggs Institute (JBI) quality appraisal checklistwas used [18, 19] . The disagreement was resolved by the interference of third reviewer. The following items were used to appraisecohort studies:
[1] Similarity of groups, [2] Similarity of exposure measurement, [3] Validity and reliability of measurement, [4] Identi�cation ofconfounder, [5] Strategies to deal with confounder, [6] Appropriateness of groups/participants at the start of the study, [7] Validity andreliability of outcome measured, [8] Su�ciency of follow-up time, [9] Completeness of follow-up or descriptions of reason to loss tofollow-up, [10] Strategies to address incomplete follow-up, and
[11] Appropriateness of statistical analysis. Studies got 50% and above of the quality scale were considered low risk. We have onlyone cohort/follow up study and got a score of 81.2% of the quality scale, which is low risk and can be included in the study.
The items used to appraise case-control studies were:
[1] Comparable groups, [2] Appropriateness of cases and controls, [3] Criteria to identify cases and controls, [4] Standardmeasurement of exposure, [5] Similarity in measurement of exposure for cases and controls, [6] Handling of confounder ,[7]Strategies to handle confounder, [8] Standard assessment of outcome, [9] Appropriateness of duration for exposure, and [10]Appropriateness of statistical analysis. Studies got 50% and above of the quality scale were considered low risk. We have only onecase control study and got a score of 65% of the quality scale, which is low risk and can be included in the study.
The following items were used to appraise cross-sectional studies:
[1] Inclusion criteria,[2] Description of study subject and setting,[3] Valid and reliable measurement of exposure,[4] Objective andstandard criteria used, [5] Identi�cation of confounder,[6] Strategies to handle confounder,[7] Outcome measurement, and [8]Appropriate statistical analysis. Studies were considered low risk when it scored 50% and above of the quality assessmentindicators. We have twenty two cross-sectional study and all have got a score of above 50% of the quality scale, which is low riskand can be included in the study.
Outcome measurement
Institutional Delivery Service utilization was considered, when women’s reported that they gave their most recent birth (within the lasttwo years) at health institution.
Data synthesis and analysis
Synthesis was begun by constructing a clear descriptive summary of the included studies. This was done by tabu lating details aboutname of author, year of study or year of publication, study design, and number of participants.
The data entry and statistical analysis for the quantitative data was carried out using stata-11 software. Tables and �gures wereused to summarize the selected studies and results descriptively. We also implemented a meta-analysis of studies that provided a

Page 5/35
comparable classi�cation of the determinants or exposures and the outcome variables.
For the meta-analysis, we considered estimates of adjusted odds ratio with the con�dence interval (CI) as the measure ofassociation. The overall effect (pooled estimates of the magnitude and the factors) of institutional delivery service utilization wasestimated using a random effect model and measured by the prevalence rates and odds ratio with 95% CI. We selected the randomeffect model because of heterogeneity due to difference in the study design and study regions. To determine heterogeneity amongstudies, we calculated the I2 statistic, which describes the percentage of total variation among studies due to heterogeneity ratherthan to chance. Statistical heterogeneity assessed using Forest plot, Cochrane’s Q statistic (P value < 0.1) and I square tests (>50%).Heterogeneity of studies was quanti�ed using the I-squared statistic, in which 25, 50, and 75% represented low, moderate and highheterogeneity respectively [20]. Pooled analysis was conducted using a weighted DerSimonian and Laird random-effects model [21].Publication bias was checked by funnel plot and more objectively through Egger’s regression test [22]. Subgroup analysis was doneby the study setting (region), design, and year of publication. Sensitivity analysis was employed to see the effect of single study onthe overall estimation (Figure 3). Besides, the time-trend analysis was conducted to check whether variations through time areobserved.
ResultsStudy characteristics and study participants
The search strategy retrieved 104 from PubMed, 23 from Cochrane library, 16 from Web of Science, 55 from Google, 69 from GoogleScholar and 05 from other sources. After duplication removed, 97 remained. Finally, 43 studies were screened for full-text review and24 were included to the prevalence and/ or associated factors analysis (Figure 2).Seven (7) Studies were found in Amhara region [23,24] [25-29], Nine(9) in Oromia[30-38], two in Afar [39, 40], one in Bienishangul-Gumuz [41] ,three(3) in Southern Nation Nationalitiesand Peoples region (SNNPR) [42-44],one in Gambiela [45] and one in Tigray&Oromiya [46].
The design of 22 of the studies examined was cross-sectional, one prospective follow up, and one case control. The year of studypublication ranged from 2010 to 2018, �ve (5) studies were published in 2018, eleven (11) studies were published between 2015 and2017, and eight (8) studies were between 2011 and 2014. Table 1 summarizes the characteristics of the 19,969 women’s who gavebirth within the past two years preceding the survey encompassed by the twenty four included studies and among which 6,672women gave birth in health institution. All twenty four studies had an enrollment period exclusively after 2010, when institutionaldelivery service utilization with at least one factor becomes available. All papers stated the proportions of institutional deliveryservice utilization. A large proportion of the participants (69 %) in these studies were not use institutional delivery for their last birth(Table 1).
Quality of studies
The studies included in this systematic review and meta-analysis had no considerable risk (has low risk). Therefore, all the studieswere considered [23-46] (Table 1).
Meta-analysis
Heterogeneity of studies
Heterogeneity test for the proportion of the review indicated I2=0.0%, no variability was observed among the included studies hence�xed effect model was assumed in the analysis.
Prevalence of Institutional delivery service utilization
The prevalence of institutional delivery service utilization of individual studies was range from 12.1% to 80.1% [28, 29].The sevenincluded studies from Amhara region, which was conducted at different period of time shows that the prevalence of institutionaldelivery service utilization was 74.7%,34.0%,62.3%,78.8%,15.7%,12.1%, and 80.1%[23-29].The nine included studies from Oromiyaregion, which was conducted at different period of time shows that the prevalence of institutional delivery service utilization was28.7%,13.9%,34.2%,39.7%,12.3%,47.0%,18.2%,16.4%, and 60.3%[30-38]. Three included studies from SNNPR region, which wasconducted at different period of time shows that the prevalence of institutional delivery service utilization was 14.6%, 31.0% and
Page 6/35
78.3% [42-44]. Two included studies from Afar region, which was conducted at different period of time shows that the prevalence ofinstitutional delivery service utilization was 35.2% and 18.4% [39, 40].Three different studies from Bie.Guz, Gambiela andTigray&Oromiya (one from each) which was conducted at different period of time shows that the prevalence of institutional deliveryservice utilization was 51.1%, 63.2% and 25.0% respectively [41, 45 and 46].
The estimated overall prevalence of institutional delivery service utilization is presented in a forest plot (Error! Reference source notfound.Figure 4). The overall pooled prevalence of institutional delivery service utilization was 31% (95% CI: 30%, 31.2%; I2 = 0.000%).
Publication bias
A funnel plot showed a symmetrical distribution (Figure 5). Egger’s regression test p-value was 0.193, which indicated the absence ofpublication bias.
Subgroup analysis
The subgroup analysis based on the region and year of publication was done. Based on this, the prevalence of institutional deliveryservice utilization found to be 47%, 39% and 24% in Amhara, SNNPR and Oromiya studies respectively, on the other hand theprevalence of institutional delivery service utilization found to be 37% between the year of 2015-2016 and 2017-2018 and 24%between the years of 2011-2014 (Table 2).
Sensitivity analysis
There is no any study out of the con�dence bound mean that all study has almost equal in�uence on the pooled proportion (Figure3).
Time-trend analysis
The time-trend analysis showed that the prevalence of institutional delivery service utilization is increase from 24% (95%CI 23%,25%) in 2011-2014 to 37 %( 95%CI 36%, 38%) in 2017-2018. However, the pooled prevalence from year to year is increasingsigni�cantly (p-value = 0.000) (Figure 6 ).
Associated factors
Based on this review, institutional delivery service utilization in Ethiopian context is associated with the three dynamics factors of Andersen Healthcare Utilization conceptual model i.e. predisposing factors (The socio-cultural characteristics of individuals thatexist prior to their illness.), enabling factors (the logistical aspects of obtaining care), and need (The most immediate cause of healthservice use, from functional and health problems that generate the need for health care services).
Predisposing factors
In a family where husbands had been a decision maker on a place where to give birth is 54 %( AOR=46%; 95% CI 18%, 119%) lesslikely to give birth at health institution [32].
Attitude towards Institutional delivery
Women who had favorable attitude on institutional delivery service utilization were 2.83 times (AOR = 2.80; 95% CI 1.60, 4.91) aslikely to use institutional delivery service as compared to those women having unfavorable attitude [36].
The pooled effects of three studies [28, 36, 39] showed that favorable attitude towards institutional delivery was a signi�cantassociated factors with institutional delivery service utilization. The pooled effect of this three studies revealed that those motherswho had favorable attitude towards institutional delivery service utilization were 2.83 times as likely to use the services.Heterogeneity test indicated moderate variability, I2=48.4% i.e. moderate heterogeneity, hence random effect model was assumed inthe analysis. Sensitivity analy sis was done, and no change was observed in the overall OR (Figure 7).
Maternal Knowledge

Page 7/35
Knowledge regarding danger signs during pregnancy and institutional delivery service increased the probability of utilizing healthinstitution for delivery service. Women who had good knowledge on institutional delivery service utilization were 2 times (AOR = 2.10;95% CI 1.08, 4.09) as likely to use institutional delivery service as compared to those women having poor knowledge [39] .
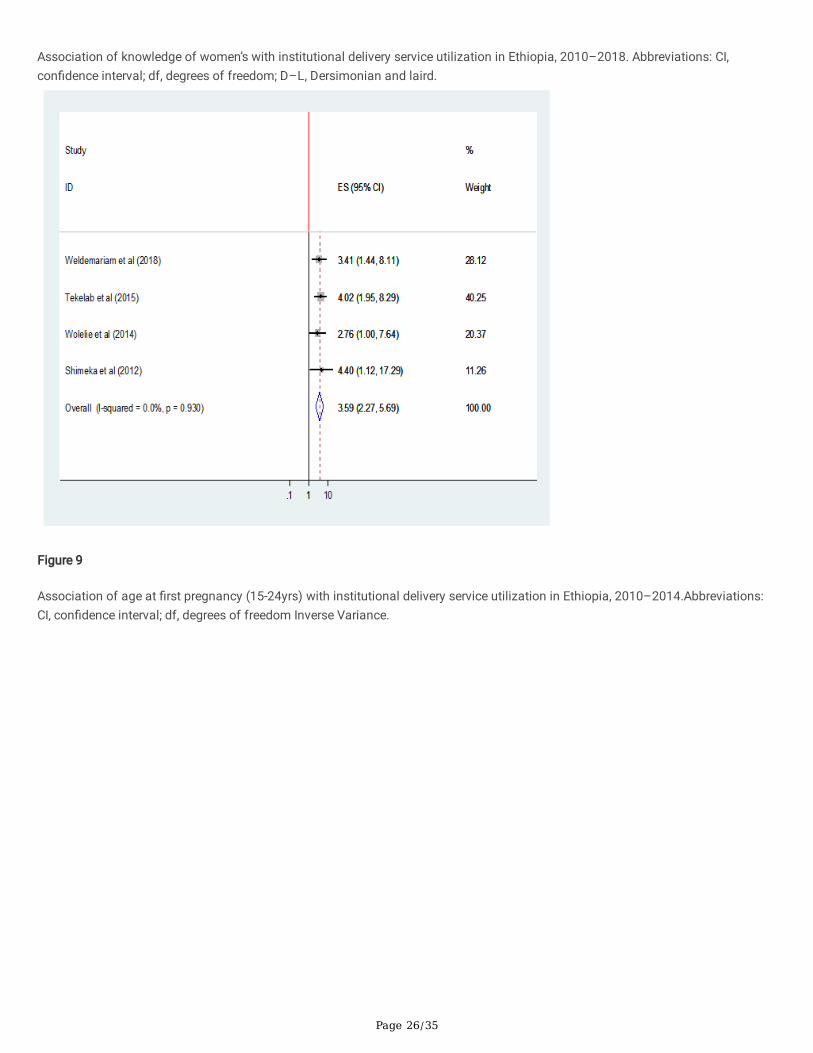
The pooled effect of eleven studies[25, 27-30, 35, 36, 39, 41, 42, 44] showed that women who were knowledgeable were 3 times(AOR=3.04;95%CI 1.76,5.24) as likely to give birth in health institution than those women who were not knowledgeable. Heterogeneitytest indicated high variability, I2=77.3% i.e. high heterogeneity, hence random effect model was assumed in the analysis. Sensitivityanaly sis was done, and no change was observed in the overall OR (Figure 8).
Maternal age at �rst pregnancy
Women whose age 15-24 (AOR=4.02; 95%CI 2.07-8.55) and 25-34 (AOR=2.21; 95% CI 1.32-3.69) at �rst pregnancy were more likely touse institutional delivery service[33].
The pooled effect of four studies[27, 28, 33, 41] showed that women who had their �rst pregnancy between the age of 15-24 yearswere 3.60 times as likely to give birth in health institution than those who became pregnant after 35 years of age (AOR= 3.59; 95% CI2.27 5.69 ). Heterogeneity test indicated I2=0.0%, no variability was observed among the included studies hence �xed effect modelwas assumed in the analysis. Sensitivity analysis was done and illustrated stability of overall OR (Figure 9).where as women whohad their �rst pregnancy between the ages of 25-34 years were not became signi�cantly associated factors (Figure 10).
Maternal Education
This review indicated that signi�cant associa tion between women’s’ educational status and utilization of institutional deliveryservice. Women who can read & write (AOR=1.75; 95% CI 1.21-2.54), Primary level (AOR=2.23;95%CI 1.39,3.59) and secondary &above(AOR=2.40;95%CI 1.05,5.49) more likely to use institutional delivery service [24].
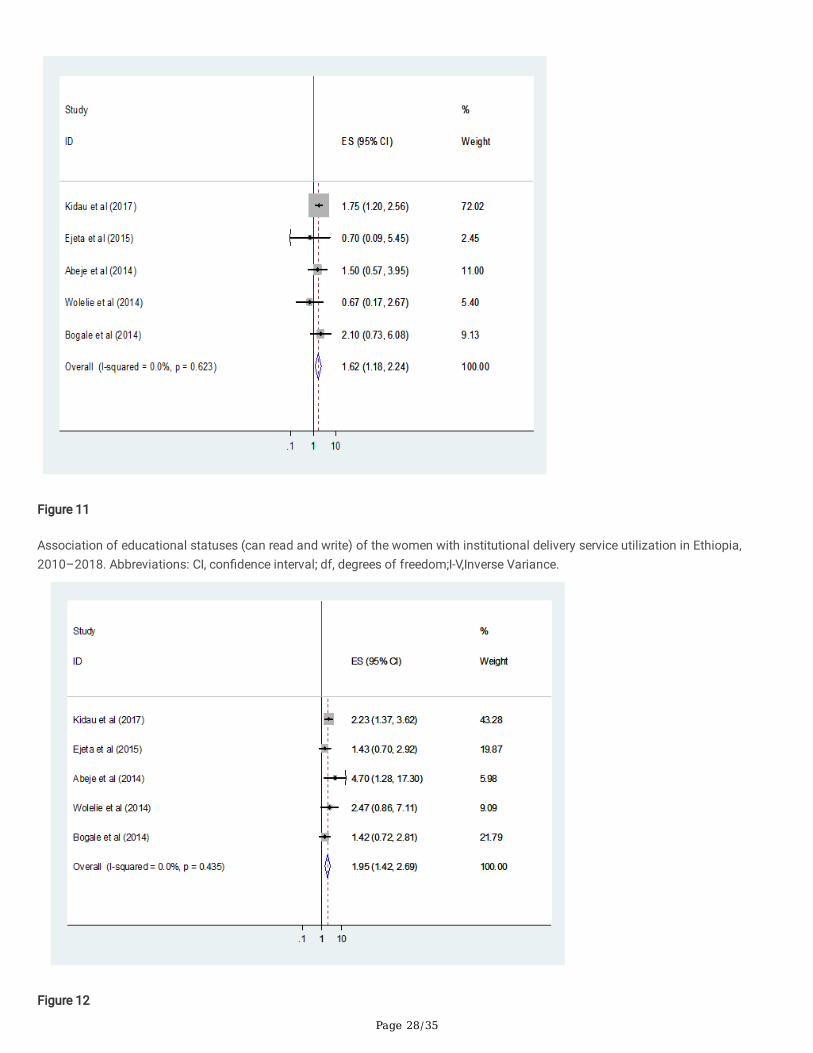
The pooled estimate �ndings of �ve [24, 26, 27, 32, 35] review also indicated signi�cant associa tion between mothers’ educationalstatus and utilization of institutional delivery service. Mothers who can read and write were 1.62 times as likely to give birth at healthinstitution as compare to who can’t read& write(AOR=1.62;95%CI 1.18-2.24). Heterogeneity test indicated I2=0.0%, hence �xed effectmodel was assumed in the analysis. Sensitivity analysis did not bring signi�cant change in the overall ORs (Figure 11).
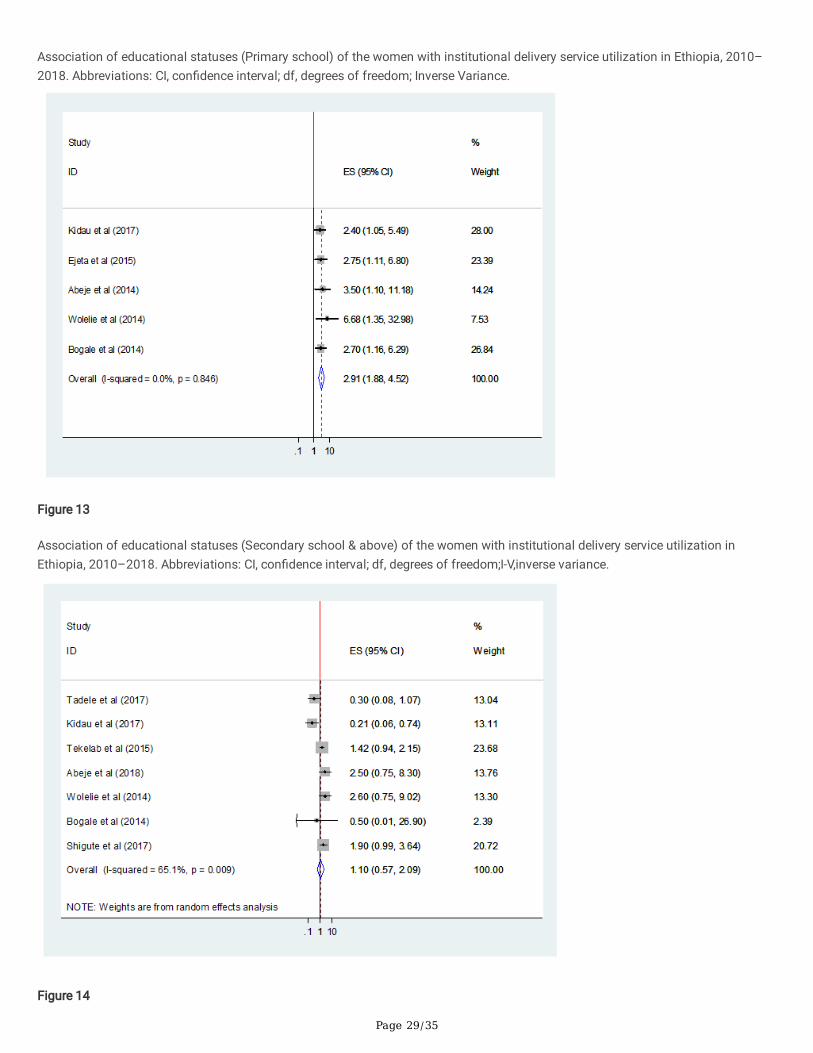
Similarly women’s who attend Primary school were almost two times as likely to give birth at health institution than who can’t readand write (AOR=1.95; 95% CI 1.42-2.69). Heterogeneity test indicated I2=0.0%, hence �xed effect model was assumed in the analysis.Sensitivity analysis did not bring signi�cant change in the overall ORs (Figure 12).
Women’s who attended secondary and above educational level were almost three times as likely to give birth at health institution ascompare to women’s who can’t read and write (AOR=2.92;95% 1.88-4.52. Heterogeneity test indicated I2=0.0%, hence �xed effectmodel was assumed in the analysis. Sensitivity analysis did not bring signi�cant change in the overall ORs (Figure 13).
Maternal occupation
Women’s who is not house wife in occupation (AOR=2.50; 95 % CI 0.75,8.30) were more likely to use institutional delivery service [26].
The pooled estimate �ndings of �ve [24, 26, 27, 33, 35, 37, 42] review showed insigni�cant association of utilization of institutionaldelivery service with mothers’ occupation (AOR=1.10; 95% CI 0.57,2.09). Heterogene ity test indicated I2=65.1%, moderate variabilityhence random effect model was assumed during analysis. Sensitivity analysis was done, and no change was noted on overall OR(Figure 14).
Parity
The combined estimate �ndings of �ve [27, 32, 33, 40, 43] review shows that the number of children the women delivered was notsigni�cantly associated with institutional delivery service utilization(AOR= 1.48; 95% CI 0.75,2.95) and (AOR=1.10;95%CI 0.87,1.39)for women who have one and 2-4children respectively. Heterogeneity test indicated for women who have one child is I2=81.2%, hence

Page 8/35
random effect model was assumed in analysis Sensitivity analysis was done, and no signi�cant change was observed in overall OR(Figure 15), whereas for women who have 2-4 children I2=0.0%, hence �xed effect model was assumed in analysis.
Enabling factors
Availability of Information Source
The chance of delivering in health institution among those women have the access of information source were 1.8 times higher thanthose women who have not the access of information source (AOR = 1.80; 95%CI 1.16, 2.78). Heterogeneity test indicated I2=71.9%,hence random effect model was assumed in the analysis. Sensitivity analysis was done and revealed the stability of overall effectsize (Figure 16).
Place of residence
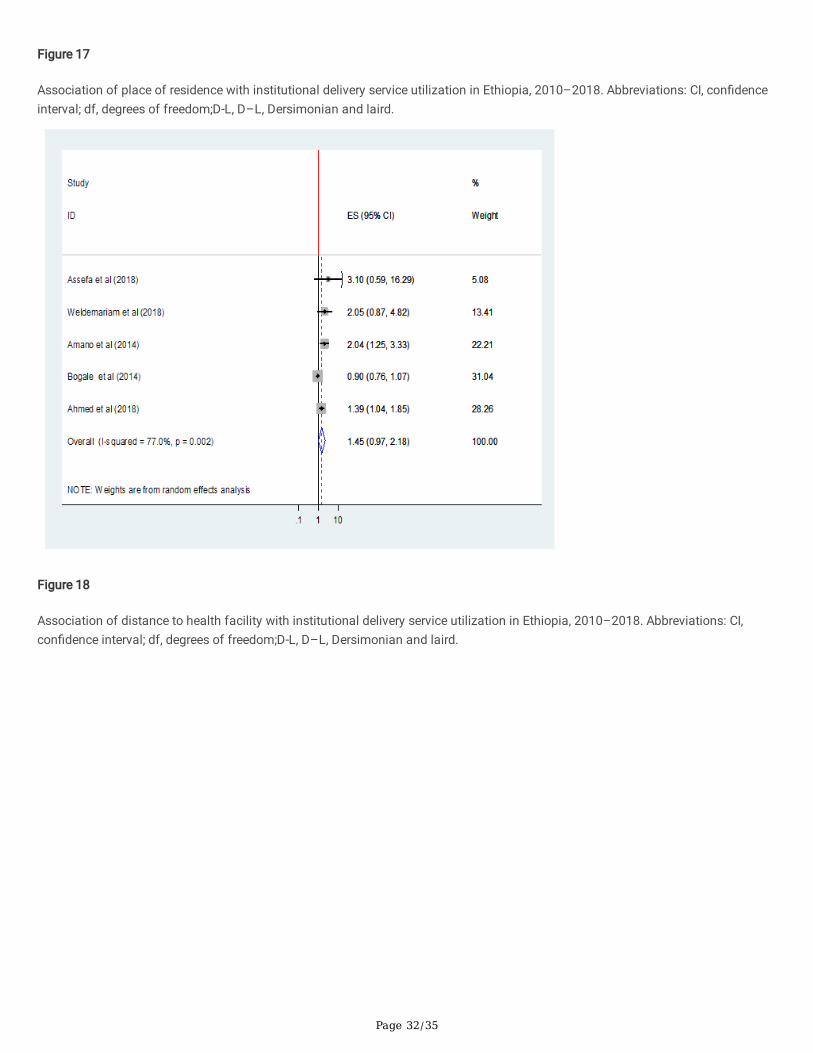
The pooled estimated �ndings of seven [26, 28, 29, 34, 35, 41, 43] review showed that place of residence as de�ned rural and urbanwere the enabling factors that determined utilization of institutional delivery service. Women from urban area were 3.84 times aslikely to deliver in health institution than women from rural area (AOR= 3.84; 95%CI 1.31, 11.25). Heterogeneity test indicatedI2=91.3%, hence random effect model was assumed in the analysis. Sensitivity analysis was done, and no change was noted in theoverall OR (Figure 17).
Distance to health facility
The �ndings of �ve [27, 32, 33, 40, 43] review shows that distance to health facility was not signi�cantly associated with institutionaldelivery service utilization(AOR= 1.45;95% CI 0.97 2.18). Heterogeneity test indicated I2=77%, hence random effect model wasassumed in analysis. Sensitivity analysis was done, and no signi�cant change was observed in overall OR (Figure 18).
Need factors
ANC follow up
The combined �nding of thirteen study[24, 25, 28-30, 32-36, 39, 40, 46] review showed that ANC follow up was signi�cantlyassociated with institutional delivery service utilization. Women who had ANC follow-up 2.6 times as likely to utilize the service thanthose who did not visited ANC (AOR= 2.57; 95%CI 1.46, 4.54). Heterogeneity test indicated I2=93.3%, hence random effect model wasassumed in the analysis. Sensi tivity test was done, and no change was noted on overall OR (Figure 19).
Frequency of ANC follows up
The combined effect of four study [29, 35, 41, 42] shows that attending ANC follow up four or more was signi�cantly associated withinstitutional delivery service utilization. Women who attended ANC four or more times were 4 times as likely to give birth in healthinstitution than those women who attended ANC service below four or less than four times (AOR= 4.04 ;95%CI 1.21,13.46). Hetero -geneity test indicated I2=90.6%, hence random effect model was assumed in the analysis. Sensitivity test demonstrated stability ofthe overall OR (Figure 20).
Place of birth the most recent birth
The pooled effects of four studies [27, 29, 31, 43] showed that women’s who have an experience a birth of the most recent birth inhealth institution were 8.44 times as likely to utilize the service again than those who gave the most recent birth in home(AOR=8.44;95% CI 5.75 12.39).Heterogeneity test indicated I2=0.0%, no heterogeneity, hence �xed effect model was assumed in theanalysis. Sensitivity analysis did not bring signi�cant change in the overall OR (Figure 21).
Presence of complication during birth preceding the most recent birth
Finding of review from four studies [25, 38-40] indicated that presence of complication during birth preceding the most recent birthwas not signi�cantly associated with institutional delivery service utilization (AOR= 1.00; 95%CI 0.39, 2.70). Heterogeneity test

Page 9/35
indicated I2=85.8%, high variability, hence random effect model was assumed in the analysis. Sensitivity analysis was done andillustrated stability of overall OR (Figure 22).
DiscussionIn this review, twenty four studies comprising a total of 19,969 participants were analyzed to estimate the best available evidence forthe prevalence and factors associated with institutional delivery service utilization in Ethiopia. The �ndings of the review haverevealed valuable informa tion which is comparable with all the factors related to the outcome variable across the nation. The factorswere related to the three dynamics factors of Andersen Health care Utilization conceptual model i.e. predisposing factors (Thesocio-cultural characteristics of individuals that exist prior to their illness), enabling factors (the logistical aspects of obtaining care),and need factors (The most immediate cause of health service use, from functional and health problems that generate the need forhealth care services).
This meta-analysis was estimated the national prevalence of institutional delivery service utilization in Ethiopia. Accordingly, thenational pooled prevalence of institutional delivery service utilization was 31% (95% CI: 30%-31.2%). This result was in line with ananalysis study from Four Demographic surveillance sites of South Asia[47].But less than a study from Haiti 2012 DemographicHealth Survey and 2013 service provision assessment survey (39%) [48] and an analysis of Nepal Demographic and Health survey2011(36.9%) [49].This difference is probably due to the fact that the way of awareness creation regarding institutional deliveryservice for the large community ,difference in community engagement and with poor access to health services in Ethiopia.
From the subgroup analysis, the prevalence of institutional delivery service utilization was high in Amhara as compared to otherregions. Those studies included in this meta-analysis were conducted in community based.
Based on the pooled analysis of three or more AOR of studies, maternal age at �rst pregnancy (15-24 years), place of residence(Urban), maternal knowledge (good knowledge), maternal educational status(Can read & write, primary level, secondary & above),Attitude towards Institutional delivery (favorable attitude), availability of information system, ANC follow- up,frequencey of ANC(4+)follow up and place of birth the most recent birth(health institution) were associated with institutional delivery service utilization.
The odds of women’s age 15-24 years were more likely to use institutional delivery service. This �nding is consistent with a primarystudies conducted in Nepal and three district of Tanzania[49, 50]. The possible explanations might be that younger women are morelikely to be literate and more likely to have knowledge on the bene�ts of health care facility delivery than older women. On the otherhand, older women may consider that giving birth at home is not risky as they have previously experienced birth at home.
Women’s knowledge on danger sign of pregnancy and institutional delivery service utilization was found to be one of thedeterminants in this review (AOR=3.04; 95%CI 1.76, 5.24). This �nding was in agreement with primary study �ndings from Kenya [51]and Southern Tanzania that illustrated nearly threefold increase in skilled birth attendance when women has knowledge about risksduring pregnancy (AOR=2.95 ; 95% CI 1.65,5.25) [52]. Knowledge is an important factor that affects attitude, intention and behavior.Women who have su�cient knowledge about delivery danger signs might have perceived service bene�ts of a health institution, likecomplication management by skilled health care workers in time of labor.
Educational status of women’s was found to be one of the determinants in this review i.e. women’s who can read & write, who attendPrimary school, secondary & above were more likely to use institutional delivery service as compare to women’s who can’t read &write. This �nding is consistent with study from countries; an analysis from the Four Demographic surveillance sites of South Asiawomen’s who attend secondary in Bangladesh [47] , from 2012 Haiti demographic Health Survey & 2013 Haiti service provisionassessment survey who attend primary in rural Haiti,who attend secondary and above in rural Haiti [48], who attend secondary &above in Guatemala,Mexco and panama [53], an analysis from Bangladesh Demographic Health Survey 2011 who attend Primaryschool, Secondary & above[54]and an analysis of 2013 Nigeria DHS data set who attend primary and secondary & above [55]and aprimary study in Guinea women’s who can read & write[56]. As education makes mothers to be more concerned for institutionaldelivery service utilization their health and have more autonomy, their ability and freedom to make decisions about their own healthis more favorable, which eventually enhance their health-seeking behavior. Education also improves the ability of educated women toafford the cost of medical health care service.

Page 10/35
Women’s with adequate exposure to the media had more odds of institutional delivery than mothers with inadequate exposure. This�nding was supported by a primary cross sectional study in a remote mountains district of Nepal [57]. Having adequate exposure tothe media might increase the woman’s concern and awareness of her pregnancy related issue and the need for professional helpand having adequate exposure to the media increasing their familiarity with medical personal which expose the women to morehealth education and counseling which are more likely to increase the utiliza tion of delivery service.
Place of women’s residence was signi�cantly associated with the utili zation of institutional delivery service. This �nding wasconsistent with an analysis of 2011 Demographic health survey of Nepal, which showed that urban/rural differ ences had signi�cantassociations with institutional delivery service utilization (AOR=2.42; 95%CI 1.83 3.19) [49] and with an analysis of 2011Bangladeshi Demographic Health Survey(AOR=1.84)[54]. This might be explained in terms of the characteristics of the urbanresidents, namely more proportion of educated mothers, more proportion of knowledge on institutional delivery service, availability ofhealth care services nearby, and better access to information than rural mothers.
The result of this review revealed that attendance of four or more ante natal visits increases the likelihood of health facility delivery.This �nding is consistent with a primary studies conducted in Kenya [58], Tanzania [59],an analysis of 2013 Nigeria DHS data set [55],an analysis of Nepal Demographic and Health survey 2011[49] and 2011 Bangladeshi Demographic Health survey (AOR=3.639)[54]. Making four or more ANC visits were the recommended ANC visit by WHO and which might re�ect the woman’s concern of herpregnancy related issue and the need for professional help and visiting ANC frequently increasing their familiarity with medicalpersonal which expose the women to more health education and counseling which are more likely to increase the utiliza tion ofdelivery service.
Policy implications
This review suggests that increasing women’s participation in different health and health care activities will have a long-term positiveeffect on institutional delivery service utilization.
This review also identi�es the need to do on the attitude towards institutional delivery, residence and age speci�c interventionactivity, provide education and counseling to pregnant woman and their partner about the bene�ts of delivering in a health facility,the potential risks and complications associated with pregnancy in general, and home delivery in particular.
Institutional delivery service utilization and home delivery preventative activities in general, should be higher on the healthcareagenda. We also recommend further research into community level of readiness on the promotion of institutional delivery serviceutilization/prevention of home delivery and women’s perceptions of institutional delivery services.
Strength and limitation
The strength of this review includes; the study participant of all the studies included in this review were women who had given birthin the two years preceding the survey and they may not have been subject to recall bias, able to conduct a methodologically rigorousmeta-analysis, report an adjusted odds ratio, sensitivity analysis and sub-group analysis, and the employment of a quality indictor toselect only sound publications has ensured the quality of the research �ndings. Few of the limitations were; ninety percent of theincluded studies were cross-sectional in nature, which limits our ability to assess cause-effect relationship, we are unable to show thepooled estimates for all variables associated with institutional delivery because the included studies classify the variables indifferent ways.
ConclusionsThis systematic review and Meta-analysis revealed that the prevalence of Institutional delivery service utilization in Ethiopia remainslow. It also showed that attitude towards institutional delivery, maternal age at �rst pregnancy, residence setting, educational statusof mothers, availability of information source, ANC follow-up, frequency of ANC follow up, knowledge of institutional delivery &danger signs during pregnancy and place of birth the most recent birth as factors positively and signi�cantly associated withinstitutional delivery service utilization. However, maternal occupation, pareity, distance to health facility and presence ofcomplication during birth preceding the most recent birth was not associated with institutional delivery service utilization.

Page 11/35
This review may help policy-makers and program o�cers to design appropriate interventions on institutional delivery serviceutilization.
AbbreviationsANC: Antenatal car
AOR: Adjusted Odd Ratio
CI: Con�dence interval
DF: Degree of freedom
D-L: Dersimonian and laird
EDHS: Ethiopia Demographic and Health Survey
IDUS: Institutional delivery service utilization
I-V: inverse variance
JBI: Joanna Briggs Institute
OR: Odds Ratio
PRISMA: Preferred Reporting Items for Systematic Review and Meta-Analysis statement
SDG: Sustainable Development Goals
SNNPR: Southern Nation Nationality and Peoples Region
DeclarationsEthics approval and consent to participate
Not applicable because no primary data were collected.
Consent for publication
Not applicable.
Availability of data and materials
All data generated or analyzed during this study are included in this published article.
Competing interests
The authors declared that they have no competing interest.
Funding
There is no received grant from any fund agency.
Authors’ contributions
AN conceived and designed the study. TA and MY established the search strategy. All the authors read the manuscript before theyhave given the �nal approval for publication.
Acknowledgements
Page 12/35
We are very grateful to the University of Gondar, Ethiopia for providing a full PhD scholarship for the corresponding author and fullaccess of the internet while we are working this document.
References1. Organization, W.H., Trends in maternal mortality: 1990-2015: estimates from WHO, UNICEF, UNFPA, World Bank Group and the
United Nations Population Division: executive summary. 2015, World Health Organization.
2. Say, L., et al., Global causes of maternal death: a WHO systematic analysis. The Lancet Global Health, 2014. 2(6): p. e323-e333.
3. Hodorogea, S. and V. Friptu, The Moldovan experience of maternal death reviews. BJOG: An International Journal of Obstetrics &Gynaecology, 2014. 121: p. 81-85.
4. Paily, V., et al., Con�dential review of maternal deaths in Kerala: a country case study. BJOG: An International Journal ofObstetrics & Gynaecology, 2014. 121: p. 61-66.
5. CSA AA, E., Ethiopia Mini Demographic and Health Survey. 2014.
�. Lomazzi, M., B. Borisch, and U. Laaser, The Millennium Development Goals: experiences, achievements and what's next. Globalhealth action, 2014. 7(1): p. 23695.
7. Kinney, M.V., et al., Sub-Saharan Africa's mothers, newborns, and children: where and why do they die? PLoS medicine, 2010.7(6): p. e1000294.
�. Baral, Y., et al., Determinants of skilled birth attendants for delivery in Nepal. Kathmandu University Medical Journal, 2010. 8(3):p. 325-332.
9. Mendoza-Chuctaya, G., et al., Características y Prevalencia de Partos Domiciliarios en un distrito Rural de la Sierra del Perú,2015-2016. Revista chilena de obstetricia y ginecología, 2018. 83(4): p. 377-385.
10. Unicef, The state of the world's children 2012: children in an urban world. 2012, eSocialSciences.
11. Demographic, E., Health survey 2011 central statistical agency Addis Ababa. Ethiopia ICF International Calverton, Maryland,USA, 2012.
12. Baral, Y., et al., Determinants of skilled birth attendants for delivery in Nepal. Kathmandu Univ Med J, 2010. 8(31): p. 325-32.
13. Chimankar, D.A. and H. Sahoo, Factors in�uencing the utilization of maternal health care services in Uttarakhand. Studies onEthno-Medicine, 2011. 5(3): p. 209-216.
14. Eskezaiw Abebe, A.S., Getnet Gedefaw, Zelalem T. Haile and Gillian Ice;, Association between antenatal care followup andinstitutional delivery service utilization: analysis of 2016 Ethiopia demographic and health survey. BMC Public Health, 2019. 19:p. 1472.
15. UNDo., E., The Millennium Development Goals Report 2008. United Nations Publications, 2008.
1�. Survey, E.D.a.H., Central Statistical Agency. Addis Ababa, Ethiopia, 2016: p. 29.
17. Moher, D., et al., Preferred reporting items for systematic review and meta-analysis protocols (PRISMA-P) 2015 statement.Systematic reviews, 2015. 4(1): p. 1.
1�. Mu oola S, M.Z., Tufanaru C, Aromataris E, Sears K, Sfetcu R, Currie M, Qureshi R, Mattis P, Lisy K, MP-F., Chapter 7: Systematicreviews of etiology and risk . In: Aromataris E, Munn Z (Editors). .
19. Munn, Z., et al., Methodological guidance for systematic reviews of observational epidemiological studies reporting prevalenceand cumulative incidence data. International journal of evidence-based healthcare, 2015. 13(3): p. 147-153.
20. Higgins, J.P. and S.G. Thompson, Quantifying heterogeneity in a meta‐analysis. Statistics in medicine, 2002. 21(11): p. 1539-1558.
21. DerSimonian, R. and N. Laird, Meta-analysis in clinical trials. Controlled clinical trials, 1986. 7(3): p. 177-188.
22. Sterne, J.A. and M. Egger, Funnel plots for detecting bias in meta-analysis: guidelines on choice of axis. Journal of clinicalepidemiology, 2001. 54(10): p. 1046-1055.
23. Gedefaw, G., et al., Institutional Delivery Service Utilization and its Factors In�uencing Among Mothers Who Gave Birth in WoldiaTown, Ethiopia. A Community-Based Cross-Sectional Study. Gynecol Obstet (Sunnyvale), 2018. 8(484): p. 2161-0932.1000484.
24. Kidanu, S., G. Degu, and T.Y. Tiruye, Factors in�uencing institutional delivery service utilization in Dembecha district, NorthwestEthiopia: A community based cross sectional study. Reproductive health, 2017. 14(1): p. 98.

Page 13/35
25. Bayu, H., et al., Pregnant women’s preference and factors associated with institutional delivery service utilization in DebraMarkos Town, North West Ethiopia: a community based follow up study. BMC pregnancy and childbirth, 2015. 15(1): p. 15.
2�. Abeje, G., M. Azage, and T. Setegn, Factors associated with Institutional delivery service utilization among mothers in Bahir DarCity administration, Amhara region: a community based cross sectional study. Reproductive Health, 2014. 11(1): p. 22.
27. Wolelie, A., M. Aychiluhm, and W. Awoke, Institutional delivery service utilization and associated factors in Banja District, Awiezone, Amhara regional sate, Ethiopia. Open Journal of Epidemiology, 2014. 4(01): p. 30.
2�. Teferra, A.S., F.M. Alemu, and S.M. Woldeyohannes, Institutional delivery service utilization and associated factors amongmothers who gave birth in the last 12 months in Sekela District, North West of Ethiopia: A community-based cross sectionalstudy. BMC pregnancy and childbirth, 2012. 12(1): p. 74.
29. Asmamaw Limenih, N.D.a.A.B., Assessing the Magnitude of Institutional Delivery Service Utilization and Associated Factorsamong Mothers in Debre Berhan, Ethiopia. Journal of Pregnancy and Child Health, 2016. 3(3).
30. Ki�e, D., et al., Maternal health care service seeking behaviors and associated factors among women in rural Haramaya District,Eastern Ethiopia: a triangulated community-based cross-sectional study. Reproductive health, 2017. 14(1): p. 6.
31. Wako, W.G. and D.H. Kassa, Institutional delivery service utilization and associated factors among women of reproductive age inthe mobile pastoral community of the Liban District in Guji Zone, Oromia, Southern Ethiopia: a cross sectional study. BMCpregnancy and childbirth, 2017. 17(1): p. 144.
32. Ejeta E, N.T., Determinants of Skilled Institutional Delivery Service Utilization among Women Who Gave Birth in the Last 12Months in Bako District, Oromia, Ethiopia, (Case–control Study Design). J Gynecol Obstet. , 2015 3(2): p. 36-42.
33. Tekelab T, Y.B., Melka AS. , Antenatal care and women’s decision making power as determinants of institutional delivery in ruralarea of Western Ethiopia. . BMC research notes. , 2015. 8(1): p. 769.
34. Amano A, G.A., Birhanu Z. , Institutional delivery service utilization in Munisa Woreda, South East Ethiopia: a community basedcross-sectional study. BMC pregnancy and childbirth., 2012 Dec. 12(1): p. 105.
35. Odo D, S.D., Institutional delivery service utilization and associated factors among child bearing age women in Goba Woreda,Ethiopia. J Gynecol Obstet., 2014. 2(4): p. 63-70.
3�. Mulumebet Abera, A.G.m., Tefera Belachew, PREDICTORS OF SAFE DELIVERY SERVICE UTILIZATION IN ARSI ZONE, SOUTH-EAST ETHIOPIA. Ethiop J Health Sci. , August, 2011. 102(21).
37. Taye Shigute, S.T.a.L.T., Institutional Delivery Service Utilization and Associated Factors among Women of Child Bearing Age atBoset Woreda, Oromia Regional State, Central Ethiopia. Journal of Women's Health Care, 2017. 6(5).
3�. Fikre AA, D.M., Prevalence of institutional delivery and associated factors in Dodota Woreda (district), Oromia regional state,Ethiopia. . Reproductive health. , 2012 Dec. 9(1): p. 33.
39. Assefa L, A.M., Debie A. , Magnitude of institutional delivery service utilization and associated factors among women in pastoralcommunity of Awash Fentale district Afar Regional State, Ethiopia. . BMC research notes. , 2018. 11(1): p. 162.
40. Mohammed Ahmed, M.D., Araya Abrha Medhanyie, Alemayehu and Y.B. Worku4, Utilization of Institutional Delivery Service in aPredominantly Pastoralist Community of Northeast Ethiopia. Ethiopian journal of health sciences., 2018. 28(4).
41. Weldemariam S, K.A., Welday M., Utilization of institutional delivery service and associated factors among mothers in NorthWest Ethiopian. . BMC research notes. , 2018. 11(1): p. 194.
42. Lamaro, N.T.a.T., Utilization of institutional delivery service and associated factors in Bench Maji zone, Southwest Ethiopia:community based, cross sectional study. BMC Health service research, 2017. 17(101).
43. Demissie, F.H.a.M., Magnitude and factors associated with institutional delivery service utilization among childbearing mothersin Cheha district, Gurage zone, SNNPR, Ethiopia: a community based cross sectional study. BMC Pregnancy and Childbirth 2015.15(299).
44. Hailemariam, G.D.a.T., Utilization of Institutional Delivery Services and Associated Factors among Mothers in Semi-pastoralist,Southern Ethiopia. Women’s Health Care, 2015. 4(7).
45. Serawit Mekonnen Jinka, L.T.W.a.G.A., Predictors of institutional delivery service utilization, among women of reproductive agegroup in Dima District, Agnua zone, Gambella, Ethiopia. Medical Practice and Review, 2018. 9(2): p. 8-18.
4�. Seifu Hagos, D.S., Meselech Assegid, Alemayehu Mekonnen, Mesganaw Fantahun Afework and a.S. Ahmed3, Utilization ofinstitutional delivery service at Wukro and Butajera districts in the Northern and South Central Ethiopia. BMC Pregnancy and

Page 14/35
Childbirth 2014. 14(178).
47. Das, S., et al., Institutional delivery in public and private sectors in South Asia: a comparative analysis of prospective data fromfour demographic surveillance sites. BMC pregnancy and childbirth, 2016. 16(1): p. 273.
4�. Wang, W., M. Winner, and C.R. Burgert-Brucker, Limited Service Availability, Readiness, and Use of Facility-Based Delivery Care inHaiti: A Study Linking Health Facility Data and Population Data. Global Health: Science and Practice, 2017. 5(2): p. 244-260.
49. Karkee, R., A.H. Lee, and V. Khanal, Need factors for utilisation of institutional delivery services in Nepal: an analysis from NepalDemographic and Health Survey, 2011. BMJ open, 2014. 4(3): p. e004372.
50. Exavery, A., et al., Access to institutional delivery care and reasons for home delivery in three districts of Tanzania. Internationaljournal for equity in health, 2014. 13(1): p. 48.
51. Wanjira, C., et al., Delivery practices and associated factors among mothers seeking child welfare services in selected healthfacilities in Nyandarua South District, Kenya. BMC public health, 2011. 11(1): p. 360.
52. Mpembeni, R.N., et al., Use pattern of maternal health services and determinants of skilled care during delivery in SouthernTanzania: implications for achievement of MDG-5 targets. BMC pregnancy and childbirth, 2007. 7(1): p. 29.
53. Colombara, D.V., et al., Institutional delivery and satisfaction among indigenous and poor women in Guatemala, Mexico, andPanama. PloS one, 2016. 11(4): p. e0154388.
54. Yaya, S., G. Bishwajit, and M. Ekholuenetale, Factors associated with the utilization of institutional delivery services inBangladesh. PLoS One, 2017. 12(2): p. e0171573.
55. Dahiru, T. and O.M. Oche, Determinants of antenatal care, institutional delivery and postnatal care services utilization in Nigeria.Pan African medical journal, 2015. 21(1).
5�. Brazier, E., et al., Rethinking how to promote maternity care-seeking: factors associated with institutional delivery in Guinea.Health care for women international, 2014. 35(7-9): p. 878-895.
57. Joshi, D., et al., Universal institutional delivery among mothers in a remote mountain district of Nepal: what are the challenges?Public health action, 2016. 6(4): p. 267-272.
5�. Gitonga, E. and F. Muiruri, Determinants of health facility delivery among women in Tharaka Nithi county, Kenya. The PanAfrican Medical Journal, 2016. 25(Suppl 2).
59. Bishanga, D.R., et al., Factors associated with institutional delivery: Findings from a cross-sectional study in Mara and Kageraregions in Tanzania. PloS one, 2018. 13(12): p. e0209672.
TablesTable 1: Characteristics and quality status of the studies

Page 15/35
S.n Reference Location objective Studydesign
Participants/Subjects
Samplesize
Key finding;Prevalenceofinstitutionaldelivery(%)
Qualitystatusby usingJoannaBriggsInstitutechecklist
1 Luelseged Assefa,Mussie Alemayehu andAyal Debie, Magnitudeof institutional deliveryservice utilization andassociated factorsamong women inpastoral community ofAwashFentale district AfarRegional State,Ethiopia.BMC ResNotes (2018) 11:162
Afar To assessinstitutionaldeliveryserviceutilizationandassociatedfactorsamongwomen inpastoralcommunity ofAwashFentaledistrict,Ethiopia.
CS women who gave birth inthe last one years
423 35.2 Low risk
2 Getnet Gedefaw,Eskeziaw Abebe, RebkaNigatu, BethelihemMesfin, and AmanuelAddisu,InstitutionalDelivery ServiceUtilization and itsFactors InfluencingAmong Mothers WhoGave Birth in WoldiaTown, Ethiopia. ACommunity-BasedCross-SectionalStudy:.Gynecol Obstet(Sunnyvale) 2018,8:9
Amhara To assess theprevalenceand factorsassociatedwithinstitutionaldeliveryserviceutilization ofchildbearingage groupwomen whogave birth inWoldia town.
CS women who gave birth inthe last one years
360 74.7 Low risk
3 Solomon Weldemariam,Amare Kiros andMengistu Welday,Utilization ofinstitutional deliveryservice and associatedfactors among mothersin North WestEthiopian.BMC ResNotes (2018) 11:194
Bie.Guz To assessinstitutionaldelivery andits associatedfactors inBenishangul-Gumez region,North-West ofEthiopia
CS women who gave birth inthe last one years
427 51.1 Low risk
4 Niguse Tadele andTafesse Lamaro,Utilization ofinstitutional deliveryservice and associatedfactors in Bench Majizone, SouthwestEthiopia: communitybased, cross sectionalstudy. BMC HealthServices Research(2017) 17:101
SouthernNationNationality andPeoples Region
To assessutilization ofinstitutionaldelivery andrelatedfactors inBench Majizone,SouthwestEthiopia.
CS women who gave birth inthe last two years
765 78.3 Low risk

Page 16/35
5 Dereje Kifle, TelakeAzale, YalemzewodAssefa Gelaw andYayehirad AlemuMelsew, Maternalhealth care serviceseeking behaviors andassociated factorsamong women in ruralHaramaya District,EasternEthiopia: a triangulatedcommunity-based cross-sectional study.Reproductive Health(2017) 14:6
Oromiya To assess thematernalhealth careseekingbehavior andassociatedfactors ofreproductiveage women inrural villagesof Haramayadistrict, EastEthiopia.
CS women who gave birth inthe last two years
561 28.7 Low risk
6 Sewnet Kidanu, GenetDegu and Tenaw YimerTiruye, Factors nfluencing institutionaldelivery serviceutilization in Dembechadistrict, NorthwestEthiopia: A communitybased cross sectionalstudy. ReproductiveHealth (2017) 14:98
Amhara To assessfactorsinfluencinginstitutionaldeliveryserviceutilization inDembechadistrict,NorthwestEthiopia.
CS women who gave birth inthe last two years
674 34.0 Low risk
7 Wako Golicha Wako andDejene Hailu Kassa,Institutional deliveryservice utilization andassociated factorsamong women ofreproductive age in themobile pastoralcommunity of the LibanDistrict in Guji Zone,Oromia, SouthernEthiopia: a crosssectional study. BMCPregnancy andChildbirth (2017)17:144
Oromiya To assessutilization ofinstitutionaldelivery andassociatedfactors amongwomen ofreproductiveage in themobilepastoralcommunity ofthe LibanDistrict in Gujizone, Oromia,Ethiopia.
CS women who gave birth inthe last two years
791 13.9 Low risk
8 Eshetu Ejeta, TadeleNigusse, Determinantsof Skilled InstitutionalDeliveryServiceUtilizationamong Women WhoGave Birth in the Last12Months in BakoDistrict, Oromia,Ethiopia, 2012/13(Case-Control Study Design).Journal of Gynecologyand Obstetrics 2015;3(2): 36-42
Oromiya To assessfactorsaffectingutilization ofskilledinstitutionaldeliveryservicesamong womenwho gavebirth in thelast 12monthspreceding thestudy in Bakoworeda, WestShoa Zone,
CC women who gave birth inthe last one years
380 34.2 Low risk
Page 17/35
Ethiopia,2012/13.
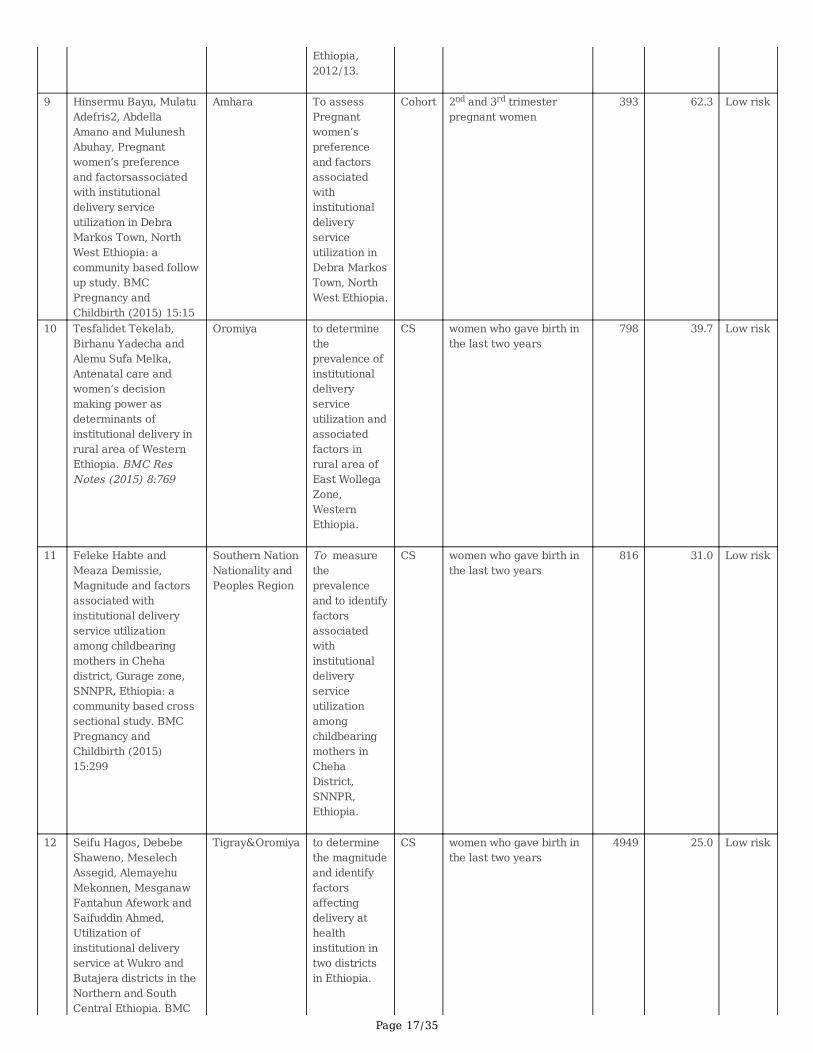
9 Hinsermu Bayu, MulatuAdefris2, AbdellaAmano and MuluneshAbuhay, Pregnantwomen’s preferenceand factorsassociatedwith institutionaldelivery serviceutilization in DebraMarkos Town, NorthWest Ethiopia: acommunity based followup study. BMCPregnancy andChildbirth (2015) 15:15
Amhara To assessPregnantwomen’spreferenceand factorsassociatedwithinstitutionaldeliveryserviceutilization inDebra MarkosTown, NorthWest Ethiopia.
Cohort 2nd and 3rd trimesterpregnant women
393 62.3 Low risk
10 Tesfalidet Tekelab,Birhanu Yadecha andAlemu Sufa Melka,Antenatal care andwomen’s decisionmaking power asdeterminants ofinstitutional delivery inrural area of WesternEthiopia. BMC ResNotes (2015) 8:769
Oromiya to determinetheprevalence ofinstitutionaldeliveryserviceutilization andassociatedfactors inrural area ofEast WollegaZone,WesternEthiopia.
CS women who gave birth inthe last two years
798 39.7 Low risk
11 Feleke Habte andMeaza Demissie,Magnitude and factorsassociated withinstitutional deliveryservice utilizationamong childbearingmothers in Chehadistrict, Gurage zone,SNNPR, Ethiopia: acommunity based crosssectional study. BMCPregnancy andChildbirth (2015)15:299
Southern NationNationality andPeoples Region
To measuretheprevalenceand to identifyfactorsassociatedwithinstitutionaldeliveryserviceutilizationamongchildbearingmothers inChehaDistrict,SNNPR,Ethiopia.
CS women who gave birth inthe last two years
816 31.0 Low risk
12 Seifu Hagos, DebebeShaweno, MeselechAssegid, AlemayehuMekonnen, MesganawFantahun Afework andSaifuddin Ahmed,Utilization ofinstitutional deliveryservice at Wukro andButajera districts in theNorthern and SouthCentral Ethiopia. BMC
Tigray&Oromiya to determinethe magnitudeand identifyfactorsaffectingdelivery athealthinstitution intwo districtsin Ethiopia.
CS women who gave birth inthe last two years
4949 25.0 Low risk

Page 18/35
Pregnancy andChildbirth 2014, 14:178
13 Gedefaw Abeje,Muluken Azage andTesfaye Setegn, Factorsassociated withInstitutional deliveryservice utilizationamong mothers in BahirDarCity administration,Amhara region: acommunity based crosssectional study.Reproductive Health2014, 11:22
Amhara To assessfactorsassociatedwithinstitutionaldeliveryservice useamongmothers inBahir Dar cityadministration
CS women who gave birth inthe last one years
481 78.8 Low risk
14 Alemaw Wolelie, MekonnenAychiluhm,Worku Awoke, Institutional delivery serviceutilization and associatedfactors in Banja District,Awie Zone, AmharaRegional Sate, Ethiopia. Open Journal ofEpidemiology, 2014, 4, 30-35
Amhara To assessinstitutionaldelivery serviceutiliza- tion andassociatedfactors in BanjaDistrict, Amhararegion, Ethiopia,2013
CS women who gave birth inthe last two years
394 15.7 Low risk
15 Abdella Amano, AbebawGebeyehu and ZelalemBirhanu, Institutionaldelivery serviceutilization in MunisaWoreda, South EastEthiopia: a communitybased cross-sectionalstudy. BMC Pregnancyand Childbirth 2012,12:105
Oromiya To determinethe level ofinstitutionaldeliveryserviceutilization andassociatedfactors.
CS women who gave birth inthe last one years
855 12.3 Low risk
16 Daniel Bogale Odo1,Desalegn Markos Shifti,Institutional deliveryservice utilization andassociated factorsamong child bearingage women in GobaWoreda, Ethiopia.Journal of Gynecologyand Obstetrics 2014;2(4): 63-70
Oromiya Assessinglevel ofinstitutionaldeliveryserviceutilization andassociatedfactors amongmothers whogave birthduring the lasttwelve monthsprior to thisstudy.
CS women who gave birth inthe last one years
562 47.0 Low risk
17 Alemayehu ShimekaTeferra, FekaduMazengia Alemu andSolomon MeseretWoldeyohannesInstitutional deliveryservice utilization andassociated factorsamong mothers whogave birth in the last 12months in SekelaDistrict, North West ofEthiopia: A community -
Amhara To assessfactorsaffectinginstitutionaldeliveryserviceutilizationamongmothers whogave birth inthe last 12months inSekela
CS women who gave birth inthe last one years
371 12.1 Low risk

Page 19/35
based cross sectionalstudy. BMC Pregnancyand Childbirth 2012,12:74
District,AmharaRegion,Ethiopia.
18 Addis Alem Fikre andMeazaDemissie,Prevalence ofinstitutional deliveryand associatedfactors in DodotaWoreda (district),Oromia regional state,Ethiopia. ReproductiveHealth 2012, 9:33
Oromiya To determinetheprevalence ofinstitutionaldelivery andunderstandthe factorsassociatedwithinstitutionaldelivery inDodota,Woreda,OromiaRegion.
CS women who gave birth inthe last two years
506 18.2 Low risk
19 Mulumebet Abera,Abebe G/mariam,TeferaBelachew,PREDICTORSOF SAFE DELIVERYSERVICE UTILIZATIONIN ARSI ZONE, SOUTH-EAST ETHIOPIA. EthiopJ Health Sci. Vol. 10221, Special IssueAugust, 2011
Oromiya To assess thepredictors ofsafe deliveryserviceutilization inArsi Zone,SoutheastEthiopia.
CS women who gave birth inthe last one years
1074 16.4 Low risk
20 Mohammed Ahmed,Meaza Demissie, ArayaAbrha Medhanyie,Alemayehu Worku,YemaneBerhane,Utilization ofInstitutional DeliveryService in aPredominantlyPastoralist Communityof Northeast EthiopiaEthiop J Health Sci. Vol.28, No. 4 July 2018
Afar To determinetheprevalence ofutilization ofinstitutionaldelivery andassociatedfactors.
CS women who gave birth inthe last two years
1842 18.4 Low risk
21 Gebeyehu Dejene andTesfahun Hailemariam,Utilization ofInstitutional DeliveryServices and AssociatedFactors among Mothersin Semi-pastoralist,Southern Ethiopia JWomen’s Health Care2015, 4:7
Southern NationNationality andPeoples Region
To determine theprevalence ofInstitutionalDeliveryServicesutilization andAssociatedFactors amongMothers inSemi-pastoralist,SouthernEthiopia
CS women who gave birth inthe last two years
756 14.6 Low risk
22 Asmamaw Limenih,Negussie Deyesa andAdugnawBerhane,Assessing theMagnitude ofInstitutional DeliveryService Utilization and
Amhara ssessing themagnitude ofinstitutionaldeliveryserviceutilization and
CS women who gave birth inthe last two years
404 80.1 Low risk

Page 20/35
Associated Factorsamong Mothers inDebre Berhan, Ethiopia J Preg Child Health2016, 3:3
associatedfactors.
23 Taye Shigute, SolomonTejineh and LegesseTadesse, InstitutionalDelivery ServiceUtilization andAssociated Factorsamong Women of ChildBearing Age at BosetWoreda, OromiaRegional State, CentralEthiopia J Women'sHealth Care 2017, 6:5
Oromiya To assessinstitutionaldeliverymagnitudeandassociatedfactorsamongmothersdelivered inthe past 12months inBosetWoreda,Ethiopia.
CS women who gave birth inthe last one years
589 60.3 Low risk
24 Serawit MekonnenJinka, Legesse TadesseWodajo and Gebi Agero,Predictors ofinstitutional deliveryserviceutilization,amongwomen of reproductiveage group inDimaDistrict, Agnuazone, Gambella,Ethiopia. MedicalPractice and ReviewVol. 9(2), pp. 8-18
Gambiela Assessinginstitutionaldelivery andpredictors inGambella,Ethiopia
CS women who gave birth inthe last one years
798 63.2 Low risk
Key:-CS=Cross-sectional; CC=Case Control
Table 2: The pooled proportion of IDSU, 95% CI and heterogeneity estimate with a p-value for the subgroupanalysis

Page 21/35
Variables Characteristics No ofstudies
Pooledproportion
(95% CI) Weight I2 (P-value)
By region(Fixed)
Afar 2 0.21 0.19 0.22
12.09 0.00 %(0.000)
Amhara 7 0.47 0.46 0.49
15.81 0.00 %(0.000)
Bie.Guz 1 0.51 0.46 0.56
1.46 0.00 %(0.000)
Southern Nation Nationality andPeoples Region
3 0.39 0.37 0.40
12.33 0.00 %(0.000)
Oromiya 9 0.24 0.23 0.25
32.77 0.00 %(0.000)
Tigray&Oromiya 1 0.25 0.24 0.26
22.61 0.00 %(0.000)
Gambiela 1 0.63 0.60 0.66
2.94 0.00 %(0.000)
Over all 24 0.31 0.30 0.31
100.00 0.00 %(0.000)
By year ofPublication(Fixed)
2017-2018 10 0.37 0.36 0.38
34.66 0.00 %(0.000)
2015-2016 6 0.37 0.35 0.38
16.39 0.00 %(0.000)
2011-2014 8 0.24 0.23 0.25
48.95 0.00 %(0.000)
Over all 24 0.31 0.30 0.31
100.00 0.00 %(0.000)
Figures
Figure 1
Conceptual framework of factors associated with the utilization of institutional delivery services in Ethiopia

Page 22/35
Figure 2
Study selection process

Page 23/35
Figure 3
The sensitivity analysis showed the pooled proportion when the studies omitted step by step
Figure 4
Forest plot of the Proportion of institutional delivery service utilization with corresponding 95% CIs

Page 24/35
Figure 5
Funnel plot for publication bias.
Figure 6
Time-trend analysis of the pooled prevalence of Institutional delivery service utilization in Ethiopia from 2011 to 2018

Page 25/35
Figure 7
The pooled effects of maternal attitude on Institutional delivery service utilization.
Figure 8
Page 26/35
Association of knowledge of women’s with institutional delivery service utilization in Ethiopia, 2010–2018. Abbreviations: CI,con�dence interval; df, degrees of freedom; D–L, Dersimonian and laird.
Figure 9
Association of age at �rst pregnancy (15-24yrs) with institutional delivery service utilization in Ethiopia, 2010–2014.Abbreviations:CI, con�dence interval; df, degrees of freedom Inverse Variance.

Page 27/35
Figure 10
Association of age at �rst pregnancy (25-34yrs) with institutional delivery service utilization in Ethiopia, 2010–2018. Abbreviations:CI, con�dence interval; df, degrees of freedom; Inverse Variance.
Page 28/35
Figure 11
Association of educational statuses (can read and write) of the women with institutional delivery service utilization in Ethiopia,2010–2018. Abbreviations: CI, con�dence interval; df, degrees of freedom;I-V,Inverse Variance.
Figure 12
Page 29/35
Association of educational statuses (Primary school) of the women with institutional delivery service utilization in Ethiopia, 2010–2018. Abbreviations: CI, con�dence interval; df, degrees of freedom; Inverse Variance.
Figure 13
Association of educational statuses (Secondary school & above) of the women with institutional delivery service utilization inEthiopia, 2010–2018. Abbreviations: CI, con�dence interval; df, degrees of freedom;I-V,inverse variance.
Figure 14

Page 30/35
Association of Occupation of the women with institutional delivery service utilization in Ethiopia, 2010–2018. Abbreviations: CI,con�dence interval; df, degrees of freedom; D–L, Dersimonian and laird.
Figure 15
Association of parity (Parity=1) with institutional delivery service utilization in Ethiopia, 2010–2018. Abbreviations: CI, con�denceinterval; df, degrees of freedom;D-L, D–L, Dersimonian and laird.

Page 31/35
Figure 16
Association of availability of information source with institutional delivery service utilization in Ethiopia, 2010–2018. Abbreviations:CI, con�dence interval; df, degrees of freedom;D-L, D–L, Dersimonian and laird.
Page 32/35
Figure 17
Association of place of residence with institutional delivery service utilization in Ethiopia, 2010–2018. Abbreviations: CI, con�denceinterval; df, degrees of freedom;D-L, D–L, Dersimonian and laird.
Figure 18
Association of distance to health facility with institutional delivery service utilization in Ethiopia, 2010–2018. Abbreviations: CI,con�dence interval; df, degrees of freedom;D-L, D–L, Dersimonian and laird.

Page 33/35
Figure 19
Association of ANC follow up with institutional delivery service utilization in Ethiopia, 2010–2018. Abbreviations: CI, con�denceinterval; df, degrees of freedom;D-L, D–L, Dersimonian and laird.

Page 34/35
Figure 20
Association of Frequency of ANC follow up with institutional delivery service utilization in Ethiopia, 2010–2018. Abbreviations: CI,con�dence interval; df, degrees of freedom;D-L, D–L, Dersimonian and laird.
Figure 21
Association of Place of birth the most recent birth of the women with institutional delivery service utilization in Ethiopia, 2010–2018.Abbreviations: CI, con�dence interval; df, degrees of freedom;I-V,inverse variance.

Page 35/35
Figure 22
Association of Presence of complication during birth preceding the most recent birth with institutional delivery service utilization inEthiopia, 2010–2018. Abbreviations: CI, con�dence interval; df, degrees of freedom;D-L, D–L, Dersimonian and laird.
Supplementary Files
This is a list of supplementary �les associated with this preprint. Click to download.
Qualityappraisal.docx