instilling a continuous improvement mindset in ap and p2p · slide 2 learning objectives instilling...
TRANSCRIPT

Slide 1
May 20 – 22, 2018 | Orlando, FL
Instilling a Continuous Improvement Mindset in AP and P2P
Penny S. Weller, PhD, CMA, ADGBS

Slide 2
Learning ObjectivesInstilling a Continuous Improvement Mindset in AP and P2P
May 20 – 22, 2018 | Orlando, FL
Whether you are considering—or already have—a continuous improvement program, this session is for you. You will learn a variety of quick tips to engage your staff and encourage them to submit creative ideas, appreciate the power of measurement; and implement commonly used and easy-to-understand continuous improvement tools.
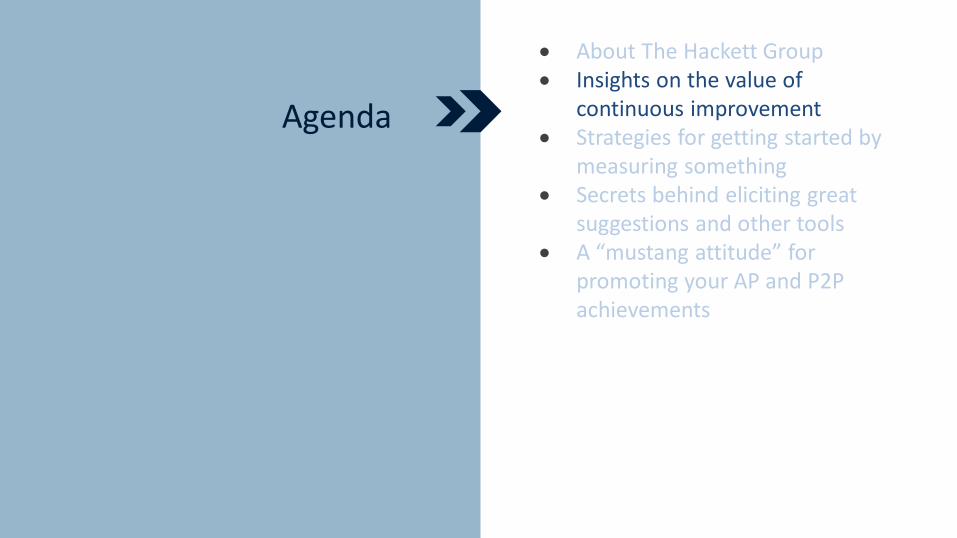
This session will provide you: • Insights on the value of continuous improvement• Strategies for getting started by measuring something• Secrets behind eliciting great suggestions and other tools• A “mustang attitude” for promoting your AP and P2P achievements

Agenda
• About The Hackett Group• Insights on the value of
continuous improvement• Strategies for getting started by
measuring something• Secrets behind eliciting great
suggestions and other tools• A “mustang attitude” for
promoting your AP and P2P achievements

Agenda
• About The Hackett Group• Insights on the value of
continuous improvement• Strategies for getting started by
measuring something• Secrets behind eliciting great
suggestions and other tools• A “mustang attitude” for
promoting your AP and P2P achievements

Slide 5
• Hackett has Empirically Defined World-Class• Hackett’s intellectual property explains how to close the gaps
97% 89%of Dow Jones Industrials
of Fortune 100
90%of Dow Jones Global Titans
Performance metrics30,000
Benchmarking studies15,000
Best practices2,000
Process maps700+
Implementation andconfiguration guides
330
Best practices scorecards30+
Hackett Value GridTM
The Hackett Group
Effectiveness• Better decision
support• Better align to
business needs• Optimized
working capital• Quality focus
Efficiency• Lower total costs• Faster cycle times• Higher productivity
Slide 6
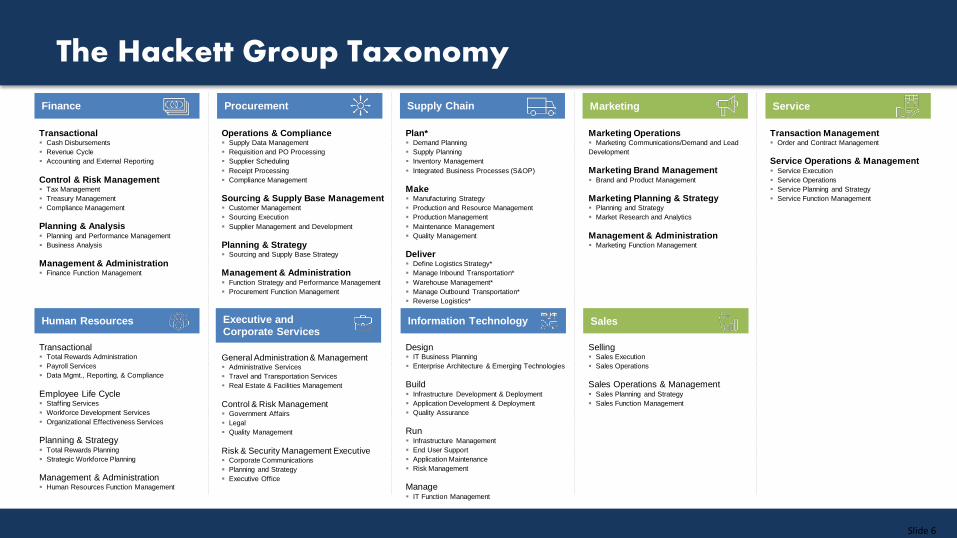
Operations & Compliance Supply Data Management Requisition and PO Processing Supplier Scheduling Receipt Processing Compliance Management
Sourcing & Supply Base Management Customer Management Sourcing Execution Supplier Management and Development
Planning & Strategy Sourcing and Supply Base Strategy
Management & Administration Function Strategy and Performance Management Procurement Function Management
Plan* Demand Planning Supply Planning Inventory Management Integrated Business Processes (S&OP)
Make Manufacturing Strategy Production and Resource Management Production Management Maintenance Management Quality Management
Deliver Define Logistics Strategy* Manage Inbound Transportation* Warehouse Management* Manage Outbound Transportation* Reverse Logistics*
Marketing Operations Marketing Communications/Demand and Lead Development
Marketing Brand Management Brand and Product Management
Marketing Planning & Strategy Planning and Strategy Market Research and Analytics
Management & Administration Marketing Function Management
Transaction Management Order and Contract Management
Service Operations & Management Service Execution Service Operations Service Planning and Strategy Service Function Management
Transactional Total Rewards Administration Payroll Services Data Mgmt., Reporting, & Compliance
Employee Life Cycle Staffing Services Workforce Development Services Organizational Effectiveness Services
Planning & Strategy Total Rewards Planning Strategic Workforce Planning
Management & Administration Human Resources Function Management
Human Resources Executive and Corporate Services
Information Technology Sales
General Administration & Management Administrative Services Travel and Transportation Services Real Estate & Facilities Management
Control & Risk Management Government Affairs Legal Quality Management
Risk & Security Management Executive Corporate Communications Planning and Strategy Executive Office
Design IT Business Planning Enterprise Architecture & Emerging Technologies
Build Infrastructure Development & Deployment Application Development & Deployment Quality Assurance
Run Infrastructure Management End User Support Application Maintenance Risk Management
Manage IT Function Management
Selling Sales Execution Sales Operations
Sales Operations & Management Sales Planning and Strategy Sales Function Management
Transactional Cash Disbursements Revenue Cycle Accounting and External Reporting
Control & Risk Management Tax Management Treasury Management Compliance Management
Planning & Analysis Planning and Performance Management Business Analysis
Management & Administration Finance Function Management
Finance Procurement Supply Chain Marketing Service
The Hackett Group Taxonomy

Our advisors focus on helping to realize world class .. a sample of recent inquiries from our membership where Advisors leverage assets and infuse deep experiences to expedite your progress
Hackett Intellectual Capital
Best Practices
Research
Webcasts
In-Person Events
Value Accelerators
Metrics
Peer-to-Leader Interaction
Implementable Constructs
Dedicated Advisor
Client Needs & Initiatives
High Impact Client ROI
Membership-based advice to
Executives
to solve the issues they face
in transforming their function
and improving performance
by leveraging our unmatched
intellectual capital
and our extensive experience
in successfully driving change
Hackett Advisory Services
Agenda
• About The Hackett Group• Insights on the value of
continuous improvement• Strategies for getting started by
measuring something• Secrets behind eliciting great
suggestions and other tools• A “mustang attitude” for
promoting your AP and P2P achievements

Continuous improvement is something for executives
Continuous improvement is for everyone!
Reality:Myth:
Continuous Improvement – Myth #1

Continuous improvement takes statistics and in-depth training to be effective
Continuous improvement is something intuitive to many of us – and –something that we can be trained on to be effective
Reality:Myth:
Continuous Improvement – Myth #2

Continuous Improvement | 11© 2018 The Hackett Group, Inc. All rights reserved. Reproduction of this document or any portion thereof without prior written consent is prohibited.
Continuous Improvement: What’s possible
19%Cost Savings
7%
16%Working Capital
6%
16%Productivity
7%
For companies who dedicate resources to continuous improvement in 12 months:
World Class
Peer Group
Source: 2016 Quality Study; The Hackett Group, Inc.

Continuous Improvement | 12© 2018 The Hackett Group, Inc. All rights reserved. Reproduction of this document or any portion thereof without prior written consent is prohibited.
Added benefits within 12 months
Source: 2016 Quality Study; The Hackett Group, Inc.
Regulatory compliance
8-13%
Customer satisfaction
9-18%
Quality 7-20%

Continuous Improvement | 13© 2018 The Hackett Group, Inc. All rights reserved. Reproduction of this document or any portion thereof without prior written consent is prohibited.
It does take time…average age of top performers is almost 5 years
2.6
4.9
Peer TopPerformer
Source: 2016 Quality Study; The Hackett Group, Inc.
Average AGE of Continuous Improvement program (years)

CultureProjects
Continuous Improvement | 15© 2018 The Hackett Group, Inc. All rights reserved. Reproduction of this document or any portion thereof without prior written consent is prohibited.
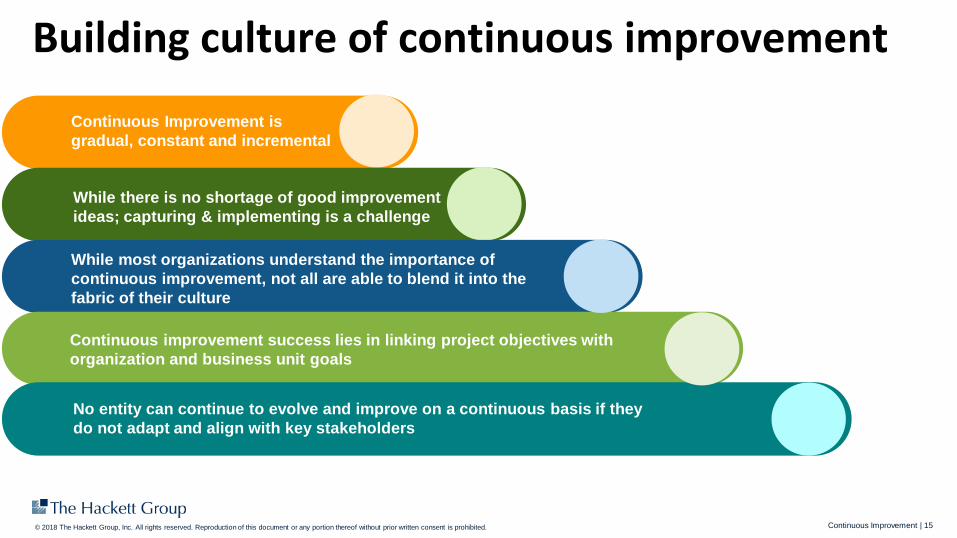
Building culture of continuous improvement
Continuous Improvement is gradual, constant and incremental
While there is no shortage of good improvement ideas; capturing & implementing is a challenge
While most organizations understand the importance of continuous improvement, not all are able to blend it into the fabric of their culture
No entity can continue to evolve and improve on a continuous basis if they do not adapt and align with key stakeholders
Continuous improvement success lies in linking project objectives with organization and business unit goals
Continuous Improvement | 16© 2018 The Hackett Group, Inc. All rights reserved. Reproduction of this document or any portion thereof without prior written consent is prohibited.
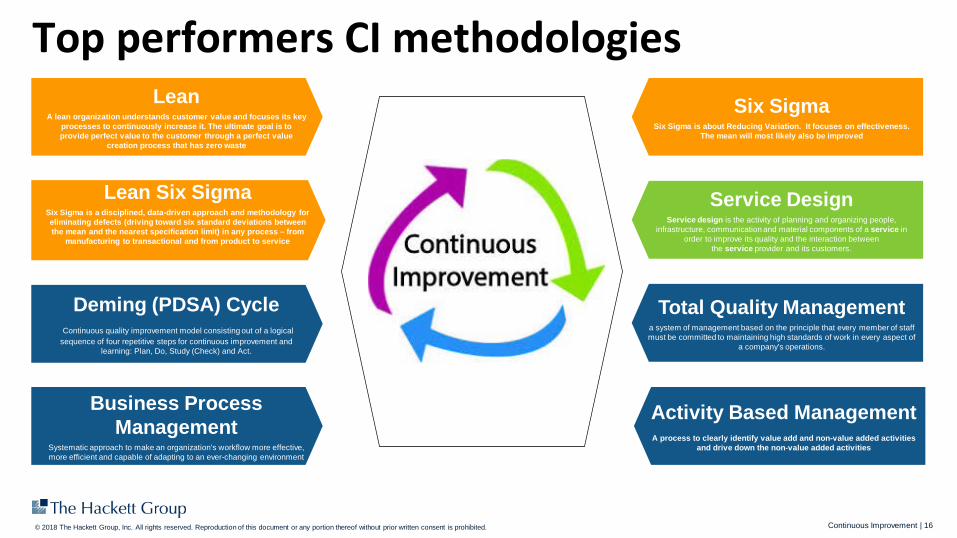
Top performers CI methodologiesLean
A lean organization understands customer value and focuses its key processes to continuously increase it. The ultimate goal is to provide perfect value to the customer through a perfect value
creation process that has zero waste
Lean Six SigmaSix Sigma is a disciplined, data-driven approach and methodology for eliminating defects (driving toward six standard deviations between the mean and the nearest specification limit) in any process – from
manufacturing to transactional and from product to service
Deming (PDSA) CycleContinuous quality improvement model consisting out of a logical
sequence of four repetitive steps for continuous improvement and learning: Plan, Do, Study (Check) and Act.
Six SigmaSix Sigma is about Reducing Variation. It focuses on effectiveness.
The mean will most likely also be improved
Service DesignService design is the activity of planning and organizing people,
infrastructure, communication and material components of a service in order to improve its quality and the interaction between
the service provider and its customers.
Total Quality Managementa system of management based on the principle that every member of staff must be committed to maintaining high standards of work in every aspect of
a company's operations.
Activity Based ManagementA process to clearly identify value add and non-value added activities
and drive down the non-value added activities
Business Process Management
Systematic approach to make an organization's workflow more effective, more efficient and capable of adapting to an ever-changing environment
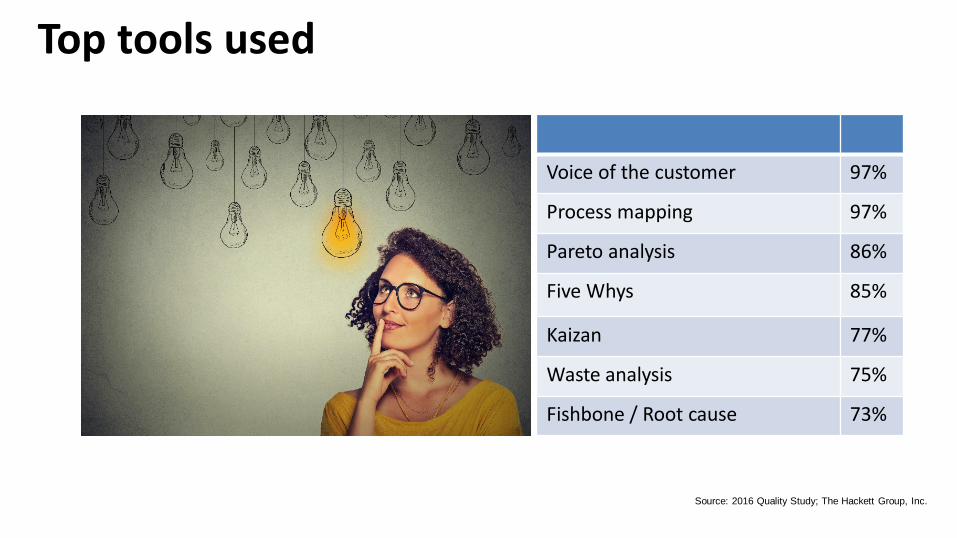
Top tools used
Voice of the customer 97%
Process mapping 97%
Pareto analysis 86%
Five Whys 85%
Kaizan 77%
Waste analysis 75%
Fishbone / Root cause 73%
Source: 2016 Quality Study; The Hackett Group, Inc.

Agenda
• About The Hackett Group• Insights on the value of
continuous improvement• Strategies for getting started by
measuring something• Secrets behind eliciting great
suggestions and other tools• A “mustang attitude” for
promoting your AP and P2P achievements

Foundation of Continuous Improvement

What’s stopping you from being effective?

Slide 21
$5 million savings opportunity in transaction processing!
Key Financial Processes Total Cost Cost per Billion Quartile 1st Quartile
Cost/Billion$ Savings
Opportunity
Transaction Processing $12,955 $ 4,093 3rd $2,431 $ 5,262
Control & Risk Mgt. 5,523 1,745 3rd 959 2,488
Decision Support 3,793 1,198 3rd 607 1,871
Finance Management 1,772 560 3rd 408 481
Systems 7,660 2,420 2nd 1,760 2,090
Overhead 6,561 2,072 2nd 1,275 2,523
Total Finance $38,264 $12,088 3rd $7,440 $14,715
Benchmark - Measurement reduces emotion

Agenda
• About The Hackett Group• Insights on the value of
continuous improvement• Strategies for getting started by
measuring something• Secrets behind eliciting great
suggestions and other tools• A “mustang attitude” for
promoting your AP and P2P achievements

Let’s Chat About the top tools used
Voice of the customer 97%
Process mapping 97%
Pareto analysis 86%
Five Whys 85%
Kaizan 77%
Waste analysis 75%
Fishbone / Root cause 73%
Source: 2016 Quality Study; The Hackett Group, Inc.

Voice of the customer #1

Employee and customer satisfaction surveys
Customer experience through journey mapping
Suggestions
Voice of the customer

Slide 26
• Objectives of survey• Define repeatable questions• Develop communication plan• Conduct the survey• Analyze the results• Communicate back to participants• Act on results• Net Promoter Score – Would you
recommend…
• Pointer: Ask, Communicate, Actions

Slide 27
• Cast a wide net – go for volume at least at first
• Ask stakeholders -- employees, users, payers
• Track and monitor suggestions• Consider % implemented as % of
total• Use multiple channels -- portal,
check stub, customer satisfaction/pulse surveys -- places close to your customers
• Pointer: If you submit an idea—you don’t have to do it

Final Close
Preliminary Close
Prepare Special Ledger
Adjusting Entries
Run Assessment Process
Entry into Hyperion
Run Consolidation jobs
Reverse Assessment Process
Run Final Assessment Process
Process mapping #2
Financial Close - Process

Pareto Analysis #3
How Often Does It Happen?

Five Whys #4
Ask, Ask, Ask, Ask, Ask

Kaizan #5
Focus On a Problem

Seven Deadly Wastes (Two Dime)
WasteAnalysis #6
Waiting Waiting for parts and paperwork Long set-up and lead times
Overproduction Producing more than customer will pay for Planning full utilization of machines and labor
Extra Processing
Damage Rework Dissatisfied downstream customers
Inventory (Excessive)
High stocks of materials, parts and WIP Clutter
Transportation Unnecessary, extra handling “Moving inventory”
Motion (Unnecessary)
Incorrect layouts of office or flow Off-line resources
Unnecessary processing steps Longer lead times

Fishbone #7
Try This For Effective Meetings

Agenda
• About The Hackett Group• Insights on the value of
continuous improvement• Strategies for getting started by
measuring something• Secrets behind eliciting great
suggestions• A “mustang attitude” for
promoting your AP and P2P achievements

Having a Mustang Attitude…We don’t know how to market ourselves

How and what to
measure?
Promote your effortsOffer new data / metricsAdjust metrics when needed

Slide 37


The Land of Month End…

PUSH

The customeris waiting...

Mom says, “if no one’s in charge….you are!”
Payment terms
$326,000savings

Questions and Comments
© 2017 The Hackett Group, Inc. All rights reserved. Reproduction of this document or any portion thereof without prior written consent is prohibited.

Penny Weller, PhD, CMA, ADGBS Senior Director
Global Business Services Advisory & Certified GBS Program 269 345-7240 [email protected]
Atlanta
Chicago
Frankfurt
Hyderabad
London
Miami
Montevideo
New York
Paris
Philadelphia
San Francisco
Sydney Vancouver

Statement of Confidentiality and Usage Restrictions
This document contains trade secrets and information that is sensitive, proprietary, and confidential to The Hackett Group the disclosure of which would provide a competitive advantage to others. As a result, the information contained herein, including, information relating to The Hackett Group’s data, equipment, apparatus, programs, software, security keys, specifications, drawings, business information, pricing, tools, taxonomy, questionnaires, deliverables, including without limitation any benchmark reports, and the data and calculations contained therein,
may not be duplicated or otherwise distributed without The Hackett Group Inc.’s express written approval.
www.thehackettgroup.com
Reproduction of this document or any portion thereof without prior written consent is prohibited.