inspire | seminar: chinese tourists in hong kong
TRANSCRIPT

h1: Title Text
Hong Kong London Shanghai Singapore Yangon
h1: Client SectorChinese Tourists in Hong Kong: How much they spend, How satisfied they are, Where they shop, and What they buy.
Chinese Tourists in Hong Kong
Contact: Hendrik Kühl [email protected]
Dec 2015

© 2015 Sedgwick Richardson
The Challenge 2
Times of uncertainty: Hong Kong retail & tourism worries
”Hong Kong retail sales fell for a seventh straight month in September, as a drop in Chinese tourists and weak consumer sentiment amid a volatile stock market hurt retailers.
Retail sales dropped 6.4 percent from a year earlier, the biggest percentage decline since January this year, to HK$35.2 billion ($4.54 billion). That followed a revised 5.3 percent fall in August. In volume terms, September sales slipped 3.1 percent.
“The subdued performance of retail sales reflected the weakening of inbound tourism and, to some extent, the spillover of heightened stock market volatility during the summer on consumer sentiment," the government said in a statement.“
Source: Reuters (2015)
3
© 2015 Sedgwick Richardson
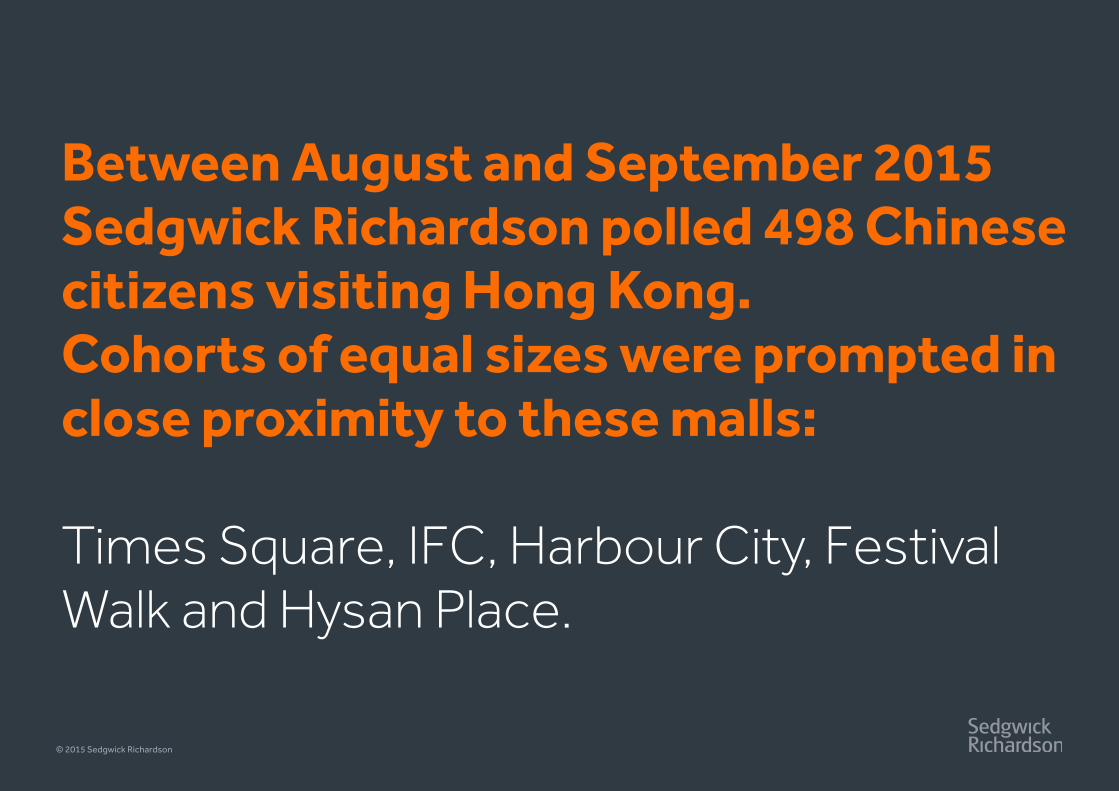
Between August and September 2015 Sedgwick Richardson polled 498 Chinese citizens visiting Hong Kong. Cohorts of equal sizes were prompted in close proximity to these malls: Times Square, IFC, Harbour City, Festival Walk and Hysan Place.

4
Contents
© 2015 Sedgwick Richardson
1. Research Demographics
2. Total Wallet
3. Shopper Satisfaction
4. Shopper Interests
5. Chinese Millennials
6. Recommendations

17%
13%
9%
5% 3%
53%
Guangdong Province
Shenzhen
Beijing
Fujian Province
Shanghai
Other
57%
35%
8%
Up to one week
One day
Long-term
© 2015 Sedgwick Richardson
Research Demographics 5
57%
35%
8%
Up to one week
One day
Long-term
Origin Duration
Who did we ask?
17%
13%
9%
5% 3%
53%
Guangdong Province
Shenzhen
Beijing
Fujian Province
Shanghai
Other
17%
13%
9%
5% 3%
53%
Guangdong Province
Shenzhen
Beijing
Fujian Province
Shanghai
Other
All respondents included in the survey were Chinese nationals. Genders were roughly evenly split (56% female) and Hong Kong first-time visitors accounted for 53% of the sample.
6
© 2015 Sedgwick Richardson
Total WalletHow much money do Chinese visitors plan to spend during their stay in Hong Kong?
© 2015 Sedgwick Richardson
Total Wallet
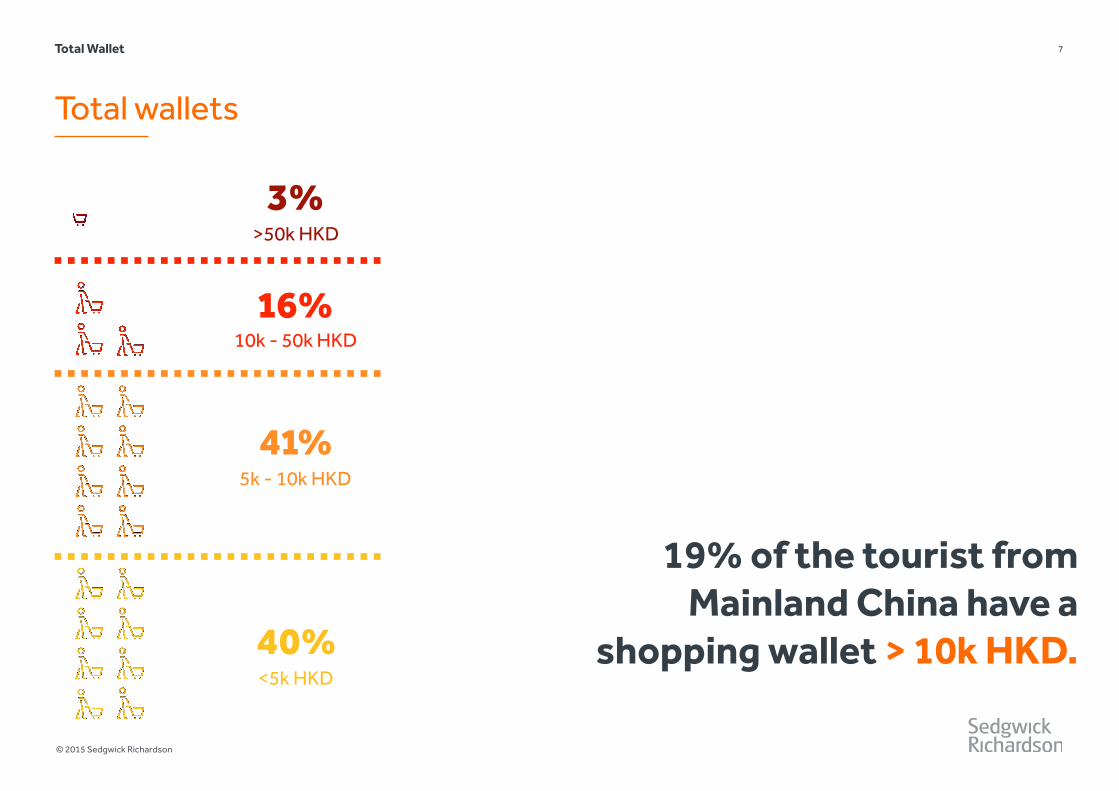
Total wallets
7
40%<5k HKD
3%>50k HKD
16%10k - 50k HKD
41%5k - 10k HKD
19% of the tourist from Mainland China have a
shopping wallet > 10k HKD.

© 2015 Sedgwick Richardson
8
Do wallets differ by age?
Total Wallet
55%
29% 26%
48%
33%
46% 54%
33%
10% 23% 17% 14%
3% 2% 4% 5%
Below 25 25 - 35 years
35-45 years
Above 45
Below 5k HKD 5 - 10k HKD 10 - 50k HKD Above 50k HKD
© 2015 Sedgwick Richardson
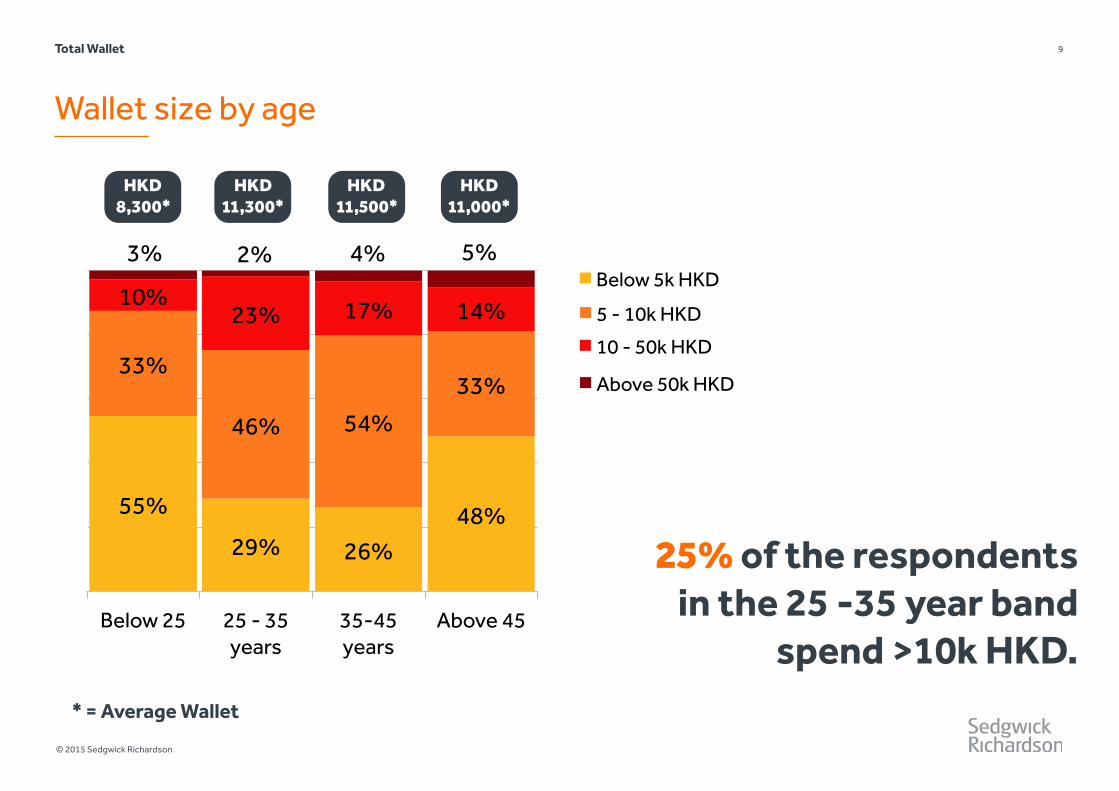
Wallet size by age
9
HKD 8,300*
HKD 11,300*
HKD 11,500*
HKD 11,000*
Total Wallet
* = Average Wallet
25% of the respondents in the 25 -35 year band
spend >10k HKD.
55%
29% 26%
48%
33%
46% 54%
33%
10% 23% 17% 14%
3% 2% 4% 5%
Below 25 25 - 35 years
35-45 years
Above 45
Below 5k HKD 5 - 10k HKD 10 - 50k HKD Above 50k HKD
55%
29% 26%
48%
33%
46% 54%
33%
10% 23% 17% 14%
3% 2% 4% 5%
Below 25 25 - 35 years
35-45 years
Above 45
Below 5k HKD 5 - 10k HKD 10 - 50k HKD Above 50k HKD
55%
29% 26%
48%
33%
46% 54%
33%
10% 23% 17% 14%
3% 2% 4% 5%
Below 25 25 - 35 years
35-45 years
Above 45
Below 5k HKD 5 - 10k HKD 10 - 50k HKD Above 50k HKD
55%
29% 26%
48%
33%
46% 54%
33%
10% 23% 17% 14%
3% 2% 4% 5%
Below 25 25 - 35 years
35-45 years
Above 45
Below 5k HKD 5 - 10k HKD 10 - 50k HKD Above 50k HKD
10
© 2015 Sedgwick Richardson
Shopper SatisfactionHow satisfied are Chinese shoppers with the overall shopping experience?

11
© 2015 Sedgwick Richardson
Shopper Satisfaction
The Net Promoter Score (NPS)
Number of ‘Promoters’ —————————
Sample Size( )-
Number of ‘Detractors’ —————————
Sample Size( )= NPS
How likely is it that you will recommend mall x to a friend? ( x = the mall they were polled at)
‘Very likely’ ‘Very unlikely’
12345678910
Promoters Passives Detractors

12
© 2015 Sedgwick Richardson
Shopper Satisfaction
Limitations of the NPS
One factor that needs to be considered is that Asian research participants tend to stay away from ‘extremes’, which will skew the NPS score negatively (compare Lee, 2015: goo.gl/v2QkRx). For this reason it will be difficult for the malls assessed to achieve strong, positive NPS’.
What is more interesting is how the different malls score in relation to each other.

© 2015 Sedgwick Richardson
Harbour City and Times Square with strongest score
13Shopper Satisfaction
-69
-66
-40
-39
-30
-100 -50 0 50 100
IFC
Hysan Place
Festival Walk
Times Square
Harbour City
The fact that all malls score a negative NPS may indicate that low
recommendation rates are not a mall specific problem, but that the
overall experience of coming to Hong Kong is not as positive.
© 2015 Sedgwick Richardson
14
Wallet share capturedQ: “How much money do you plan to spend during your stay in Hong Kong and how much of that at this specific mall?”
Shopper Satisfaction

0%
20%
40%
60%
80%
100%
Festival Walk
Harbour City
Times Square
IFC Hysan Place
Share of Total Planned Spend Captured
© 2015 Sedgwick Richardson
Festival Walk captures 81% of visitors’ total budget
15
49%55%62%76%81%
Share captured Share not captured
Share of total wallet captured
Shopper Satisfaction

© 2015 Sedgwick Richardson
16
Shopper Satisfaction vs Wallet Share Captured Is there a link between shopper satisfaction (= NPS) and the wallet share captured by a mall?
Shopper Satisfaction

17
© 2015 Sedgwick Richardson
Shopper satisfaction is crucial to maximising wallet share
This research indicates that there is an 82% correlation between shoppers’ satisfaction (NPS) and the wallet share captured by a mall.
Times Square
Harbour City
Festival Walk
IFC
Hysan Place
Shopper Satisfaction
NPS
Wallet Share Captured
-80 -70 -60 -50 -40 -30 -20
90%
80%
70%
60%
50%
40%
18
© 2015 Sedgwick Richardson
Shopper Satisfaction
Driving shopper satisfaction is key to their wallet
The implication for Hong Kong mall operators is clear: Assessing NPS on a regular basis provides important insights into how much further organic sales growth can be achieved by maximising the wallet share captured.

19
© 2015 Sedgwick Richardson
Shopper Interests What do Chinese tourists want to buy?

20
© 2015 Sedgwick Richardson
Shopper Interests
What they want to buy: Everything (almost)
8%
16%
33%
34%
35%
35%
0% 10% 20% 30% 40%
Baby & Infant
Luxury
Products for daily use
Electronics
Clothing
Cosmetics
Hong Kong may be a great place to get a little bit of everything,
but it lacks the brand appeal that other Asian countries are developing: between January
and July 2015 Korean cosmetics imports into China rose by 251% (Korea International
Trade Association).
Luxury goods
11% 19% 15% 19% 18%
45% 26%
20%
48%
31%
47%
32%
35%
29%
20%
30%
33% 45%
21%
46%
21%
41% 41% 28%
45%
Festival Walk Harbour City Hysan Place IFC Times Square Luxury Electronics
Products for daily use Clothing
Cosmetics
21
© 2015 Sedgwick Richardson
Shopper Interests
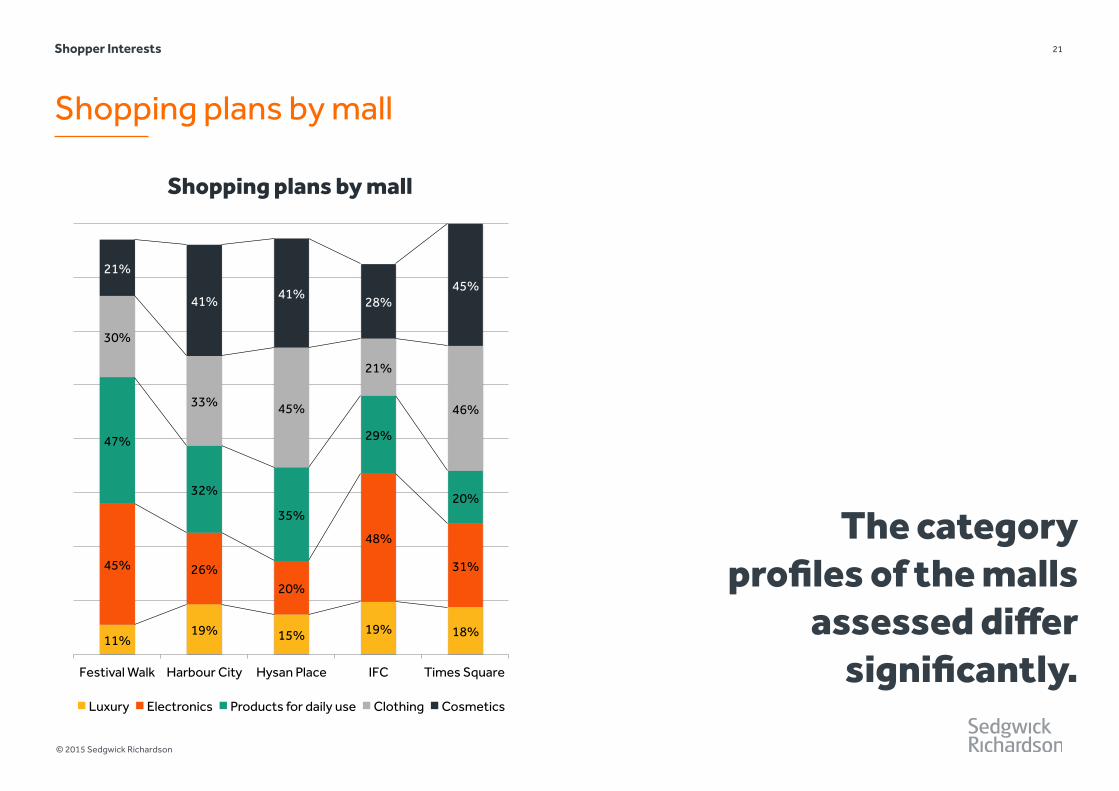
Shopping plans by mall
Shopping plans by mall
11% 19% 15% 19% 18%
45% 26% 20%
48%
31%
47%
32%
35%
29%
20%
30%
33% 45%
21%
46%
21%
41% 41% 28%
45%
Festival Walk Harbour City Hysan Place IFC Times Square
Luxury Electronics Products for daily use Clothing Cosmetics
The category profiles of the malls
assessed differ significantly.

67%
27%
4%
1%
51%
35%
10%
3%
Shopping
Food
Sightseeing
Theme Parks
22
© 2015 Sedgwick Richardson
Shopper Interests
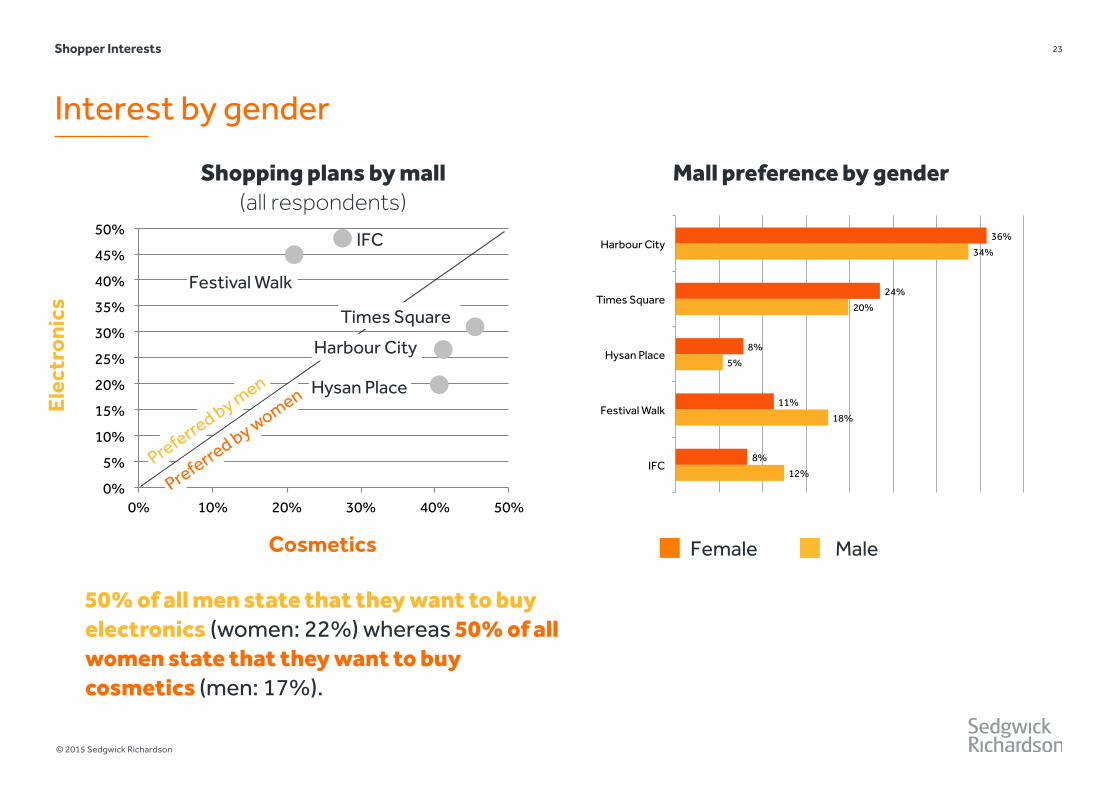
Interest by gender
Female Male
-40NPS
-57Interests
23
© 2015 Sedgwick Richardson
Shopper Interests
Interest by gender
50% of all men state that they want to buy electronics (women: 22%) whereas 50% of all women state that they want to buy cosmetics (men: 17%).
0%
5%
10%
15%
20%
25%
30%
35%
40%
45%
50%
0% 10% 20% 30% 40% 50%
Elec
tron
ics
Cosmetics
Shopping plans by mall (all respondents)
Festival Walk
Hysan Place
IFC
Preferred by women
Preferred by men
Times Square
Harbour City
Elec
tron
ics
Cosmetics
Mall preference by gender
Female Male
36%
24%
8%
11%
8%
34%
20%
5%
18%
12%
Harbour City
Times Square
Hysan Place
Festival Walk
IFC
24
© 2015 Sedgwick Richardson
Shopper Interests
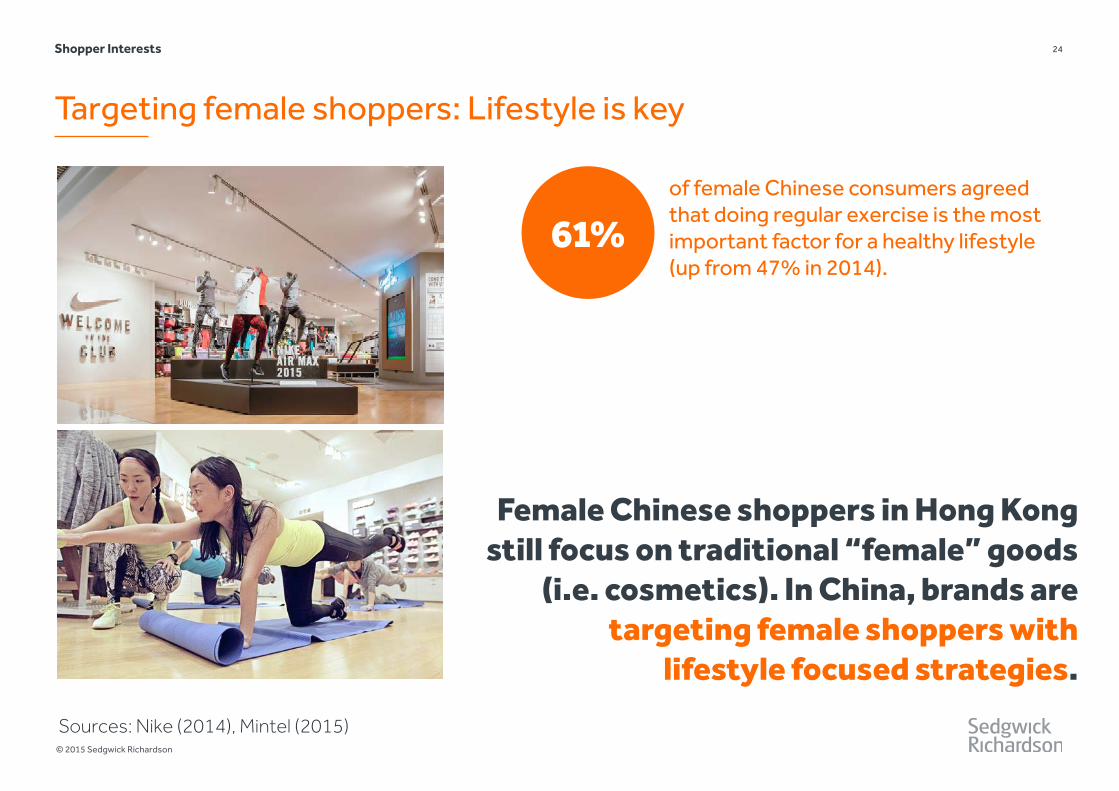
Targeting female shoppers: Lifestyle is key
of female Chinese consumers agreed that doing regular exercise is the most important factor for a healthy lifestyle (up from 47% in 2014).
Sources: Nike (2014), Mintel (2015)
61%
Female Chinese shoppers in Hong Kong still focus on traditional “female” goods
(i.e. cosmetics). In China, brands are targeting female shoppers with
lifestyle focused strategies.
25
© 2015 Sedgwick Richardson
Chinese Millennials Chinese Millennials in Hong Kong: How satisfied they are and what they shop for

26
© 2015 Sedgwick Richardson
Chinese Millennials
Sample share
37% 35%
17% 12%
0%
10%
20%
30%
40%
Below 25 25 - 35 years 35 - 45 years Above 45
MILLENNIALS
27
© 2015 Sedgwick Richardson
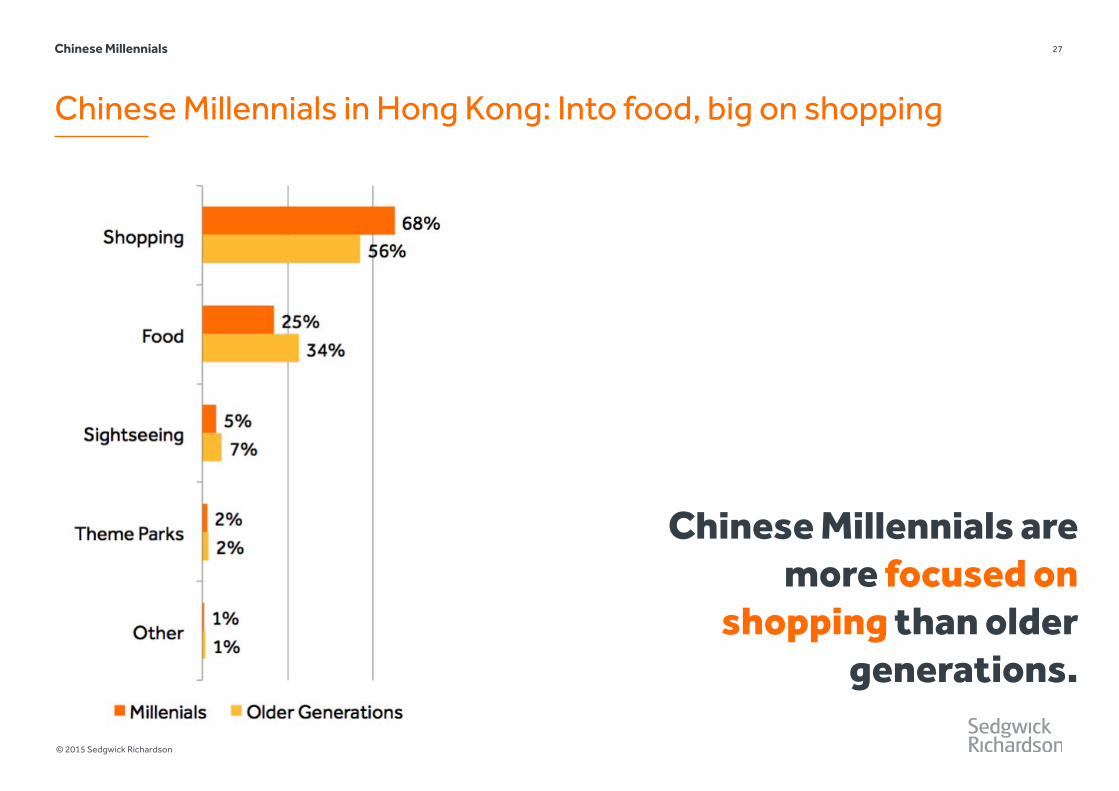
Chinese Millennials in Hong Kong: Into food, big on shopping
Chinese Millennials
Chinese Millennials are more focused on
shopping than older generations.
© 2015 Sedgwick Richardson
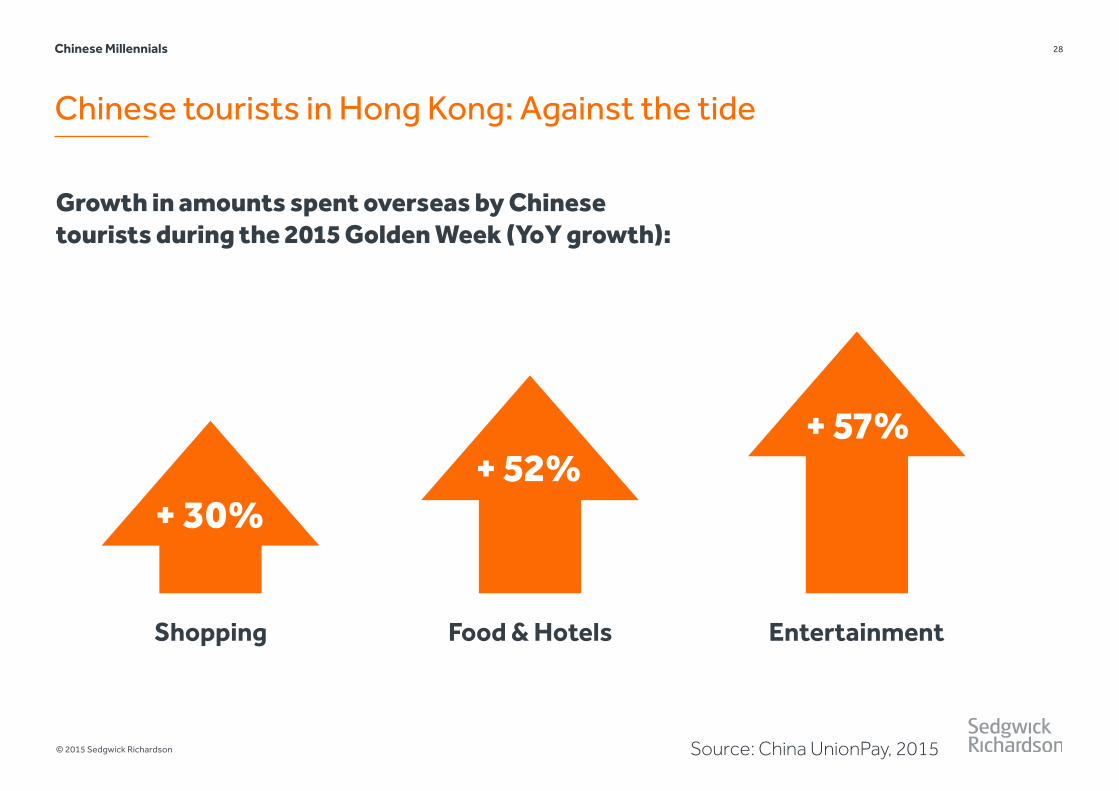
Chinese tourists in Hong Kong: Against the tide
28Chinese Millennials
Growth in amounts spent overseas by Chinese tourists during the 2015 Golden Week (YoY growth):
+ 52%
Food & Hotels
+ 57%
EntertainmentShopping
+ 30%
Source: China UnionPay, 2015

6%
10%
13%
15%
22%
34%
8%
10%
12%
13%
22%
36%
0% 10% 20% 30% 40%
Hysan Place
IFC
Other
Festival Walk
Time Square
Harbour City
Millennials Older Generations
29
© 2015 Sedgwick Richardson
Top mall: Harbour City; Hysan Place more popular with Millennials
Chinese Millennials
We asked all research respondents which malls
they would definitely visit while in Hong Kong if they
only stayed for one day.

12%
17%
36%
32%
32%
30%
2%
16%
31%
33%
40%
43%
0% 10% 20% 30% 40% 50%
Baby & Infant products
Luxury brands
Electronics
Products for daily use
Clothing
Cosmetics
Millennials Older Generations
30
© 2015 Sedgwick Richardson
Millennials: Cosmetics and clothing
Chinese Millennials
Chinese Millennials are more interested in
lifestyle related brands.

31
© 2015 Sedgwick Richardson
-45
Experiences that don’t impress
Millennials NPS-56
Older Generations NPS
Chinese Millennials
Looking at these numbers one needs to factor in that younger
Chinese consumers tend to be more critical than older
generations (Tencent, 2015).

72%
24%
4%
Yes
Unsure
No
32
© 2015 Sedgwick Richardson
Millennials plan to return to Hong Kong
Millennials
66%
22%
11%
Yes
Unsure
No
Older Generations
Chinese Millennials

38%
44%
34% 36% 38% 40% 42% 44% 46%
Millennials Older Generations
33
© 2015 Sedgwick Richardson
Millennials: They know what they want
Chinese Millennials
Share of tourists that has a specific shopping list
Chinese Millennials know what they want to buy —
which is why Hong Kong brands need to reach them
before they arrive in the city.
© 2015 Sedgwick Richardson
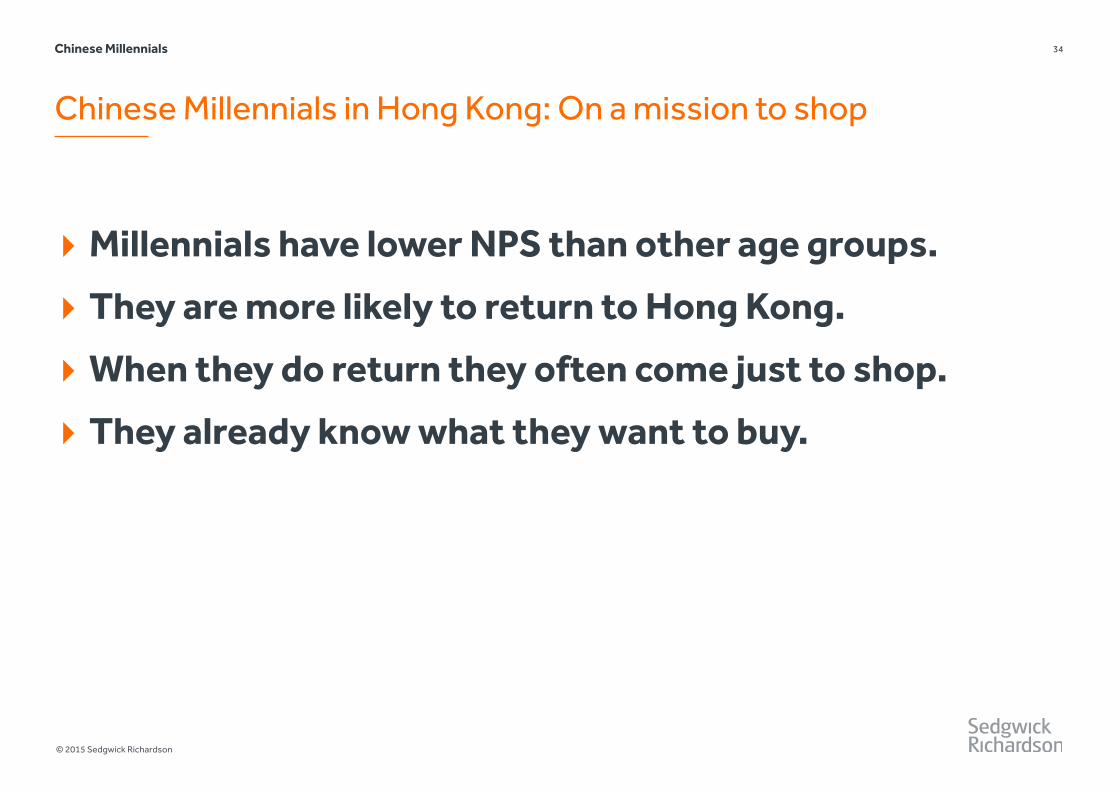
Chinese Millennials in Hong Kong: On a mission to shop
34Chinese Millennials
‣ Millennials have lower NPS than other age groups.
‣ They are more likely to return to Hong Kong.
‣ When they do return they often come just to shop.
‣ They already know what they want to buy.

© 2015 Sedgwick Richardson
A wakeup call for Hong Kong
35
This research indicates that Hong Kong needs to work harder to satisfy Chinese millennials (and Chinese visitors overall).
Even though millennials state that they do plan to return to the city to execute their well planned shopping trips, given that
their overall NPS is low there is the risk that this may change in the future.
Chinese Millennials

© 2015 Sedgwick Richardson
Top destinations vs Spend
36Chinese Millennials
Sources: Ctrip, Fung Business Intelligence Centre, China Luxury Advisors(2015)
Japan
South Korea
Thailand
Hong KongTaiw
anUSA
Singapore
Indonesia
MaldivesItaly
$x,xxx = Average spend of Chinese tourists on retail purchases (USD); Jan - May 2015
$2,270
$1,696
$1,290
$1,256
$1,922
Top 10 Golden Week travel destinations
According to Ctrip.com, Hong
Kong has lost some of its appeal.

37
© 2015 Sedgwick Richardson
Recommendations To stay relevant Hong Kong malls need to embrace not only changing Chinese consumer tastes, but also develop a more effective communications approach.

© 2015 Sedgwick Richardson
38Recommendations
CHINA GLOBAL
Awareness Conversion Loyalty
Search 33% 56%
Brand’s Website
32% 19%
Social Media 12% 4%
Physical Store
11% 13%
Brand’s app
4% 2%
Consideration
Attractive Deals
41% 45%
Learning about new product offerings
40% 33%
Interacting with the brand or its online followers
20% 11%
Want to see & touch the product (off.)
83% 71%
More convenient to have item delivered (on.)
63% 45%
Better prices online (on.) 91% 85%
Comment on a product experience
41% 23%
Follow a favourite brand or retailer
44% 34%
Channels used as a first step to research a brand
Reasons for visiting a particular brand's social
media page
Percentage of consumers who use social media to …
Factors affecting consumers’ decisions to buy
online/ offline
The new marketing funnel
Source: PwC, 2015

© 2015 Sedgwick Richardson
WeChat: Not an optional channel
39
For Chinese consumers WeChat is the most critical social media channel. With more than 400m monthly active users it dominates all other social platforms.
Recommendations
Of the five malls assessed in this research only Harbour City, IFC and Festival Walk had WeChat channels.
However, IFC posted few relevant contents, and during the period reviewed, Festival Walk had not posted anything.
© 2015 Sedgwick Richardson
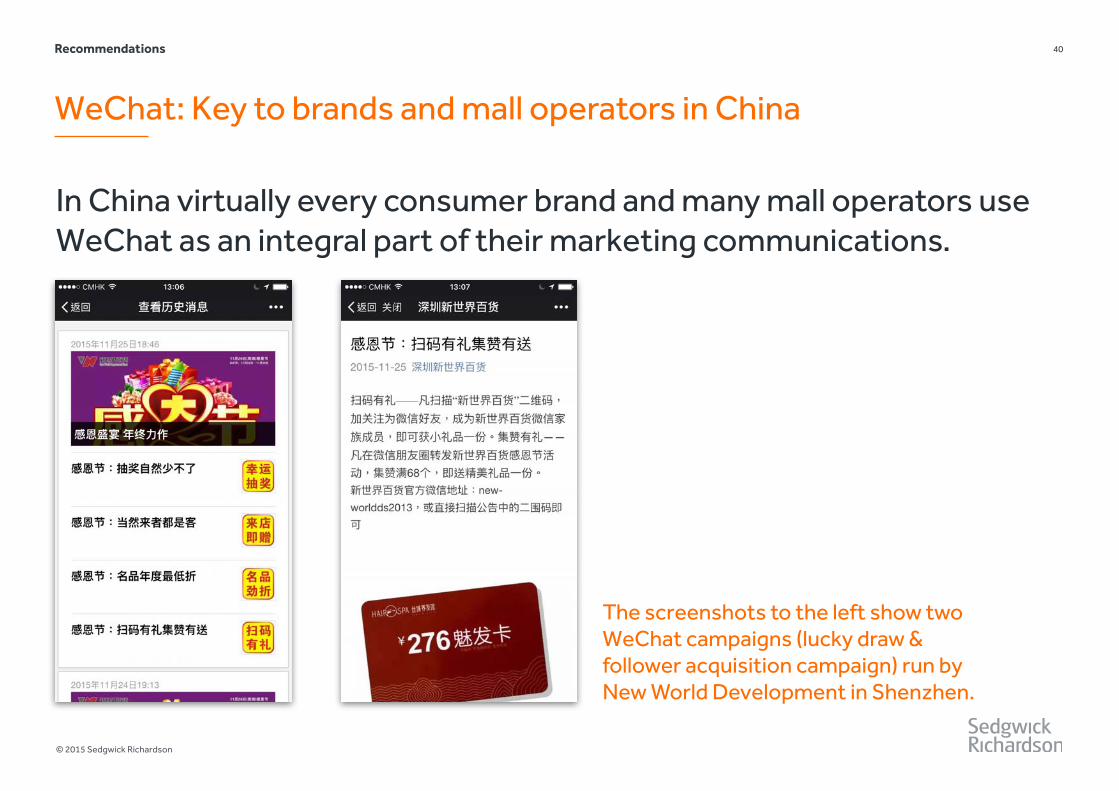
WeChat: Key to brands and mall operators in China
40
In China virtually every consumer brand and many mall operators use WeChat as an integral part of their marketing communications.
Recommendations
The screenshots to the left show two WeChat campaigns (lucky draw & follower acquisition campaign) run by New World Development in Shenzhen.

© 2015 Sedgwick Richardson
The importance of an O2O strategy
41
In Hong Kong, where space is limited and malls and shops are often busy during peak hours, developing O2O solutions that enhance the customer experience is absolutely vital.
Recommendations
JD.com: a major Chinese e-commerce website operates self-collect stations in subway lines in Beijing, Shanghai and Guangzhou.

42
© 2015 Sedgwick Richardson
Key Opportunities:
• Measuring mall efficiency via the NPS • Creating more diverse experiences that match
the interests of female shoppers and millennials • Developing WeChat capabilities and O2O
strategies
© 2015 Sedgwick Richardson
43
Do wallets differ by age?
Total Wallet
Follow us on LinkedIn: www.linkedin.com/company/sedgwick-richardsonVisit www.sedgwick-richardson.com to get more information
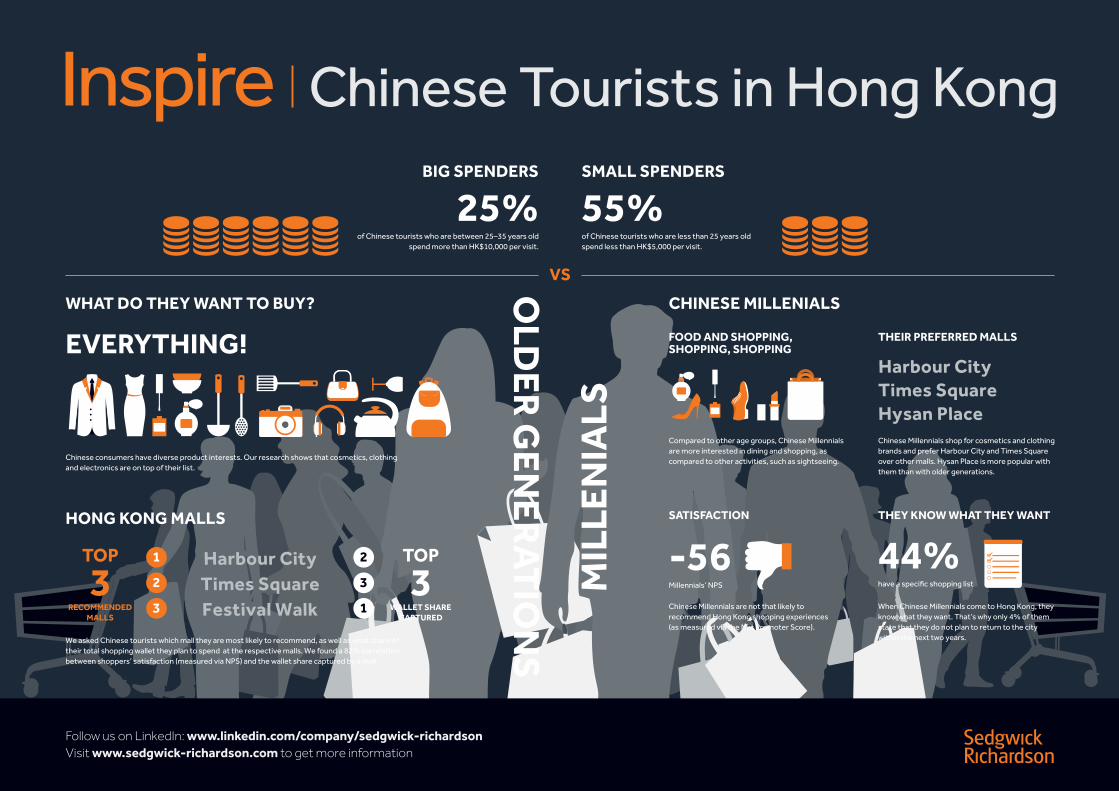
Chinese Tourists in Hong Kong
FOOD AND SHOPPING, SHOPPING, SHOPPING
Compared to other age groups, Chinese Millennials are more interested in dining and shopping, as compared to other activities, such as sightseeing.
THEIR PREFERRED MALLS
Chinese Millennials shop for cosmetics and clothing brands and prefer Harbour City and Times Square over other malls. Hysan Place is more popular with them than with older generations.
Harbour CityTimes SquareHysan Place
CHINESE MILLENIALS
THEY KNOW WHAT THEY WANT
44%have a specific shopping list
When Chinese Millennials come to Hong Kong, they know what they want. That’s why only 4% of them state that they do not plan to return to the city within the next two years.
SATISFACTION
Chinese Millennials are not that likely to recommend Hong Kong shopping experiences (as measured via the Net Promoter Score).
-56Millennials’ NPS
EVERYTHING!
Chinese consumers have diverse product interests. Our research shows that cosmetics, clothing and electronics are on top of their list.
WHAT DO THEY WANT TO BUY?
MIL
LEN
IALS
OLD
ER
GE
NE
RA
TIO
NS
VS
We asked Chinese tourists which mall they are most likely to recommend, as well as what share of their total shopping wallet they plan to spend at the respective malls. We found a 82% correlation between shoppers’ satisfaction (measured via NPS) and the wallet share captured by a mall.
Harbour CityTimes SquareFestival Walk3
2
1
31
3
2
HONG KONG MALLS
TOP
RECOMMENDEDMALLS
3TOP
WALLET SHARECAPTURED
55%of Chinese tourists who are less than 25 years old spend less than HK$5,000 per visit.
SMALL SPENDERS
25%of Chinese tourists who are between 25–35 years old
spend more than HK$10,000 per visit.
BIG SPENDERS
Sedgwick Richardson (Hong Kong)
10/F, 1 Hollywood RoadCentralHong Kong
By Hendrik Kühl Branding Director
T +852 [email protected]
1 3
Thank you.
© 2015 Sedgwick Richardson
44