insights into the performance limits of the li p s...
TRANSCRIPT
Insights into the Performance Limits of the Li7P3S11 SuperionicConductor: A Combined First-Principles and Experimental StudyIek-Heng Chu, Han Nguyen, Sunny Hy, Yuh-Chieh Lin, Zhenbin Wang, Zihan Xu, Zhi Deng,Ying Shirley Meng,* and Shyue Ping Ong*
Department of NanoEngineering, University of California, San Diego, 9500 Gilman Drive, Mail Code 0448, La Jolla, California92093, United States
*S Supporting Information
ABSTRACT: The Li7P3S11 glass-ceramic is a promisingsuperionic conductor electrolyte (SCE) with an extremelyhigh Li+ conductivity that exceeds that of even traditionalorganic electrolytes. In this work, we present a combinedcomputational and experimental investigation of the materialperformance limitations in terms of its phase and electro-chemical stability, and Li+ conductivity. We find that Li7P3S11is metastable at 0 K but becomes stable at above 630 K (∼360°C) when vibrational entropy contributions are accounted for,in agreement with differential scanning calorimetry measurements. Both scanning electron microscopy and the calculated Wulffshape show that Li7P3S11 tends to form relatively isotropic crystals. In terms of electrochemical stability, first-principlescalculations predict that, unlike the LiCoO2 cathode, the olivine LiFePO4 and spinel LiMn2O4 cathodes are likely to form stablepassivation interfaces with the Li7P3S11 SCE. This finding underscores the importance of considering multicomponent integrationin developing an all-solid-state architecture. To probe the fundamental limit of its bulk Li+ conductivity, a comparison ofconventional cold-press sintered versus spark-plasma sintering (SPS) Li7P3S11 was done in conjunction with ab initio moleculardynamics (AIMD) simulations. Though the measured diffusion activation barriers are in excellent agreement, the AIMD-predicted room-temperature Li+ conductivity of 57 mS cm−1 is much higher than the experimental values. The optimized SPSsample exhibits a room-temperature Li+ conductivity of 11.6 mS cm−1, significantly higher than that of the cold-pressed sample(1.3 mS cm−1) due to the reduction of grain boundary resistance by densification. We conclude that grain boundary conductivityis limiting the overall Li+ conductivity in Li7P3S11, and further optimization of overall conductivities should be possible. Finally,we show that Li+ motions in this material are highly collective, and the flexing of the P2S7 ditetrahedra facilitates fast Li
+ diffusion.
KEYWORDS: superionic conductor electrolyte, Li7P3S11, ionic conductivity, electrolyte−electrode interface, spark-plasma sintering,ab initio molecular dynamics
■ INTRODUCTION
Rechargeable all-solid-state lithium-ion batteries utilizing a fastlithium superionic conductor electrolyte (SCE)1−5 have thepotential to revolutionize energy storage by providing aninherently safer, less flammable alternative to traditional organicelectrolyte-based batteries.6−8 The discovery of theLi10GeP2S12
3,9 and Li7P3S114,5,10−13 glass-ceramic conductors
have provided further optimism that SCEs with Li+
conductivities rivaling that of organic solvents exist. Inparticular, a room-temperature ionic conductivity of 17 mScm−1 has been achieved in the Li7P3S11 glass-ceramic,5 which isthe highest ionic conductivity observed for a SCE thus far.Li7P3S11 crystallizes in a triclinic structure with space group
of P1 (Int. No. 2),4 as illustrated in Figure 1. All Li sites arefully occupied, with phosphorus and sulfur atoms formingindividual PS4 tetrahedra or S-sharing P2S7 ditetrahedra. Theprimitive cell consists of two formula units with sevensymmetrically distinct lithium sites.Li7P3S11 was first reported by Mizuno et al. as the metastable
crystal precipitated from 70Li2S·30P2S5, with a room-temper-
ature ionic conductivity of 3.2 mS cm−1.10,11 Its crystal structurewas subsequently characterized by Yamane and co-workers.4
Further optimization of heat treatment and high-pressureconditions during the synthesis process by Seino and co-workers produced a material with a room-temperature ionicconductivity of 17 mS cm−1,5 which they attributed to thereduction of grain boundary impedance and thus reducingoverall cell resistance. Such ionic conductivity even exceeds thatof the Li10GeP2S12 family of electrolytes.3,9,14−16 On thecomputational front, Onodera et al.17,18 applied the reverseMonte Carlo (RMC) approach and found that the lithium ionicconduction pathway, formed by LiS4 tetrahedra linked withvacant S4 tetrahedra, can be remarkably long. Theyhypothesized that the large number of vacant S4 tetrahedrasurrounding the Li ions is the origin of the high ionicconductivity in this compound. Lepley and Holzwarth19 also
Received: January 21, 2016Accepted: March 7, 2016
Research Article
www.acsami.org
© XXXX American Chemical Society A DOI: 10.1021/acsami.6b00833ACS Appl. Mater. Interfaces XXXX, XXX, XXX−XXX

carried out a density functional theory (DFT) study of Li7P3S11and concluded that it is metastable and that the migrationbarrier along the b crystallographic direction (around 150 meV)is lower than along the other two crystallographic directions.In this work, we build on the existing body of knowledge on
the highly promising Li7P3S11 SCE and present a compre-hensive computational and experimental investigation of theperformance limits of this material in terms of its phase andelectrochemical stability, and Li+ conductivity. We show thatLi7P3S11 is entropically stabilized at temperatures above 630 K(∼360 °C) and tends to form relatively isotropic crystals. Wedemonstrate that the synthesis approach has a significant effecton the overall conductivity but only a small effect on measuredactivation energies. While a significant increase in conductivityfrom 1.3 to 11.6 mS cm−1 was experimentally observed by adensification process, ab initio molecular dynamics simulationspredict Li7P3S11 to have aan even higher bulk room-temper-ature Li+ conductivity of 57 mS cm−1. We also discuss the roleof ionic motion correlation and the framework structure infacilitating fast Li+ diffusion.
■ COMPUTATIONAL METHODS AND DETAILSAll calculations were performed using the Vienna ab initio simulationpackage (VASP)20 under the projector augmented wave approach.21 Astructural optimization of the experimental Li7P3S11 structure was firstcarried out,4 and the fully relaxed structure was used in the subsequentcalculations. Unless otherwise indicated, all calculations were spin-polarized and utilized the Perdew−Burke−Ernzerhof (PBE) general-ized-gradient approximation (GGA)22 exchange-correlation functional,a kinetic energy cutoff of 520 eV, and a Monkhorst−Pack k-mesh23
with density of 1000/(number of atoms in the unit cell). All analyseswere performed using the Python Materials Genomics (pymatgen)library.24
Phase Stability. The Li−P−S phase diagram at 0 K wasconstructed by determining the convex hull25 of the composition-energy coordinates of all LixPySz compounds. Precomputed data wereobtained from the Materials Project (MP)26 using the Materials API.27
The energy difference between the Li7P3S11 phase and the predictedphase equilibria, also known as the energy above the hull (Ehull), wasevaluated.25 The Ehull is always non-negative and becomes zero forstable compounds. The higher the Ehull, the less stable the compoundis predicted to be. A constant energy correction of −0.66 eV per Satom, which is similar to the scheme proposed by Wang et al.28 for theO2 molecule, was applied to the elemental sulfur energy.29
Dynamical Stability. Phonon calculations were carried out with a1 × 2 × 1 supercell of Li7P3S11 using the Phonopy package.30 Real-space force constants associated with the atoms in the supercell werefirst computed within the framework of density-functional perturba-tion theory (DFPT),31 and the phonon spectrum was then obtainedby solving the dynamical matrices of various high-symmetry wave
vectors. Thermodynamic quantities such as Gibbs free energy andvibrational entropy were computed from the phonon spectrum (seethe Supporting Information (SI) for details).
Electrochemical Stability. The electrochemical stability of theSCEs in contact with the electrodes was estimated using twothermodynamic approximations.
(1) The first approximation is based on the previous work by Onget al.,14 which assumes that Li is the main mobile species. Under suchconditions, the SCE−electrode interface can be modeled as an opensystem with respect to Li. The relevant thermodynamic potential isthen the grand potential, given as ϕ = E − μLi NLi, where E, NLi, andμLi are respectively the internal energy, the number of Li atoms in theopen system, and the Li chemical potential. The SCE−anode interfaceis modeled as the SCE material at high μLi ≈ μLi
0 , and the SCE−cathode interface is modeled as the SCE material at low μLi ≈ μLi
0 − 5eV. Here, μLi
0 is the energy of metallic Li.(2) The second approximation assumes full thermodynamic
equilibrium between the SCE and electrode in varying ratios. Inessence, the pseudobinary phase diagram between SCE and electrodeis constructed to identify the stable phase equilibria. This methodologyis similar in spirit with previous work by Miara et al.,32 but, in ourapproach, there is no assumption of the alkali ion being the dominantmobile species and composition conservation is enforced for allspecies. We believe this approach is more reflective of the conditionsduring actual synthesis and assembly conditions.
Electronic Structure. The band gap of an SCE serves as a measureof its electronic conductivity, as well as an upper limit for its intrinsicelectrochemical window.33 We performed electronic structurecalculations using the Heyd−Scuseria−Ernzerhof (HSE) hybridfunctional,34,35 which has been shown to be significantly moreaccurate at predicting band gaps compared to semilocal functionals.36
Due to the higher computational load compared to PBE calculations, areduced Monkhorst−Pack k-mesh 2 × 4 × 2 was adopted instead.
Surface Energies and Wulff Shape. The surface energies for allsurfaces with maximum index of 2 of Li7P3S11 were calculated using thefollowing expression:
γ =−E EA2
s b(1)
where Es and Eb represent the total energy of the slab and bulk,respectively, and A is the surface area. The normal width of the slabwas set to at least 10 Å, and a 10 Å vacuum layer was added in thecalculation to minimize interactions between periodic images. Wefurther impose the conditions that PS4
3− and P2S74− polyhedra with
highly covalent P−S bonds must remain intact, and only nonpolarsurfaces were calculated. The equilibrium morphology of the Li7P3S11crystal was determined from the surface energies via the Wulffconstruction.37
Diffusivity and Ionic Conductivity. The diffusivity andconductivity of Li7P3S11 were calculated using non-spin-polarized abinitio molecular dynamics (AIMD) simulations. A smaller plane-waveenergy cutoff was selected as 280 eV. A 1 × 2 × 1 supercell along witha minimal Γ-centered 1 × 1 × 1 k-mesh were adopted. The time stepwas set to 2 fs. The simulation setup is similar to previous work by theauthors.38 The diffusivity was then obtained by performing a linearfitting of the mean square displacement (MSD) with time. Diffusivitieswere obtained at temperatures between 400 K and 1200 K in 100 Kincrements. Then an Arrhenius plot of ionic conductivity (σ(T)), ascomputed using the resulting diffusivities (D(T)) via the Nernst−Einstein relation,
σ ρ=T Tz FR
D T( ) ( )2 2
(2)
was generated and used to determine the activation energy (Ea). Here,ρ is the molar density of diffusing ions in the unit cell. F, R, and z arethe Faraday constant, the gas constant, and the charge of lithium ionsthat equals +1, respectively. A linear extrapolation was made to obtainthe room-temperature conductivity. To analyze the correlationsbetween ion motions, we calculated the self and distinct parts of the
Figure 1. Crystal structure of a 2 × 2 × 2 supercell of Li7P3S11. Thetetrahedra are PS4, and Li and S atoms are labeled with green andyellow spheres, respectively.
ACS Applied Materials & Interfaces Research Article
DOI: 10.1021/acsami.6b00833ACS Appl. Mater. Interfaces XXXX, XXX, XXX−XXX
B

van Hove correlation function from the AIMD trajectories, as detailedin our recent work.29 A detailed description of these methods is alsoprovided in the SI. We also investigated the Li+ diffusion pathways bycalculating the probability density distribution, which is defined on auniform 3D grid in the unit cell (Ω) and obtained by ensembleaveraging over the Li+ ionic trajectories of AIMD in conjunction with∫ Ω P(r) dr = 1.29 The van Hove and also the diffusion pathwayanalyses were performed using the pymatgen-diffusion add-on topymatgen.39
■ EXPERIMENTAL METHODSSynthesis. 70Li2S·30P2S5 glass was synthesized from reagent-grade
chemicals, P2S5 (Sigma-Aldrich, 99%) and Li2S (Sigma-Aldrich99.98%). Stoichiometric amounts of these chemicals were mixed andsealed in a quartz ampoule and heated at 973 K (700 °C) for 4 h. Themolten sample was then quenched to room temperature in ice water.Subsequently, the resulting glass was ground for 30 min with an agatemortar and pestle into a glass powder. For the cold-pressed sample,the glass powder was sealed in a quartz ampoule, heated at 573 K (300°C) for 2 h, and then quenched to room temperature in ice water. Forthe spark-plasma-sintered (SPS) samples, the glass powder was loadedinto 10 mm tungsten−carbide dies, lined with a graphite sheet andpressed lightly. The loaded die was placed into the SPS chamber andpressed to a preload pressure of 10 MPa. The heating and pressureprofiles were as follows: 573 K (300 °C) at a rate of 100 K/min and300 MPa at a rate of 100 MPa/min. The temperature and appliedpressure dwell times were 5 min. The experiment was conductedunder flowing argon gas.Characterization. Cross-sectional images of cold-pressed and SPS
samples were collected with Phillips XL30 scanning electronmicroscopy (SEM). A thin film of iridium was coated onto the
electronically insulating materials for use in the SEM. Iridium wassputtered onto the electrolyte materials by using an Emitech sputtercoater for 7 s, with a current of 8 μA. SEM images were collected withan applied voltage of 20 kV.
X-ray diffraction (XRD) data of glass and glass-ceramic werecollected by Rigaku diffractometer, using Cu Kα radiation. The scanrange was 10°−70°.
The glass-transition temperature (Tg) and the glass-ceramiccrystallization temperature (Tc) were determined by differentialscanning calorimetry (DSC; PerkinElmer Pyris Diamond). Thetemperature range was from room temperature to 673 K (400 °C)with a scan rate of 10 K/min. The glass material was hermeticallysealed in aluminum pans, and measurements were conducted underargon purging.
Electrochemical Measurements. Ionic conductivities weremeasured using electrochemical impedance spectroscopy (EIS) withan impedance analyzer (Solartron 1260) in the frequency range of 1MHz to 1 Hz with an applied AC voltage of 25 mV. The diameters ofthe cold-pressed pellets and the SPS pellets were 13 mm and 10 mm,respectively. Cold-pressed pellets were pressed using 5 t while SPSpellets were used as is. Carbon paste was attached to both sides of thepellets as electrodes, and stainless steel plates were used as currentcollectors.
High-temperature conductivity measurements on the cold-pressedand SPS pellets were collected by heating the pellets in an electricfurnace from room temperature to 453 K in 25 K increments. Thesolid electrolyte cell was heated in the electric furnace at a rate of 10K/min to avoid temperature overshoot. Conductivity measurementswere made after the cell had dwelled at the desired temperature for 1h. The activation energy (Ea) for Li-ion diffusion was obtained from
Figure 2. SEM images of (a) cold-pressed and (b) SPS Li7P3S11 glass-ceramics. (c) XRD patterns of 70Li2S·30P2S5 glass sintered by conventionalmethods and SPS.
ACS Applied Materials & Interfaces Research Article
DOI: 10.1021/acsami.6b00833ACS Appl. Mater. Interfaces XXXX, XXX, XXX−XXX
C

the Arrhenius plot. All measurements and heating were conducted inan Ar atmosphere.
■ RESULTS
Crystal Structure and Characterization. Panels a and bof Figure 2 show the SEM images of Li7P3S11 crystals obtainedfrom the cold-pressed and SPS heat treatment processes,respectively. It is clear that the morphology of the cold-pressedpellet is highly granular and contains a network of open pores,which is in contrast to the morphology of the SPS made pelletsthat exhibit much smoother surfaces. This is in line with theprevious experimental report.5
Figure 2c shows the XRD patterns for the glass powder, cold-pressed glass-ceramic, and SPS glass-ceramic. The bottom curveshows the pattern of the melt-quenched precursors. Nocrystalline peaks from the two starting materials are present,and an amorphous glass phase is achieved when the moltenmaterial is quenched in ice water. Subsequent heat treatment ofthe glass phase material to form the glass-ceramic shows theLi7P3S11 phase formed in both cold-pressed-sintered and SPSsamples. The peaks observed in the cold-pressed-sintered andSPS glass-ceramics are identified as the glass-ceramic Li7P3S11,which are in excellent agreement with the reported crystalstructure by Yamane et al.4 A comparison of the cell parametersestimated via XRD refinement and from DFT calculations inthis work with previous experimental values in the literature isgiven in Table 1. Our experimental lattice parameters are ingood agreement with previous works,4,17 while the PBEcalculated lattice parameters are consistently overestimated by1−3% compared to the experimental values, which can beattributed to the well-known tendency for GGA functionals tounderbind.Phase Stability. Figure 3 shows the calculated Li−P−S
phase diagrams at 0 K. Regardless of whether a sulfurcorrection is applied, Li7P3S11 is predicted to be metastable at0 K. However, the predicted phase equilibria at the Li7P3S11composition depends on whether the sulfur correction isapplied.In the absence of a sulfur correction, the predicted phase
equilibrium is
→ + +Li P S Li PS Li P S S7 3 11 3 4 4 2 6 (3)
and Li7P3S11 is predicted to have an Ehull of 27 meV/atom. Thisresult is consistent with the previous work by Lepley et al.19
Here, Li3PS4 refers to the γ phase (Pmn21; ICSD id, 180318),which is energetically more stable at low temperatures, andLi4P2S6 has space group P63/mcm (ICSD id, 33506). ForLi4P2S6, we performed an enumeration of the disordered ICSDstructure and used the lowest energy ordering in computing thephase diagrams.With the incorporation of the sulfur correction, however, the
local phase triangles change and the predicted phase equilibriais given by the following reaction:
→ +3Li P S 7Li PS P S7 3 11 3 4 2 5 (4)
and Li7P3S11 is predicted to have an Ehull of 21 meV/atom.Here, P2S5 refers to the lowest energy phase in the MPdatabase, which has space group P1 and ICSD id 409061.To estimate the transition temperature at which Li7P3S11
becomes thermodynamically stable, the vibrational contribu-tions to the entropy were estimated by computing the phonon
Table 1. Cell Parameters of Li7P3S11 Reported in Previous Experimental Studies and This Work
a (Å) b (Å) c (Å) α (deg) β (deg) γ (deg)
12.501 6.032 12.530 102.845 113.202 74.467 ref412.483 6.031 12.499 102.906 113.304 74.495 ref1712.586 6.061 12.607 102.937 113.166 74.756 SPS hot-pressing, this work12.493 6.030 12.532 102.834 113.265 74.524 cold-pressing, this work12.84 6.20 12.64 103.72 113.78 74.09 DFT-PBE, this work
Figure 3. Li−P−S phase diagram at zero temperature (a) with and (b)without sulfur energy correction. Stable compounds are indicated asblue dots, whereas the metastable Li7P3S11 is labeled with a brownsquare.
ACS Applied Materials & Interfaces Research Article
DOI: 10.1021/acsami.6b00833ACS Appl. Mater. Interfaces XXXX, XXX, XXX−XXX
D
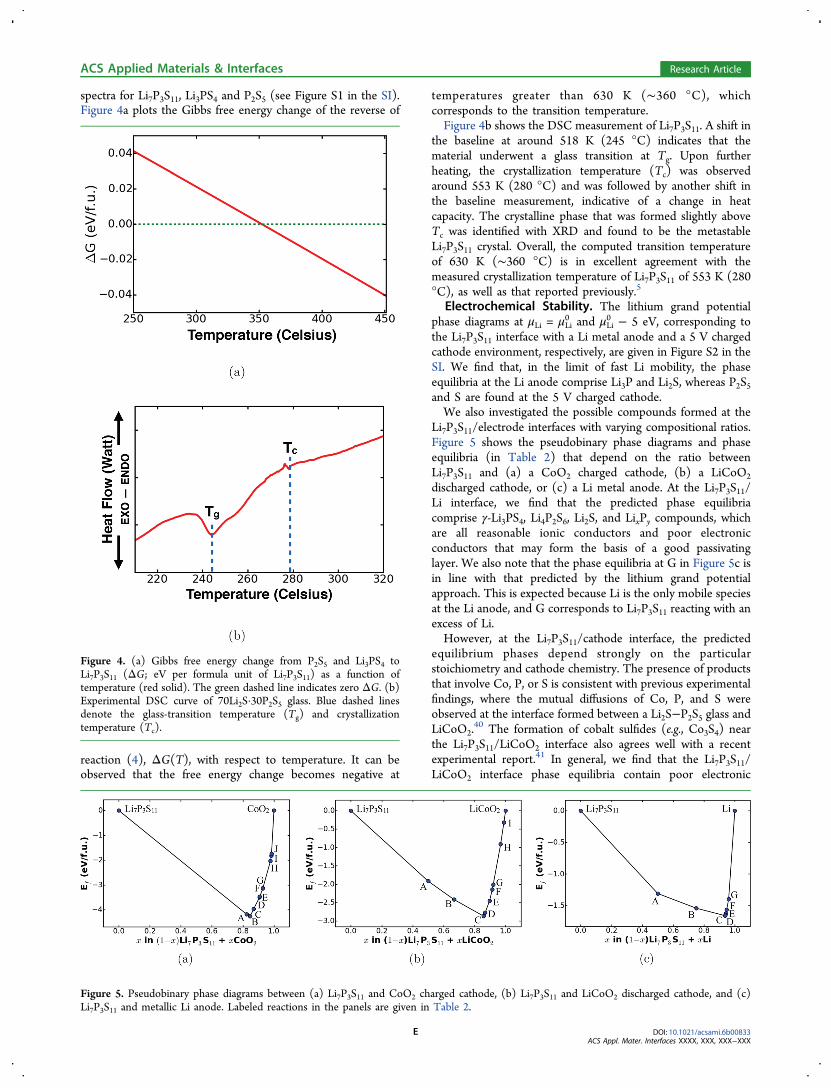
spectra for Li7P3S11, Li3PS4 and P2S5 (see Figure S1 in the SI).Figure 4a plots the Gibbs free energy change of the reverse of
reaction (4), ΔG(T), with respect to temperature. It can beobserved that the free energy change becomes negative at
temperatures greater than 630 K (∼360 °C), whichcorresponds to the transition temperature.Figure 4b shows the DSC measurement of Li7P3S11. A shift in
the baseline at around 518 K (245 °C) indicates that thematerial underwent a glass transition at Tg. Upon furtherheating, the crystallization temperature (Tc) was observedaround 553 K (280 °C) and was followed by another shift inthe baseline measurement, indicative of a change in heatcapacity. The crystalline phase that was formed slightly aboveTc was identified with XRD and found to be the metastableLi7P3S11 crystal. Overall, the computed transition temperatureof 630 K (∼360 °C) is in excellent agreement with themeasured crystallization temperature of Li7P3S11 of 553 K (280°C), as well as that reported previously.5
Electrochemical Stability. The lithium grand potentialphase diagrams at μLi = μLi
0 and μLi0 − 5 eV, corresponding to
the Li7P3S11 interface with a Li metal anode and a 5 V chargedcathode environment, respectively, are given in Figure S2 in theSI. We find that, in the limit of fast Li mobility, the phaseequilibria at the Li anode comprise Li3P and Li2S, whereas P2S5and S are found at the 5 V charged cathode.We also investigated the possible compounds formed at the
Li7P3S11/electrode interfaces with varying compositional ratios.Figure 5 shows the pseudobinary phase diagrams and phaseequilibria (in Table 2) that depend on the ratio betweenLi7P3S11 and (a) a CoO2 charged cathode, (b) a LiCoO2
discharged cathode, or (c) a Li metal anode. At the Li7P3S11/Li interface, we find that the predicted phase equilibriacomprise γ-Li3PS4, Li4P2S6, Li2S, and LixPy compounds, whichare all reasonable ionic conductors and poor electronicconductors that may form the basis of a good passivatinglayer. We also note that the phase equilibria at G in Figure 5c isin line with that predicted by the lithium grand potentialapproach. This is expected because Li is the only mobile speciesat the Li anode, and G corresponds to Li7P3S11 reacting with anexcess of Li.However, at the Li7P3S11/cathode interface, the predicted
equilibrium phases depend strongly on the particularstoichiometry and cathode chemistry. The presence of productsthat involve Co, P, or S is consistent with previous experimentalfindings, where the mutual diffusions of Co, P, and S wereobserved at the interface formed between a Li2S−P2S5 glass andLiCoO2.
40 The formation of cobalt sulfides (e.g., Co3S4) nearthe Li7P3S11/LiCoO2 interface also agrees well with a recentexperimental report.41 In general, we find that the Li7P3S11/LiCoO2 interface phase equilibria contain poor electronic
Figure 4. (a) Gibbs free energy change from P2S5 and Li3PS4 toLi7P3S11 (ΔG; eV per formula unit of Li7P3S11) as a function oftemperature (red solid). The green dashed line indicates zero ΔG. (b)Experimental DSC curve of 70Li2S·30P2S5 glass. Blue dashed linesdenote the glass-transition temperature (Tg) and crystallizationtemperature (Tc).
Figure 5. Pseudobinary phase diagrams between (a) Li7P3S11 and CoO2 charged cathode, (b) Li7P3S11 and LiCoO2 discharged cathode, and (c)Li7P3S11 and metallic Li anode. Labeled reactions in the panels are given in Table 2.
ACS Applied Materials & Interfaces Research Article
DOI: 10.1021/acsami.6b00833ACS Appl. Mater. Interfaces XXXX, XXX, XXX−XXX
E

insulators (e.g., Co and Co3O4 and Co9S8)42,43 in either the
charged or discharged state.Unlike LiCoO2, the interfaces between SCEs and other
common electrode materials such as the olivine LiFePO4 andspinel LiMn2O4 are much less studied. Using the samemethodology, we investigated the phase equilibria betweenLi7P3S11 and the charged olivine FePO4 (Figure S3 in the SI)and charged spinel Mn2O4 (Figure S5 in the SI) cathodes.Although poor electronic insulators such as FeS2 and MnS2appear at certain cathode/SCE ratios x, the phases formed closeto the cathode, i.e., with largest values of x, are all fullyelectronically insulating phases, which may form goodpassivation layers against further reactions.Electronic Structure. The electronic band gap, which can
be obtained from electronic structure calculations, is oftenconsidered as the upper bound of the intrinsic electrochemicalwindow for the SCE studied. The electronic band structure ofLi7P3S11 is illustrated in Figure 6a. A minimum band gap of 3.9eV is found to be indirect from X to N, which suggests thatLi7P3S11 is a wide band gap insulator. Our calculated band gapalso agrees with the value of 3.5 eV previously calculated byXiong et al.44 Figure 6b displays the stacked projected densityof states of the compound. The valence band maximum ismainly contributed to by the p states in S, whereas the p statesin both P and S mostly contribute to the conduction bandminimum. We have also compared the electronic structure ofLi7P3S11 calculated using the PBE functional to that calculated
with the HSE functional. In general, the electronic structure issimilar between the two functionals, except that the PBE bandgap is significantly smaller at 2.6 eV, which agrees with thevalue of 2.1 eV by Xiong et al.44
Surface Energies and Wulff Shape. Figure 7 shows thecalculated Wulff shape and surface energies of the six low-indexorientations for Li7P3S11. The (100), (101 ), and (010) surfacesare the most stable with surface energies of 0.1, 0.12, and 0.16J/m2, respectively. Using the obtained surface energies, theWulff construction of Li7P3S11 was carried out for theequilibrium morphology of Li7P3S11 crystal, as shown in Figure7. The relative area contributions p(n) = An/Atot for the sixorientations n were also estimated. Here, Atot = ∑nAn is thetotal surface area over the six orientations n.Three orientations, (100), (101 ), and (010) contribute more
than 90% of the total surface area of the Wulff shape. Thecalculated Wulff shape is in good qualitative agreement with ourcold-pressed sample (Figure 2a), which shows large relativelyisotropic crystals with few facets.
Li+ Conductivity. The theoretically calculated and exper-imentally measured Arrhenius plot for Li7P3S11 is showntogether in Figure 8a. For the experimentally measuredArrhenius plot, electrochemical impedance measurementswere conducted where the Arrhenius behavior was calculatedby using the real-axis impedance intercept in the Nyquist plotas the total impedance (see Figure S7 and S8 in the SI). Theactivation energy (Ea) extracted from the theoretically
Table 2. Phase Equilibria of Li7P3S11 at (a) CoO2 Charged Cathode, (b) LiCoO2 Discharged Cathode, and (c) Metallic LiAnode As Labeled in Figure 5a
label x phase equilibria
(a) CoO2
A 0.8235 0.8235 CoS2+ 0.0588 P2S5 + 0.4118 Li3PO4
B 0.8462 0.8462 CoS2+ 0.1538 Li4P2O7 + 0.1538 Li3PO4
C 0.8696 0.1739 LiCoPO4 + 0.6957 CoS2+ 0.0435 Li2SO4 + 0.2174 Li3PO4
D 0.9067 0.2667 LiCoPO4 + 0.2133 Co3S4+ 0.1733 Li2SO4 + 0.0133 Li3PO4
E 0.9091 0.2727 LiCoPO4 + 0.0076 Co9S8+ 0.1894 Co3S4+ 0.1818 Li2SO4
F 0.9283 0.1055 Co3(PO4)2 + 0.0042 LiCoPO4 + 0.0675 Co9S8+ 0.2489 Li2SO4
G 0.9289 0.1067 Co3(PO4)2 + 0.0089 CoO + 0.0667 Co9S8+ 0.2489 Li2SO4
H 0.9778 0.0333 Co3(PO4)2 + 0.7111 CoO + 0.1667 CoSO4 + 0.0778 Li2SO4
I 0.9836 0.0246 Co3(PO4)2 + 0.2623 Co3O4+ 0.1230 CoSO4 + 0.0574 Li2SO4
J 0.9844 0.0469 CoPO4 + 0.2734 Co3O4+ 0.1172 CoSO4 + 0.0547 Li2SO4
(b) LiCoO2
A 0.5000 0.5000 CoS2+ 0.2500 Li4P2S6 + 0.7500 Li3PS4 + 0.2500 Li3PO4
B 0.6667 0.1667 CoS2+ 0.6667 Li3PS4 + 0.1667 Co3S4+ 0.3333 Li3PO4
C 0.8571 0.2143 CoS2+ 0.2857 Li2S + 0.2143 Co3S4+ 0.4286 Li3PO4
D 0.8675 0.2651 Li2S + 0.2892 Co3S4+ 0.0361 Li2SO4 + 0.3976 Li3PO4
E 0.8963 0.2075 Li2S + 0.0996 Co9S8+ 0.1369 Li2SO4 + 0.3112 Li3PO4
F 0.9135 0.1015 Co9S8+ 0.2307 Li2O + 0.1396 Li2SO4 + 0.2595 Li3PO4
G 0.9196 0.0804 Li6CoO4 + 0.0932 Co9S8+ 0.1383 Li2SO4 + 0.2412 Li3PO4
H 0.9677 0.0323 Li6CoO4 + 0.3548 Li2SO4 + 0.0968 Li3PO4 + 0.9355 CoI 0.9888 0.1199 Li6CoO4 + 0.8689 CoO + 0.1236 Li2SO4 + 0.0337 Li3PO4
(c) LiA 0.5000 1.0000 Li3PS4 + 0.2500 Li4P2S6B 0.7500 0.3750 Li4P2S6 + 0.5000 Li2SC 0.9375 0.6875 Li2S + 0.1875 PD 0.9391 0.0261 LiP7 + 0.6696 Li2SE 0.9421 0.0248 Li3P7 + 0.6364 Li2SF 0.9474 0.1579 LiP + 0.5789 Li2SG 0.9600 0.1200 Li3P + 0.4400 Li2S
aPoor electronic insulators are indicated with an underline.
ACS Applied Materials & Interfaces Research Article
DOI: 10.1021/acsami.6b00833ACS Appl. Mater. Interfaces XXXX, XXX, XXX−XXX
F
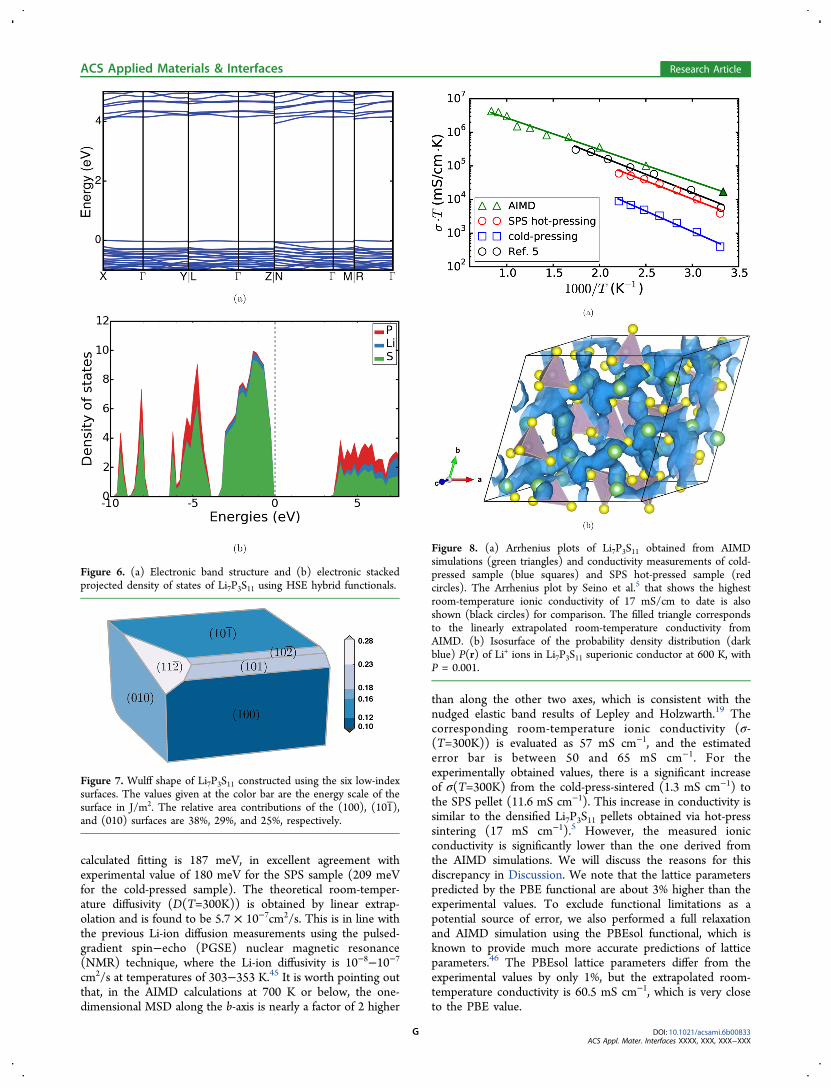
calculated fitting is 187 meV, in excellent agreement withexperimental value of 180 meV for the SPS sample (209 meVfor the cold-pressed sample). The theoretical room-temper-ature diffusivity (D(T=300K)) is obtained by linear extrap-olation and is found to be 5.7 × 10⁻⁷cm2/s. This is in line withthe previous Li-ion diffusion measurements using the pulsed-gradient spin−echo (PGSE) nuclear magnetic resonance(NMR) technique, where the Li-ion diffusivity is 10−8−10−7cm2/s at temperatures of 303−353 K.45 It is worth pointing outthat, in the AIMD calculations at 700 K or below, the one-dimensional MSD along the b-axis is nearly a factor of 2 higher
than along the other two axes, which is consistent with thenudged elastic band results of Lepley and Holzwarth.19 Thecorresponding room-temperature ionic conductivity (σ-(T=300K)) is evaluated as 57 mS cm−1, and the estimatederror bar is between 50 and 65 mS cm−1. For theexperimentally obtained values, there is a significant increaseof σ(T=300K) from the cold-press-sintered (1.3 mS cm−1) tothe SPS pellet (11.6 mS cm−1). This increase in conductivity issimilar to the densified Li7P3S11 pellets obtained via hot-presssintering (17 mS cm−1).5 However, the measured ionicconductivity is significantly lower than the one derived fromthe AIMD simulations. We will discuss the reasons for thisdiscrepancy in Discussion. We note that the lattice parameterspredicted by the PBE functional are about 3% higher than theexperimental values. To exclude functional limitations as apotential source of error, we also performed a full relaxationand AIMD simulation using the PBEsol functional, which isknown to provide much more accurate predictions of latticeparameters.46 The PBEsol lattice parameters differ from theexperimental values by only 1%, but the extrapolated room-temperature conductivity is 60.5 mS cm−1, which is very closeto the PBE value.
Figure 6. (a) Electronic band structure and (b) electronic stackedprojected density of states of Li7P3S11 using HSE hybrid functionals.
Figure 7. Wulff shape of Li7P3S11 constructed using the six low-indexsurfaces. The values given at the color bar are the energy scale of thesurface in J/m2. The relative area contributions of the (100), (101 ),and (010) surfaces are 38%, 29%, and 25%, respectively.
Figure 8. (a) Arrhenius plots of Li7P3S11 obtained from AIMDsimulations (green triangles) and conductivity measurements of cold-pressed sample (blue squares) and SPS hot-pressed sample (redcircles). The Arrhenius plot by Seino et al.5 that shows the highestroom-temperature ionic conductivity of 17 mS/cm to date is alsoshown (black circles) for comparison. The filled triangle correspondsto the linearly extrapolated room-temperature conductivity fromAIMD. (b) Isosurface of the probability density distribution (darkblue) P(r) of Li+ ions in Li7P3S11 superionic conductor at 600 K, withP = 0.001.
ACS Applied Materials & Interfaces Research Article
DOI: 10.1021/acsami.6b00833ACS Appl. Mater. Interfaces XXXX, XXX, XXX−XXX
G

Correlated Li+ Motions and Framework Motions.Figure 8b shows the probability density distribution (P(r)) ofLi+ at 600 K. It is clear that the diffusion pathway forms a 3Dnetwork in which all of the Li+ sites are connected to oneanother via empty S4 tetrahedra. Given that the Li sites are fullyoccupied in this compound, this suggests that the Li ionicmotion is highly collective, in agreement with previousexperimental45 and computational investigations.47,48 This isalso in contrast to other Li superionic conductors where defects(e.g., Li+ vacancy) are required to facilitate the Li-iondiffusion.38
The van Hove correlation function (G), which can be dividedinto the self part (Gs) and the distinct part (Gd), is oftenadopted for investigating the highly correlated ionic motions.Figure 9a plots Gd for lithium after thermal equilibration inwhich a large magnitude of Gd is reached for r < 1 Å soon after t= 2 ps at 600 K. We relate this to the correlation time scale ofthe lithium-ion motions. This is also a strong indication ofcollective motions because for a given reference lithium ion atsite r, it shows that other lithium ions move and occupy thatsite at later time moments when this reference ion diffusesaway. Moreover, Gd is peaked but with smaller magnitude andmore broadened for r between 3.5 and 4.5 Å, and also between6 and 7 Å. The former is close to the shortest lithium−lithiumdistance in the initially relaxed atomic structure (see Figure S9).The presence of these peaks also implies that on average eachlithium ion is surrounded by some of the other lithium ionsduring the entire diffusion process. Figure 9b shows the Gs forlithium as functions of r and t after thermal equilibrationprocess at 600 K. It shows that Gs remains large for r < 1 Åbefore t < 10 ps, and then its value decreases. This suggests thatthe lithium ions tend to diffuse away from their initial positionsto neighboring lithium sites.
For comparison, the Gd and Gs plots for another superionicconductor Li10GeP2S12 are presented in Figure 9c,d, respec-tively. As indicated in Figure 9c, we observe that the time scaleof correlation in Li10GeP2S12 is around 10 ps at 600 K, which islonger than that of Li7P3S11. Similar to Li7P3S11, there are twobroadened peaks for r (i) between 3 and 5 Å and (ii) between 6and 7 Å (see also Figure S10). The former region relates to theshortest lithium−lithium distance in the initially relaxedstructure. Comparing the Gs, we may also note that Li+ inLi10GeP2S12 has a much higher probability of returning to theirinitial positions and staying there for a longer time durationthan in Li7P3S11. These findings are consistent with the lowerionic conductivity of Li10GeP2S12 compared to that of Li7P3S11.We also investigated the motion of the framework ions in the
AIMD trajectories. We find no evidence of framework meltingat all temperatures. The P−S bond distances show very smallfluctuations of <0.1 Å during the simulations, whereas S−Sdistances within the same tetrahedron show a slightly largerfluctuation of ∼0.2 Å. S−S distance fluctuations become muchlarger for S in different tetrahedra. We also find that the P-bridging S−P bond angle in the P2S7 ditetrahedra fluctuates byaround 5° in the simulations.
■ DISCUSSION
In this work, we performed a comprehensive DFT andexperimental investigation of the Li7P3S11 glass-ceramic solidelectrolyte. A good solid electrolyte must satisfy several criteria,namely, phase stability, a wide electrochemical stability, and ahigh Li+ conductivity.In terms of stability, we find that though Li7P3S11 is a
metastable phase at 0 K, it becomes stable at above 630 K(∼360 °C) when vibrational entropic contributions are takeninto account. Our estimated transition temperature of 630 K
Figure 9. Distinct part of the van Hove correlation function (Gd) for lithium in (a) Li7P3S11 and (c) Li10GeP2S12. The self-part of the van Hovecorrelation function (Gs) for lithium in (b) Li7P3S11 and (d) Li10GeP2S12. Both Gd and Gs are functions of the average Li−Li pair distance r and timestep after thermal equilibration at 600 K.
ACS Applied Materials & Interfaces Research Article
DOI: 10.1021/acsami.6b00833ACS Appl. Mater. Interfaces XXXX, XXX, XXX−XXX
H

(∼360 °C) agrees well with the experimental crystallizationtemperature of 553 K (280 °C). However, the predicted phaseequilibria of Li7P3S11 depends significantly on the sulfurchemical potential. When a corrected sulfur energy (toreproduce experimental formation energies of sulfides) isused, the predicted phase equilibrium comprises γ-Li3PS4 andP2S5. When an uncorrected sulfur energy is used, the phaseequilibrium contains Li4P2S6 and S. The latter phaseequilibrium is actually more consistent with previousexperimental results, which found Li4P2S6 as one of the primarydecomposition products under certain synthesis conditions at>633 K (360 °C).12 There are two reasons for this apparentdiscrepancy. First, Li4P2S6 is a disordered structure, and thusmay be entropically more stable at higher temperatures.Second, any sulfur loss at high temperatures would also resultin the latter phase equilibrium becoming significantly morefavorable, in line with Le Chatelier’s principle. We believe that,at lower temperatures, the phase equilibria should indeedcomprise the low-temperature γ-Li3PS4 and P2S5 phases.Furthermore, both Li4P2S6 and Li3PS4 are observed duringsolid-state synthesis of Li2S−P2S5 glass-ceramics.12
In agreement with previous DFT results of Zhu et al.,49 wefind that Li7P3S11 is unlikely to be intrinsically stable againsteither the cathode or anode. At the Li metal anode, thepredicted products formed are generally reasonable ionicconductors and poor electronic conductors that should forma good passivation layer. Somewhat surprisingly, it is theLi7P3S11/cathode interface that might pose stability issues,depending on the cathode chemistry selected. For the olivineLiFePO4 and spinel LiMn2O4, we find that the predicted phaseequilibria for the Li7P3S11/charged cathode interface containsfully electronic insulating, but ionic conducting, phases near thecathode. These phases are potential candidates for a goodpassivation layer, which can stabilize the cathode/Li7P3S11interface during battery operations. For the layered LiCoO2cathode on the other hand, we find that poor electronicinsulators are present at all stoichiometries, in agreement withprevious experimental studies.41 This suggests that theLi7P3S11/LiCoO2 interface is unstable against further prop-agation of the reaction front, and buffer layers such as LiNbO3need to be introduced to improve stability and improve ratecapability.41,50,51 To the authors’ knowledge, there have beenno extensive study done on the interactions between differentcathode and SCE chemistries. The DFT results show that theselection of the cathode chemistry is likely to be of criticalimportance in designing an all-solid-state battery.The results of the AIMD simulations are somewhat
surprising. Though there is excellent agreement between thecomputed and experimentally measured diffusion activationenergy Ea, the extrapolated conductivity at 300 K of 57 mScm−1 is a factor of 3−5 higher than the experimental values,which are between 11.6 and 17 mS cm−1.5 One possibleexplanation for this discrepancy is that there is a phasetransition that occurs between 300 K and the temperatures ofthe AIMD simulations. However, the minimum temperature inour AIMD simulations is 400 K, one of the lowest temperaturesever performed for a solid-state conductor, and it is unlikelythere is a phase transition between 300 and 400 K that wouldsignificantly alter the Li diffusion behavior. Our hypothesistherefore is that the intrinsic bulk Li+ conductivity of theLi7P3S11 crystal is indeed significantly higher than the currentlyachieved conductivities thus far, and grain boundary limitationsare responsible for the lower experimental conductivities. In
fact, until recently, the ionic conductivity of Li7P3S11 obtainedin the experiments was only as high as 5.2 mS cm−1.13 It isthrough the reduction of grain boundary impedance bydensification via hot-press sintering or SPS that the highestroom-temperature conductivities have been achieved thus farfor this material.5 Another recent experiment also showed thatfurther optimization of the glass-ceramic by reducing theamorphous glass phase detected via p-MAS could improve theoverall conductivity of the material.52
We further support this hypothesis with the observation thatdespite having fairly similar Ea, the measured conductivities ofthe cold-pressed and SPS samples differ by more than 1 orderof magnitude. The highly granular morphology of the cold-pressed sample is expected to have significantly higher grainboundary resistance than that of the SPS made pellets. Giventhat the experimental and computed Ea are all similar, webelieve that the local structure and fundamental diffusionmechanisms are similar in both the amorphous grain boundaryand the bulk phase. We speculate that the vastly differentconductivities are therefore due to either a concentration effectfrom possible Li depletion at the grain boundaries or adifference in the hopping attempt frequency prefactor in theArrhenius relation. The testing of these hypotheses will be thesubject of future work.We attempted to obtain further insights into the topological
reasons for the high Li+ conductivity of Li7P3S11. Consistentwith previous analyses,17,18 the Li probability densitydistribution shows that Li+ diffusion occurs through inter-connected S4 tetrahedra sites. This tetrahedron-to-tetrahedronhopping in a bcc-like anion framework has been identified byWang et al.53 as a low-barrier mechanism. The van Hovecorrelation function analysis also highlights the highlycorrelated nature of the Li motion in Li7P3S11, where the sitevacated by a diffusing Li+ is rapidly occupied by another Li+,resulting in a significantly lower probability of a “back-hop”compared to Li10GeP2S12. Also, the Gd of Li7P3S11 is peaked at rbetween 3.5 and 4.5 Å during the time period studied, whichcorresponds to the average Li−Li separation during diffusion.This is in good agreement with a recent experimentalmeasurement in which the jump length of Li ions during Li+
migration is estimated at 4.3 Å.48 Finally, we also find thatalthough the framework PS4 tends to remain relatively rigidthroughout the simulations, significant flexing of the P2S7ditetrahedra is observed. This is consistent with the recentexperimental finding that the motional fluctuations of theframework polyhedrons contribute to the fast Li-ion diffusion.54
■ CONCLUSIONSTo conclude, we have performed a comprehensive computa-tional and experimental investigation of the performance limitsof the Li7P3S11 superionic conductor. Our work has shedimportant insights into the phase and electrochemical stabilityand Li+ conductivity in this material. We find that the stabilityof the Li7P3S11/cathode interface depends critically on thecathode chemistry. Unlike layered LiCoO2 cathode, DFTcalculations predict that the olivine LiFePO4 and spinelLiMn2O4 cathodes are likely to form more stable passivatingphases with Li7P3S11. Furthermore, while significant increasefrom cold-press-sintered to SPS pellet was observed due todensification, the predicted bulk Li+ conductivity of Li7P3S11 is57 mS cm−1, significantly higher than the values achievedexperimentally thus far. The significant difference in Li+ ofLi7P3S11 synthesis via cold-pressed sintering and SPS shows that
ACS Applied Materials & Interfaces Research Article
DOI: 10.1021/acsami.6b00833ACS Appl. Mater. Interfaces XXXX, XXX, XXX−XXX
I

grain boundary conductivity is likely limiting the overall Li+
conductivity in Li7P3S11. Further optimization of overall Li+
conductivities in Li7P3S11 should therefore be possible.
■ ASSOCIATED CONTENT*S Supporting InformationThe Supporting Information is available free of charge on theACS Publications website at DOI: 10.1021/acsami.6b00833.
Computational details of phonons and thermodynamicproperties of Li7P3S11, introduction of van Hovecorrelation functions, lithium grand potential phasediagrams, pseudobinary phase diagrams of Li7P3S11 witholivine LiFePO4 and spinel LiMn2O4, static pairdistribution functions of Li7P3S11 and Li10GeP2S12, andLi7P3S11 glass-ceramic Nyquist curves from cold-pressedand SPS hot-pressed samples (PDF)
■ AUTHOR INFORMATIONCorresponding Authors*(Y.S.M.) E-mail: [email protected].*(S.P.O.) E-mail: [email protected] authors declare no competing financial interest.
■ ACKNOWLEDGMENTSThis work was primarily supported by the U.S. Department ofEnergy, Office of Science, Basic Energy Sciences under AwardNos. DE-SC0012118 (computational studies) and DE-SC0002357 (experimental work) . We also acknowledgecomputational resources provided by Triton Shared Comput-ing Cluster (TSCC) at the University of California, San Diego,the National Energy Research Scientific Computing Center(NERSC), and the Extreme Science and Engineering DiscoveryEnvironment (XSEDE) supported by National ScienceFoundation under Grant No. ACI-1053575.
■ REFERENCES(1) Inaguma, Y.; Liquan, C.; Itoh, M.; Nakamura, T.; Uchida, T.;Ikuta, H.; Wakihara, M. High Ionic Conductivity in LithiumLanthanum Titanate. Solid State Commun. 1993, 86, 689−693.(2) Murugan, R.; Thangadurai, V.; Weppner, W. Fast Lithium IonConduction in Garnet-type Li7La3Zr2O12. Angew. Chem., Int. Ed. 2007,46, 7778−7781.(3) Kamaya, N.; Homma, K.; Yamakawa, Y.; Hirayama, M.; Kanno,R.; Yonemura, M.; Kamiyama, T.; Kato, Y.; Hama, S.; Kawamoto, K.;Mitsui, A. A Lithium Superionic Conductor. Nat. Mater. 2011, 10,682−686.(4) Yamane, H.; Shibata, M.; Shimane, Y.; Junke, T.; Seino, Y.;Adams, S.; Minami, K.; Hayashi, A.; Tatsumisago, M. Crystal Structureof a Superionic Conductor, Li7P3S11. Solid State Ionics 2007, 178,1163−1167.(5) Seino, Y.; Ota, T.; Takada, K.; Hayashi, A.; Tatsumisago, M. ASulphide Lithium Super Ion Conductor Is Superior to Liquid IonConductors for Use in Rechargeable Batteries. Energy Environ. Sci.2014, 7, 627−631.(6) Tarascon, J.; Armand, M. Issues and Challenges FacingRechargeable Lithium Batteries. Nature 2001, 414, 359−367.(7) Armand, M.; Tarascon, J. Building Better Batteries. Nature 2008,451, 652−657.(8) Xu, K. Electrolytes and Interphases in Li-ion Batteries andBeyond. Chem. Rev. 2014, 114, 11503−11618.(9) Mo, Y.; Ong, S. P.; Ceder, G. First Principles Study of theLi10GeP2S12 Lithium Super Ionic Conductor Material. Chem. Mater.2012, 24, 15−17.
(10) Mizuno, F.; Hayashi, a.; Tadanaga, K.; Tatsumisago, M. New,Highly Ion-conductive Crystals Precipitated from Li2S-P2S5 Glasses.Adv. Mater. 2005, 17, 918−921.(11) Mizuno, F.; Hayashi, a.; Tadanaga, K.; Tatsumisago, M. HighLithium Ion Conducting Glass-Ceramics in the System Li2S-P2S5. SolidState Ionics 2006, 177, 2721−2725.(12) Minami, K.; Hayashi, A.; Tatsumisago, M. Preparation andCharacterization of Superionic Conducting Li7P3S11 Crystal fromGlassy Liquids. J. Ceram. Soc. Jpn. 2010, 118, 305−308.(13) Minami, K.; Hayashi, A.; Tatsumisago, M. CrystallizationProcess for Superionic Li7P3S11 Glass-ceramic Electrolytes. J. Am.Ceram. Soc. 2011, 94, 1779−1783.(14) Ong, S. P.; Mo, Y.; Richards, W. D.; Miara, L.; Lee, H. S.; Ceder,G. Phase Stability, Electrochemical Stability and Ionic Conductivity ofthe Li10±1MP2X12 (M = Ge, Si, Sn, Al or P, and X = O, S or Se) Familyof Superionic Conductors. Energy Environ. Sci. 2013, 6, 148−156.(15) Bron, P.; Johansson, S.; Zick, K.; Schmedt auf der Gunne, J.;Dehnen, S. S.; Roling, B. Li10SnP2S12 - An Affordable LithiumSuperionic Conductor Li10SnP2S12 - An Affordable Lithium SuperionicConductor. J. Am. Chem. Soc. 2013, 135, 15694−15697.(16) Kuhn, A.; Duppel, V.; Lotsch, B. V. Tetragonal Li10GeP2S12 andLi7GePS8 - Exploring the Li Ion Dynamics in LGPS Li Electrolytes.Energy Environ. Sci. 2013, 6, 3548−3552.(17) Onodera, Y.; Mori, K.; Otomo, T.; Sugiyama, M.; Fukunaga, T.Structural Evidence for High Ionic Conductivity of Li7P3S11Metastable Crystal. J. Phys. Soc. Jpn. 2012, 81, 044802.(18) Onodera, Y.; Mori, K.; Otomo, T.; Arai, H.; Uchimoto, Y.;Ogumi, Z.; Fukunaga, T. Structural Origin of Ionic Conductivity forLi7P3S11 Metastable Crystal by Neutron And X-ray Diffraction. J. Phys.:Conf. Ser. 2014, 502, 012021.(19) Lepley, N. D.; Holzwarth, N. a. W. Computer Modeling ofCrystalline Electrolytes: Lithium Thiophosphates and Phosphates. J.Electrochem. Soc. 2012, 159, A538−A547.(20) Kresse, G.; Furthmuller, J. Efficient Iterative Schemes for AbInitio Total-energy Calculations Using a Plane-wave Basis Set. Phys.Rev. B: Condens. Matter Mater. Phys. 1996, 54, 11169−11186.(21) Blochl, P. E. Projector Augmented-wave Method. Phys. Rev. B:Condens. Matter Mater. Phys. 1994, 50, 17953−17979.(22) Perdew, J.; Burke, K.; Ernzerhof, M. Generalized GradientApproximation Made Simple. Phys. Rev. Lett. 1996, 77, 3865−3868.(23) Monkhorst, H.; Pack, J. Special Points for Brillouin-zoneIntegrations. Phys. Rev. B 1976, 13, 5188−5192.(24) Ong, S. P.; Richards, W. D.; Jain, A.; Hautier, G.; Kocher, M.;Cholia, S.; Gunter, D.; Chevrier, V. L.; Persson, K. a.; Ceder, G.Python Materials Genomics (Pymatgen): A Robust, Open-SourcePython Library for Materials Analysis. Comput. Mater. Sci. 2013, 68,314−319.(25) Ong, S. P.; Wang, L.; Kang, B.; Ceder, G. Li-Fe-P-O2 PhaseDiagram from First Principles Calculations. Chem. Mater. 2008, 20,1798−1807.(26) Jain, A.; Ong, S. P.; Hautier, G.; Chen, W.; Richards, W. D.;Dacek, S.; Cholia, S.; Gunter, D.; Skinner, D.; Ceder, G.; Persson, K. a.Commentary: The Materials Project: A Materials Genome Approachto Accelerating Materials Innovation. APL Mater. 2013, 1, 011002.(27) Ong, S. P.; Cholia, S.; Jain, A.; Brafman, M.; Gunter, D.; Ceder,G.; Persson, K. a. The Materials Application Programming Interface(API): A Simple, Flexible and Efficient API for Materials Data Basedon REpresentational State Transfer (REST) Principles. Comput. Mater.Sci. 2015, 97, 209−215.(28) Wang, L.; Maxisch, T.; Ceder, G. Oxidation Energies ofTransition Metal Oxides within the GGA + U Framework. Phys. Rev.B: Condens. Matter Mater. Phys. 2006, 73, 195107.(29) Zhu, Z.; Chu, I.-H.; Deng, Z.; Ong, S. P. Role of Na+ Interstitialsand Dopants in Enhancing the Na+ Conductivity of the Cubic Na3PS4Superionic Conductor. Chem. Mater. 2015, 27, 8318−8325.(30) Togo, A.; Oba, F.; Tanaka, I. First-Principles Calculations of theFerroelastic Transition between Rutile-type and CaCl2-type SiO2 atHigh Pressures. Phys. Rev. B: Condens. Matter Mater. Phys. 2008, 78,134106.
ACS Applied Materials & Interfaces Research Article
DOI: 10.1021/acsami.6b00833ACS Appl. Mater. Interfaces XXXX, XXX, XXX−XXX
J
(31) Baroni, S.; de Gironcoli, S. D.; Dal Corso, A.; Giannozzi, P.Phonons and Related Crystal Properties from Density-FunctionalPerturbation Theory. Rev. Mod. Phys. 2001, 73, 515−562.(32) Miara, L. J.; Richards, W. D.; Wang, Y. E.; Ceder, G. First-principles Studies on Cation Dopants and Electrolyte-cathodeInterphases for Lithium Garnets. Chem. Mater. 2015, 27, 4040−4047.(33) Ong, S. P.; Ceder, G. Investigation of the Effect of FunctionalGroup Substitutions on the Gas-phase Electron Affinities andIonization Energies of Room-temperature Ionic Liquids Ions UsingDensity Functional Theory. Electrochim. Acta 2010, 55, 3804−3811.(34) Heyd, J.; Scuseria, G. E.; Ernzerhof, M. Hybrid FunctionalsBased on a Screened Coulomb Potential. J. Chem. Phys. 2003, 118,8207−8215.(35) Heyd, J.; Scuseria, G. E.; Ernzerhof, M. Erratum: ”HybridFunctionals Based on a Screened Coulomb Potential” [J. Chem. Phys.118, 8207 (2003)]. J. Chem. Phys. 2006, 124, 219906.(36) Heyd, J.; Scuseria, G. E. Efficient Hybrid Density FunctionalCalculations in Solids: Assessment of the Heyd-Scuseria-ErnzerhofScreened Coulomb Hybrid Functional. J. Chem. Phys. 2004, 121,1187−1192.(37) Wang, L.; Zhou, F.; Meng, Y. S.; Ceder, G. First-PrinciplesStudy of Surface Properties of LiFePO4: Surface Energy, Structure,Wulff Shape, and Surface Redox Potential. Phys. Rev. B: Condens.Matter Mater. Phys. 2007, 76, 165435.(38) Deng, Z.; Radhakrishnan, B.; Ong, S. P. Rational CompositionOptimization of the Lithium-rich Li3OCl1−xBrx Anti-perovskiteSuperionic Conductors. Chem. Mater. 2015, 27, 3749−3755.(39) pymatgen-diffusion. http://dx.doi.org/10.5281/zenodo.46807(accessed Mar. 2, 2016).(40) Sakuda, A.; Hayashi, A.; Tatsumisago, M. InterfacialObservation Between LiCoO2 Electrode and Li2S-P2S5 Solid Electro-lytes of All-solid-state Lithium Secondary Batteries Using Trans-mission Electron Microscopy. Chem. Mater. 2010, 22, 949−956.(41) Mizuno, F.; Iba, H. Research on Electrode-Electrolyte Interfacesof Innovative New Generation Batteries. Honolulu PRIME 2012,Meeting Abstract 1196; The Electrochemical Society: Pennington, NJ,USA, 2012.(42) Ramos, M.; Berhault, G.; Ferrer, D. a.; Torres, B.; Chianelli, R.R. HRTEM and Molecular Modeling of the MoS2-Co9S8 Interface:Understanding the Promotion Effect in Bulk HDS Catalysts. Catal. Sci.Technol. 2012, 2, 164.(43) Qiao, L.; Xiao, H. Y.; Meyer, H. M.; Sun, J. N.; Rouleau, C. M.;Puretzky, a. a.; Geohegan, D. B.; Ivanov, I. N.; Yoon, M.; Weber, W. J.;Biegalski, M. D. Nature of the Band Gap and Origin of the Electro-/Photo-activity of Co3O4. J. Mater. Chem. C 2013, 1, 4628−4633.(44) Xiong, K.; Longo, R.; Kc, S.; Wang, W.; Cho, K. Behavior of LiDefects in Solid Electrolyte Lithium Thiophosphate Li7P3S11: A FirstPrinciples Study. Comput. Mater. Sci. 2014, 90, 44−49.(45) Hayamizu, K.; Aihara, Y. Lithium Ion Diffusion in SolidElectrolyte (Li2S)7(P2S5)3 Measured by Pulsed-gradient Spin-echo 7LiNMR Spectroscopy. Solid State Ionics 2013, 238, 7−14.(46) Perdew, J.; Ruzsinszky, A.; Csonka, G.; Vydrov, O.; Scuseria, G.;Constantin, L.; Zhou, X.; Burke, K. Restoring the Density-gradientExpansion for Exchange in Solids and Surfaces. Phys. Rev. Lett. 2008,100, 136406.(47) Yamasaki, H.; Shirasawa, A.; Nishino, N. DFT and MDSimulations of Li-Ion Pathway in Solid State Sulfide Li7P3S11Electrolyte. 218th ECS Meeting, Meeting Abstract 600; The Electro-chemical Society: Pennington, NJ, USA, 2010.(48) Mori, K.; Enjuji, K.; Murata, S.; Shibata, K.; Kawakita, Y.;Yonemura, M.; Onodera, Y.; Fukunaga, T. Direct Observation of FastLithium-Ion Diffusion in a Superionic Conductor: Li7P3S11 MetastableCrystal. Phys. Rev. Appl. 2015, 4, 054008.(49) Zhu, Y.; He, X.; Mo, Y. Origin of Outstanding Stability in theLithium Solid Electrolyte Materials: Insights from ThermodynamicAnalyses Based on First Principles Calculations. ACS Appl. Mater.Interfaces 2015, 7, 23685−23693.
(50) Takada, K.; Ohta, N.; Zhang, L.; Fukuda, K.; Sakaguchi, I.; Ma,R.; Osada, M.; Sasaki, T. Interfacial Modification for High-powerSolid-state Lithium Batteries. Solid State Ionics 2008, 179, 1333−1337.(51) Takada, K.; Ohta, N.; Zhang, L.; Xu, X.; Hang, B. T.; Ohnishi,T.; Osada, M.; Sasaki, T. Interfacial Phenomena in Solid-state LithiumBattery with Sulfide Solid Electrolyte. Solid State Ionics 2012, 225,594−597.(52) Seino, Y.; Nakagawa, M.; Senga, M.; Higuchi, H.; Takada, K.;Sasaki, T. Analysis of the Structure and Degree of Crystallisation of70Li2S-30P2S5 Glass Ceramic. J. Mater. Chem. A 2015, 3, 2756−2761.(53) Wang, Y.; Richards, W. D.; Ong, S. P.; Miara, L. J.; Kim, J. C.;Mo, Y.; Ceder, G. Design Principles for Solid-state Lithium SuperionicConductors. Nat. Mater. 2015, 14, 1026−1031.(54) Murakami, M.; Shimoda, K.; Shiotani, S.; Mitsui, A.; Ohara, K.;Onodera, Y.; Arai, H.; Uchimoto, Y.; Ogumi, Z. Dynamical Origin ofIonic Conductivity for Li7P3S11 Metastable Crystal as Studied by 6/7 Liand 31 P Solid-State NMR. J. Phys. Chem. C 2015, 119, 24248−24254.
ACS Applied Materials & Interfaces Research Article
DOI: 10.1021/acsami.6b00833ACS Appl. Mater. Interfaces XXXX, XXX, XXX−XXX
K