insights into the microwave instruments onboard the
TRANSCRIPT

Insights into the Microwave Instruments Onboard the Fengyun 3DSatellite: Data Quality and Assimilation in the
Met Office NWP System
Fabien CARMINATI*1, Nigel ATKINSON1, Brett CANDY1, and Qifeng LU2
1Met Office, Exeter EX1 3PB, UK2National Satellite Meteorological Center, China Meteorological Administration, Beijing 100081, China
(Received 15 January 2020; revised 13 May 2020; accepted 28 May 2020)
ABSTRACT
This paper evaluates the microwave instruments onboard the latest Chinese polar-orbiting satellite, Fengyun 3D (FY-3D). Comparing three months of observations from the Microwave Temperature Sounder 2 (MWTS-2), the MicrowaveHumidity Sounder 2 (MWHS-2), and the Microwave Radiation Imager (MWRI) to Met Office short-range forecasts, wecharacterize the instrumental biases, show how those biases have changed with respect to their predecessors onboard FY-3C, and how they compare to the Advanced Technology Microwave Sounder (ATMS) onboard NOAA-20 and the GlobalPrecipitation Measurement Microwave Imager (GMI). The MWTS-2 global bias is much reduced with respect to itspredecessor and compares well to ATMS at equivalent channel frequencies, differing only by 0.36 ± 0.28 K (1σ) onaverage. A suboptimal averaging of raw digital counts is found to cause an increase in striping noise and an ascending—descending bias. MWHS-2 benefits from a new calibration method improving the 183-GHz humidity channels with respectto its predecessor and biases for these channels are within ± 1.9 K to ATMS. MWRI presents the largest improvements,with reduced global bias and standard deviation with respect to FY-3C; although, spurious, seemingly transient, brightnesstemperatures have been detected in the observations at 36.5 GHz (vertical polarization). The strong solar-dependent biasthat affects the instrument on FY-3C has been reduced to less than 0.2 K on average for FY-3D MWRI. Experiments whereradiances from these instruments were assimilated on top of a full global system demonstrated a neutral to positive impacton the forecasts, as well as on the fit to the background of independent instruments.
Key words: microwave remote sensing, numerical weather prediction, data assimilation
Citation: Carminati, F., N. Atkinson, B. Candy, and Q. F. Lu, 2021: Insights into the microwave instruments onboard theFengyun 3D satellite: Data quality and assimilation in the Met Office NWP system. Adv. Atmos. Sci., 38(8), 1379−1396,https://doi.org/10.1007/s00376-020-0010-1.
Article Highlights:
• MWTS-2 global bias is reduced with respect to its predecessor and compares well to the reference U.S. instruments,although it is noisier.
• MWHS-2 benefits from a new calibration improving the 183-GHz channels, with a noise comparable to the referenceU.S. instrument.
• MWRI has reduced global bias and noise with respect to its predecessor, but with spurious transient brightnesstemperatures in one channel.
• Assimilation of FY-3D microwave radiances in the Met Office NWP system has a neutral to positive impact on forecasts.
1. Introduction
Satellite microwave instruments have contributed to theEarth observing system for decades, providing key observa-tions for numerical weather prediction (NWP), re-analyses,and climate data records (e.g., English et al., 2000; Uppala
et al., 2005; Yang et al., 2016a). Arguably of foremost import-ance, the assimilation of temperature and humidity-sensit-ive microwave radiances, and wind-derived information,have continuously driven the quality of weather forecasts atthe Met Office and other NWP centers (Joo et al., 2013; Kazu-mori et al., 2016), leading to improved societal benefits andresilience to extreme weather events (Pielke and Carbone,2002; Bauer et al., 2015).
Since the 1980s, China has developed extensive Earth
* Corresponding author: Fabien CARMINATI
Email: [email protected]
ADVANCES IN ATMOSPHERIC SCIENCES, VOL. 38, AUGUST 2021, 1379–1396 • Original Paper •
© British Crown Copyright 2021, Met Office

observation satellite programs dedicated to meteorology,oceanography, and Earth surface monitoring (Gu and Tong,2015), catching up in a field long dominated by the U.S.and Europe. The Fengyun 3 (FY-3) program is of particularinterest to NWP centers. To date, two research (FY-3A andB) and two operational (FY-3C and D) platforms have beenlaunched, and four more are scheduled in the coming years(Yang et al., 2011). Note that FY-3A ceased operations inMarch 2018. The equator crossing time (ECT) is 1400 ECTon the ascending node for FY-3D, 1015 ECT on the descend-ing node for FY-3C, and 1338 ECT on the ascending nodefor FY-3B.
In this study, we focus on the Microwave TemperatureSounder 2 (MWTS-2) and the Microwave HumiditySounder 2 (MWHS-2) instruments, first introduced as partof the FY-3C payload and continued on FY-3D, as well asthe Microwave Radiation Imager (MWRI) that has beenpart of the payload of all FY-3 platforms to date. Together,these instruments have radiometric capability spanning themicrowave domain from 10 to 183 GHz and provide valu-able information on temperature, humidity and wind.
To date and to the best of our knowledge, only theChina Meteorological Administration (CMA), Météo-France, the European Centre for Medium-Range WeatherForecasts (ECMWF), the Indian National Centre forMedium Range Weather Forecasting, and the Met Officeare operationally using observations from the microwaveinstruments onboard the FY-3 constellation, although othermajor NWP centers are planning to investigate the use ofthose data.
Following the FY-3C power fault in May 2015 and thesubsequent failure of MWTS-2, the instrument has neverbeen used for operational purposes. However, Li and Liu(2016) have reported neutral to slightly positive impacts onanalyses and forecasts from a series of observing systemexperiments in GRAPES (the CMA’s Global and RegionalAssimilation and Prediction System).
Observations from FY-3C MWHS-2 (and its less-advanced predecessor FY-3B MWHS-1) have been assimil-ated in operations at the Met Office and ECMWF since2016 (Chen et al., 2015, 2018; Carminati et al., 2018,Lawrence et al., 2018), noting that at ECMWF, 118 and 183GHz channels are assimilated in the all-sky framework,while only low scattering scenes at 183 GHz are used at theMet Office. The impact was reported to be neutral toslightly positive at both centers. At the Met Office, MWHS-1 and MWHS-2 contributed to the total percentage impacton 24-h forecast error reduction by 0.8% and 1.5%, respect-ively, as of December 2018.
There is no published report of an operational use ofFY-3C MWRI, although observing system experiments car-ried out at the Met Office have demonstrated a reduction ofthe forecast root-mean-square errors (RMSEs) from T+0 toT+144 (6 days) of 0.16% and 0.15% with respect to conven-tional observations and ECMWF analyses, respectively.The assimilation of MWRI observations in the Met Office
operational system started in December 2019.The microwave instruments onboard FY-3D, the latest
platform of the series, launched on 14 November 2017, aretherefore expected to further improve and increase the resili-ence of operational NWP systems. Following a successfulpost-launch test phase, the CMA has since mid-June 2019been distributing observations from FY-3D MWTS-2,MWHS-2 and MWRI via EUMETSAT’s dissemination sys-tem, EUMETCast (https://www.eumetsat.int/website/home/Data/DataDelivery/EUMETCast/index.html, last accessedon March 06, 2020). In line with the international effort toevaluate and optimize the use of data from the FY-3 pro-gram for NWP applications, we have been investigating thedata quality between 15 June and 15 September 2019.
The post-launch data quality characterization of a newinstrument is multifaceted. Diverse complementary meth-ods have been devised to this end, such as comparisons withconventional observations from dedicated field campaignsor permanent sites (Bobak et al, 2005; Macelloni et al.,2006), calibrations against invariant targets (Burgdorf et al.,2016; Yang et al., 2016b, 2018), or inter-satellite cross valida-tion (Zou and Wang, 2011; Moradi et al., 2015; Berg et al.,2016). The strict collocation criteria required by theseapproaches tend, however, to limit the temporal and spatialextent of the sampling (e.g., Cao et al., 2004).
In parallel in the NWP community, it has become com-mon practice to evaluate satellite observations against fore-casts, analyses, and reanalyses. This type of assessment hasfound a growing resonance with the improvement of modelaccuracy (Bauer et al., 2015), which enables the detection ofcalibration errors, radiometer nonlinearity, shifts in channelfrequency, or solar thermal induced biases (Bormann et al.,2013; Saunders et al., 2013; Newman et al., 2020).
The continuous, global and homogeneous representa-tion of atmospheric temperature and humidity fields offeredby NWP models is an advantage for the evaluation of satel-lite observations. The optimal state of the atmosphere is estim-ated by the underlying data assimilation system that uses ashort-range forecast adjusted, under the constraints of themodel physics, by the information derived from millions ofobservations. To diagnose observational datasets, a radiat-ive transfer model is used to simulate top-of-atmospherebrightness temperatures from the NWP model fields at fre-quencies used by satellite instruments. This method,referred to as the forward model, is generally preferred tocomparisons in the model geophysical space that requiresthe computation of satellite retrieval profiles, whose solu-tion can derive from multiple atmospheric states (Rodgers,2000).
Biases and uncertainties present in the model fields, inthe radiative transfer modeling, or caused by scale mis-match, are a limitation to the characterization of biases insatellite observations. Nevertheless, recent work indicatesthat the NWP framework remains suitable for the evalu-ation of instruments whose radiometric uncertainty is of theorder of a few tenths of a Kelvin (Newman et al., 2020). Addi-
1380 INSIGHTS OF THE FY-3D MICROWAVE INSTRUMENTS VOLUME 38
tionally, the use of double differences can alleviate the poten-tial problem of NWP model biases. This approach consistsof indirect comparisons of two sets of observations throughcomparisons with the model, hence cancelling out the effectof biases in the model to only reflect biases in the datasetsthat are being compared.
The assessment proposed in this study is based on thecomparison of FY-3D instruments with short-range fore-casts from the Met Office global model, their FY-3C prede-cessors, the Advanced Technology Microwave Sounder(ATMS) and the Global Precipitation Measurement (GPM)Microwave Imager (GMI).
This paper is structured as follows: section 2 presentsthe instrument characteristics; the data quality is discussedin section 3; section 4 presents the outputs of assimilationexperiments; section 5 concludes the study.
2. Instrument characteristics
MWHS-2 is a 15-channel cross-track radiometer scan-ning a 2660-km swath in 98 steps at ± 53.35° from nadir. Itssounding capability covers the oxygen band at 118 GHzwith a sub-satellite point resolution of 32 km, the watervapor band at 183 GHz with a 16-km resolution, and win-dow parts of the spectrum at 89 and 150 GHz with a 32-kmresolution. The five channels dedicated to the 183-GHzband and sensitive to humidity, cloud and precipitation, aresimilar although not identical to those of ATMS onboardthe NOAA SNPP and NOAA-20 platforms. Unlike other oper-ational spaceborne radiometers, MWHS-2 also provides aunique insight into the 118-GHz oxygen band. While thethree highest peaking channels near the band center act as stra-tospheric temperature sounding channels, the sensitivity tocloud and precipitation—due to absorption, emission and scat-tering from hydrometeors—increases with the distance to
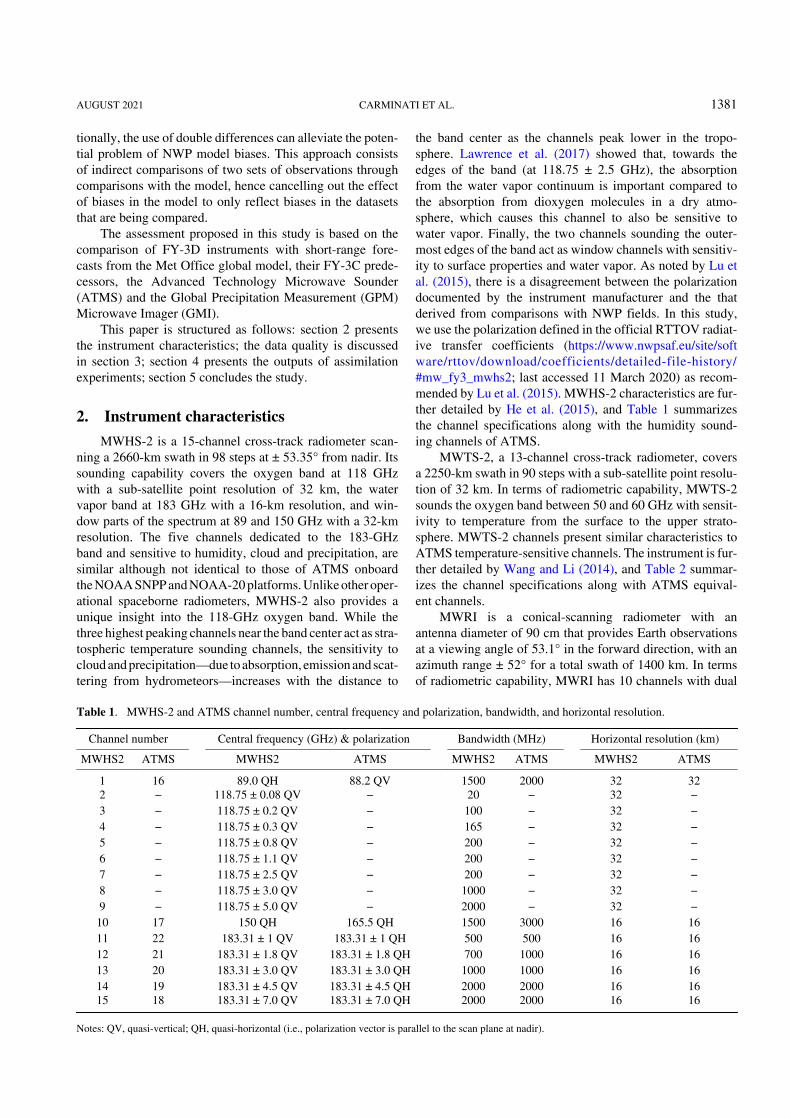
the band center as the channels peak lower in the tropo-sphere. Lawrence et al. (2017) showed that, towards theedges of the band (at 118.75 ± 2.5 GHz), the absorptionfrom the water vapor continuum is important compared tothe absorption from dioxygen molecules in a dry atmo-sphere, which causes this channel to also be sensitive towater vapor. Finally, the two channels sounding the outer-most edges of the band act as window channels with sensitiv-ity to surface properties and water vapor. As noted by Lu etal. (2015), there is a disagreement between the polarizationdocumented by the instrument manufacturer and the thatderived from comparisons with NWP fields. In this study,we use the polarization defined in the official RTTOV radiat-ive transfer coefficients (https://www.nwpsaf.eu/site/software/rttov/download/coefficients/detailed-file-history/#mw_fy3_mwhs2; last accessed 11 March 2020) as recom-mended by Lu et al. (2015). MWHS-2 characteristics are fur-ther detailed by He et al. (2015), and Table 1 summarizesthe channel specifications along with the humidity sound-ing channels of ATMS.
MWTS-2, a 13-channel cross-track radiometer, coversa 2250-km swath in 90 steps with a sub-satellite point resolu-tion of 32 km. In terms of radiometric capability, MWTS-2sounds the oxygen band between 50 and 60 GHz with sensit-ivity to temperature from the surface to the upper strato-sphere. MWTS-2 channels present similar characteristics toATMS temperature-sensitive channels. The instrument is fur-ther detailed by Wang and Li (2014), and Table 2 summar-izes the channel specifications along with ATMS equival-ent channels.
MWRI is a conical-scanning radiometer with anantenna diameter of 90 cm that provides Earth observationsat a viewing angle of 53.1° in the forward direction, with anazimuth range ± 52° for a total swath of 1400 km. In termsof radiometric capability, MWRI has 10 channels with dual
Table 1. MWHS-2 and ATMS channel number, central frequency and polarization, bandwidth, and horizontal resolution.
Channel number Central frequency (GHz) & polarization Bandwidth (MHz) Horizontal resolution (km)
MWHS2 ATMS MWHS2 ATMS MWHS2 ATMS MWHS2 ATMS
1 16 89.0 QH 88.2 QV 1500 2000 32 322 − 118.75 ± 0.08 QV − 20 − 32 −3 − 118.75 ± 0.2 QV − 100 − 32 −4 − 118.75 ± 0.3 QV − 165 − 32 −5 − 118.75 ± 0.8 QV − 200 − 32 −6 − 118.75 ± 1.1 QV − 200 − 32 −7 − 118.75 ± 2.5 QV − 200 − 32 −8 − 118.75 ± 3.0 QV − 1000 − 32 −9 − 118.75 ± 5.0 QV − 2000 − 32 −10 17 150 QH 165.5 QH 1500 3000 16 1611 22 183.31 ± 1 QV 183.31 ± 1 QH 500 500 16 1612 21 183.31 ± 1.8 QV 183.31 ± 1.8 QH 700 1000 16 1613 20 183.31 ± 3.0 QV 183.31 ± 3.0 QH 1000 1000 16 1614 19 183.31 ± 4.5 QV 183.31 ± 4.5 QH 2000 2000 16 1615 18 183.31 ± 7.0 QV 183.31 ± 7.0 QH 2000 2000 16 16
Notes: QV, quasi-vertical; QH, quasi-horizontal (i.e., polarization vector is parallel to the scan plane at nadir).
AUGUST 2021 CARMINATI ET AL. 1381

polarization at 10.65, 18.7, 23.8, 36.5 and 89.0 GHz. The spa-tial resolution ranges from 9 to 85 km, increasing with thedecrease in frequency. The instrument is sensitive to sur-face thermal microwave emission and provides informationon total column water vapor, cloud and precipitation, sur-face temperature, and surface wind over the ocean. MWRIbenefits from an end-to-end three-point calibration systeminvolving three reflectors: a main reflector used for theEarth, cold and warm views, and two independent reflect-ors used for the cold and warm targets exclusively. This sys-tem allows for the emission contamination from the sun-heated main reflector in the onboard calibration to be accoun-ted for. MWRI characteristics, calibration system, and on-orbit performances are further discussed by Yang et al.(2011), noting that the authors address on-orbit perform-ance of the instrument on FY-3A. MWRI shares frequen-cies with other imagers, including GMP GMI, a state-of-the-art conical-scanning radiometer, which, according toNASA, has achieved the highest standards of radiometric cal-
ibration and stability to date. Note that because the orbit pat-tern and antenna size (1.2 m) are different, GMI ground resol-ution [see, for example, Newell et al. (2014)] differs fromMWRI. Table 3 summarizes MWRI and GMI channel spe-cifications.
3. Assessment
Upon receipt, the data are pre-processed with theATOVS and AVHRR Preprocessing Package (https://nwpsaf.eu/site/software/aapp/; last accessed 6 March 2020), conver-ted to BUFR format, and stored in the Met Office observa-tional database ready for use in the system. The pre-pro-cessing of MWHS-2 and MWTS-2 is a two-step process, sim-ilar to what was initially set up for FY-3C. First, each threeadjacent scan positions are averaged to avoid oversampling.Second, MWHS-2 is mapped to MWTS-2 observations witha median filter in brightness temperature that is applied toany MWHS-2 spots within 1.25° (in viewing angle) of each
Table 2. As in Table 1 but for MWTS-2.
Channel number Central frequency (GHz) & polarization Bandwidth (MHz)Horizontal resolution
(km)
MWTS2 ATMS MWTS2 ATMS MWTS2 ATMS MWTS2 ATMS
1 3 50.30 QH 50.30 QH 180 180 32 322 4 51.76 QH 51.76 QH 400 400 32 323 5 52.80 QH 52.80 QH 400 400 32 324 6 53.596 ± 0.115 QH 53.596 ± 0.115 QH 400 170 32 325 7 54.40 QH 54.40 QH 400 400 32 326 8 54.94 QH 54.94 QH 400 400 32 327 9 55.50 QH 55.50 QH 330 330 32 328 10 57.29 QH 57.29 QH 330 155 32 329 11 57.29 ± 0.217 QH 57.29 ± 0.217 QH 78 78 32 3210 12 57.29 ± 0.3222 ± 0.048 QH 57.29 ± 0.3222 ± 0.048 QH 36 36 32 3211 13 57.29 ± 0.3222 ± 0.022 QH 57.29 ± 0.3222 ± 0.022 QH 16 16 32 3212 14 57.29 ± 0.3222 ± 0.010 QH 57.29 ± 0.3222 ± 0.010 QH 8 8 32 32
13 15 57.29 ± 0.3222 ± 0.0045QH
57.29 ± 0.3222 ± 0.0045QH 3 3 32 32
Table 3. MWRI and GMI channel numbers, central frequency and polarization, bandwidth, and instantaneous field of view (IFOV).
Channel number Central frequency (GHz) & polarization Bandwidth (MHz) IFOV(km)
MWRI GMI MWRI GMI MWRI GMI MWRI GMI
1 1 10.65 V 10.65 V 180 96.5 51 × 85 19 × 322 2 10.65 H 10.65 H 180 94.7 51 × 85 19 × 323 3 18.7 V 18.7 V 200 193 30 × 50 11 × 184 4 18.7 H 18.7 H 200 194 30 × 50 11 × 185 5 23.8 V 23.8 V 400 367 27 × 45 10 × 166 − 23.8 H − 400 − 27 × 45 −7 6 36.5 V 36.5 V 400 697 18 × 30 9 × 158 7 36.5 H 36.5 H 400 707 18 × 30 9 × 159 8 89.0 V 89.0 V 3000 5470 9 × 15 4 × 710 9 89.0 H 89.0 H 3000 5516 9 × 15 4 × 7
Notes: V, vertical; H, horizontal.
1382 INSIGHTS OF THE FY-3D MICROWAVE INSTRUMENTS VOLUME 38

MWTS-2 spot. For MWRI, it was observed that the instru-ment on FY-3D has 266 fields of view (FOVs) (comparedto 254 on FY-3C), and it was decided to discard the firstand last six FOVs and proceed with the existing thinningalready in place for FY-3C that takes every second spotacross the track. This aims to avoid over sampling
To collocate observations and model fields, and qual-ity control the data, FY-3D data have been processed in aclear-sky passive offline mode of the Met Office Observa-tion Processing System (OPS). In operations, OPS runs anN1280L70 resolution (about a 10-km grid length in midlatit-udes and 70 levels with the model top at 80 km) one-dimen-sional variational analysis (1D-Var). 1D-Var is used for qual-ity control, to thin the observations, and to derive physicalparameters for the subsequent main 4D variational assimila-tion. The background used for the comparison and the 1D-Var retrieval is the short-range forecast from the previousassimilation cycle, interpolated at the observation locationand time. The fast radiative transfer model RTTOV version12 (Saunders et al., 2018) is used to map model variables inthe observation spectral domain. Surface emissivity is calcu-lated using FASTEM 6 (Kazumori and English, 2015) overoceans and a fixed value is used over land (https://www.nwpsaf.eu/site/software/rttov/download/#Emissivity_BRDF_atlas_data; last accessed 6 March 2020). The main assimila-tion system is a hybrid 4-dimensional variational analysis(4D-Var) with a six-hour time window and backgrounderror information provided by a global ensemble (Lorenc etal., 2000; Rawlins et al., 2007).
Because FY-3D data are used passively (i.e., they arenot assimilated in 4D-Var), the background used for the com-parison is therefore independent from the observations. Onthe contrary, ATMS, FY-3C MWHS-2 and GMI are act-ively assimilated into the system, resulting in analyses andsubsequent forecasts constrained by the value of their observa-tions (depending on the weight given to the observationserrors). Consequently, the difference between observationsand the model background should be slightly lower for theassimilated instruments than the difference between observa-tions from FY-3D and the model background.
In addition to background departure analyses (i.e., theobservation-minus-background difference; hereafter, O-B),we investigate the double difference with instruments of equi-valent radiometric capability. FY-3D MWTS-2 andMWHS-2 are compared to NOAA-20 ATMS equivalent chan-nels and FY-3C MWHS-2 (FY-3C MWTS-2 data are notavailable over the period of study). FY-3D MWRI is com-pared to GPM GMI equivalent channels and FY-3C MWRI.
For this assessment, data are analyzed before bias correc-tion. OPS standard quality controls are applied to all observa-tions and consist of a gross error check on the observation loc-ation and the background, a convergence check, a radiativetransfer error check, and a check on retrieved brightness tem-perature. Note that in operation, checks on observation bright-ness temperature and background departure are also conduc-ted but are excluded from this analysis in order to evaluate
the entire range of observations (and not only the “goodones”).
Two cloud tests are applied to MWTS-2 and MWHS-2.First, a maximum likelihood method, described by Englishet al. (1999), combines the first iteration of the 1D-Varbased on observations at 183 ± 7, 183 ± 3 and 183 ± 1 GHzand an imposed threshold on the magnitude of the back-ground departure at 183 ± 7 GHz. Second, a scattering testis based on the difference in brightness temperature at 89and 150 GHz, and an index calculated as a function of thesatellite zenith angle as described by Bennartz et al. (2002).For MWRI, a threshold imposed on the liquid water pathretrieved in 1D-Var is set to 10 g m−2 and all observationswith O-B greater than 4.3 K at 36.6 GHz (H) are marked ascloudy. Additionally, strongly scattering scenes are flaggedand removed based on the anomaly (departure from themean O-B) difference between 37 and 89 GHz.
ATMS benefits from the same cloud tests as the blockMWTS-2 + MWHS-2. GMI benefits from the same tests asMWRI but also has an additional quality control based onthe quality flag provided by NASA (this includes, forexample, observations contaminated by radio frequency inter-ference).
The observations used in this assessment are con-sidered over ocean only, between 15 June and 15 Septem-ber 2019. The results are discussed below.
3.1. MWTS-2
Figure 1a shows the mean O-B and standard deviationof O-B calculated for FY-3D MWTS-2 and ATMS at equival-ent channel frequencies. The MWTS-2 mean bias rangesfrom −1.32 to 0.6 K. It is worth noting that those values areup to an order of magnitude smaller than the mean biasfound for the instrument on FY-3C as evaluated by Lu et al.(2015). The FY-3D MWTS-2 and ATMS instruments havea consistent bias both in sign and magnitude across most chan-nels, with an average difference of 0.36 ± 0.28 K (1σ),except at 54.40 GHz (channel 5) where the MWTS-2 biasreaches −1.32 K compared to −0.30 K for ATMS. The FY-3D MWTS-2 standard deviation of O-B varies from 2.9 to0.36 K and is larger than the ATMS standard deviation by0.36 K on average. For both instruments the standard devi-ation is large at frequencies sensitive to the surface andupper stratosphere, and low in the mid-troposphere andlower stratosphere.
The large standard deviation in the low-peaking andupper-stratospheric channels (channels 1–3 and 11–13,respectively) mostly results from a combination of model-driven biases that affect both instruments in a similar way.For surface-sensitive channels, the sea surface emissivitymodel used in the forward model for microwave frequen-cies, FASTEM, is known to suffer from systematic errors atlow skin temperature (less than 275 K) and strong surfacewind [see, for example, Carminati et al. (2017)]. The periodof study spans austral winter (June–September), when lowtemperatures and strong winds become more frequent in theSouthern Ocean, and where large positive biases have been
AUGUST 2021 CARMINATI ET AL. 1383

detected in MWTS-2 and ATMS background departures(not shown) for these channels. Additionally, contamina-tion from undetected residual cloud is more likely to affectthese low-peaking channels and further increase the stand-ard deviation. The increase in the standard deviation in theupper-stratospheric channels can be traced to geographic-ally localized biases in the NWP model. These biases havebeen attributed to deficiencies in the parameterization of grav-ity waves breaking down in the stratosphere (private commu-nication with Ed Pavelin, Met Office).
Channel 5, on the other hand, shows a clear distinctionbetween MWTS-2 and ATMS, both in term of bias and stand-ard deviation, suggesting an instrument-related problem.This channel is affected by a large 1.96-K edge-to-edgescan bias. Bias variations along the scan line greater than1 K, associated in some instances with complex patterns,are visible in channels 1–6 and 13, and to a lesser extent inchannels 7–12, as shown in Fig. 2a. Note that in Fig. 3, scanpositions range from 1 to 30 because of the pre-processingstep that averages one in three scan positions. Scan-depend-ent biases have been previously reported for the MWTS-2instrument onboard FY-3C (Lu et al., 2015; Li et al., 2016;Tian et al., 2018). As suggested by Lu et al. (2015), a contam-ination of the antenna by the cold target could lead to lower-than-normal observed Earth temperature and subsequentcold bias in the O-B. This hypothesis is consistent with thenegative O-B strengthening from scan position 1 to 22observed in channels 1–8 in Fig. 2. For some channels, thebias stabilizes over the last six scan positions, possibly dueto the antenna pattern correction. Although the root of theproblem will have to be addressed through a revisedantenna correction in the calibration system, bias correc-tions in place at the Met Office, ECMWF, or CMA have
been shown to efficiently remove the most detrimentaleffects (Lu et al., 2015; Li et al., 2016).
In their assessment of FY-3C MWTS-2, Lu et al.(2015) also highlighted a dependence of the bias on scenetemperature. This happens when the observed temperaturedeviates from the linear assumption used for the interpola-tion of digital counts from cold to warm targets. This effectis generally removed by applying a nonlinearity correctionin the calibration. In some instances, however, the correc-tion is not optimized, as shown by Atkinson et al. (2015) forFY-3C MWTS-2. In order to investigate if such a depend-ency can be found in the FY-3D MWTS-2 dataset, we ana-lyzed the O-B as a function of the background scene temperat-ure calculating the slope and correlation of a linear least-squares regression along with those of ATMS for compar-ison. The results are reported in Table 4. Note that surface-sensitive channels are omitted from this analysis in order toavoid model-driven biases related to surface emissivitybeing entangled with instrument biases. MWTS-2 channels5 (54.40 GHz), 13 (57.29 ± 0.322 ± 0.0045 GHz), and 6(54.94 GHz) are the channels that present the largest back-ground departure gradients (−0.047, −0.032 and −0.026 KK−1, respectively). These are of the same order as reportedby Lu et al. (2015) for FY-3C MWTS-2 and compare wellwith ATMS, although ATMS low-peaking channels tend tobe less impacted than the high-peaking ones.
Additionally, Lu et al. (2015) detected a land–sea con-trast in some FY-3C MWTS-2 upper-atmosphere channels.The problem was suspected to be caused by inter-channelinterferences, but this has not been seen in the FY-3D data-set.
Biases along the satellite orbit [as described by Bootonet al. (2014)] are also investigated. Figure 3a shows the back-
Fig. 1. (a) Mean background departure (O-B) and standard deviation of O-B for FY-3D MWTS-2 (blue) and NOAA-20 ATMS (red) low-scattering oceanic scenes averaged between 15 June and 15 September 2019. Solid lines showthe mean and dashed lines the standard deviation. (b) As in (a) but for FY-3D MWHS-2 (blue), FY-3C MWHS-2(green), and NOAA-20 ATMS (red).
1384 INSIGHTS OF THE FY-3D MICROWAVE INSTRUMENTS VOLUME 38

ground departures from the ascending node, when the satel-lite sees the daytime side of Earth, compared to those of thenighttime descending node. O-B values in the descendingnode are lower than in the ascending node. This differenceis larger than 0.1 K in the low (1–4) and high (11–13) peak-
ing channels and largest for channels 13 where the differ-ence reaches −0.9 K. This bias is likely related to a calibra-tion issue, discussed further below.
A cross-track disturbance, known as striping noise, hasbeen detected and contributes to the instrument noise. Strip-
Fig. 2. (a) FY-3D MWTS-2 mean background departure as a function of the scan position for low-scattering oceanicscenes averaged over August 2019. (b) As in (a) but for FY-3D MWHS-2.
Fig. 3. (a) FY-3D MWTS-2 mean background departure from the ascending node (filled circles) and descendingnode (open circles) for low-scattering oceanic scenes averaged over August 2019. The gray line shows thedifference, i.e., O-B ascending minus O-B descending. (b) As in (a) but for FY-3D MWHS-2. (c) As in (a) but forFY-3D MWRI.
Table 4. Slope, intercept, and correlation coefficient from a linear least-squares regression between the background scene temperatureand FY-3D MWTS-2 O-B for low-scattering oceanic scenes in August 2019. The statistics are also shown for NOAA-20 ATMS.
Frequency (GHz)
Slope (K K−1) Intercept (K) r-value
MWTS-2¦3D ATMS MWTS-2¦3D ATMS MWTS-2¦3D ATMS
54.40 −0.047 0.003 9.73 −1.08 −0.40 0.1254.94 −0.026 0.000 4.59 −0.64 −0.34 −0.0255.50 0.001 0.011 −1.30 −3.32 0.01 0.3157.29 0.006 0.009 −2.05 −2.59 0.12 0.32
57.29 ± 0.217 0.012 0.009 −3.56 −2.64 0.20 0.2657.29 ± 0.322 ± 0.048 0.001 −0.002 −0.72 −0.17 0.01 −0.0557.29 ± 0.322 ± 0.022 −0.014 −0.016 3.54 3.26 −0.15 −0.2657.29 ± 0.322 ± 0.01 −0.017 −0.024 4.51 5.94 −0.12 −0.27
57.29 ± 0.322 ± 0.0045 −0.032 −0.040 7.81 10.08 −0.14 −0.27
AUGUST 2021 CARMINATI ET AL. 1385
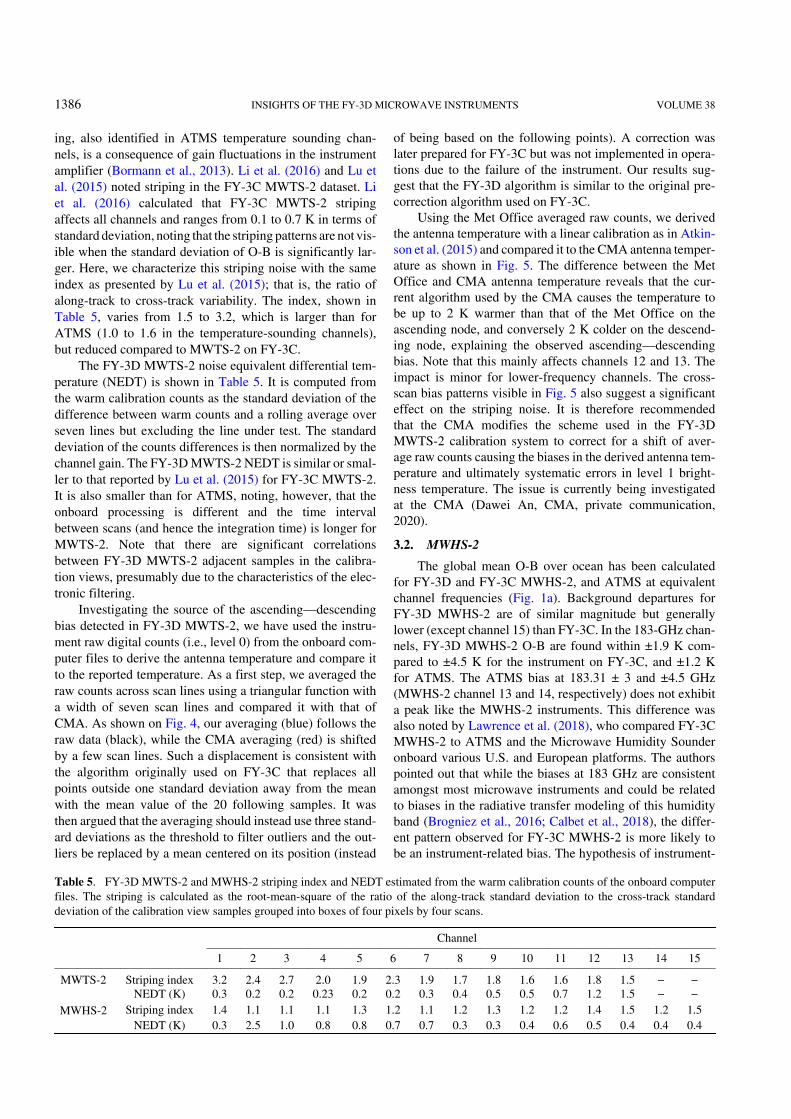
ing, also identified in ATMS temperature sounding chan-nels, is a consequence of gain fluctuations in the instrumentamplifier (Bormann et al., 2013). Li et al. (2016) and Lu etal. (2015) noted striping in the FY-3C MWTS-2 dataset. Liet al. (2016) calculated that FY-3C MWTS-2 stripingaffects all channels and ranges from 0.1 to 0.7 K in terms ofstandard deviation, noting that the striping patterns are not vis-ible when the standard deviation of O-B is significantly lar-ger. Here, we characterize this striping noise with the sameindex as presented by Lu et al. (2015); that is, the ratio ofalong-track to cross-track variability. The index, shown inTable 5, varies from 1.5 to 3.2, which is larger than forATMS (1.0 to 1.6 in the temperature-sounding channels),but reduced compared to MWTS-2 on FY-3C.
The FY-3D MWTS-2 noise equivalent differential tem-perature (NEDT) is shown in Table 5. It is computed fromthe warm calibration counts as the standard deviation of thedifference between warm counts and a rolling average overseven lines but excluding the line under test. The standarddeviation of the counts differences is then normalized by thechannel gain. The FY-3D MWTS-2 NEDT is similar or smal-ler to that reported by Lu et al. (2015) for FY-3C MWTS-2.It is also smaller than for ATMS, noting, however, that theonboard processing is different and the time intervalbetween scans (and hence the integration time) is longer forMWTS-2. Note that there are significant correlationsbetween FY-3D MWTS-2 adjacent samples in the calibra-tion views, presumably due to the characteristics of the elec-tronic filtering.
Investigating the source of the ascending—descendingbias detected in FY-3D MWTS-2, we have used the instru-ment raw digital counts (i.e., level 0) from the onboard com-puter files to derive the antenna temperature and compare itto the reported temperature. As a first step, we averaged theraw counts across scan lines using a triangular function witha width of seven scan lines and compared it with that ofCMA. As shown on Fig. 4, our averaging (blue) follows theraw data (black), while the CMA averaging (red) is shiftedby a few scan lines. Such a displacement is consistent withthe algorithm originally used on FY-3C that replaces allpoints outside one standard deviation away from the meanwith the mean value of the 20 following samples. It wasthen argued that the averaging should instead use three stand-ard deviations as the threshold to filter outliers and the out-liers be replaced by a mean centered on its position (instead
of being based on the following points). A correction waslater prepared for FY-3C but was not implemented in opera-tions due to the failure of the instrument. Our results sug-gest that the FY-3D algorithm is similar to the original pre-correction algorithm used on FY-3C.
Using the Met Office averaged raw counts, we derivedthe antenna temperature with a linear calibration as in Atkin-son et al. (2015) and compared it to the CMA antenna temper-ature as shown in Fig. 5. The difference between the MetOffice and CMA antenna temperature reveals that the cur-rent algorithm used by the CMA causes the temperature tobe up to 2 K warmer than that of the Met Office on theascending node, and conversely 2 K colder on the descend-ing node, explaining the observed ascending—descendingbias. Note that this mainly affects channels 12 and 13. Theimpact is minor for lower-frequency channels. The cross-scan bias patterns visible in Fig. 5 also suggest a significanteffect on the striping noise. It is therefore recommendedthat the CMA modifies the scheme used in the FY-3DMWTS-2 calibration system to correct for a shift of aver-age raw counts causing the biases in the derived antenna tem-perature and ultimately systematic errors in level 1 bright-ness temperature. The issue is currently being investigatedat the CMA (Dawei An, CMA, private communication,2020).
3.2. MWHS-2
The global mean O-B over ocean has been calculatedfor FY-3D and FY-3C MWHS-2, and ATMS at equivalentchannel frequencies (Fig. 1a). Background departures forFY-3D MWHS-2 are of similar magnitude but generallylower (except channel 15) than FY-3C. In the 183-GHz chan-nels, FY-3D MWHS-2 O-B are found within ±1.9 K com-pared to ±4.5 K for the instrument on FY-3C, and ±1.2 Kfor ATMS. The ATMS bias at 183.31 ± 3 and ±4.5 GHz(MWHS-2 channel 13 and 14, respectively) does not exhibita peak like the MWHS-2 instruments. This difference wasalso noted by Lawrence et al. (2018), who compared FY-3CMWHS-2 to ATMS and the Microwave Humidity Sounderonboard various U.S. and European platforms. The authorspointed out that while the biases at 183 GHz are consistentamongst most microwave instruments and could be relatedto biases in the radiative transfer modeling of this humidityband (Brogniez et al., 2016; Calbet et al., 2018), the differ-ent pattern observed for FY-3C MWHS-2 is more likely tobe an instrument-related bias. The hypothesis of instrument-
Table 5. FY-3D MWTS-2 and MWHS-2 striping index and NEDT estimated from the warm calibration counts of the onboard computerfiles. The striping is calculated as the root-mean-square of the ratio of the along-track standard deviation to the cross-track standarddeviation of the calibration view samples grouped into boxes of four pixels by four scans.
Channel
1 2 3 4 5 6 7 8 9 10 11 12 13 14 15
MWTS-2 Striping index 3.2 2.4 2.7 2.0 1.9 2.3 1.9 1.7 1.8 1.6 1.6 1.8 1.5 − −NEDT (K) 0.3 0.2 0.2 0.23 0.2 0.2 0.3 0.4 0.5 0.5 0.7 1.2 1.5 − −
MWHS-2 Striping index 1.4 1.1 1.1 1.1 1.3 1.2 1.1 1.2 1.3 1.2 1.2 1.4 1.5 1.2 1.5NEDT (K) 0.3 2.5 1.0 0.8 0.8 0.7 0.7 0.3 0.3 0.4 0.6 0.5 0.4 0.4 0.4
1386 INSIGHTS OF THE FY-3D MICROWAVE INSTRUMENTS VOLUME 38

related bias is further supported by the similar bias found onFY-3D MWHS-2, which has the same design and characterist-ics as its predecessor. The shift in O-B between the twoMWHS-2 instruments could be due to their different pre-launch calibration setup, including the correction of biasesfrom the warm and cold targets, the derivation of coeffi-cients for the nonlinearity correction, and the correction forchannels breaking the monochromatic assumption, whichhave been derived using a new thermal vacuum test facilityas described by Wang et al. (2019). The authors found thatFY-3D MWHS-2 channel 14 is affected by a radiation leak-age originating from the receiver used for the high-fre-quency channels (150 and 183 GHz). The antenna-leaked radi-ation bounced back from the device surroundings unlesscovered with a black body absorber. They concluded thatthis should not impact operational performances since thereare no such surroundings in space. However, both Lawrenceet al. (2017, 2018) and Carminati et al. (2018) noted thatFY-3C MWHS-2 channels 13 and 14 have been experien-cing large bias shifts and drifts that are strongly correlatedwith the temperature of the instrument’s environment. Theimplications of this are that the susceptibility of those chan-nels sensitive to temperature changes may be related to theleakage highlighted by Wang et al. (2019) through contamina-tion by the radiation directly emitted by the platform, or bythe antenna’s emission interacting with the body of the plat-
form, or a combination of both.In the 118-GHz channels, the findings are similar. The
FY-3D MWHS-2 bias decreases relatively smoothly, fromhigh- to low-peaking channels, to become positive in thelowermost surface-sensitive channel (channel 9). Althoughthis reduction of bias with the decrease in the height of sensit-ivity is also visible for FY-3C MWHS-2, the channel-to-chan-nel variation is more erratic.
The standard deviation of O-B for FY-3D MWHS-2 var-ies from 0.4 to 1.6 K (ignoring window channels 1, 9 and10). It is comparable to that of FY-3C at most channels andsignificantly smaller (0.48 K smaller) at channel 14. It isalso comparable to that of ATMS at 183 GHz but larger inthe window channels (noting that the frequency is notexactly the same between the two instruments). Apart fromthe window channels, the standard deviation in this ana-lysis is smaller than that reported by Guo et al. (2019).
The variation of O-B with the scan position is also ana-lyzed for FY-3D MWHS-2 (Fig. 2a). Window channels 1and 10 (89 and 150 GHz, respectively) present the distinct-ive double maxima towards the edge of the scan with up to3.1 K peak-to-peak amplitude, somewhat similar in shape tothose of MWTS-2 window channel 1 and 2 (50.3 and 51.76GHz, respectively). Interestingly, the 118-GHz surface-sensit-ive channels (channels 8 and 9) do not present such a pat-tern, which seems to only affect channels with a quasi-hori-zontal polarization. Channels 11, 12, 13 and 15 have a max-imum on the left edge of the scan (position 1); channels 5, 6and 8 have a minimum on the right edge (position 30); andchannel 7 has both features with an edge-to-edge differenceof 2.2 K.
Li et al. (2016) also analyzed FY-3C MWHS-2 strip-ing noise and showed that it affects all channels with a stand-ard deviation of up to 0.8 K. Our estimation of the stripingindex ranges from 1.1 to 1.5. The NEDT varies from 0.3 to2.5 K. This is larger than that reported by Guo et al. (2019)for channels 2–7, and similar elsewhere. The striping indexand the NEDT are summarized in Table 5.
Investigating the difference between ascending and des-cending nodes (Fig. 3b), we found that both nodes are veryconsistent with each other, with an average difference of
Fig. 4. Average warm calibration counts of MWTS-2 FY-3Dchannel 4. Raw data are shown in black, CMA averaging inred, and Met Office averaging in blue.
Fig. 5. FY-3D MWTS-2 Met Office-derived minus original antenna temperature (channel 13).
AUGUST 2021 CARMINATI ET AL. 1387
0.01 K.Linear regressions of the O-B as a function of the scene
temperature were calculated for FY-3D MWHS-2 channels2–6 and 11–15, and the slopes, intercepts and correlation coef-ficients are shown in Table 6 along with those of FY-3CMWHS-2 and ATMS (at equivalent frequencies). Back-ground departure gradients are similar between the twoMWHS-2 instruments in the 118-GHz channels. The mostsensitive channel to scene temperature is 118.75 ± 0.08GHz, with slopes of 0.029 and 0.037 K K−1 (correlation of0.20 and 0.22) for FY-3D and FY-3C MWHS-2, respect-ively. Interestingly, those results are of the same order asfor the temperature channels sounding the 54–57-GHz oxy-gen band on MWTS-2 (see Table 4). In the 183-GHz chan-nels, O-B gradients for the ATMS and MWHS-2 instru-ments are similar. We note a significant reduction of thescene temperature dependence at 183 ± 4.5 GHz from FY-3C to FY-3D, with the gradient decreasing from 0.062 to−0.017 K K−1 and the correlation from 0.34 to −0.14.
3.3. MWRI
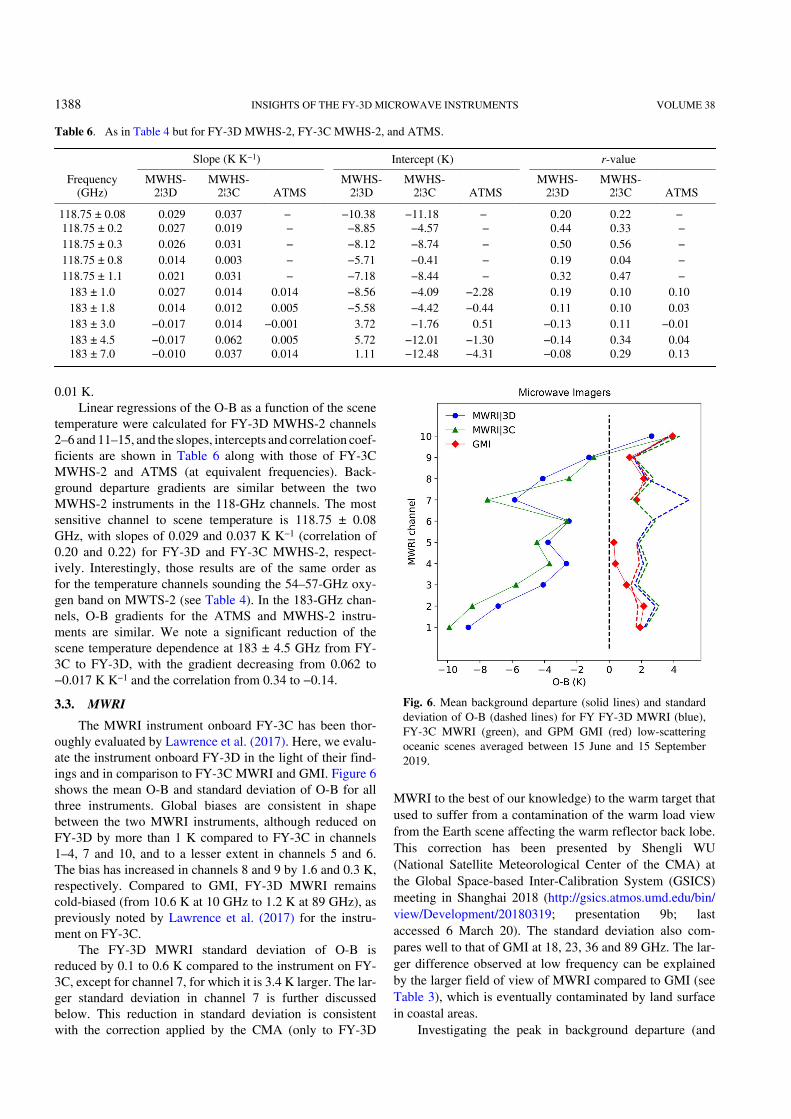
The MWRI instrument onboard FY-3C has been thor-oughly evaluated by Lawrence et al. (2017). Here, we evalu-ate the instrument onboard FY-3D in the light of their find-ings and in comparison to FY-3C MWRI and GMI. Figure 6shows the mean O-B and standard deviation of O-B for allthree instruments. Global biases are consistent in shapebetween the two MWRI instruments, although reduced onFY-3D by more than 1 K compared to FY-3C in channels1–4, 7 and 10, and to a lesser extent in channels 5 and 6.The bias has increased in channels 8 and 9 by 1.6 and 0.3 K,respectively. Compared to GMI, FY-3D MWRI remainscold-biased (from 10.6 K at 10 GHz to 1.2 K at 89 GHz), aspreviously noted by Lawrence et al. (2017) for the instru-ment on FY-3C.
The FY-3D MWRI standard deviation of O-B isreduced by 0.1 to 0.6 K compared to the instrument on FY-3C, except for channel 7, for which it is 3.4 K larger. The lar-ger standard deviation in channel 7 is further discussedbelow. This reduction in standard deviation is consistentwith the correction applied by the CMA (only to FY-3D
MWRI to the best of our knowledge) to the warm target thatused to suffer from a contamination of the warm load viewfrom the Earth scene affecting the warm reflector back lobe.This correction has been presented by Shengli WU(National Satellite Meteorological Center of the CMA) atthe Global Space-based Inter-Calibration System (GSICS)meeting in Shanghai 2018 (http://gsics.atmos.umd.edu/bin/view/Development/20180319; presentation 9b; lastaccessed 6 March 20). The standard deviation also com-pares well to that of GMI at 18, 23, 36 and 89 GHz. The lar-ger difference observed at low frequency can be explainedby the larger field of view of MWRI compared to GMI (seeTable 3), which is eventually contaminated by land surfacein coastal areas.
Investigating the peak in background departure (and
Fig. 6. Mean background departure (solid lines) and standarddeviation of O-B (dashed lines) for FY FY-3D MWRI (blue),FY-3C MWRI (green), and GPM GMI (red) low-scatteringoceanic scenes averaged between 15 June and 15 September2019.
Table 6. As in Table 4 but for FY-3D MWHS-2, FY-3C MWHS-2, and ATMS.
Frequency(GHz)
Slope (K K−1) Intercept (K) r-value
MWHS-2¦3D
MWHS-2¦3C ATMS
MWHS-2¦3D
MWHS-2¦3C ATMS
MWHS-2¦3D
MWHS-2¦3C ATMS
118.75 ± 0.08 0.029 0.037 − −10.38 −11.18 − 0.20 0.22 −118.75 ± 0.2 0.027 0.019 − −8.85 −4.57 − 0.44 0.33 −118.75 ± 0.3 0.026 0.031 − −8.12 −8.74 − 0.50 0.56 −118.75 ± 0.8 0.014 0.003 − −5.71 −0.41 − 0.19 0.04 −118.75 ± 1.1 0.021 0.031 − −7.18 −8.44 − 0.32 0.47 −
183 ± 1.0 0.027 0.014 0.014 −8.56 −4.09 −2.28 0.19 0.10 0.10183 ± 1.8 0.014 0.012 0.005 −5.58 −4.42 −0.44 0.11 0.10 0.03183 ± 3.0 −0.017 0.014 −0.001 3.72 −1.76 0.51 −0.13 0.11 −0.01183 ± 4.5 −0.017 0.062 0.005 5.72 −12.01 −1.30 −0.14 0.34 0.04183 ± 7.0 −0.010 0.037 0.014 1.11 −12.48 −4.31 −0.08 0.29 0.13
1388 INSIGHTS OF THE FY-3D MICROWAVE INSTRUMENTS VOLUME 38

standard deviation) affecting channel 7, we have noted anom-alies in the observations affecting small sections of the instru-ment swath between 13 July and 10 August 2019. Figure 7illustrates an example of anomalously large brightness temper-ature affecting the MWRI swath north of Madagascar on 25July 2019. Around 12°S, the observed brightness temperat-ure suddenly shifts from ~220 K (over ocean) to more than280 K, regardless of the surface (land or ocean) across allscan lines before returning to normal at around 6°N. Thisevent was not flagged in MWRI raw data distributed by theCMA (i.e., neither in QA_Ch_Flag nor QA_Scan_Flag).The origin of the problem remains unexplained to date.
The foremost issue with FY-3C MWRI, as highlightedby Lawrence et al. (2017), is a strong solar-dependent biasleading to differences between the ascending and descend-ing nodes as large as 2 K and consistent across all channels.Such a bias, previously detected in legacy imagers (Bell etal., 2008; Geer et al., 2010), results from thermal emissionsfrom sun-heated element(s) of the instrument (usually themain antenna) contaminating the received signal and unac-counted for in the calibration. The three-point calibration ofMWRI, however, compensates for any contamination fromthe main receiver, leading Lawrence et al. (2017) to sug-gest that the reflectors dedicated to the warm and cold tar-gets (whose emissions are unaccounted for in the calibra-tion) may contribute significantly to the ascending—descend-ing bias. Because such a bias is complex to understand andall the more difficult to correct in the context of NWP sys-tems, MWRI observations have not been used in data assimil-ation systems, except at the CMA and the Met Office (seenext section).
For FY-3D MWRI, Xie et al. (2018) developed a phys-
ical-based bias correction linking the observed brightness tem-perature to the temperature of the hot load reflector. Accord-ing to the authors, the post-correction ascending/descend-ing bias is reduced to less than 0.2 K. Figure 3c shows consist-ent results, with an ascending-minus-descending bias vary-ing from −0.36 to 0.08 K (−0.17 K on average).
The successful removal of the solar-dependent bias ofMWRI on FY-3D will have a significant impact for thefuture use of the instrument in NWP centers because theywill be able to assimilate its observations without having toimplement complex bias corrections. It must be noted,however, that another feature highlighted by Lawrence et al.(2017) was the drift in time of the FY-3C MWRI globalbias (up to 2 K in four years) in parallel with the increase inamplitude of the solar-dependent bias, the latter potentiallythe cause of the former. Because the reflector emissivity cor-rection applied by the CMA is a one-time change, it will beimportant to closely monitor the bias of MWRI over timeand apply an updated correction if a degradation is detected.
Finally, we note that both Zou at al. (2012) andLawrence et al. (2017) reported radio frequency interfer-ences (RFIs) affecting MWRI onboard FY-3B and FY-3C.Shengli WU (CMA) has communicated (https://digitalcom-mons.usu.edu/calcon/CALCON2019/all2019content/7/; lastaccessed 6 March 2020) that, for FY-3D MWRI, RFIaffects both the 10- and 18-GHz channels and that the CMAis working on a correction algorithm.
4. Assimilation in the Met Office NWPsystem
Assimilation experiments have been conducted over theperiod 15 June to 15 September 2019. The baseline is a lowresolution (N320L70 forecast, N108/N216 4D-Varuncoupled hybrid) full global system similar to that used inoperation at the Met Office since 4 December 2019. The radi-ances assimilated in the global system are from AQUAAIRS, F-17 SSMIS, FY-3B MWHS-1, FY-3C MWRI, FY-3C MWHS-2, GCOMW AMSR-2, GOES 15 Imager,GOES 16 ABI, GPM GMI, HIMAWARI 8 AHI, MTSAPHIR, SNPP ATMS, SNPP CrIS, MetOp B ATOVS,MetOp B IASI, MetOp A ATOVS, MetOp A IASI, MSG 1SEVIRI, MSG 4 SEVIRI, NOAA-15 ATOVS, NOAA-18ATOVS, NOAA-19 ATOVS, NOAA-20 ATMS, andNOAA-20 CrIS (acronyms are defined in the Appendix).
The experiments are:● baseline only (Control);● FY-3D MWHS-2 channels 11–15 assimilated on top
of the Control (EXP 1);● same as EXP 1 plus the addition of FY-3D MWTS-2
channels 4–13 (EXP 2);● same as EXP1 plus the addition of FY-3D MWTS-2
high-peaking channels 9–13 only (EXP 3);● FY-3D MWRI channels 3–8 assimilated on top of the
Control with both FY-3C and FY-3D MWRI thinnedto 120 km (EXP 4).
Fig. 7. FY-3D MWRI unscreened observations at 36.5 GHz V-pol (channel 7) shown north of Madagascar on 25 July 2019.
AUGUST 2021 CARMINATI ET AL. 1389

For these experiments, MWHS-2 channels 11–14 arerejected over sea ice and high land (orography > 1000 m),and channel 15 rejected over sea ice and land. MWTS-2 chan-nels 4 is rejected over sea ice and land, channel 5 rejectedover tropical land, and channels 5–7 over high land.MWHS-2 and MWTS-2 observations are thinned every 154km in the tropics and 125 km in the extratropics. MWRI chan-nels are rejected over sea ice and land and the observationsare thinned every 120 km (80 km in the control). Observa-tion errors used in 4D-Var replicate those derived for FY-3C. The variational bias correction applied to MWHS-2 andMWTS-2 uses seven predictors, including a constant bias off-set, two atmospheric thickness predictors (200–50 hPa and850–300 hPa), and four Legendre polynomial predictors cor-recting the scan biases after a static spot-dependent offset isapplied. For MWRI, two more predictors are used to cor-rect the orbital bias [the cosine and sine of the Fourierseries; see Booton et al. (2014)]. Offline runs over the sameperiod have been used to spin up the bias predictors, and thefirst five days of the experiments are excluded from the veri-fication to allow the variational bias correction to adjust forthe new instruments.
The impact on the forecasts from adding the new instru-ments is evaluated through the change in RMSE for selec-ted atmospheric variables in a range of forecast lead times.The RMSE change is calculated against Met Office ana-lyses as shown in Fig. 8, ECMWF analyses, and conven-tional observations. Additionally, we evaluate how the otherinstruments respond to the new data by calculating the ratioof standard deviation of O-B in the experiment and the con-trol. An improved observation fit to the background (i.e.,reduced standard deviation) is the sign that the new data arehaving a positive impact on the atmospheric variables in theshort-range forecasts used as background for the assimila-tion of satellite radiances. Figure 9 shows the change in obser-vation fit to the background for NOAA-20 ATMS in EXPs1–3 and GPM GMI in EXP 4.
The addition of MWHS-2 alone (EXP 1) results in a0.1% overall reduction of the forecast RMSE and, althoughwe note some small degradation in the Southern Hemi-sphere (SH), there are clear signs of improvement in theNorthern Hemisphere (NH) and the tropics for low-levelwind and geopotential height, as well as temperature acrossmost lead times. The fit to the background for independentsounders is mostly neutral (see, for example, ATMS in Fig. 9a).
The addition of MWTS-2 along with MWHS-2 (EXP2) results in an overall neutral change in forecast RMSE(0.05%) but causes significant degradation at short leadtimes, mostly in the SH, and to a lesser extent in the tropicsand NH. We also note a persistent negative signal in the trop-ical upper-tropospheric temperature. In addition, the back-ground fit of microwave instruments with channels sensit-ive to tropospheric and lower-stratospheric temperature hassignificantly degraded, as can be seen for ATMS channels6–11 (equivalent to MWTS-2 channels 4–9) in Fig. 9b. Thelargest degradation (about 1%) occurs for ATMS channels 8
and 9, which peak in the upper troposphere. On the con-trary, the highest-peaking channels, 12–15, which are sensit-ive to upper-stratospheric temperature, are improved bymore than 1%. The degradation of the background fit for chan-nels peaking in the troposphere is unsurprising given that itis a well observed part of the atmosphere with small errorsand low level of uncertainty in the background. The largestriping (not corrected, unlike the scan bias for example) inMWTS-2 observations is therefore introducing more noisethan useful information into the system. In the upper strato-sphere, however, the lower number of available observa-tions drives up the uncertainty in the background to theextent that MWTS-2 channels, albeit noisy, can still yieldbenefits. This observation has motivated the setup of EXP 3where only MWTS-2 high-peaking channels have beenretained for assimilation.
The overall benefits gained with EXP 3 are similar toEXP 1 (0.1% change in RMSE) but without the degrada-tion previously observed in the SH. Improvements span allthree latitudinal bands and all variables, although mostly lim-ited to lead times ranging from T+0 to T+60. A clear improve-ment is also visible in the background fit of ATMS (Fig.9c), which has lost the degradation seen in channels 6–11 inEXP 2 but retained the improvement gained in the high-peak-ing channels. ATMS humidity channels have a slightlydegraded fit, but the overall impact remains positive.
The addition of MWRI radiances on top of the baselinehas resulted in a neutral change in RMSE (0.08% largerthan the control), although some persistent degradations arevisible in the tropics, especially for low-level temperature,but noting that these degradations are not detected when com-pared against ECMWF analyses or observations (overallRMSE 0.05% larger and 0.01% smaller, respectively; notshown). This therefore points to a possible deficiency in therepresentation of the tropical temperature in the Met Officeanalyses. The new data also have a mostly neutral impact onthe fit to the background for most sounders, but result in asmall improvement, consistent across all channels, for GMI(up to 0.3%; Fig. 9d) as well as SSMIS (up to 1.3%; notshown). The fit for AMSR-2 has degraded slightly, by0.2%–0.4% (not shown).
In summary, the assimilation of radiances from FY-3Dmicrowave instruments have a neutral to positive impact onthe system (as expected, this is similar to the impactobtained when FY-3C instruments were introduced into thesystem), with the best results obtained for the assimilationof MWHS-2 channels 11–15 along with MWTS-2 channels9–13. Note that a combined assessment of MWHS-2,MWTS-2 and MWRI has not been tested to date. Pending fur-ther evaluation, including high-resolution experiments, theaddition of FY-3D microwave radiances is a potential candid-ate for the next model upgrade planned for June 2020.
5. Conclusion
FY-3D is the latest Chinese satellite in Sun-synchron-
1390 INSIGHTS OF THE FY-3D MICROWAVE INSTRUMENTS VOLUME 38

Fig. 8. Change in the root-mean-square forecast error between EXP (a) 1, (b) 2, (c) 3 and (d) 4and the control for key atmospheric variables (see Appendix for acronyms) with respect to MetOffice analyses over the period 15 June to 15 September 2019. The columns are the forecasttime, out to six days. Upward-pointing green triangles denote improvement and downward-pointing purple triangles denote degradation. Shading shows significant changes.
AUGUST 2021 CARMINATI ET AL. 1391

ous orbit dedicated to weather and climate monitoring. Inthis study we have provided a characterization of the dataquality for FY-3D microwave instruments, i.e., MWTS-2,MWHS-2 and MWRI, and evaluated their impact on theMet Office NWP system. FY-3D observations have been com-pared to the Met Office short-range forecasts, along withobservations from the previous Chinese platform, FY-3C, car-rying identical instruments (apart from MWTS-2, which is outof service), as well as observations from NOAA-20 ATMSand GPM GMI, two well-characterized U.S. instruments.
We first assessed MWTS-2 background departures andcompared them to those of ATMS at equivalent channel fre-quencies. Because we could not compare FY-3D MWTS-2with the FY-3C version, we analyzed our results in the lightof previous assessment studies. The most interesting find-ing was a close agreement in global background departureswith those from ATMS. This represents a significant improve-ment since the temperature sounder on FY-3C was shown tosuffer a large cold inter-satellite bias attributed to a subop-timal calibration. The difference between FY-3D MWTS-2and ATMS O-B is on average 0.36 ± 0.28 K (1σ). However,FY-3D MWTS-2 still suffers a strong scan-dependent biasthat can reach amplitudes of up to 2 K and affects, to vari-ous extents, all channels. Striping noise and biases varying
with the scene temperature have also been detected in linewith previous findings related to the instrument on FY-3C.We have also raised concerns regarding the smoothingmethod employed by the CMA to average the instrument’sraw digital counts, which leads to an increase in stripingnoise and causes a bias of up to 0.9 K between the ascend-ing and descending nodes. This method was also used forFY-3C MWTS-2 but was later revised by the CMA. Werecommend that it should be revised for the instrument onFY-3D as well.
The assessment of FY-3D MWHS-2, in comparison toits predecessor on FY-3C and ATMS at equivalent channelfrequencies, has revealed a shift in global bias, likely due toa different calibration with respect to the FY-3C version.This shift results in a reduction of the global bias in the 183-GHz humidity channels and places FY-3D MWHS-2 within± 1.9 K to ATMS O-B. Like the instrument on FY-3C, thenew MWHS-2 shows the signs of spurious sensitivity to thetemperature of the instrument’s environment in channel 14,and to a lesser extent channel 13, possibly linked to anemissivity leakage affecting the antenna. In the 118-GHzchannels, the shift in global bias results in a lower but albeitmore coherent channel-to-channel bias structure than FY-3C. The standard deviation of O-B is found to be similar or
Fig. 9. Change in standard deviation of O-B for (a–c) NOAA-20 ATMS in EXP 1, 2 and 3, respectively, and (d)GMI in EXP 4, over the period 15 June 15 September 2019. Red indicates a significant increase, green a significantdecrease, and blue no significant change. The numbers at the top of each plot indicate the mean change across allchannels (±1σ).
1392 INSIGHTS OF THE FY-3D MICROWAVE INSTRUMENTS VOLUME 38

smaller than that for FY-3C MWHS-2. Consistent with previ-ous evaluations of FY-3C MWHS-2, we have detected thepresence of striping noise.
From the evaluation of FY-3D MWRI, we have high-lighted a reduction in the global biases across most chan-nels, as well as a reduction in the standard deviation of O-Bcompared to the FY-3C version. The latter is consistentwith the bias correction developed by the CMA aimed at redu-cing the noise in the warm target used for the calibration.Compared to GMI, the new MWRI remains low-biased butshows better agreement in terms of standard deviation. Focus-ing on the solar-dependent bias that was found to be as largeas 2 K for the instrument on FY-3C and a serious drawbackfor use in NWP systems, we have shown that this bias hasbeen reduced to 0.17 K on average for FY-3D MWRI. Thisis also the direct result of an improved correction applied bythe CMA targeting the emissivity of the cold and hot reflect-ors. It is hoped that the CMA will also apply the emissivitycorrection to the instrument on FY-3C. Of particular con-cern, however, are the unrealistically large brightness temper-atures recorded on several occasions between 13 July and10 August 2019. This only affected channel 7 (36.5 GHz V-pol) and caused an inflation of the mean background depar-ture and standard deviation in that channel. The cause ofthis problem is under investigation.
Assimilation experiments using a low-resolution ver-sion of the global Met Office NWP system have demon-strated the potential benefits of adding MWHS-2 and
MWTS-2, on top of an already well-furnished observing sys-tem, a sign that saturation has not yet been reached in themicrowave spectral domain. The best configuration,MWHS-2 channels 11–15 and MWTS-2 channels 9–13,provides a reduction in the forecast RMSE of 0.1% andimproves the fit to the background for independent soundersby up to 1%. The addition of FY-3D MWRI has a mostlyneutral impact on the forecast but improves the fit to the back-ground of other imagers such as GMI or SSMIS (althoughnot AMSR-2). All three instruments are candidates for thenext model upgrade planned for mid-2020. Future work willfocus on the assimilation of MWHS-2 118-GHz channels(along with 183 GHz) with an all-sky approach as it is cur-rently done at the Met Office for other microwave humiditysounders.
In conclusion, this study has demonstrated an overallimprovement of the data quality from FY-3D instrumentswith respect to their predecessors. The set of microwaveinstruments that FY-3D offers will further strengthen andincrease the resiliency of the microwave branch of theobserving system used for NWP, reduce forecast errors, andbe more straightforward to use thanks to the mitigation of seri-ous issues affecting past instruments.
Acknowledgements. This work was supported by theUK–China Research & Innovation Partnership Fund through theMet Office Climate Science for Service Partnership (CSSP) Chinaas part of the Newton Fund.
APPENDIX
Assimilation experiments were verified against a series of atmospheric variables, listed below:Northern Hemisphere Pressure at Mean Sea Level (NH_PMSL)Northern Hemisphere Wind at 250 hPa (NH_W250)Northern Hemisphere Wind at 500 hPa (NH_W500)Northern Hemisphere Wind at 850 hPa (NH_W850)Northern Hemisphere Wind at 10 m (NH_W10m)Northern Hemisphere Temperature at 250 hPa (NH_T250)Northern Hemisphere Temperature at 500 hPa (NH_T500)Northern Hemisphere Temperature at 850 hPa (NH_T850)Northern Hemisphere Temperature at 2 m (NH_T_2m)Northern Hemisphere geopotential height at 250 hPa (NH_Z250)Northern Hemisphere geopotential height at 500 hPa (NH_Z500)Northern Hemisphere geopotential height at 850 hPa (NH_Z850)Tropical Wind at 250 hPa (TR_W250)Tropical Wind at 500 hPa (TR_W500)Tropical Wind at 850 hPa (TR_W850)Tropical Wind at 10 m (TR_W10m)Tropical Temperature at 250 hPa (TR_T250)Tropical Temperature at 500 hPa (TR_T250)Tropical Temperature at 850 hPa (TR_T250)Tropical Temperature at 10 m (TR_T250)
AUGUST 2021 CARMINATI ET AL. 1393

Southern Hemisphere Pressure at Mean Sea Level (NH_PMSL)Southern Hemisphere Wind at 250 hPa (SH_W250)Southern Hemisphere Wind at 500 hPa (SH_W500)Southern Hemisphere Wind at 850 hPa (SH_W850)Southern Hemisphere Wind at 10 m (SH_W10m)Southern Hemisphere Temperature at 250 hPa (SH_T250)Southern Hemisphere Temperature at 500 hPa (SH_T500)Southern Hemisphere Temperature at 850 hPa (SH_T850)Southern Hemisphere Temperature at 2 m (SH_T_2m)Southern Hemisphere geopotential height at 250 hPa (SH_Z250)Southern Hemisphere geopotential height at 500 hPa (SH_Z500)Southern Hemisphere geopotential height at 850 hPa (SH_Z850)
List of instruments referenced in this paper
Earth Observation System Aqua Atmospheric Infra-Red Sounder (Aqua AIRS)Defense Meteorological Satellite Program – F17 Special Sensor Microwave - Imager/Sounder (F-17 SSMIS)Fengyun 3B Micro-Wave Humidity Sounder – 2 (FY-3B MWHS-1)Fengyun 3C Micro-Wave Temperature Sounder – 2 (FY-3C MWTS-2)Fengyun 3C Micro-Wave Humidity Sounder – 2 (FY-3C MWHS-2)Fengyun 3C Micro-Wave Radiation Imager (FY-3C MWRI)Global Change Observation Mission for Water Advanced Microwave Scanning Radiometer - 2 (GCOMW AMSR-2)Geostationary Operational Environmental Satellite 15 Imager (GOES 15 Imager)Geostationary Operational Environmental Satellite 16 Advanced Baseline Imager (GOES 16 ABI)Global Precipitation Measurement Microwave Imager (GPM GMI)Himawari 8 Advanced Himawari Imager (HIMAWARI 8 AHI)Megha-Tropiques Sondeur Atmospherique du Profil d’Humidite Intertropicale par Radiometrie (MT SAPHIR)Suomi National Polar-orbiting Partnership Advanced Technology Microwave Sounder (SNPP ATMS)Suomi National Polar-orbiting Partnership Cross-track Infrared Sounder (SNPP CrIS)Meteorological operational satellite – B Advanced TIROS Operational Vertical Sounder (MetOp-B ATOVS)Meteorological operational satellite – B Infrared Atmospheric Sounding Interferometer (MetOp-B IASI)Meteorological operational satellite – A Advanced TIROS Operational Vertical Sounder (MetOp-A ATOVS)Meteorological operational satellite – B Infrared Atmospheric Sounding Interferometer (MetOp-A IASI)Meteosat-8 Spinning Enhanced Visible Infra-Red Imager (MET-8 SEVIRI)Meteosat-11 Spinning Enhanced Visible Infra-Red Imager (MET-11 SEVIRI)National Oceanic and Atmospheric Administration – 15 Advanced TIROS Operational Vertical Sounder (NOAA-15
ATOVS)National Oceanic and Atmospheric Administration – 18 Advanced TIROS Operational Vertical Sounder (NOAA-18
ATOVS)National Oceanic and Atmospheric Administration – 19 Advanced TIROS Operational Vertical Sounder (NOAA-19
ATOVS)National Oceanic and Atmospheric Administration – 20 Advanced Technology Microwave Sounder (NOAA-20
ATMS)National Oceanic and Atmospheric Administration – 20 Cross-track Infrared Sounder (NOAA-20 CrIS)
Open Access This article is distributed under the terms of the
Creative Commons Attribution 4.0 International License (http://cre-
ativecommons.org/licenses/by/4.0/), which permits unrestricted
use, distribution, and reproduction in any medium, provided you
give appropriate credit to the original author(s) and the source,
provide a link to the Creative Commons license, and indicate if
changes were made.
REFERENCES
Atkinson, N., Q. F. Lu, B. Bell, F. Carminati, K. Lean, N. Bor-mann, and H. Lawrence, 2015: The FY-3C EvaluationProject: Microwave Sounder Calibration and Direct Broad-
1394 INSIGHTS OF THE FY-3D MICROWAVE INSTRUMENTS VOLUME 38

cast Experiences. [Available from https://cimss.ssec.wisc.edu/itwg/itsc/itsc20/papers/1_02_atkinson_paper.pdf.]
Bauer, P., A. Thorpe, and G. Brunet, 2015: The quiet revolutionof numerical weather prediction. Nature, 525, 47−55,https://doi.org/10.1038/nature14956.
Bell, W., and Coauthors, 2008: The assimilation of SSMIS radi-ances in numerical weather prediction models. IEEE Trans.Geosci. Remote Sens., 46, 884−900, https://doi.org/10.1109/TGRS.2008.917335.
Bennartz, R., A. Thoss, A. Dybbroe, and D. B. Michelson, 2002:Precipitation analysis using the advanced microwave sound-ing unit in support of nowcasting applications. Meteorolo-gical Applications, 9(2), 177−189, https://doi.org/10.1017/S1350482702002037.
Berg, W., and Coauthors, 2016: Intercalibration of the GPMmicrowave radiometer constellation. J. Atmos. Oceanic Tech-nol., 33(12), 2639−2654, https://doi.org/10.1175/JTECH-D-16-0100.1.
Bobak, J. P., D. J. Dowgiallo, T. E. vonRentzell, and N. R.McGlothlin, 2005: Satellite calibration and validation utiliz-ing the Airborne Polarimetric Microwave ImagingRadiometer (APMIR). Proc. OCEANS 2005 MTS/IEEE,Washington, DC, IEEE, 352−354, doi: 10.1109/OCEANS.2005.1639787.
Booton, A., W. Bell, and N. Atkinson, 2014: An improved bias cor-rection for SSMIS. [Available from https://cimss.ssec.wisc.edu/itwg/itsc/itsc19/program/papers/10_03_booton.pdf]
Bormann, N., A. Fouilloux, and W. Bell, 2013: Evaluation andassimilation of ATMS data in the ECMWF system. J. Geo-phys. Res., 118(23), 12 970−12 980, https://doi.org/10.1002/2013JD020325.
Brogniez, H., and Coauthors, 2016: A review of sources of system-atic errors and uncertainties in observations and simulationsat 183 GHz. Atmospheric Measurement Techniques, 9(5),2207−2221, https://doi.org/10.5194/amt-9-2207-2016.
Burgdorf, M., S. A. Buehler, T. Lang, S. Michel, and I. Hans,2016: The moon as a photometric calibration standard formicrowave sensors. Atmospheric Measurement Techniques,9, 3467−3475, https://doi.org/10.5194/amt-9-3467-2016.
Calbet, X., and Coauthors, 2018: Can turbulence within the fieldof view cause significant biases in radiative transfer model-ling at the 183 GHz band? Atmospheric Measurement Tech-niques Discussions, doi: 10.5194/amt-2018-181.
Cao, C. Y., M. Weinreb, and H. Xu, 2004: Predicting simultan-eous nadir overpasses among polar-orbiting meteorologicalsatellites for the intersatellite calibration of radiometers. J.Atmos. Oceanic Technol, 21, 537−542, https://doi.org/10.1175/1520-0426(2004)021<0537:PSNOAP>2.0.CO;2.
Carminati, F., J. Goddard, H. Lawrence, and S. Newman, 2017:Calibration/Validation Study of GPM GMI. Available fromhttp://www.gaia-clim.eu/system/files/document/d4.6.pdf.
Carminati, F., B. Candy, W. Bell, and N. Atkinson, 2018: Assess-ment and assimilation of FY-3 humidity sounders andimager in the UK Met Office global model. Adv. Atmos.Sci., 35(8), 942−954, https://doi.org/10.1007/s00376-018-7266-8.
Chen, K. Y., S. English, N. Bormann, and J. Zhu, 2015: Assess-ment of FY-3A and FY-3B MWHS observations. Wea. Fore-casting, 30, 1280−1290, https://doi.org/10.1175/WAF-D-15-0025.1.
Chen, K. Y., N. Bormann, S. English, and J. Zhu, 2018: Assimila-tion of Fengyun-3B satellite microwave humidity sounder
data over land. Adv. Atmos. Sci., 35(3), 268−275,https://doi.org/10.1007/s00376-017-7088-0.
English, S. J., J. R. Eyre, and J. A. Smith, 1999: A cloud-detec-tion scheme for use with satellite sounding radiances in thecontext of data assimilation for numerical weather predic-tion. Quart. J. Roy. Meteorol. Soc., 125(559), 2359−2378,https://doi.org/10.1002/qj.49712555902.
English, S. J., R. J. Renshaw, P. C. Dibben, A. J. Smith, P. J.Rayer, C. Poulsen, F. W. Saunders, and J. R. Eyre, 2000: Acomparison of the impact of TOVS arid ATOVS satellitesounding data on the accuracy of numerical weather fore-casts. Quart. J. Roy. Meteorol. Soc., 126, 2911−2931,https://doi.org/10.1002/qj.49712656915.
Geer, A. J., P. Bauer, and N. Bormann, 2010: Solar biases inmicrowave imager observations assimilated at ECMWF.IEEE Trans. Geosci. Remote Sens., 48, 2660−2669,https://doi.org/10.1109/TGRS.2010.2040186.
Gu, X. F., and X. D. Tong, 2015: Overview of China earth observa-tion satellite programs [Space Agencies]. IEEE Geoscienceand Remote Sensing Magazine, 3(3), 113−129, doi:10.1109/MGRS.2015.2467172.
Guo, Y., J. Y. He, S. Y. Gu, and N. M. Lu, 2019: Calibration andvalidation of Feng Yun-3-D microwave humidity sounderⅡ. IEEE Geoscience and Remote Sensing Letters, doi:10.1109/LGRS.2019.2957403.
He, J. Y., S. W. Zhang, and Z. Z. Wang, 2015: Advancedmicrowave atmospheric sounder (AMAS) channel specifica-tions and T/V calibration results on FY-3C satellite. IEEETrans. Geosci. Remote Sens., 53(1), 481−493,https://doi.org/10.1109/TGRS.2014.2324173.
Joo, S., J. Eyre, and R. Marriott, 2013: The impact of MetOp andother satellite data within the met office global NWP sys-tem using an adjoint-based sensitivity method. Mon. Wea.Rev., 141, 3331−3342, https://doi.org/10.1175/MWR-D-12-00232.1.
Kazumori, M., and S. J. English, 2015: Use of the ocean surfacewind direction signal in microwave radiance assimilation. Qu-art. J. Roy. Meteorol. Soc., 141, 1354−1375, https://doi.org/10.1002/qj.2445.
Kazumori, M., A. J. Geer, and S. J. English, 2016: Effects of all-sky assimilation of GCOM-W/AMSR2 radiances in theECMWF numerical weather prediction system. Quart. J.Roy. Meteorol. Soc., 142, 721−737, https://doi.org/10.1002/qj.2669.
Lawrence, H., and Coauthors, 2017: An Evaluation of FY-3CMWRI and Assessment of the Long-Term Quality of FY-3CMWHS-2 at ECMWF and the Met Office. European Centrefor Medium-Range Weather Forecasts. [Available fromhttps://www.ecmwf.int/sites/default/files/elibrary/2017/17206-evaluation-fy-3c-mwri-and-assessment-long-term-quality-fy-3c-mwhs-2-ecmwf-and-met-office.pdf]
Lawrence, H., N. Bormann, A. J. Geer, Q. F. Lu, and S. J. Eng-lish, 2018: Evaluation and assimilation of the microwavesounder MWHS-2 onboard FY-3C in the ECMWF numer-ical weather prediction system. IEEE Trans. Geosci. RemoteSens., 56(6), 3333−3349, https://doi.org/10.1109/TGRS.2018.2798292.
Li, J., and G. Q. Liu, 2016: Direct assimilation of Chinese FY-3Cmicrowave temperature sounder-2 radiances in the globalGRAPES system. Atmospheric Measurement Techniques, 9,3095−3113, https://doi.org/10.5194/amt-9-3095-2016.
Li, J., Z. K. Qin, and G. Q. Liu, 2016: A new generation of
AUGUST 2021 CARMINATI ET AL. 1395

Chinese FY-3C microwave sounding measurements and theinitial assessments of its observations. Int. J. Remote Sens.,37, 4035−4058, https://doi.org/10.1080/01431161.2016.1207260.
Lorenc, A. C., and Coauthors, 2000: The Met. office global three-dimensional variational data assimilation scheme. Quart. J.Roy. Meteorol. Soc., 126, 2991−3012, https://doi.org/10.1002/qj.49712657002.
Lu, Q. F., H. Lawrence, N. Bormann, S. English, K. Lean, N.Atkinson, W. Bell, and F. Carminati, 2015: An Evaluationof FY-3C Satellite Data Quality at ECMWF and the MetOffice, European Centre for Medium-Range Weather Fore-casts. Available from https://www.ecmwf.int/sites/default/files/elibrary/2015/14692-evaluation-fy-3c-satellite-data-quality-ecmwf-and-met-office.pdf.
Macelloni, G., M. Brogioni, P. Pampaloni, A. Cagnati, and M. R.Drinkwater, 2006: DOMEX 2004: An experimental cam-paign at Dome-C Antarctica for the calibration of space-borne low-frequency microwave radiometers. IEEE Trans.Geosci. Remote Sens., 44(10), 2642−2653, https://doi.org/10.1109/TGRS.2006.882801.
Moradi, I., R. R. Ferraro, P. Eriksson, and F. Z. Weng, 2015: Inter-calibration and validation of observations from ATMS andSAPHIR microwave sounders. IEEE Trans. Geosci. RemoteSens., 53, 5915−5925, https://doi.org/10.1109/TGRS.2015.2427165.
Newell, D., and Coauthors, 2014: GPM microwave imager key per-formance and calibration results. Proc. 2014 IEEEGeoscience and Remote Sensing Symposium, Quebec City,IEEE, 3754−3757, doi: 10.1109/IGARSS.2014.6947300.
Newman, S., F. Carminati, H. Lawrence, N. Bormann, K.Salonen, and W. Bell, 2020: Assessment of new satellite mis-sions within the framework of numerical weather prediction.Remote Sensing, 12, 1580, https://doi.org/10.3390/rs12101580.
Pielke, R., Jr., and R. E. Carbone, 2002: Weather impacts, fore-casts, and policy: An integrated perspective. Bull. Amer. Met-eorol. Soc., 83, 393−406, https://doi.org/10.1175/1520-0477(2002)083<0393:WIFAP>2.3.CO;2.
Rawlins, F., S. P. Ballard, K. J. Bovis, A. M. Clayton, D. Li, G.W. Inverarity, A. C. Lorenc, and T. J. Payne, 2007: The MetOffice global four-dimensional variational data assimilationscheme. Quart. J. Roy. Meteorol. Soc., 133, 347−362,https://doi.org/10.1002/qj.32.
Rodgers, C. D., 2000: Inverse Methods for Atmospheric Sound-ing: Theory and Practice. World Scientific Publishing Singa-pore.
Saunders, R., and Coauthors, 2018: An update on the RTTOVfast radiative transfer model (currently at version 12).Geosci. Model Dev. Discuss., doi: 10.5194/gmd-2018-64.
Saunders, R. W., T. A. Blackmore, B. Candy, P. N. Francis, andT. J. Hewison, 2013: Monitoring satellite radiance biasesusing NWP models. IEEE Trans. Geosci. Remote Sens.,
51(3), 1124−1138, https://doi.org/10.1109/TGRS.2012.2229283.
Tian, X. X., X. L. Zou, and S. P. Yang, 2018: A limb correctionmethod for the microwave temperature sounder 2 and itsapplications. Adv. Atmos. Sci., 35(12), 1547−1552,https://doi.org/10.1007/s00376-018-8092-8.
Uppala, S. M., and Coauthors, 2005: The ERA-40 re-analysis. Qu-art. J. Roy. Meteorol. Soc., 131, 2961−3012, https://doi.org/10.1256/qj.04.176.
Wang, X., and X. Li, 2014: Preliminary investigation ofFengyun-3C Microwave Temperature Sounder (MWTS) meas-urements. Remote Sensing Letters, 5(12), 1002−1011,https://doi.org/10.1080/2150704X.2014.988305.
Wang, Z. Z., J. Y. Li, J. Y. He, S. W. Zhang, S. Y. Gu, Y. Li, Y.Guo, and B. Y. He, 2019: Performance analysis ofmicrowave humidity and temperature sounder onboard theFY-3D satellite from prelaunch multiangle calibration datain thermal/vacuum test. IEEE Trans. Geosci. Remote Sens.,57, 1664−1683, https://doi.org/10.1109/TGRS.2018.2868324.
Xie, X. X., S. L. Wu, H. X. Xu, W. M. Yu, J. K. He, and S. Y.Gu, 2018: Ascending—descending bias correction ofmicrowave radiation imager on board Fengyun-3C. IEEETrans. Geosci. Remote Sens., 57(6), 3126−3134,https://doi.org/10.1109/TGRS.2018.2881094.
Yang, H., and Coauthors, 2011: The Fengyun-3 microwave radi-ation imager on-orbit verification. IEEE Trans. Geosci.Remote Sens., 49(11), 4552−4560, https://doi.org/10.1109/TGRS.2011.2148200.
Yang, H., J. Zhou, F. Z. Weng, N. H. Sun, K. Anderson, Q. H.Liu, and E. J. Kim, 2018: Developing vicarious calibrationfor microwave sounding instruments using lunar radiation.IEEE Trans. Geosci. Remote Sens., 56(11), 6723−6733,https://doi.org/10.1109/TGRS.2018.2841997.
Yang, J. X., D. S. McKague, and C. S. Ruf, 2016b: Boreal, temper-ate, and tropical forests as vicarious calibration sites for space-borne microwave radiometry. IEEE Trans. Geosci. RemoteSens., 54(2), 1035−1051, https://doi.org/10.1109/TGRS.2015.2472532.
Yang, W. Z., V. O. John, X. P. Zhao, H. Lu, and K. R. Knapp,2016a: Satellite climate data records: Development, applica-tions, and societal benefits. Remote Sensing, 8, 331,https://doi.org/10.3390/rs8040331.
Zou, C. Z., and W. H. Wang, 2011: Intersatellite calibration ofAMSU-A observations for weather and climate applications.J. Geophys. Res., 116, D23113, https://doi.org/10.1029/2011JD016205.
Zou, X. L., J. Zhao, F. Z. Weng, and Z. K. Qin, 2012: Detectionof radio-frequency interference signal over land from FY-3BMicrowave Radiation Imager (MWRI). IEEE Trans. Geosci.Remote Sens., 50(12), 4994−5003, https://doi.org/10.1109/TGRS.2012.2191792.
1396 INSIGHTS OF THE FY-3D MICROWAVE INSTRUMENTS VOLUME 38