insights from the cutting edge of digital - stephen dimarco and george pappachen
TRANSCRIPT
Insights from the Cutting Edge of Digital
Stephen DiMarco CEO, MB Digital,Milward Brown
@sdimarco
George Pappachen Executive Vice President
Global Strategy, WPP@GPappachen

Digital Media Trends
(c) 2015 Millward Brown Digital. Source: Millward Brown Digital’s Getting DigitalRight study, 2015.
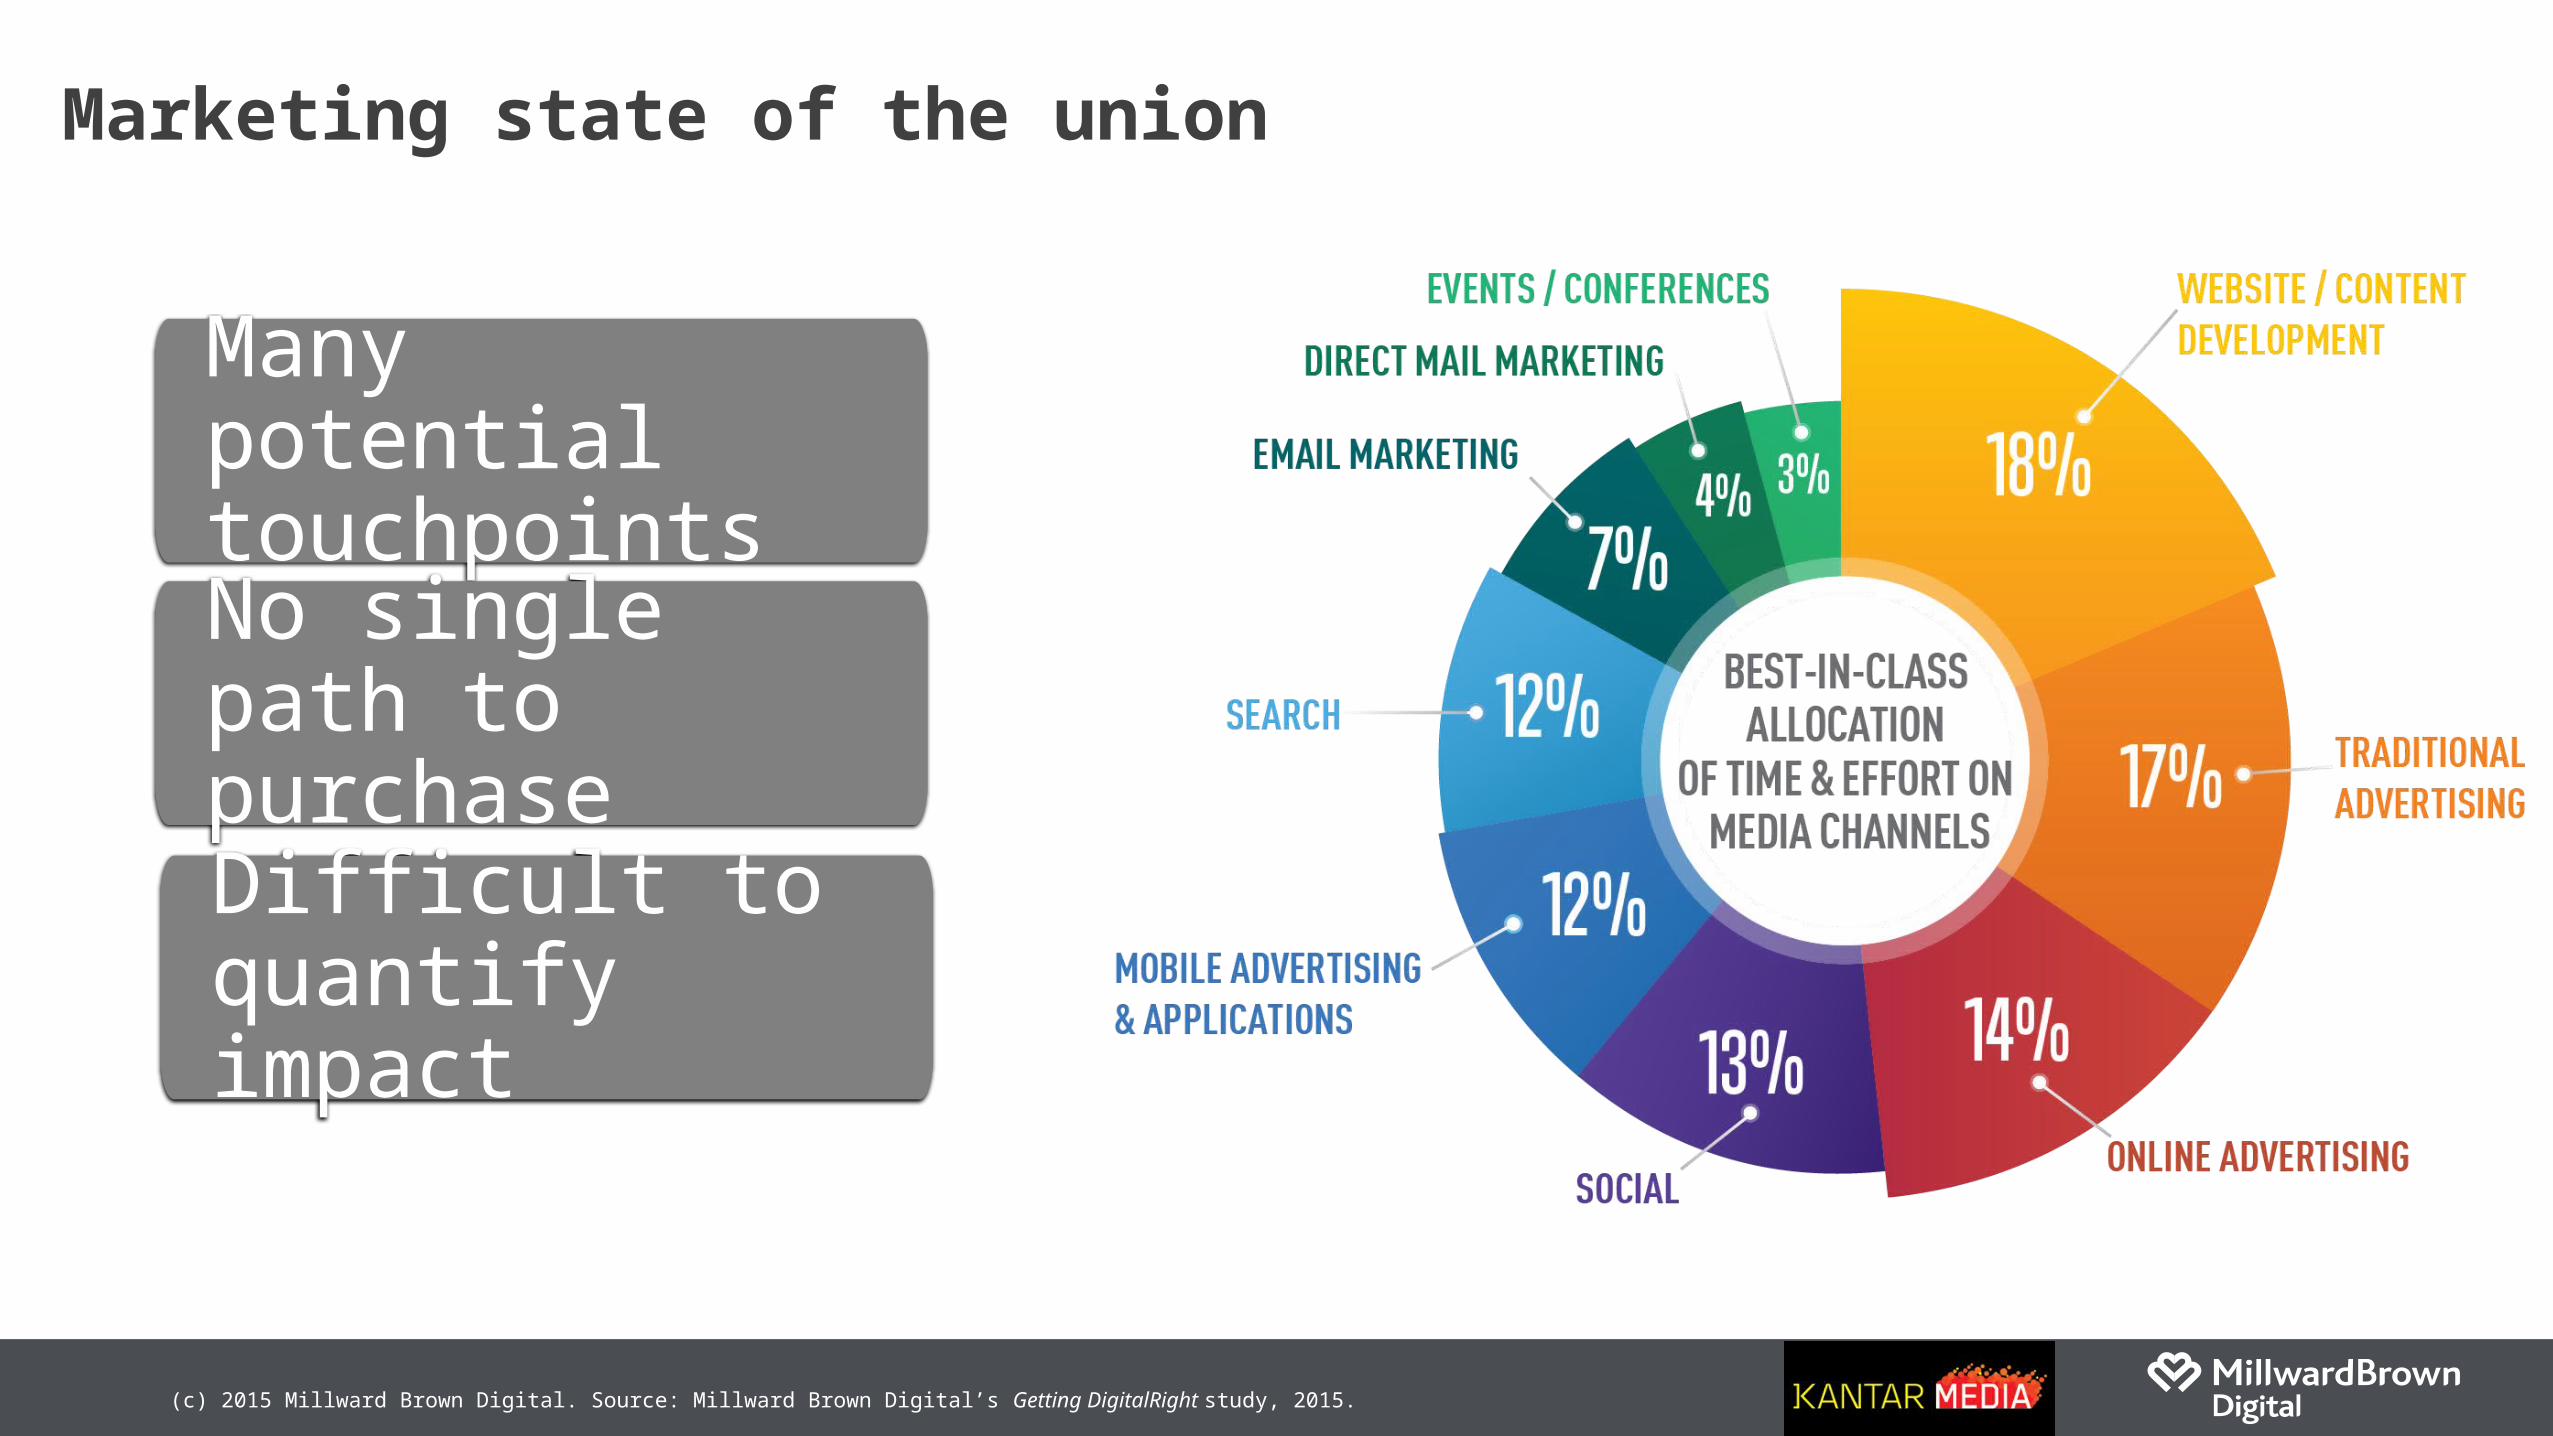
Many potential touchpointsNo single path to purchase
Difficult to quantify impact
Marketing state of the union
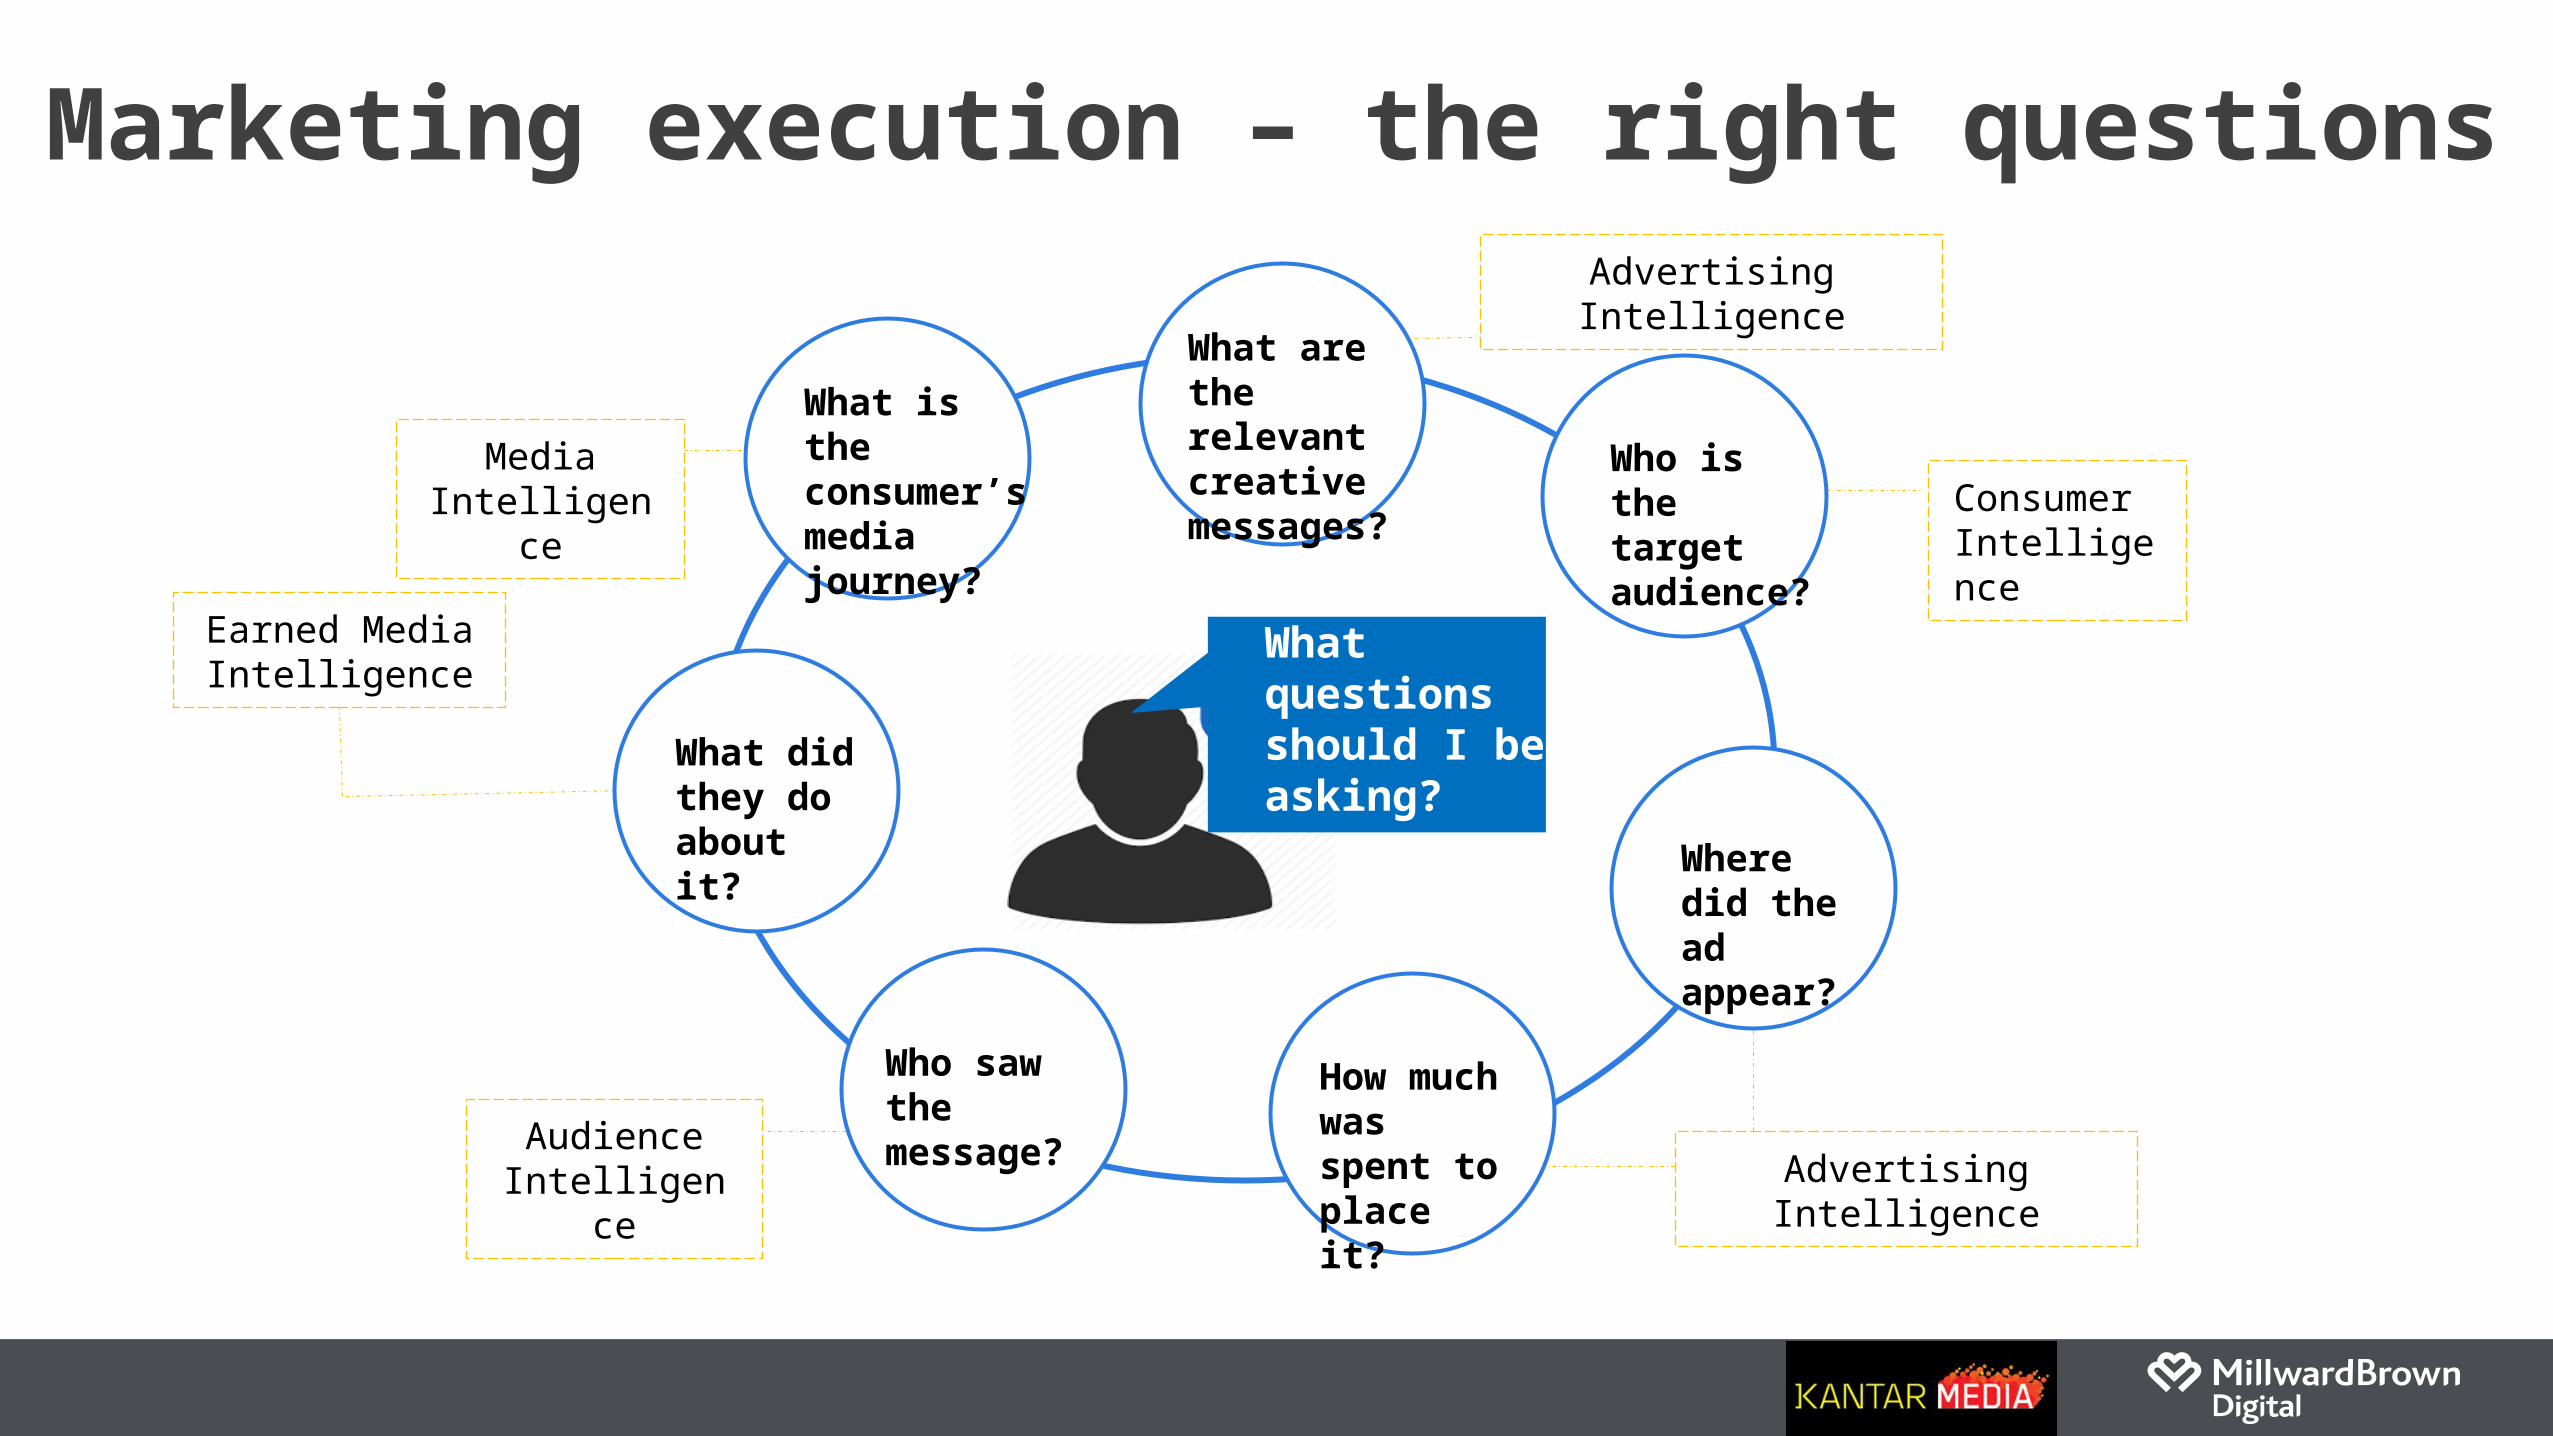
Marketing execution – the right questions
What questions should I be asking?
What are the relevant creative messages? Who is the
target audience?
Where did the ad appear?
How much was spent to place it?
Who saw the message?
What did they do about it?
What is the consumer’s media journey?
Advertising IntelligenceAudience
Intelligence
Earned Media Intelligence
Consumer Intelligence
Advertising Intelligence
Media Intelligence

Targeting audiences online
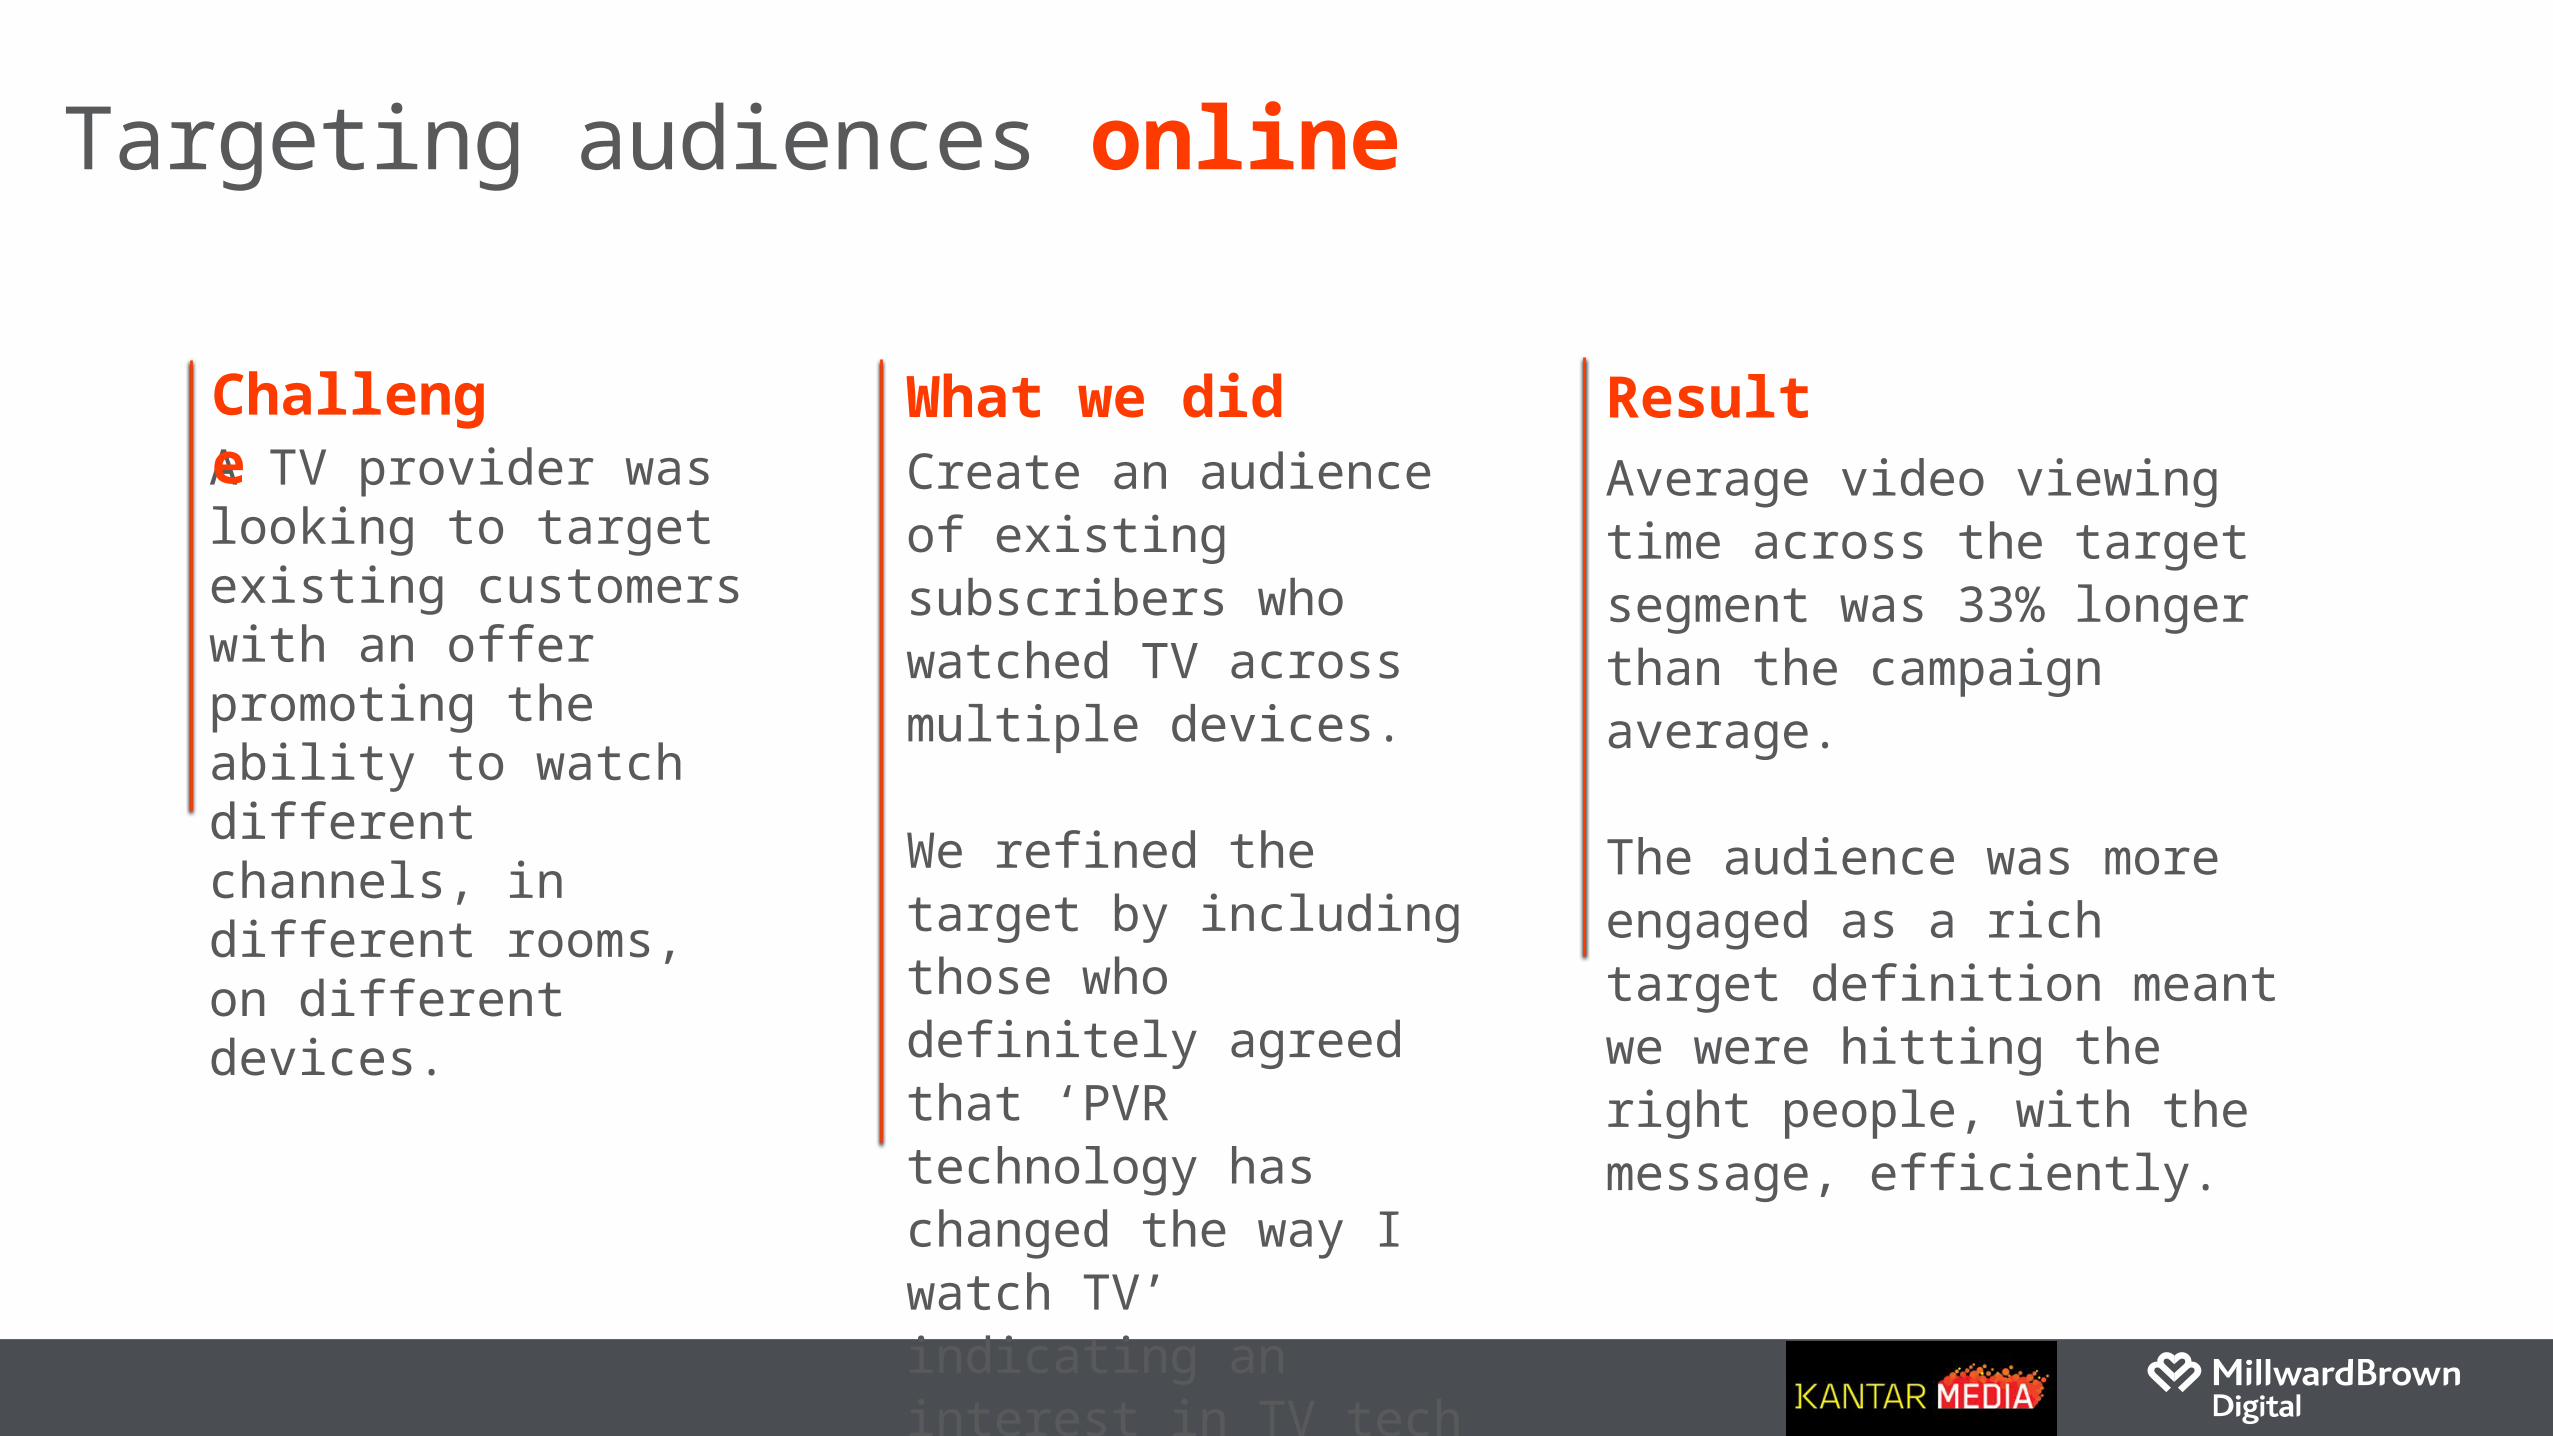
Targeting audiences online
A TV provider was looking to target existing customers with an offer promoting the ability to watch different channels, in different rooms, on different devices.
Create an audience of existing subscribers who watched TV across multiple devices.
We refined the target by including those who definitely agreed that ‘PVR technology has changed the way I watch TV’ indicating an interest in TV tech developments
Average video viewing time across the target segment was 33% longer than the campaign average.
The audience was more engaged as a rich target definition meant we were hitting the right people, with the message, efficiently.
Challenge
What we did
Result
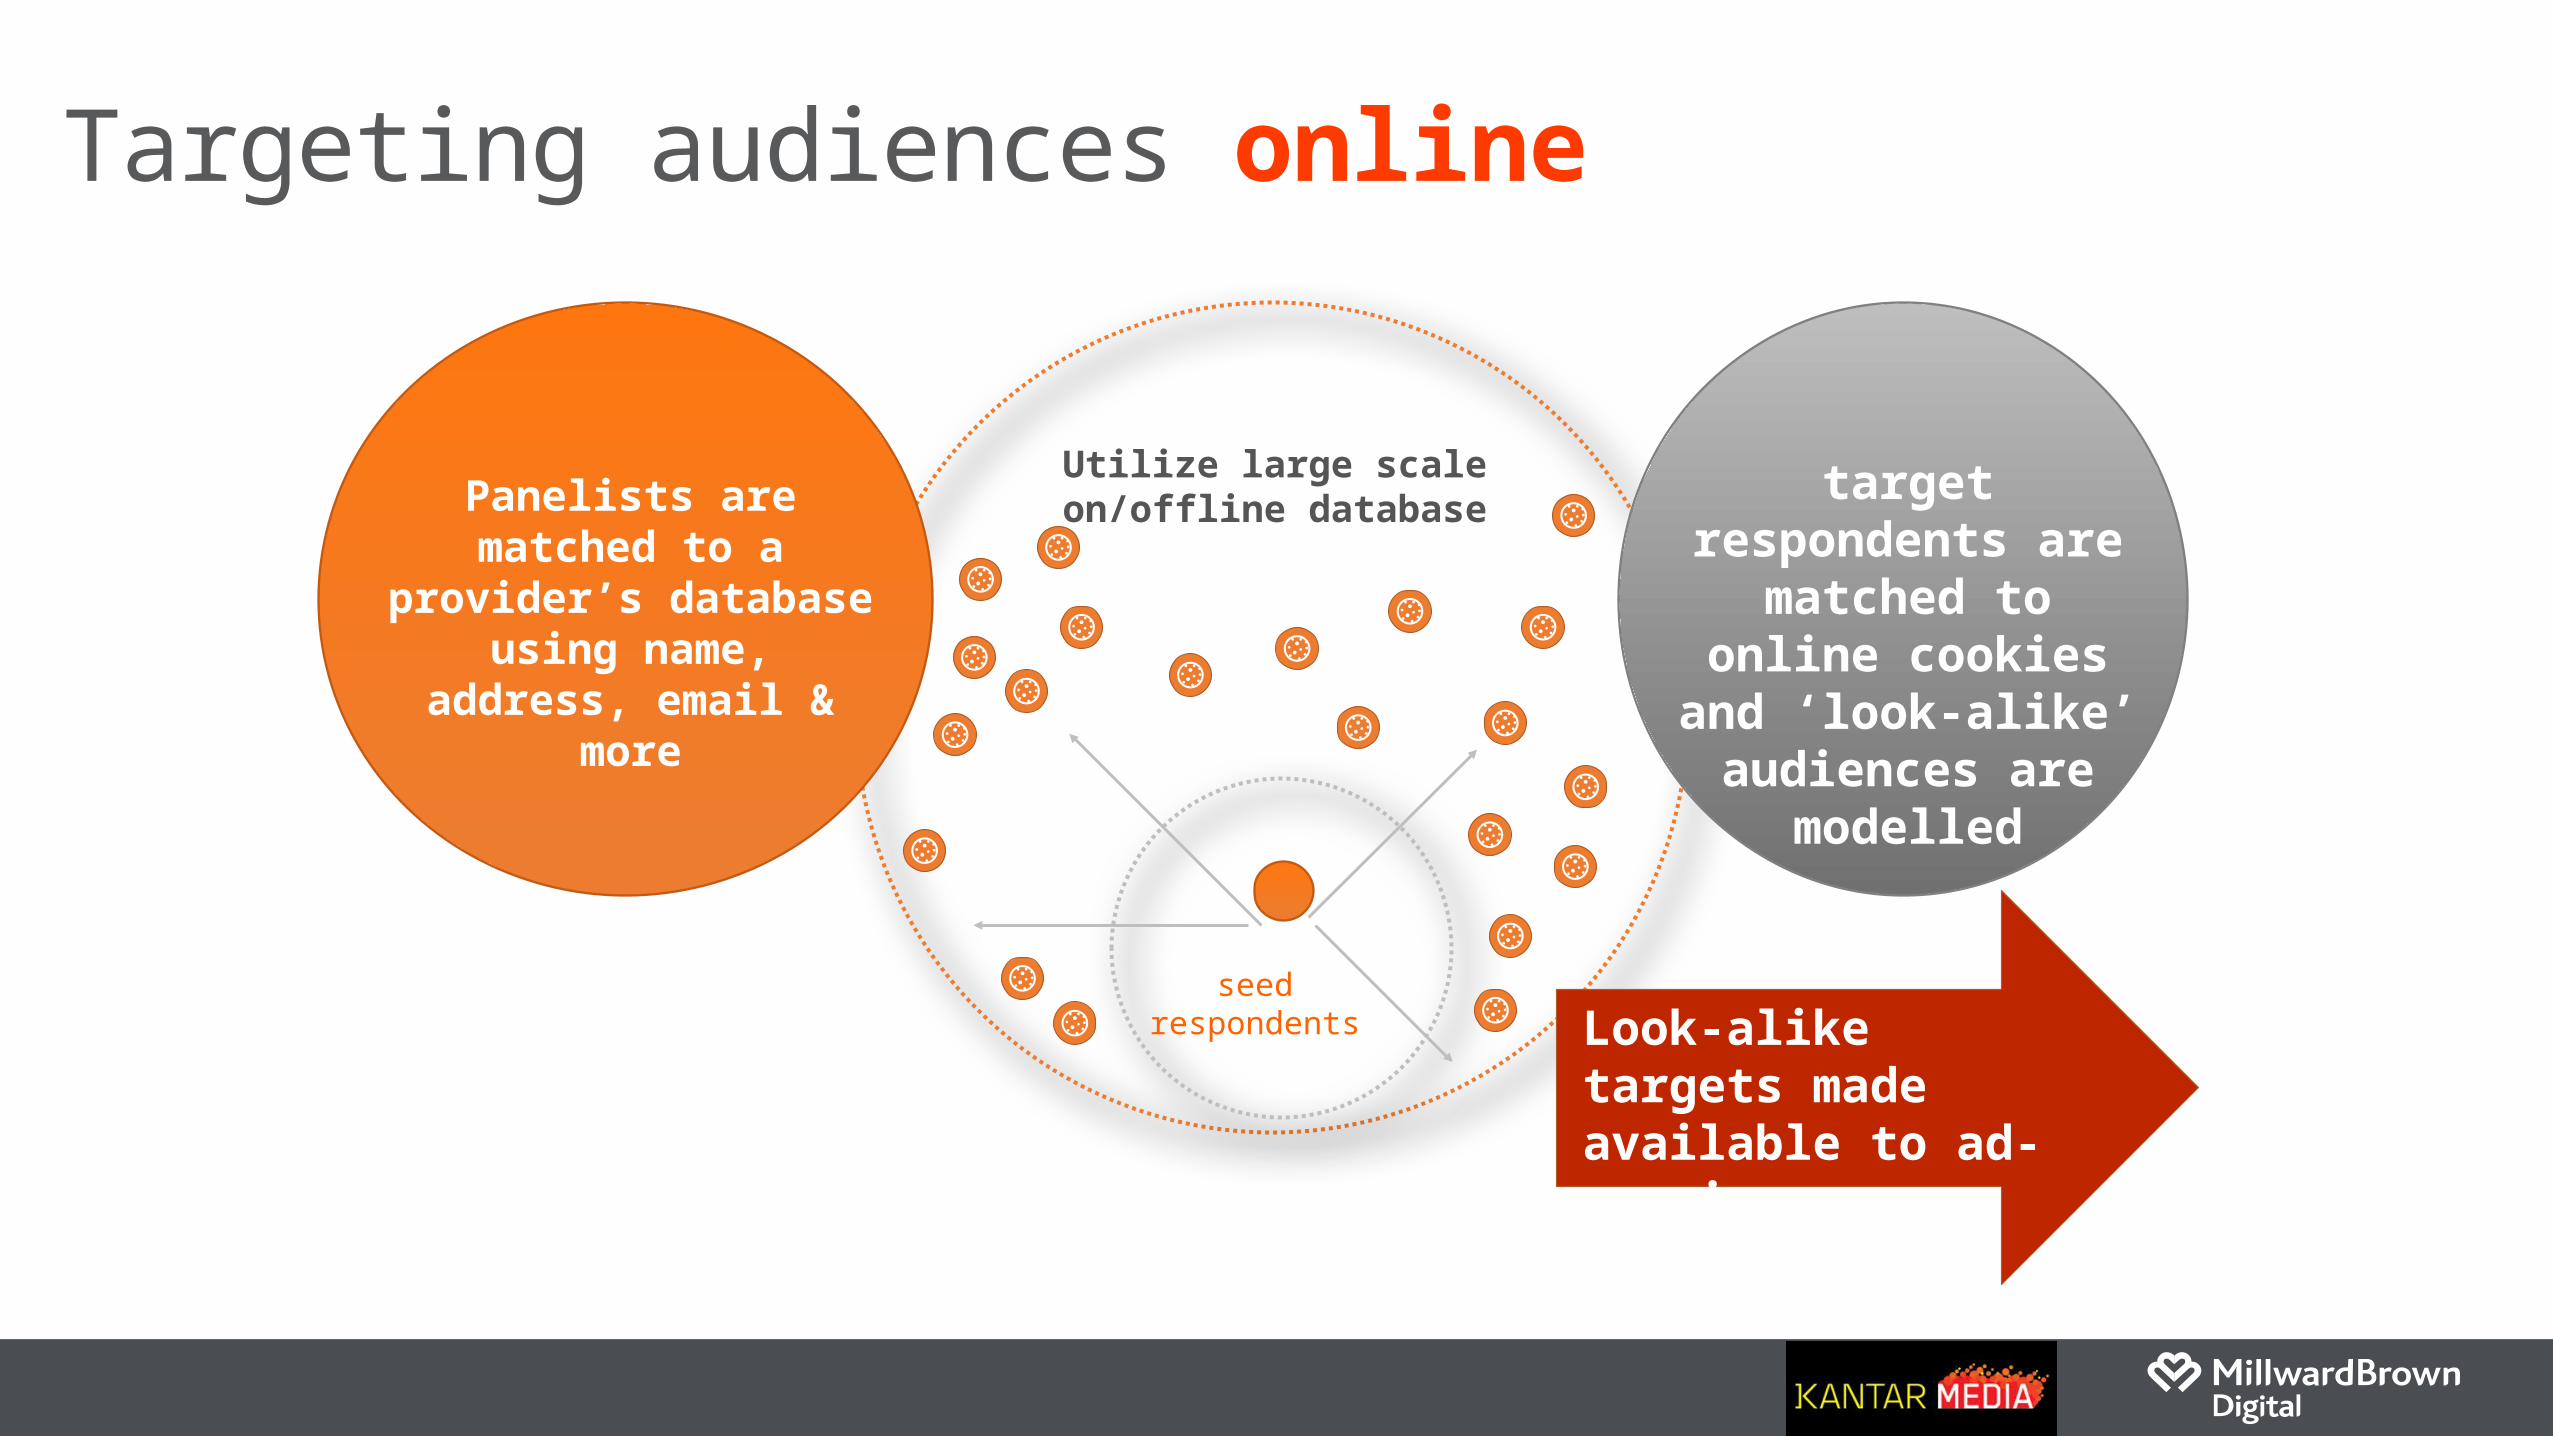
Targeting audiences online
Utilize large scale on/offline database target respondents
are matched to online cookies and
‘look-alike’ audiences are
modelled
Panelists are matched to
a provider’s database using name, address,
email & more
seed respondents Look-alike targets
made available to ad-serving platforms
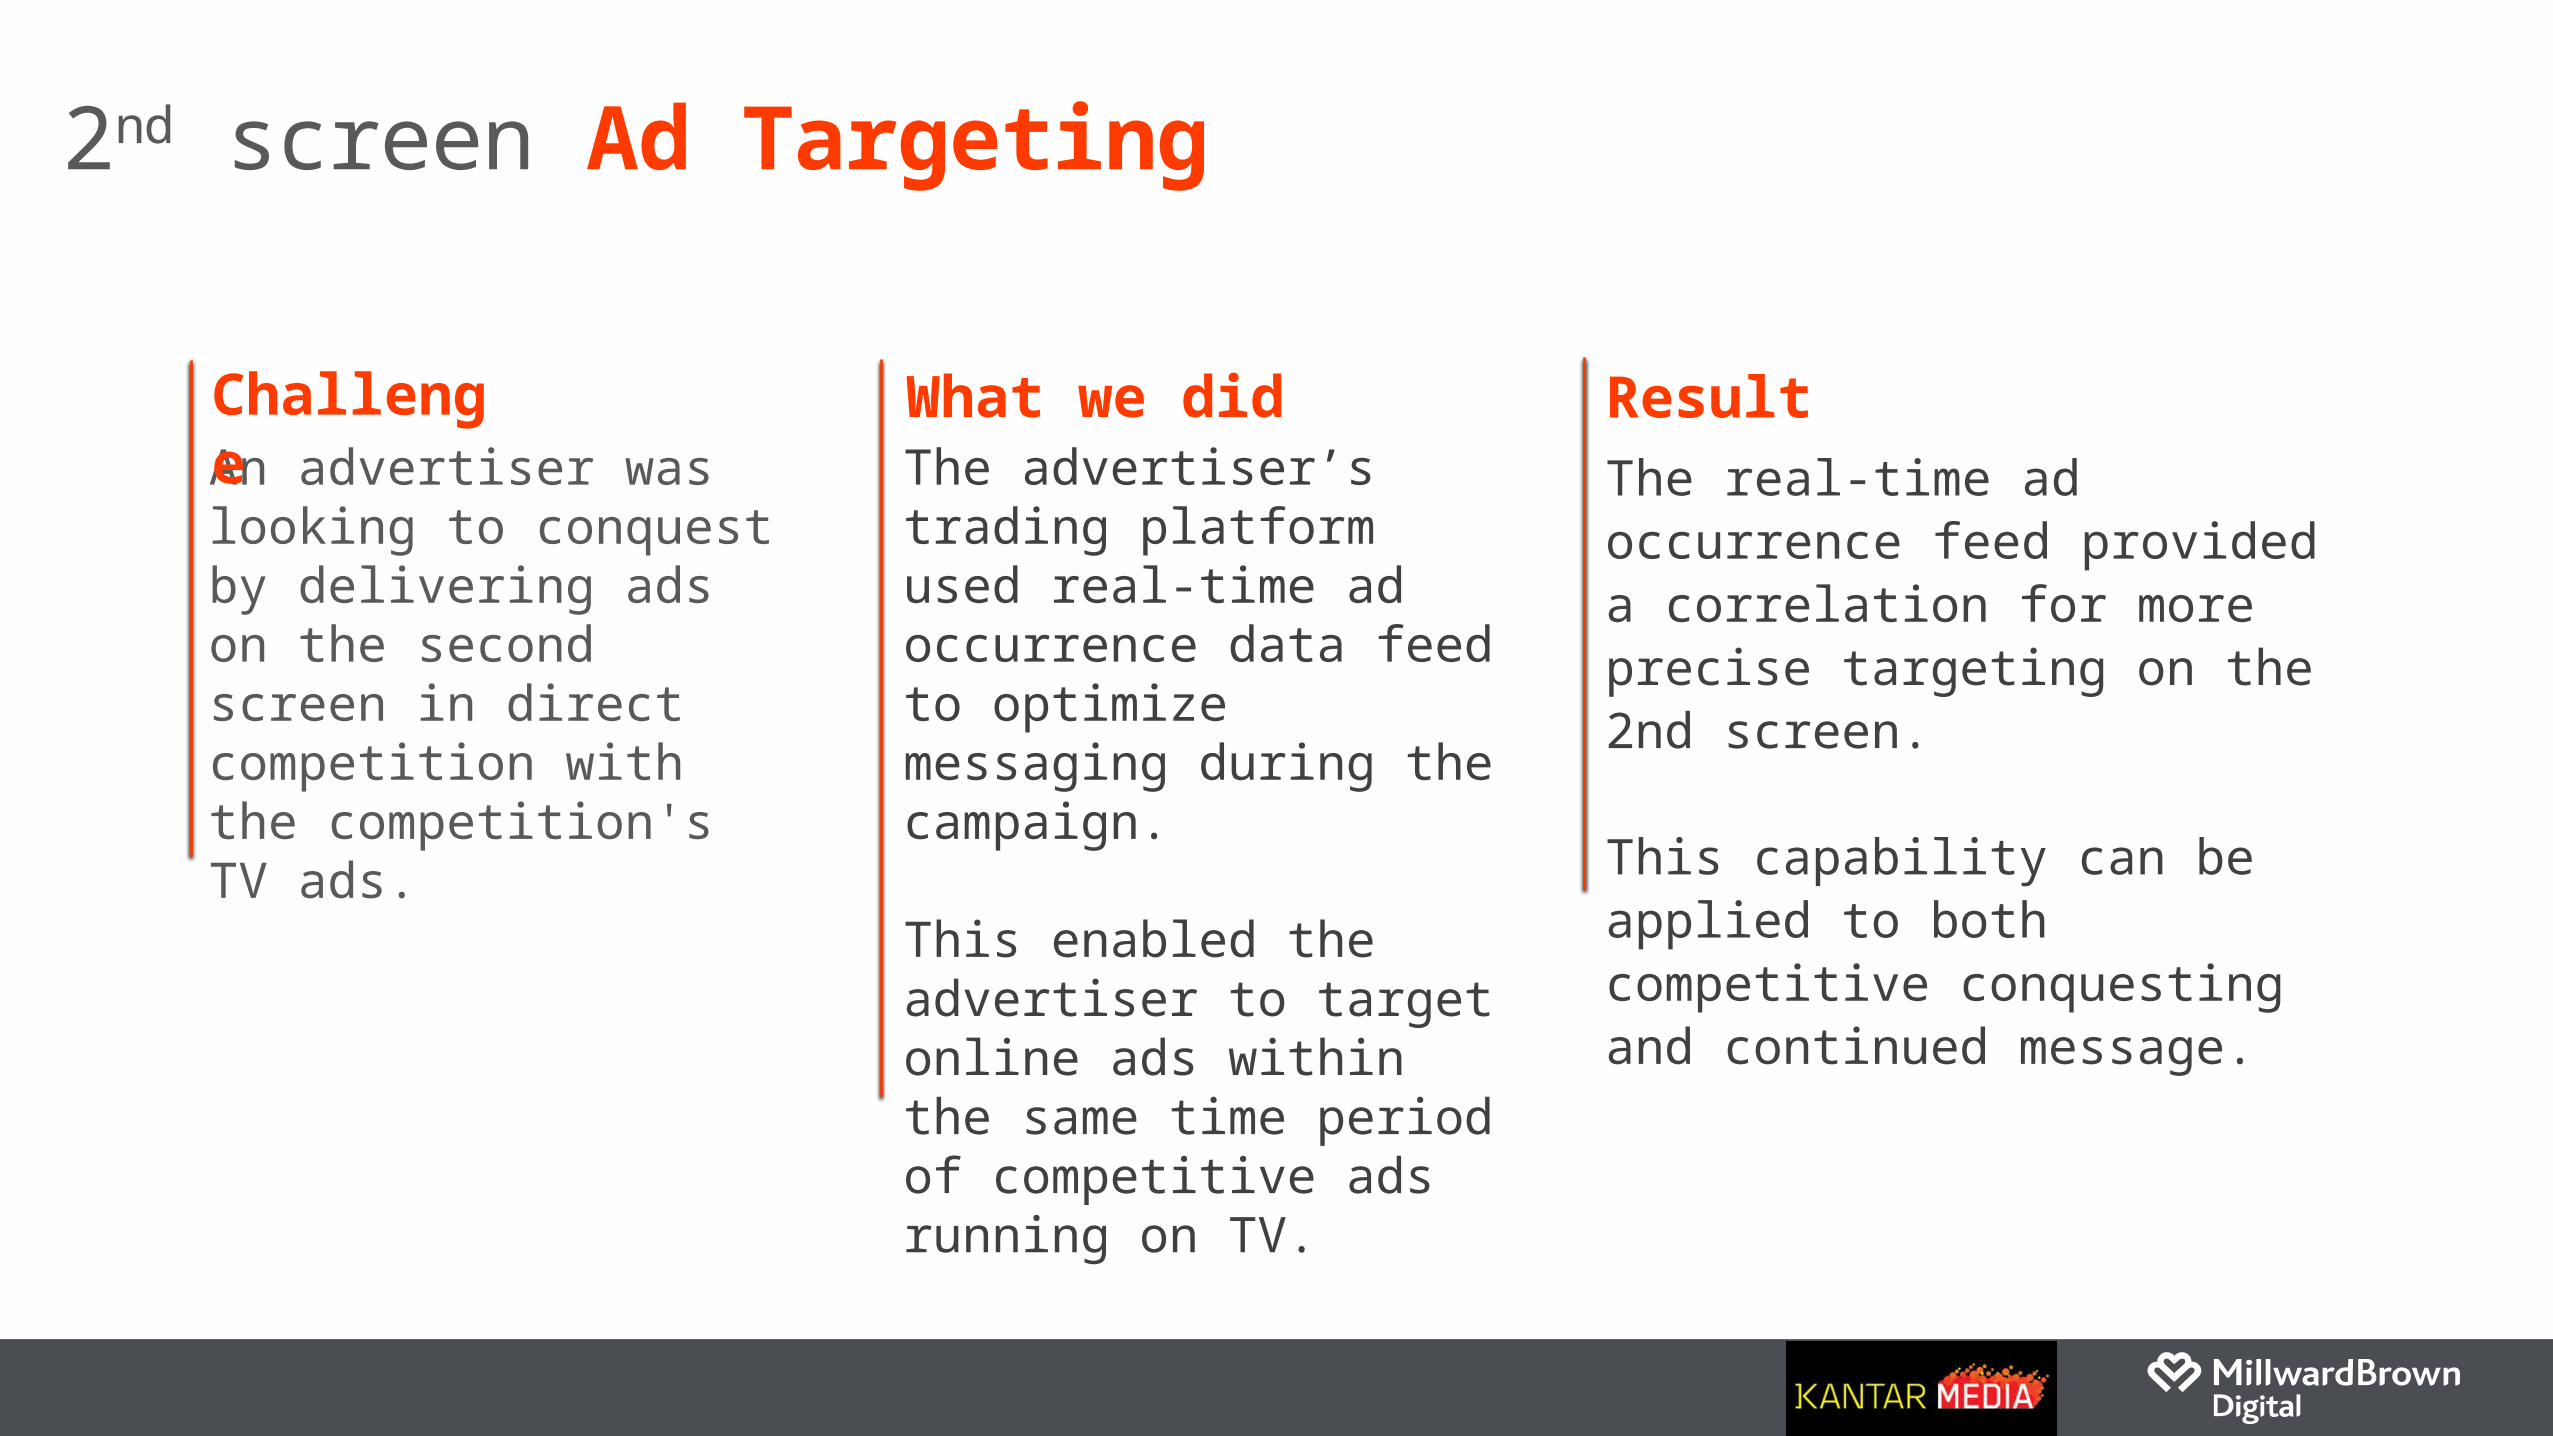
2nd screen Ad Targeting
An advertiser was looking to conquest by delivering ads on the second screen in direct competition with the competition's TV ads.
The advertiser’s trading platform used real-time ad occurrence data feed to optimize messaging during the campaign.
This enabled the advertiser to target online ads within the same time period of competitive ads running on TV.
The real-time ad occurrence feed provided a correlation for more precise targeting on the 2nd screen.
This capability can be applied to both competitive conquesting and continued message.
Challenge
What we did
Result
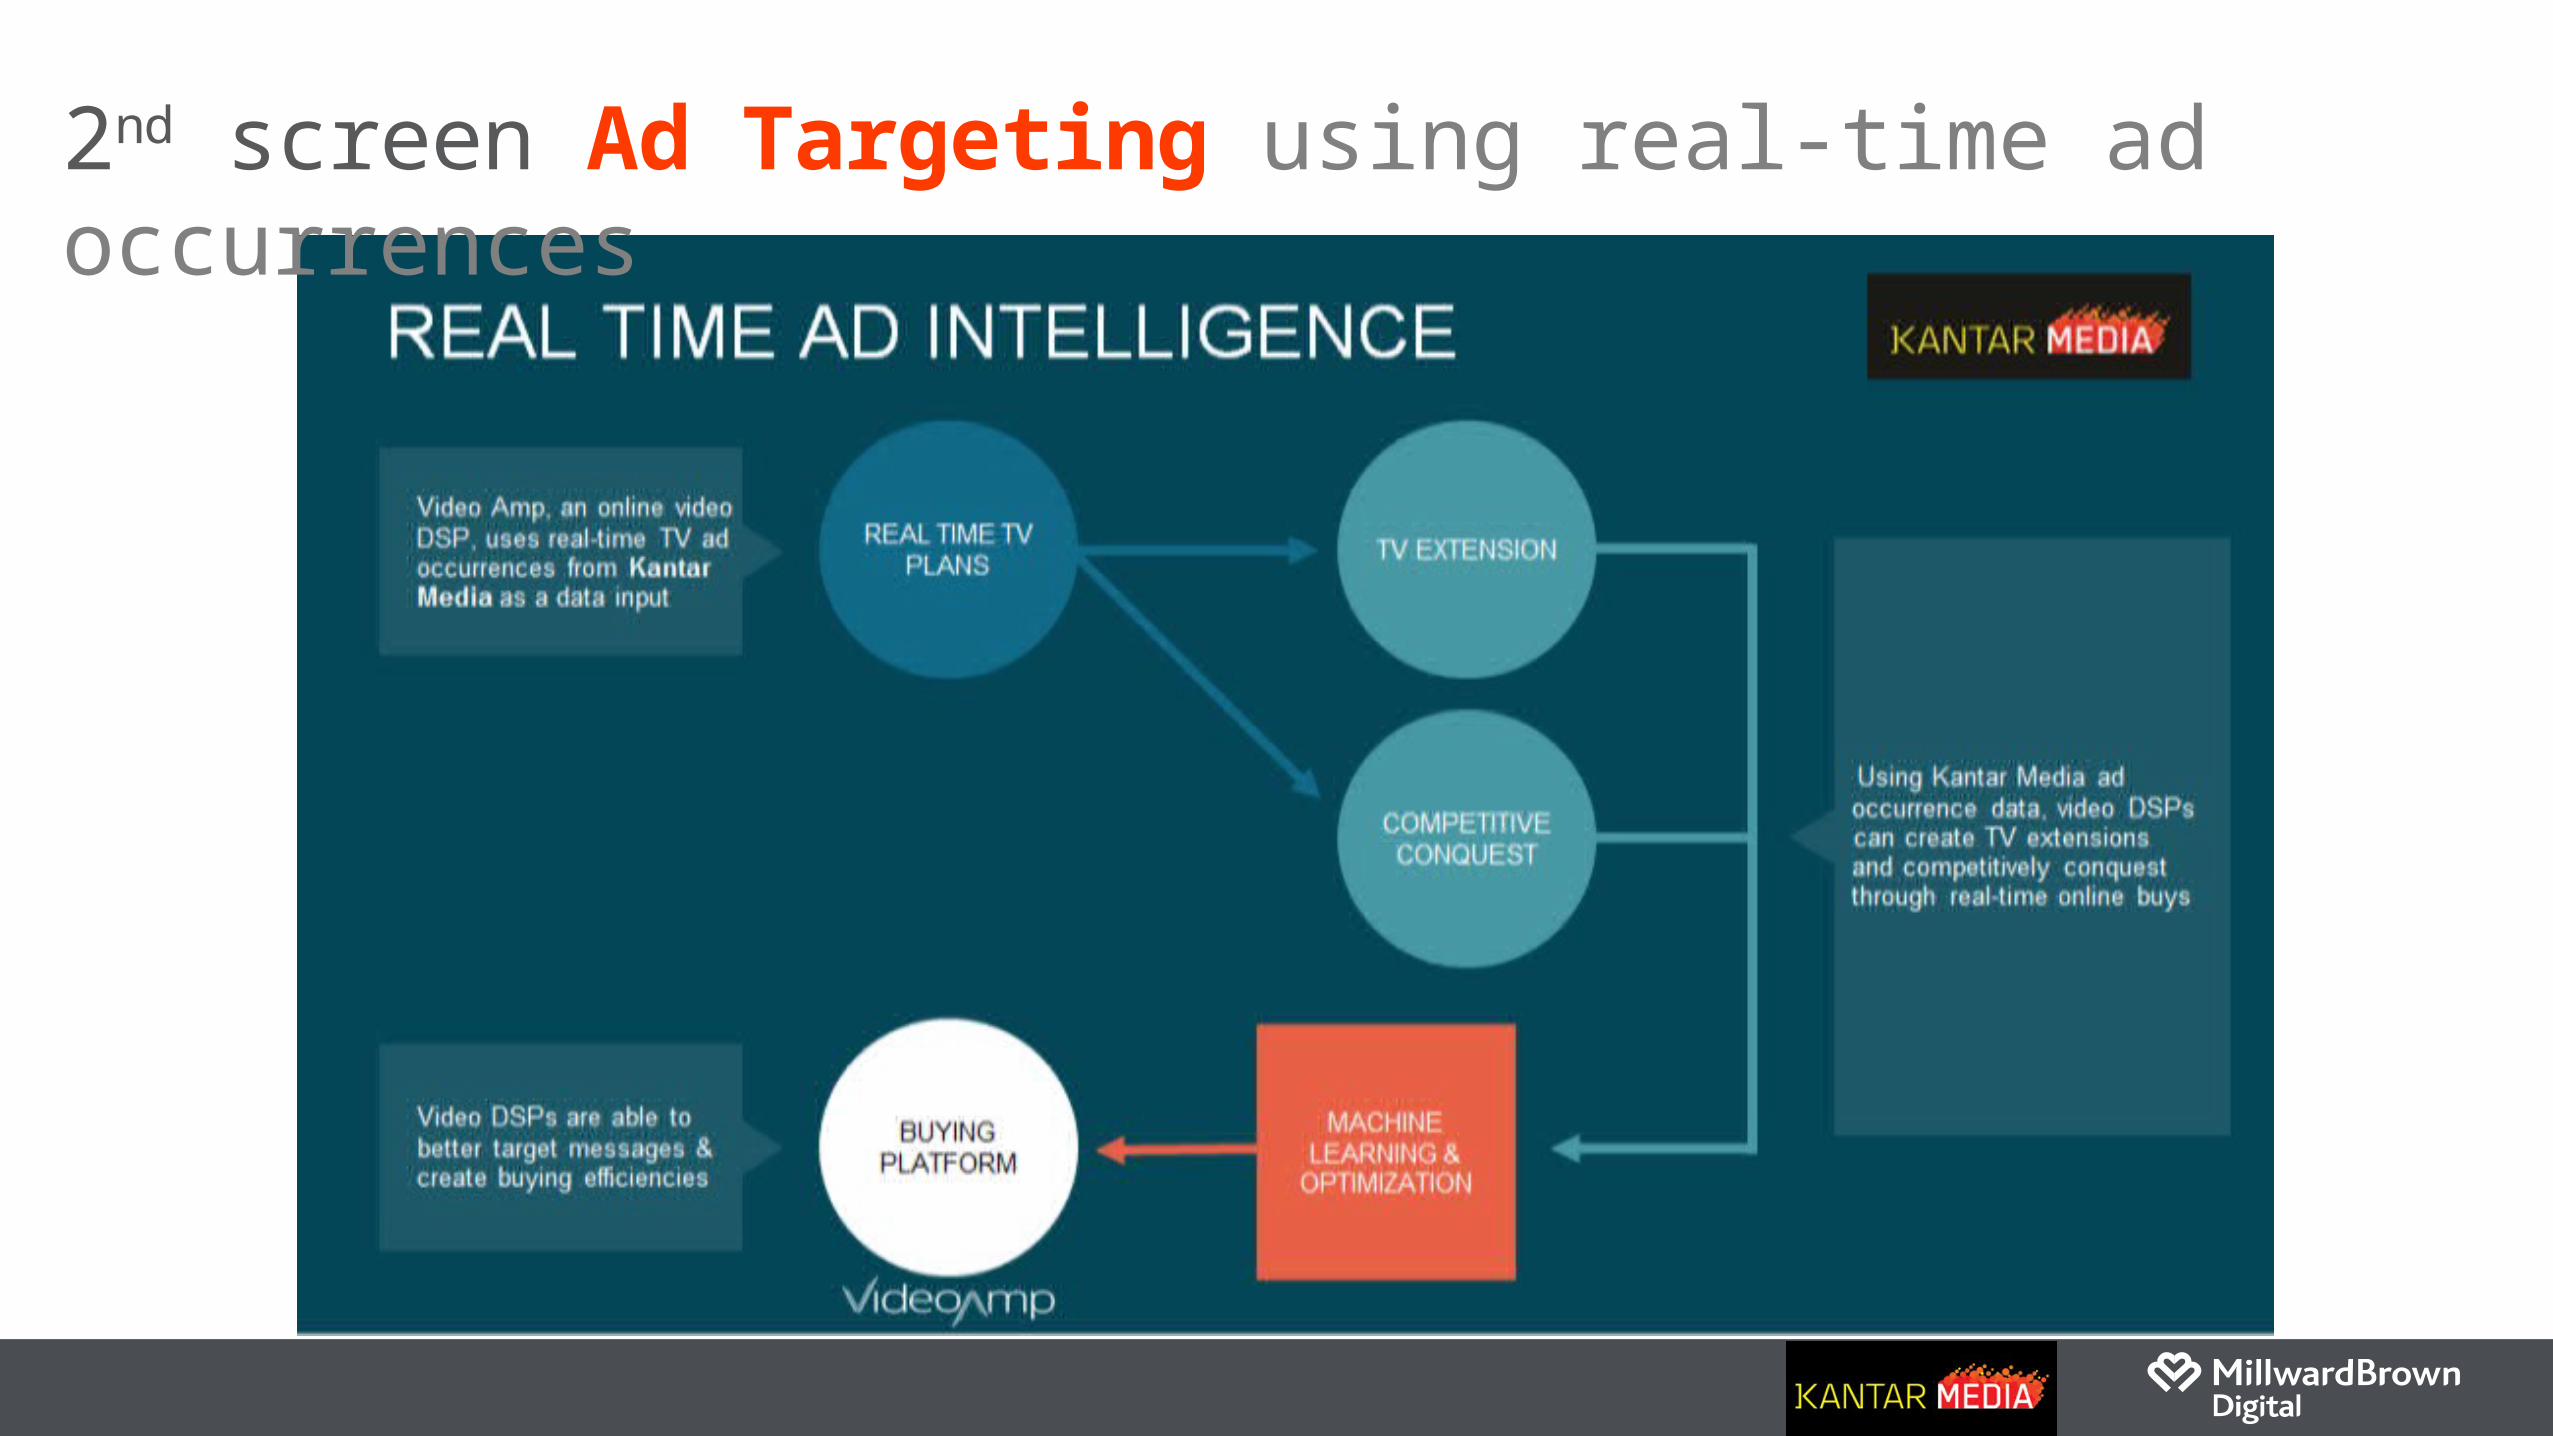
2nd screen Ad Targeting using real-time ad occurrences
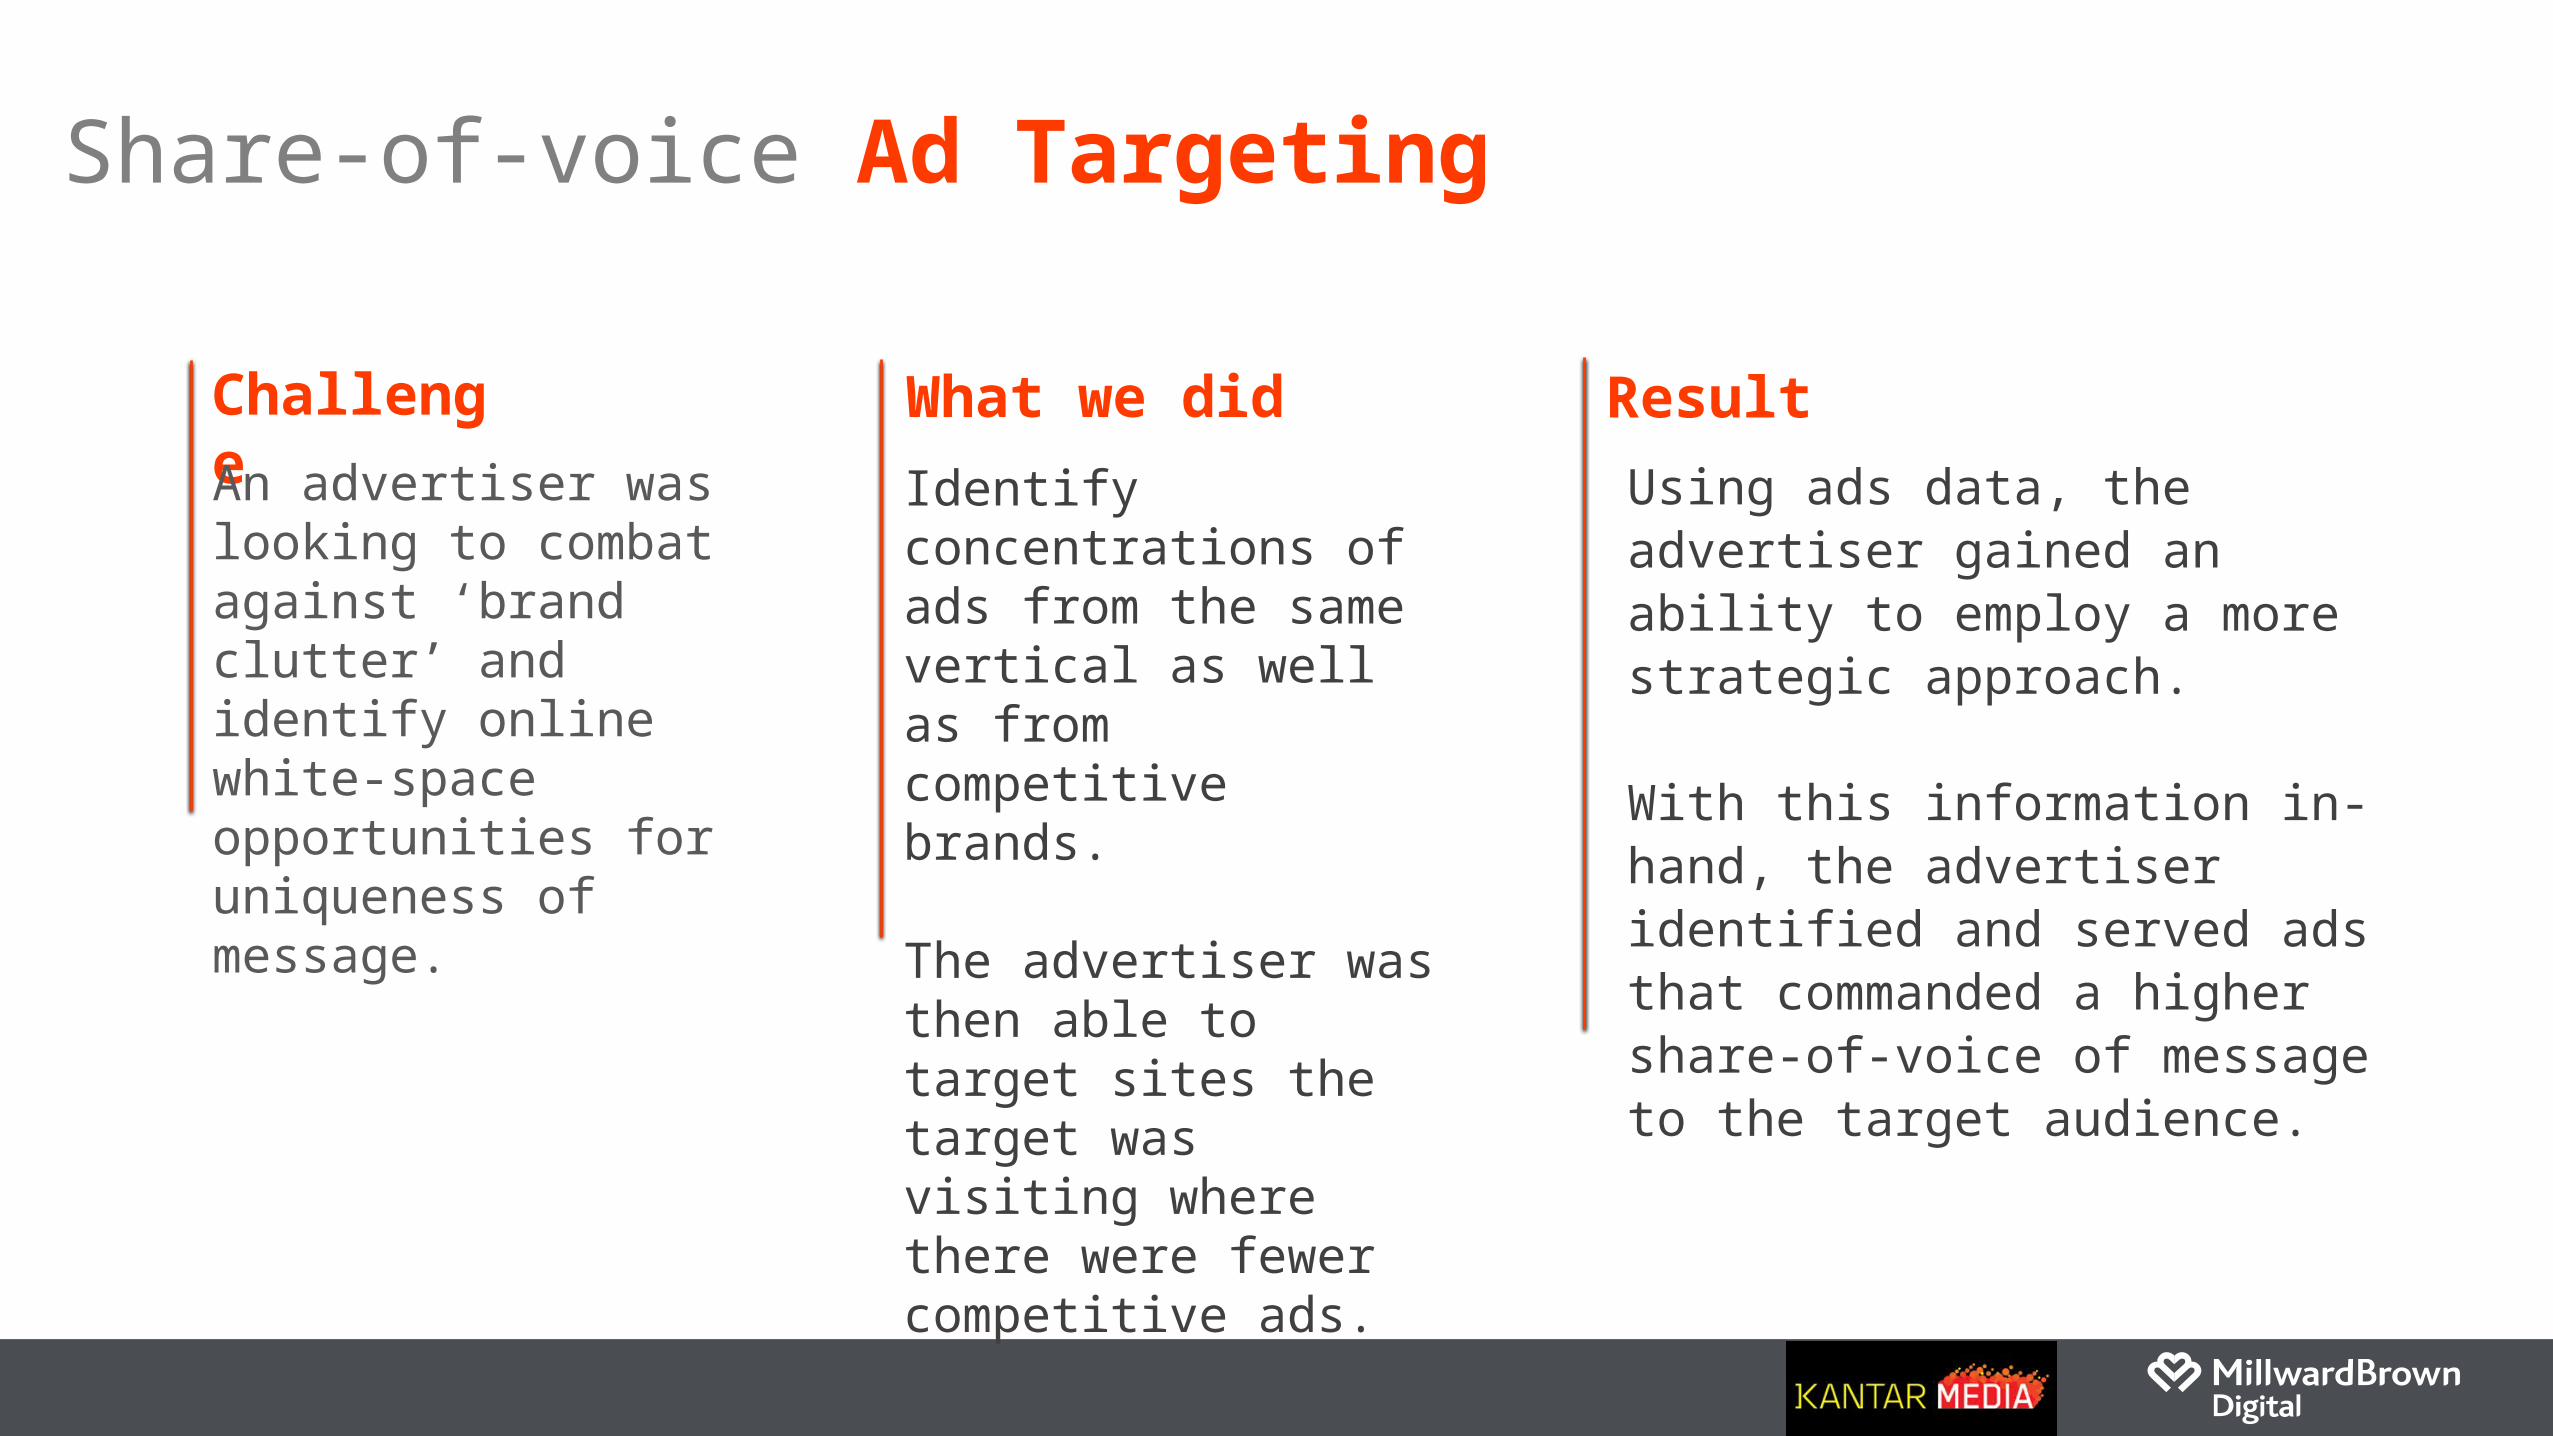
Share-of-voice Ad Targeting
ChallengeAn advertiser was looking to combat against ‘brand clutter’ and identify online white-space opportunities for uniqueness of message.
What we didIdentify concentrations of ads from the same vertical as well as from competitive brands.
The advertiser was then able to target sites the target was visiting where there were fewer competitive ads.
ResultUsing ads data, the advertiser gained an ability to employ a more strategic approach.
With this information in-hand, the advertiser identified and served ads that commanded a higher share-of-voice of message to the target audience.
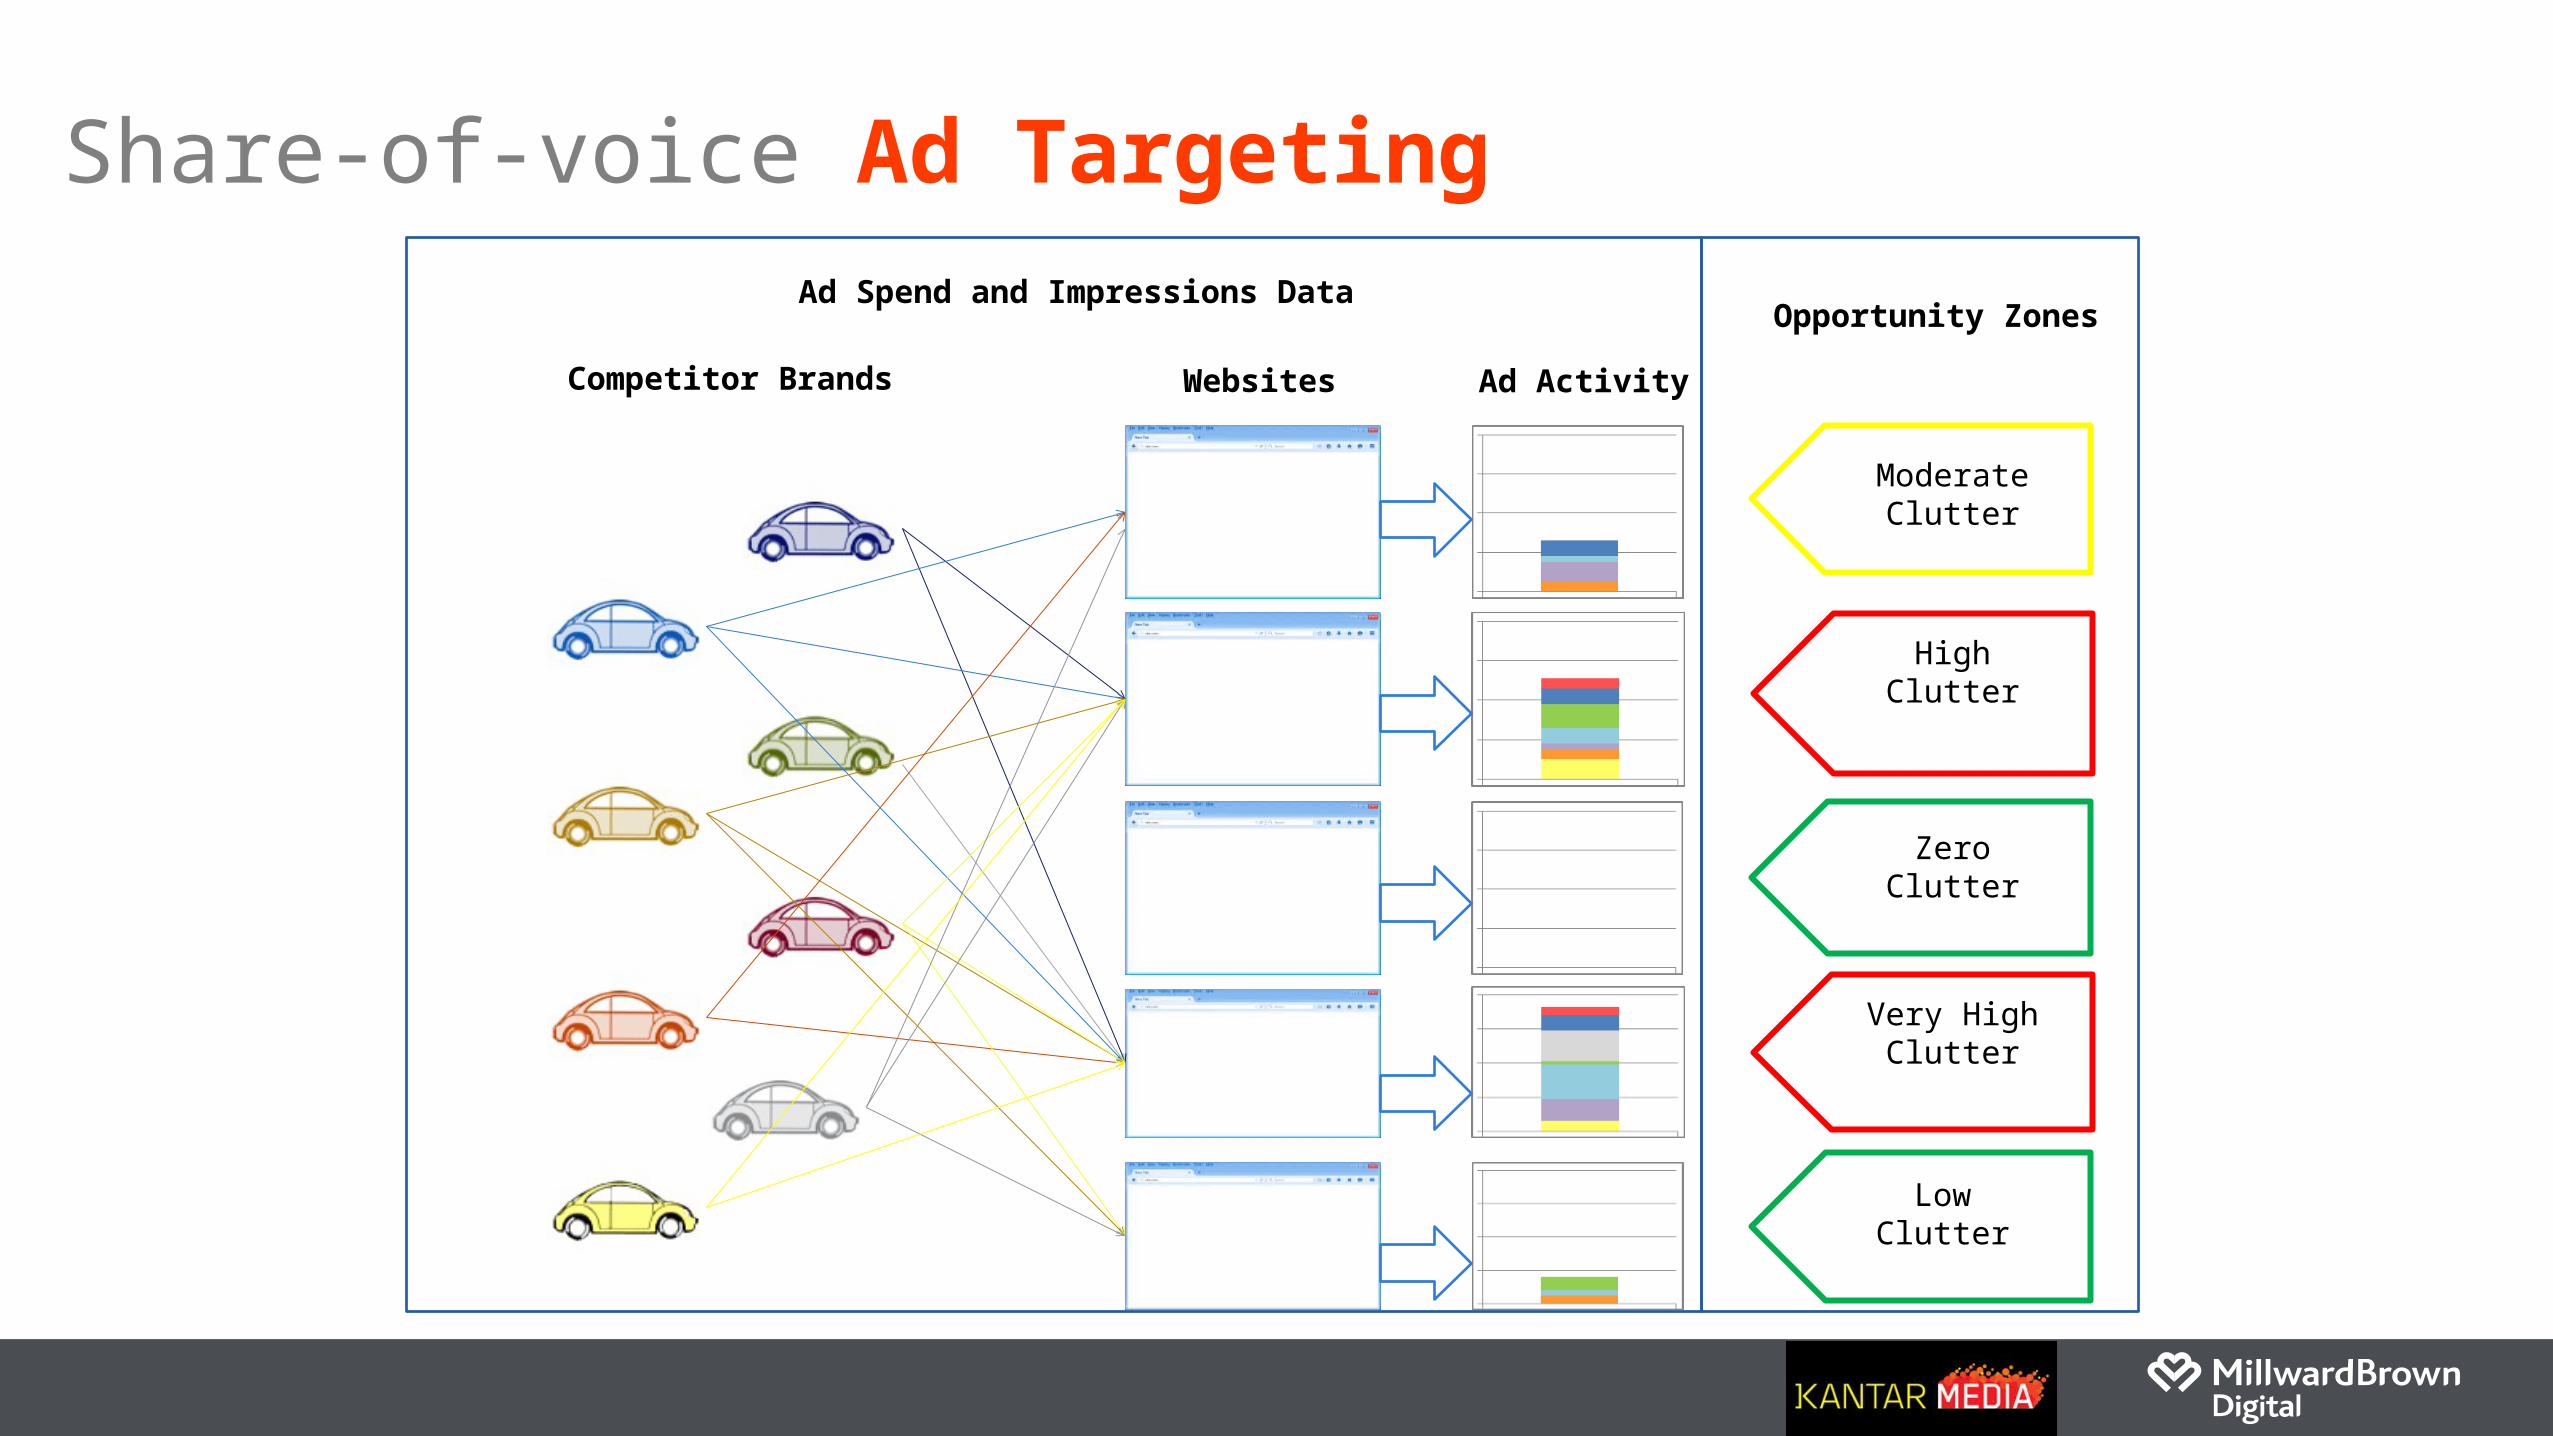
Share-of-voice Ad Targeting
Competitor Brands Websites Ad Activity
Opportunity Zones
ModerateClutter
HighClutter
ZeroClutter
Very HighClutter
LowClutter
Ad Spend and Impressions Data

Reaching the Dynamic Consumer in an Evolving Digital Landscape
(c) 2015 Millward Brown Digital. Source: Millward Brown Digital’s Demystifying the Consumer Journey study, 2015.
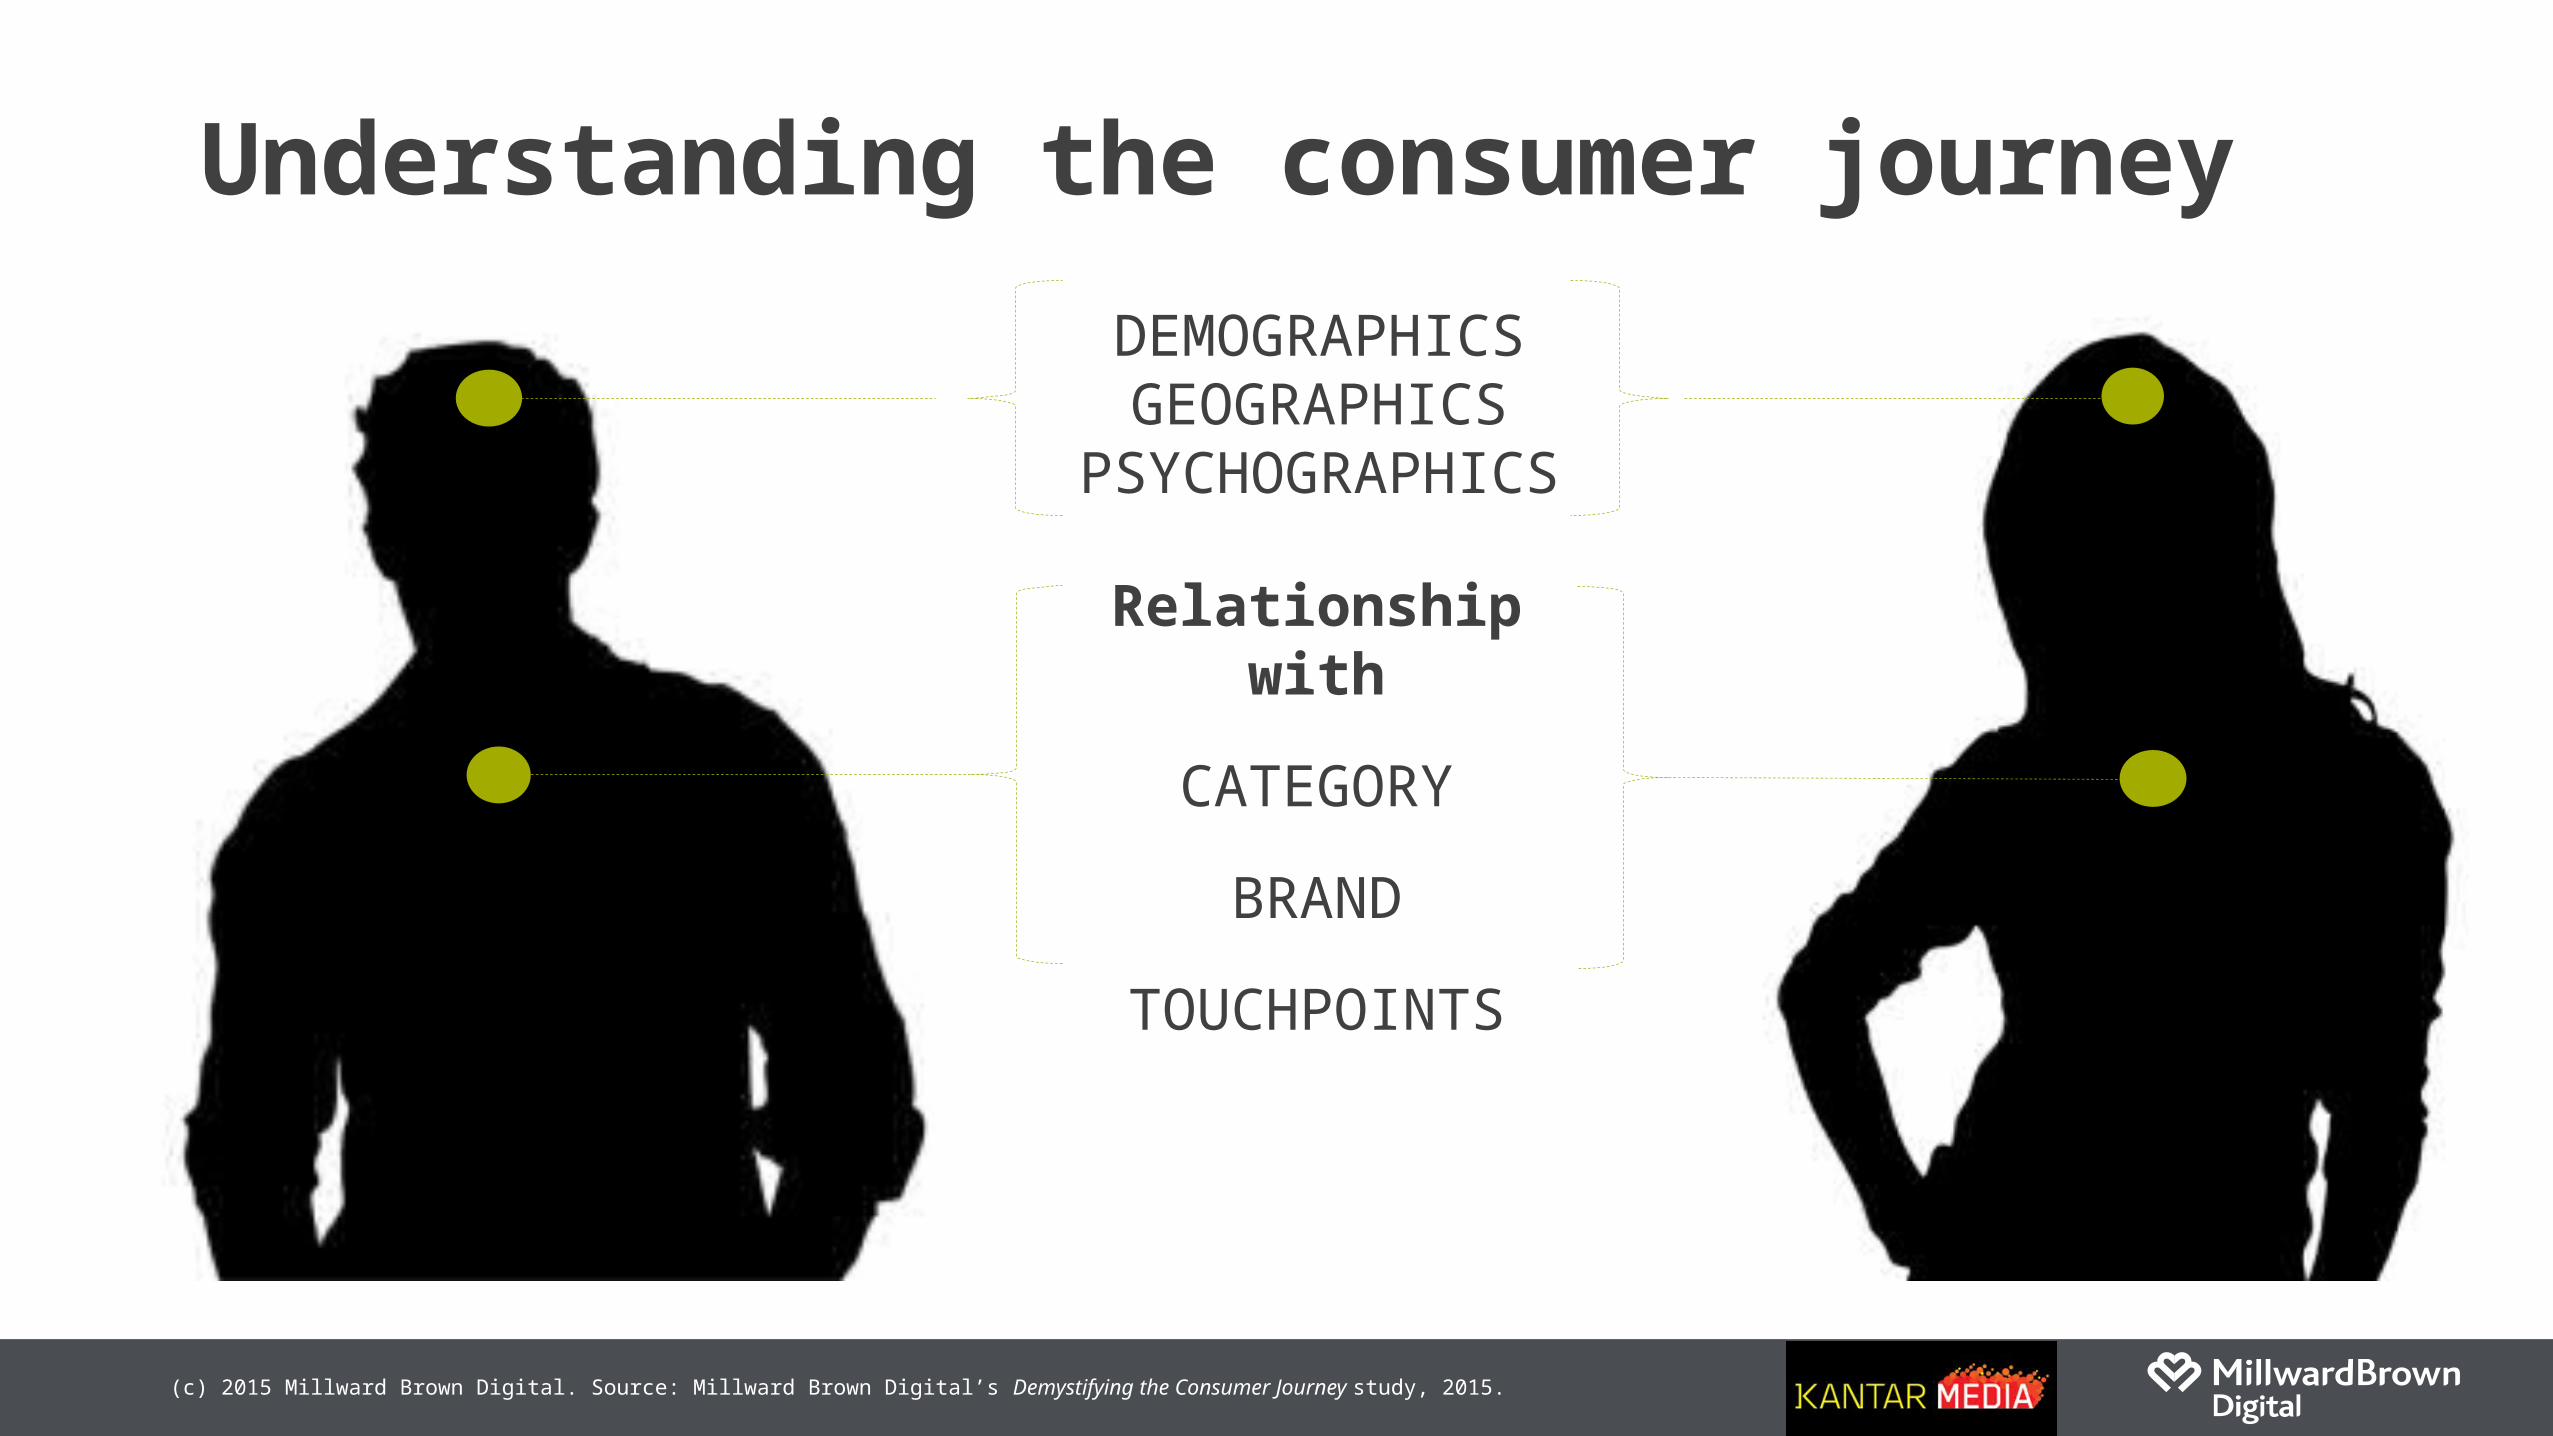
Understanding the consumer journeyDEMOGRAPHICSGEOGRAPHICS
PSYCHOGRAPHICS
Relationship with
CATEGORY
BRAND
TOUCHPOINTS
(c) 2015 Millward Brown Digital. Source: Millward Brown Digital’s Demystifying the Consumer Journey study, 2015.
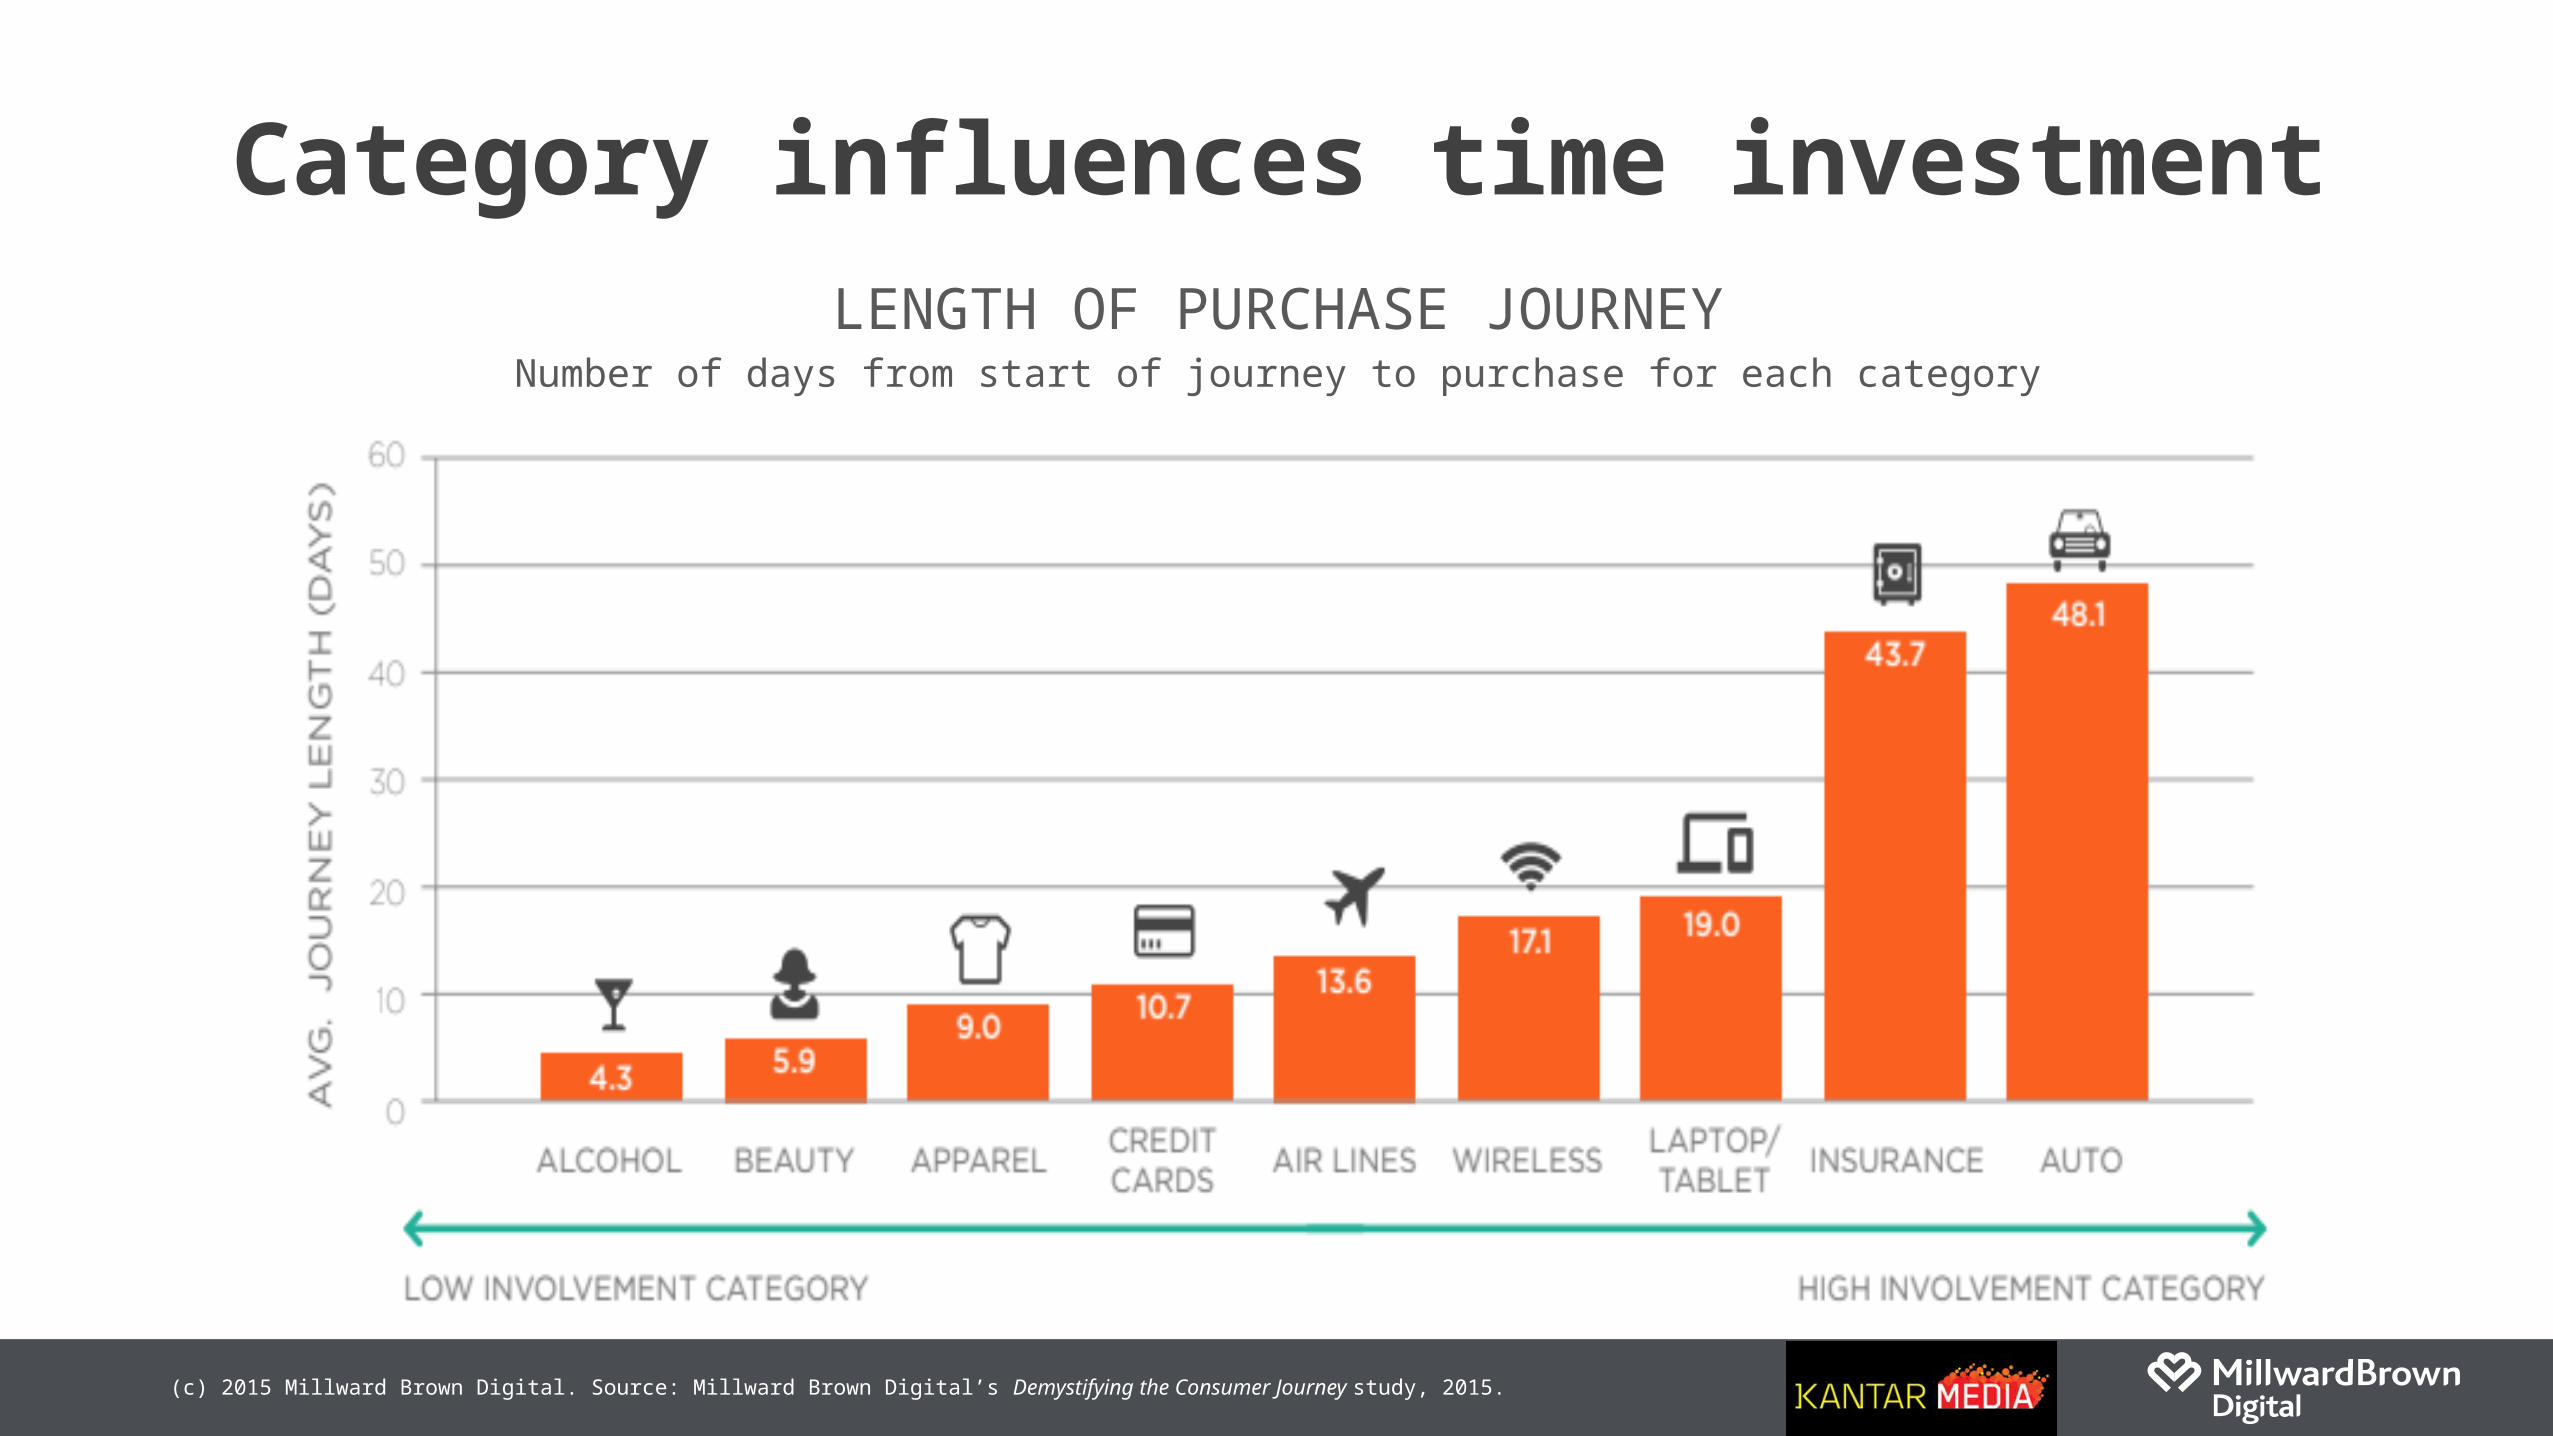
Category influences time investmentLENGTH OF PURCHASE JOURNEY
Number of days from start of journey to purchase for each category
(c) 2015 Millward Brown Digital. Source: Millward Brown Digital’s Getting Audiences Right study, 2015.
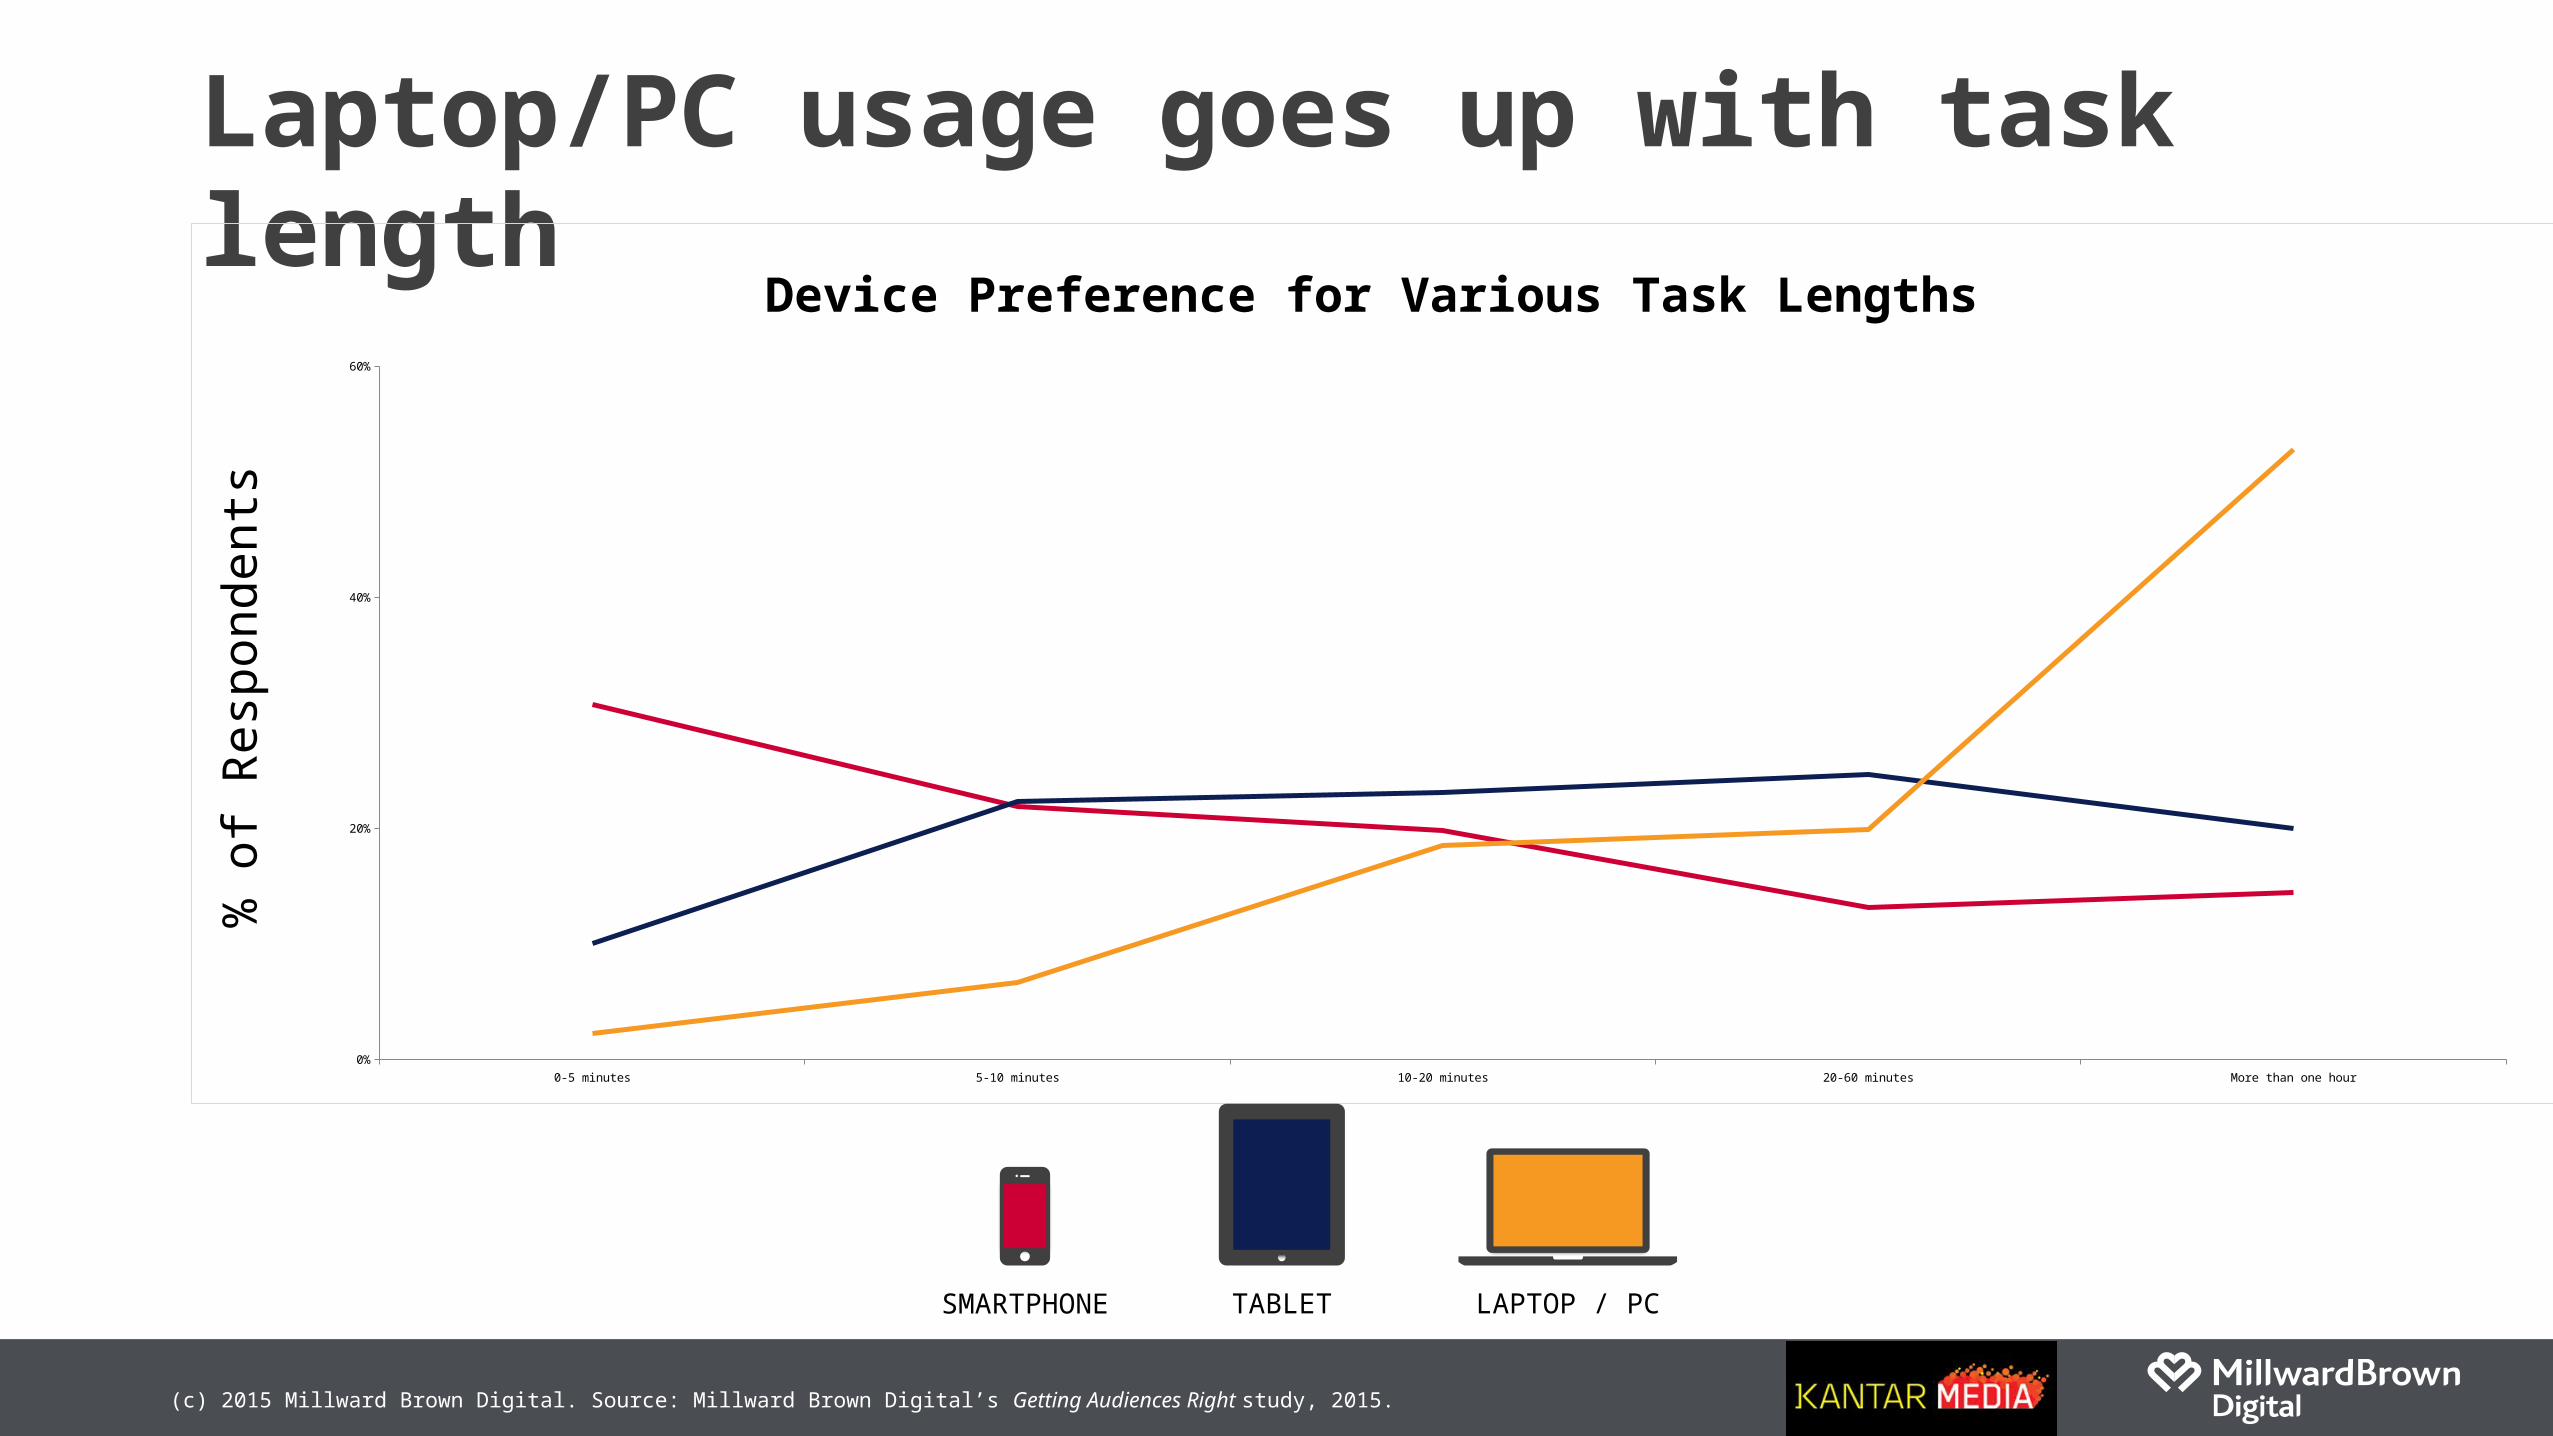
Laptop/PC usage goes up with task length
0-5 minutes 5-10 minutes 10-20 minutes 20-60 minutes More than one hour0%
20%
40%
60%
Device Preference for Various Task Lengths%
of R
espo
nden
ts
LAPTOP / PCSMARTPHONE TABLET
(c) 2015 Millward Brown Digital. Source: Millward Brown Digital’s Compete Clickstream panel; laptop/desktop unique visitors.
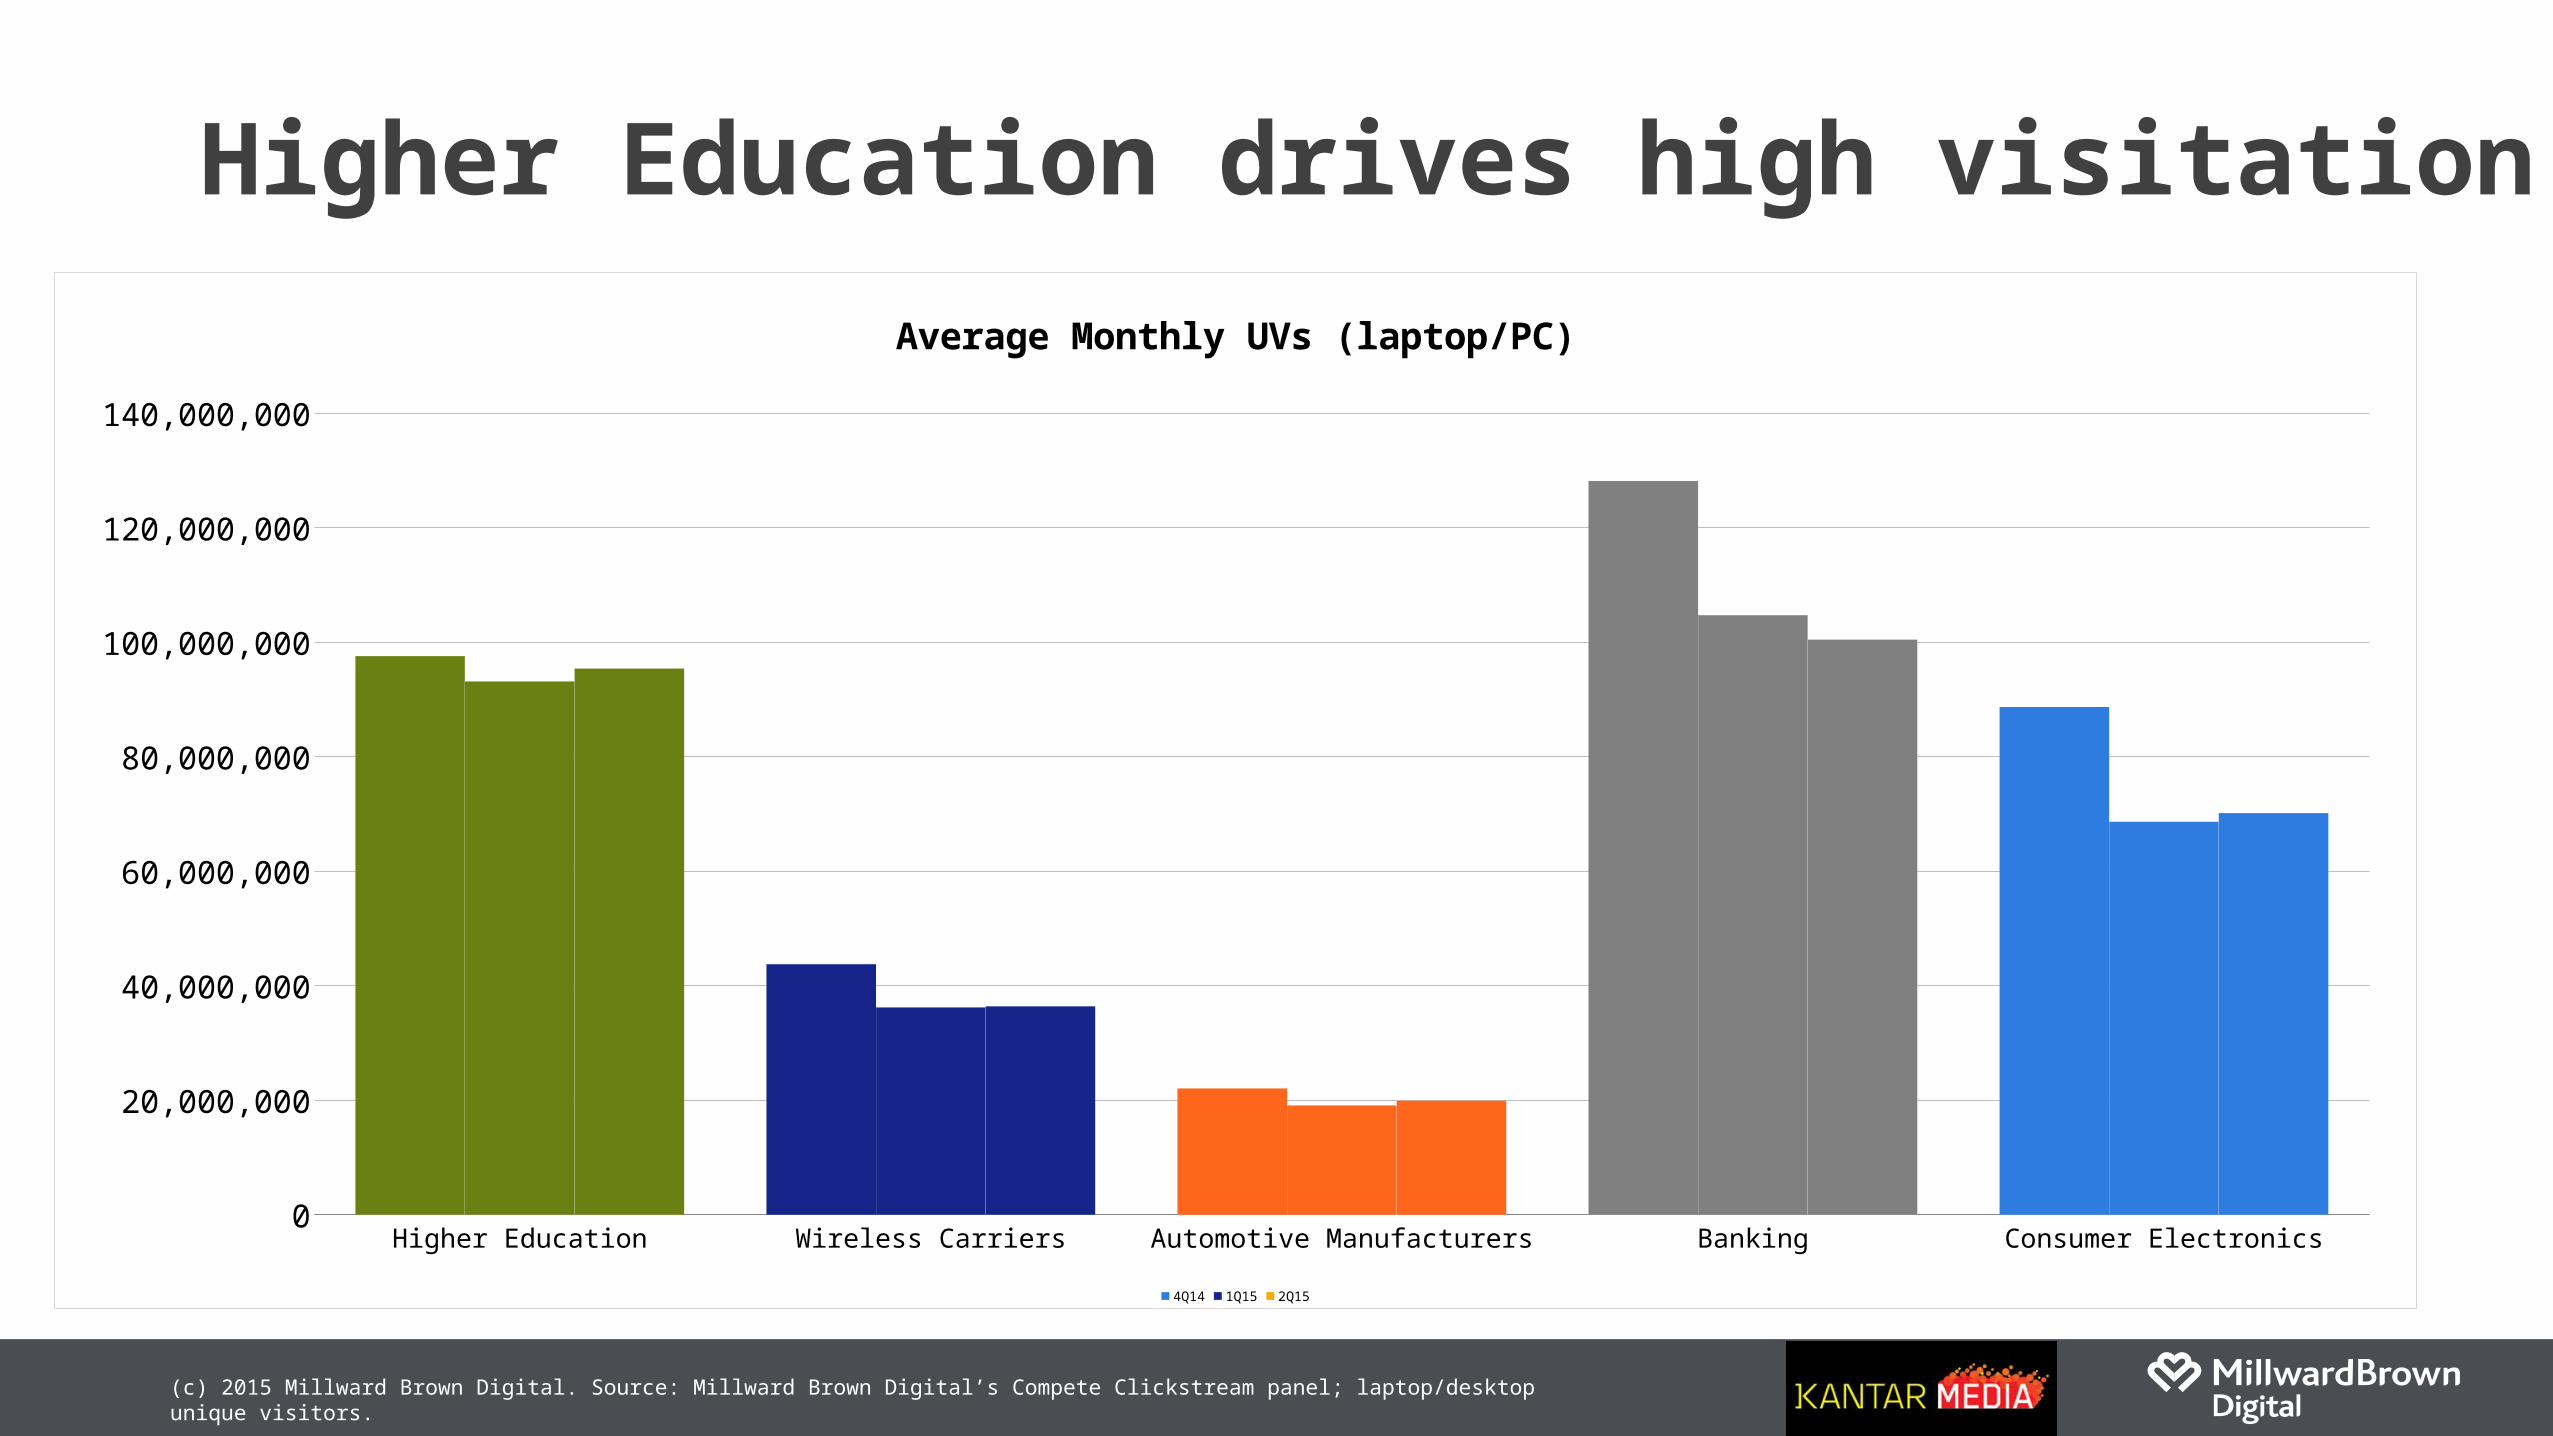
Higher Education drives high visitation
Higher Education Wireless Carriers Automotive Manufacturers Banking Consumer Electronics0
20,000,000
40,000,000
60,000,000
80,000,000
100,000,000
120,000,000
140,000,000
Average Monthly UVs (laptop/PC)
4Q14 1Q15 2Q15
(c) 2015 Millward Brown Digital. Source: Millward Brown Digital’s Compete Clickstream panel; top sites for Higher Education behavioral segment (includes Colleges & Universities, Financial Aid, Online Courses, Student Resources.
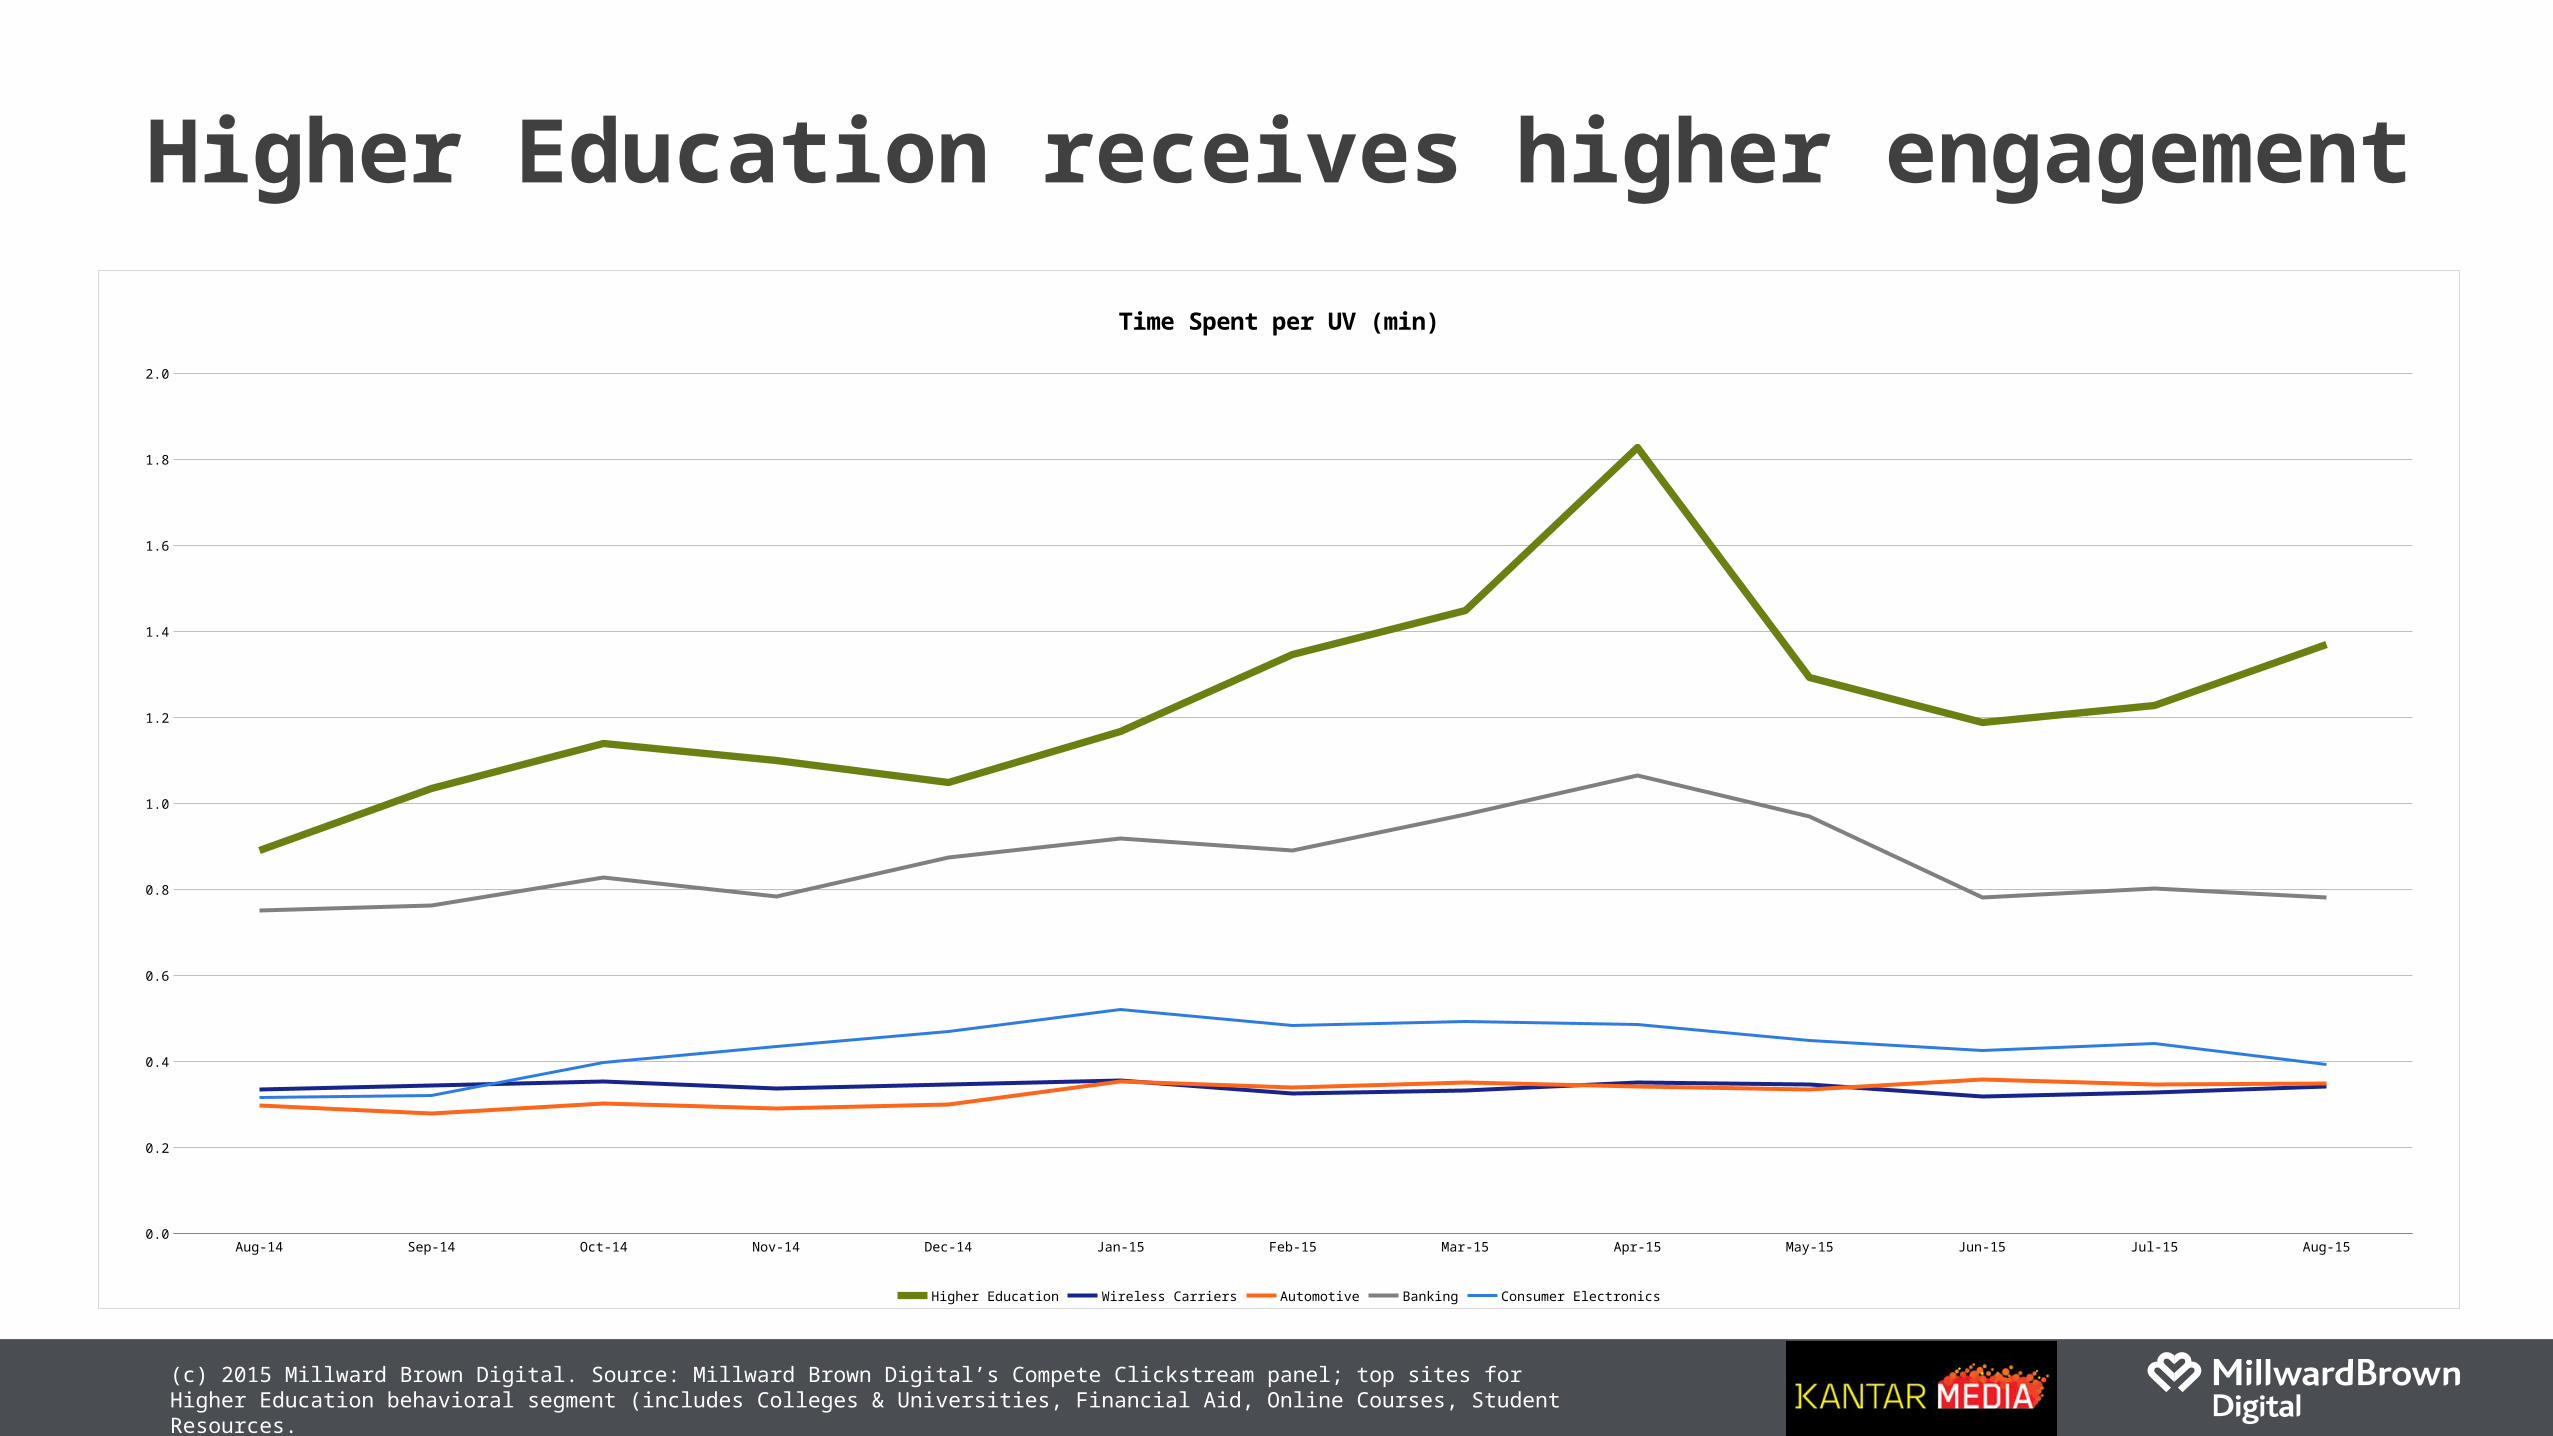
Higher Education receives higher engagement
Aug-14 Sep-14 Oct-14 Nov-14 Dec-14 Jan-15 Feb-15 Mar-15 Apr-15 May-15 Jun-15 Jul-15 Aug-150.0
0.2
0.4
0.6
0.8
1.0
1.2
1.4
1.6
1.8
2.0
Time Spent per UV (min)
Higher Education Wireless Carriers Automotive Banking Consumer Electronics
(c) 2015 Millward Brown Digital. Source: Millward Brown Digital’s Compete Clickstream panel; top sites for Higher Education behavioral segment (includes Colleges & Universities, Financial Aid, Online Courses, Student Resources.
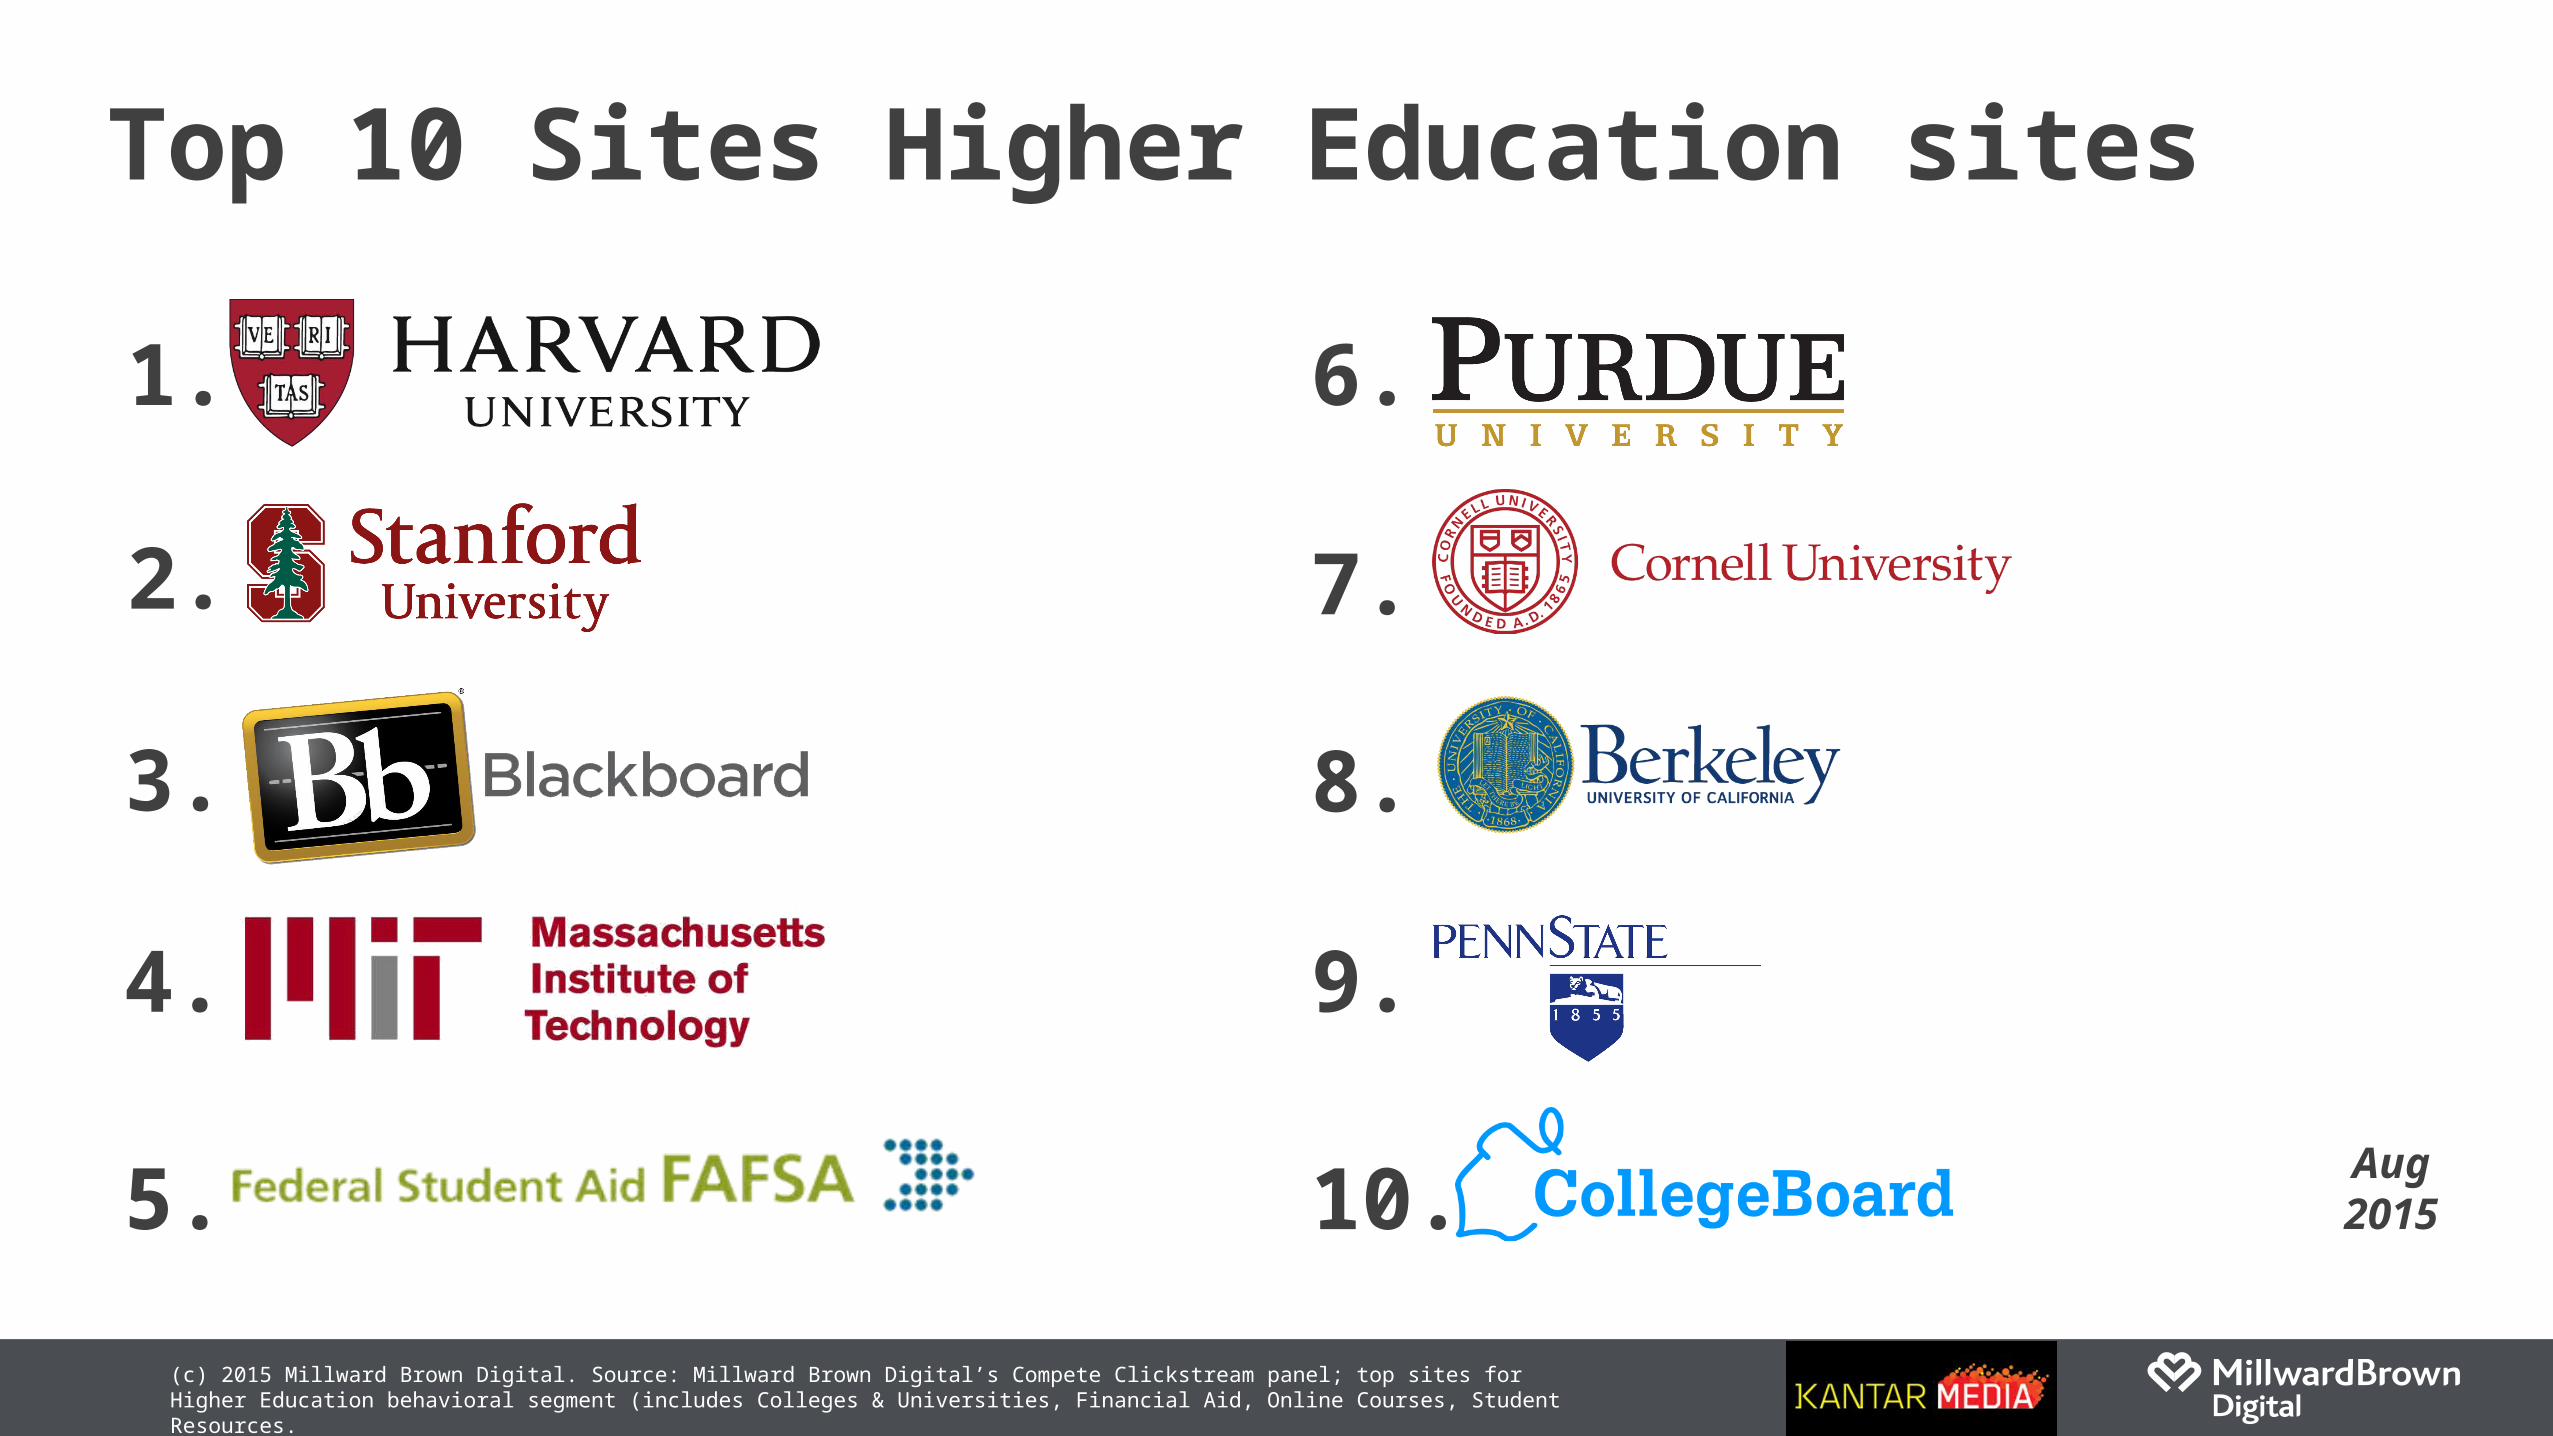
Top 10 Sites Higher Education sites
1.
2.
3.
4.
5.
6.
7.
8.
9.
10. Aug2015
Optimize through better measurement
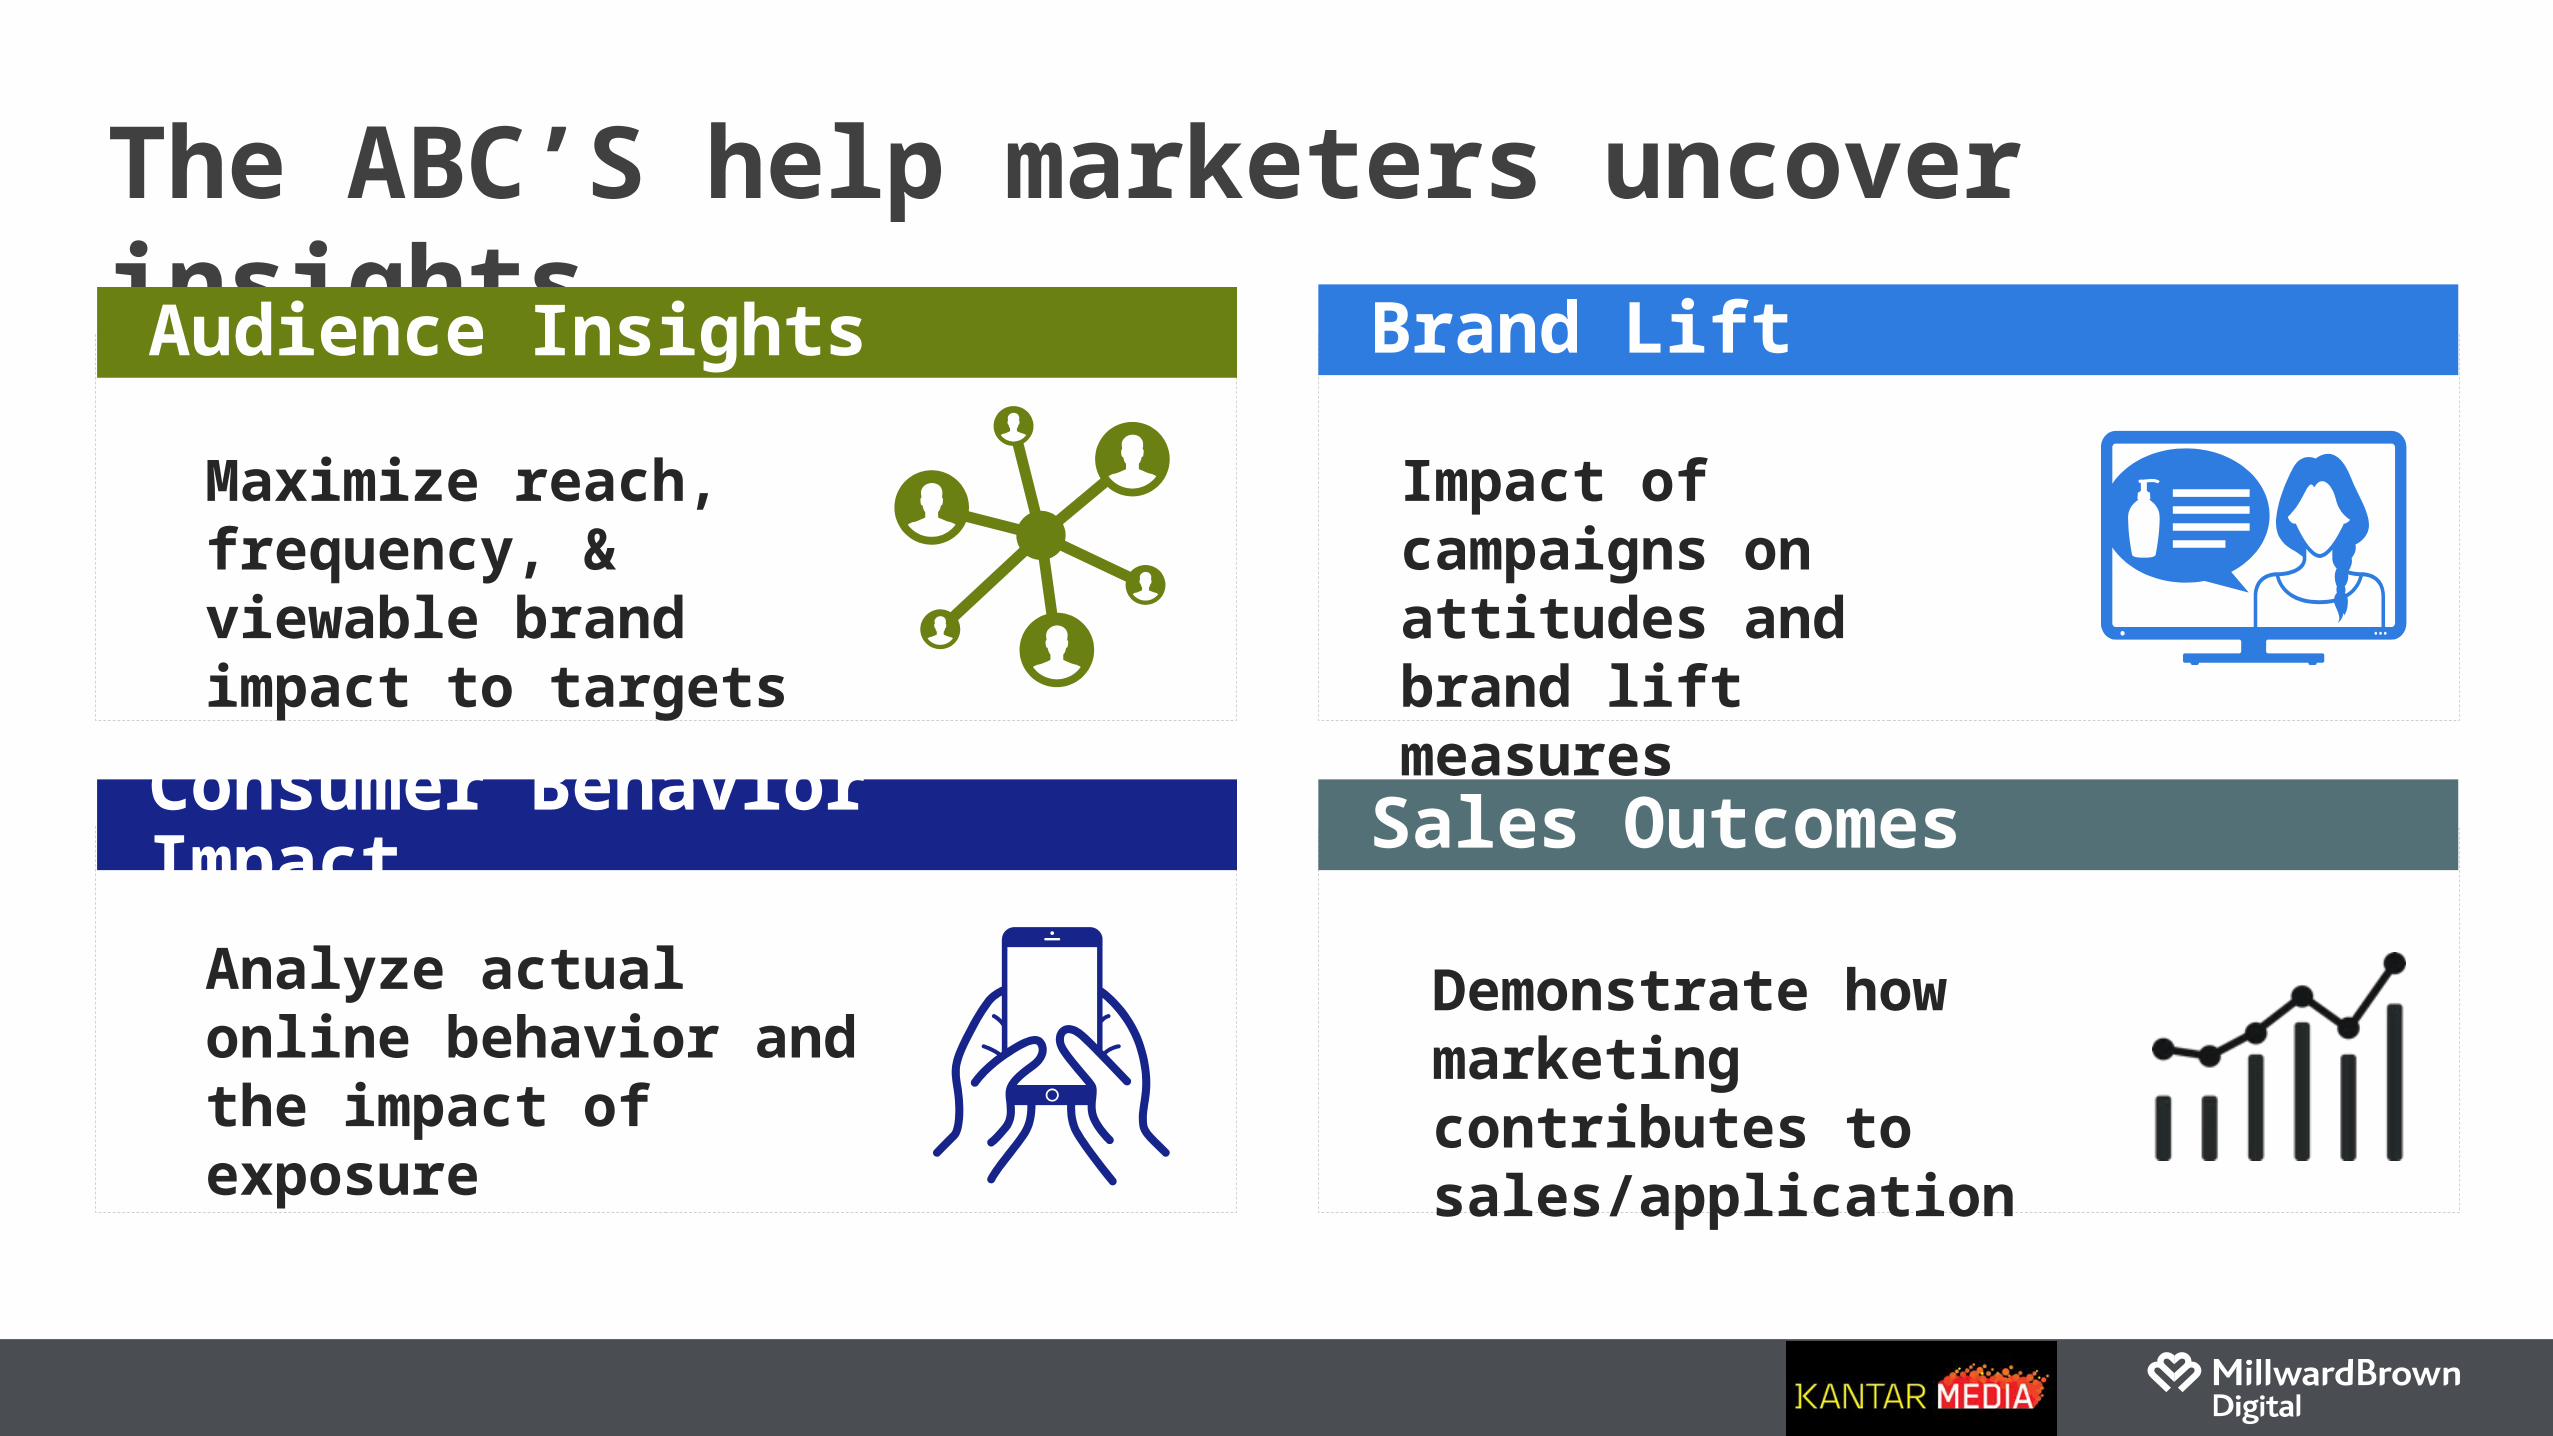
The ABC’S help marketers uncover insights
Maximize reach, frequency, & viewable brand impact to targets
Audience Insights
Impact of campaigns on attitudes and brand lift measures
Brand Lift
Demonstrate how marketing contributes to sales/application
Sales Outcomes
Analyze actual online behavior and the impact of exposure
Consumer Behavior Impact
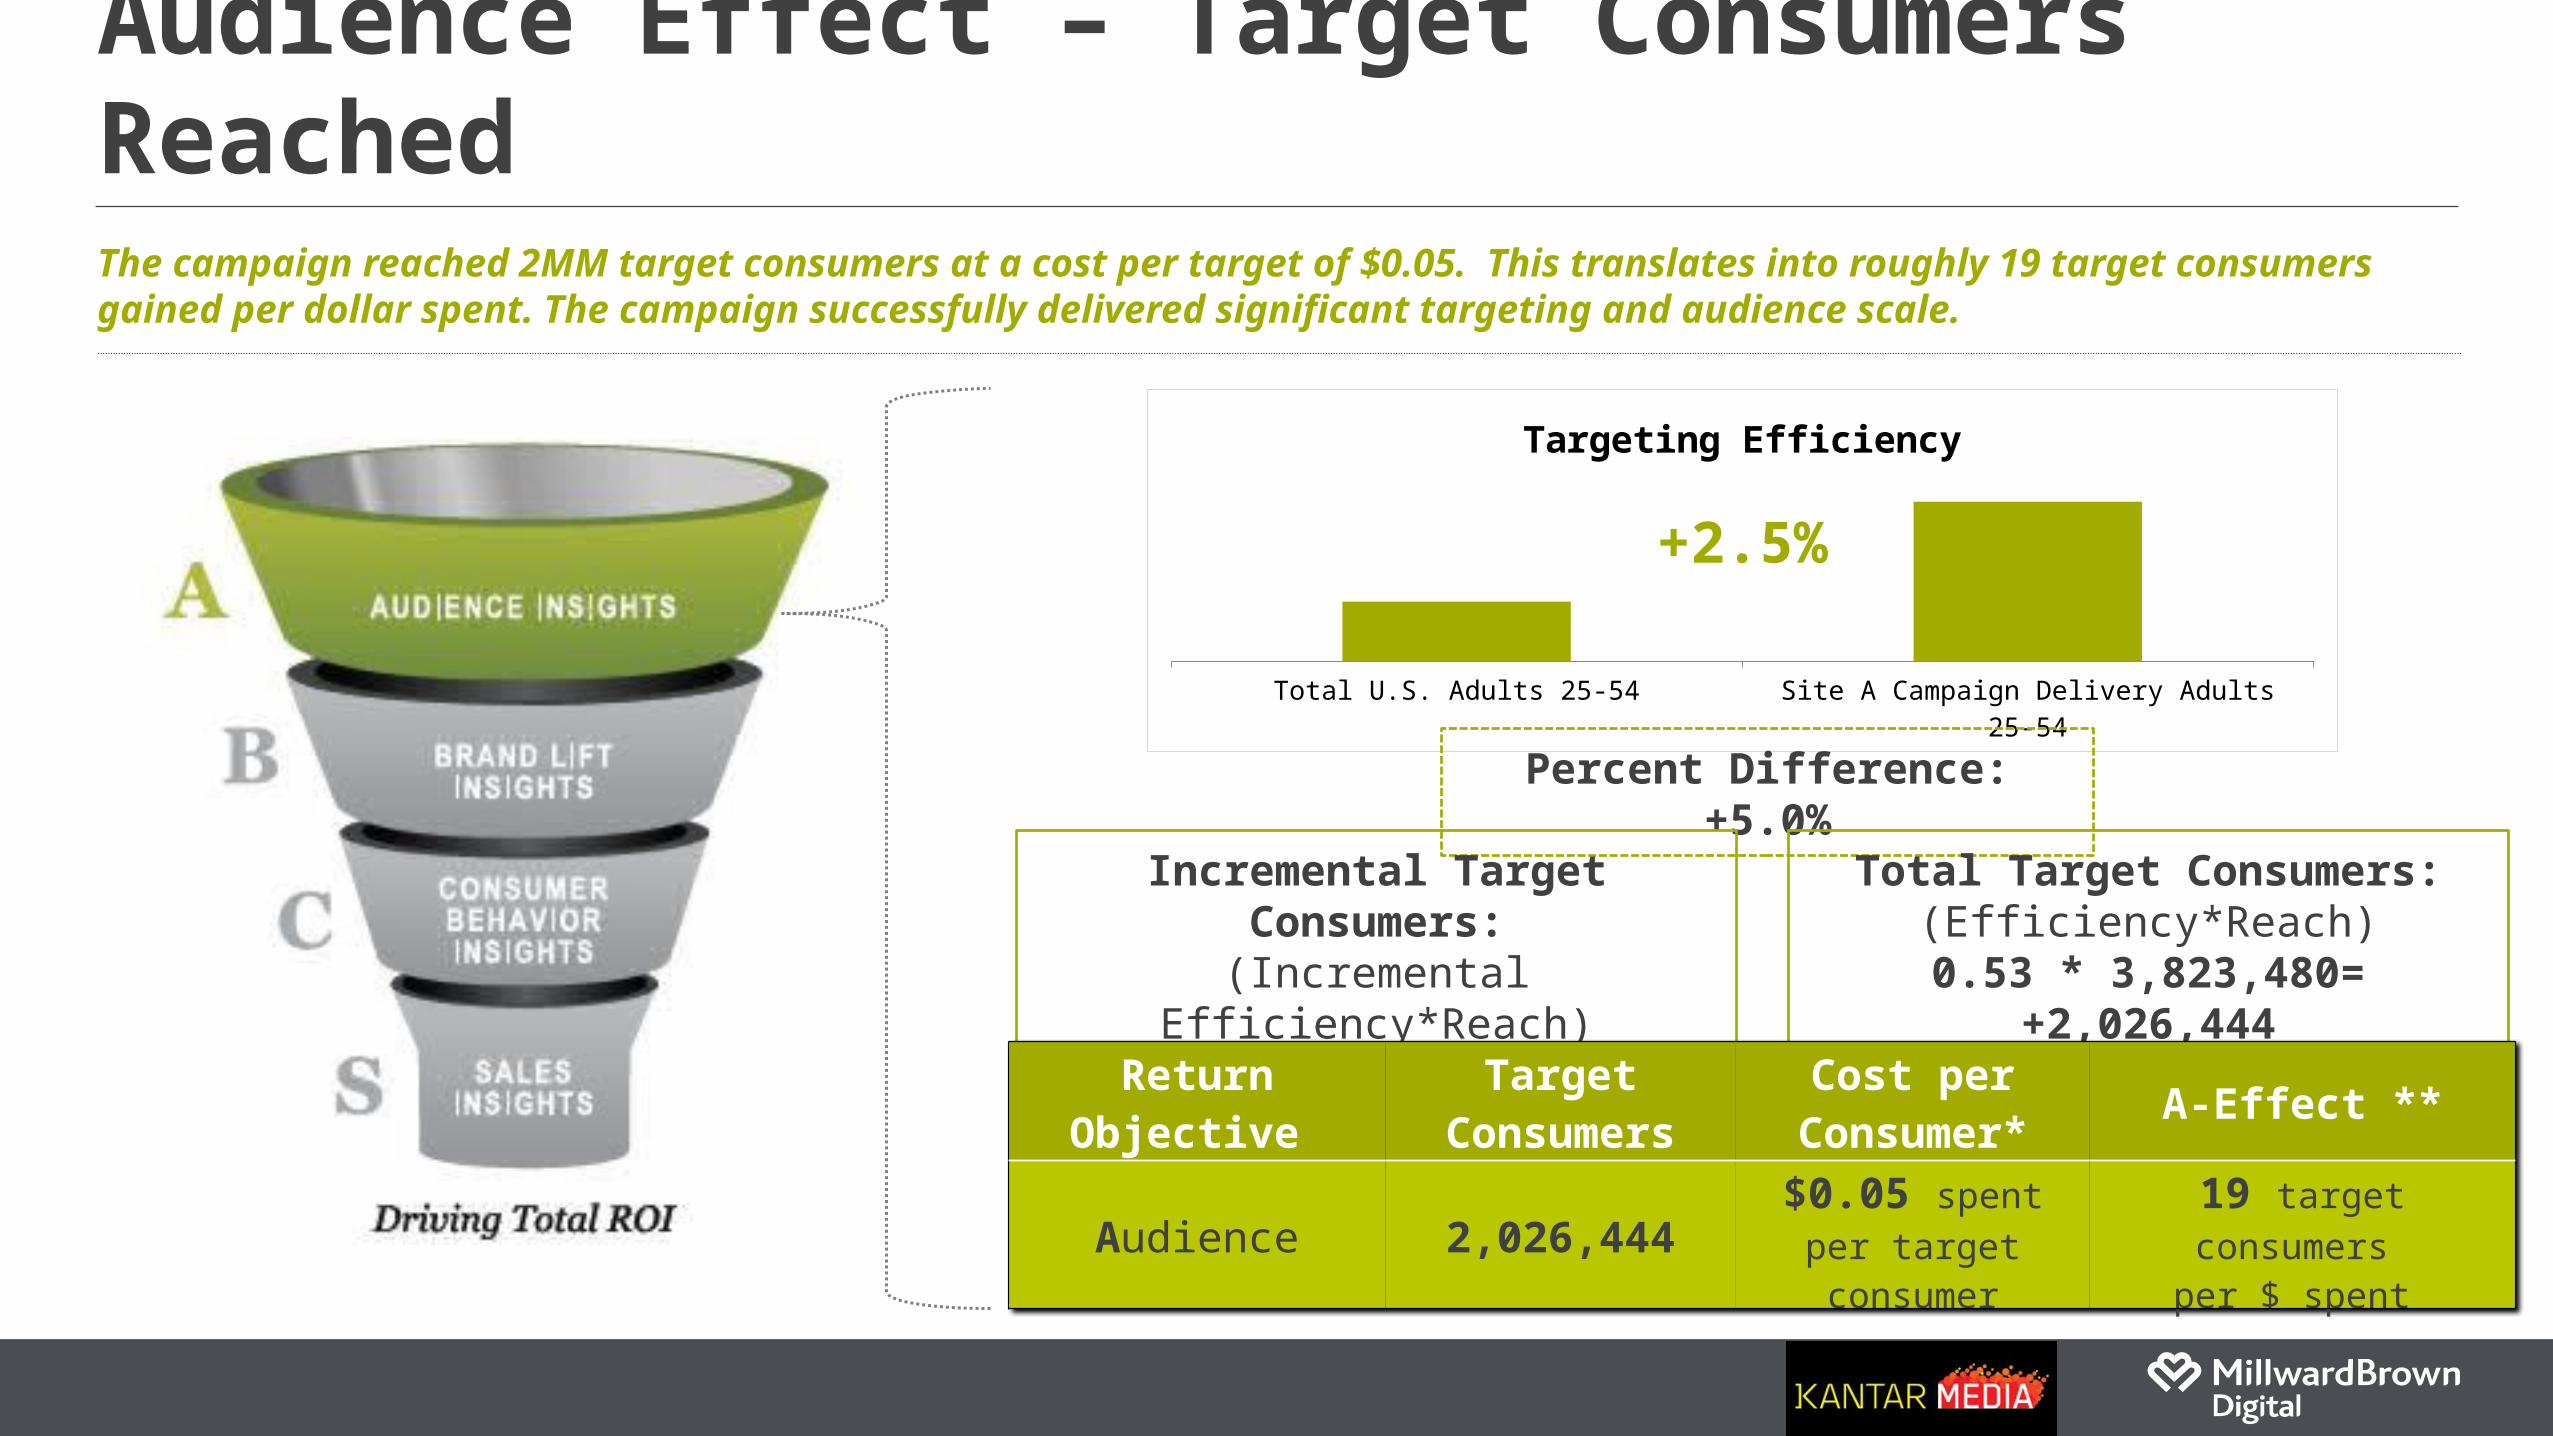
Total U.S. Adults 25-54 Site A Campaign Delivery Adults 25-54
Targeting Efficiency
Audience Effect – Target Consumers ReachedThe campaign reached 2MM target consumers at a cost per target of $0.05. This translates into roughly 19 target consumers gained per dollar spent. The campaign successfully delivered significant targeting and audience scale.
Percent Difference: +5.0%
Incremental Target Consumers:(Incremental Efficiency*Reach)0.025 * 3,823,480= + 95,587
Total Target Consumers:(Efficiency*Reach)
0.53 * 3,823,480= +2,026,444
Return Objective Target Consumers
Cost per Consumer* A-Effect **
Audience 2,026,444$0.05 spent
per target consumer
19 target consumers per $ spent
+2.5%
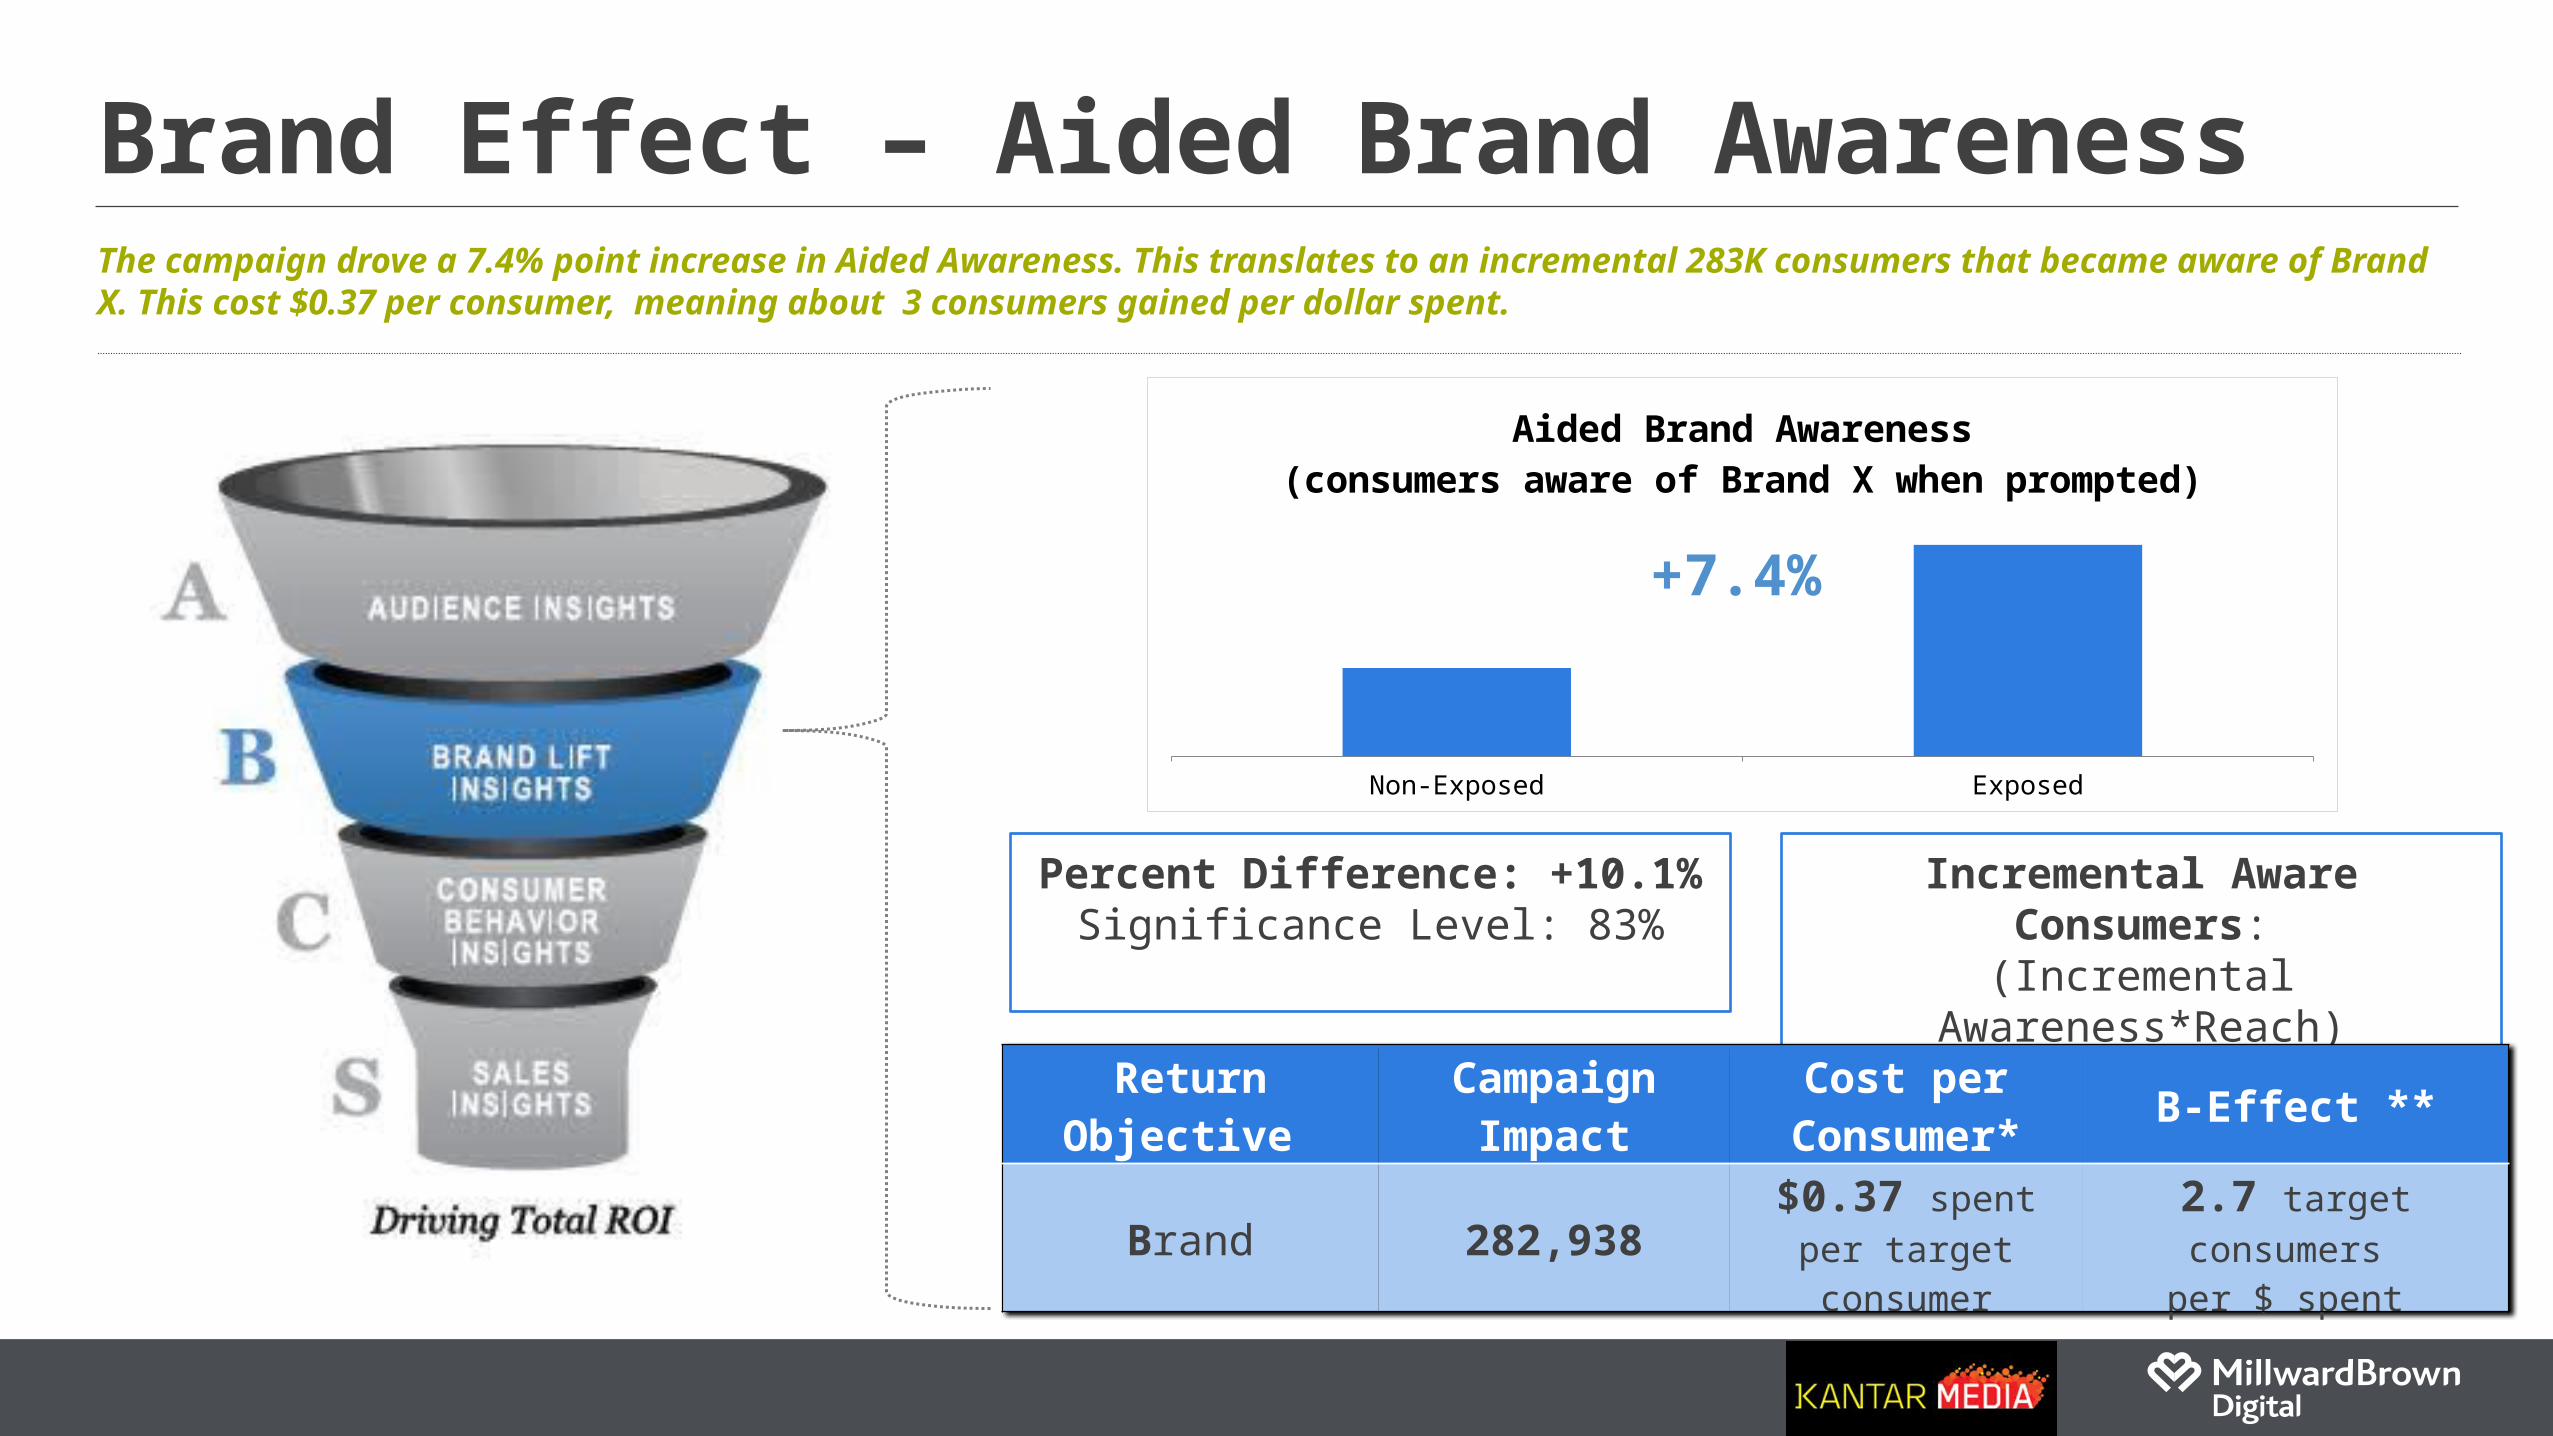
Brand Effect – Aided Brand AwarenessThe campaign drove a 7.4% point increase in Aided Awareness. This translates to an incremental 283K consumers that became aware of Brand X. This cost $0.37 per consumer, meaning about 3 consumers gained per dollar spent.
Percent Difference: +10.1%Significance Level: 83%
Incremental Aware Consumers:(Incremental Awareness*Reach)
0.07 * 3,823,480 = +282,938
Return Objective Campaign Impact
Cost per Consumer* B-Effect **
Brand 282,938$0.37 spent
per target consumer
2.7 target consumers
per $ spent
+7.4%
Non-Exposed Exposed
Aided Brand Awareness(consumers aware of Brand X when prompted)
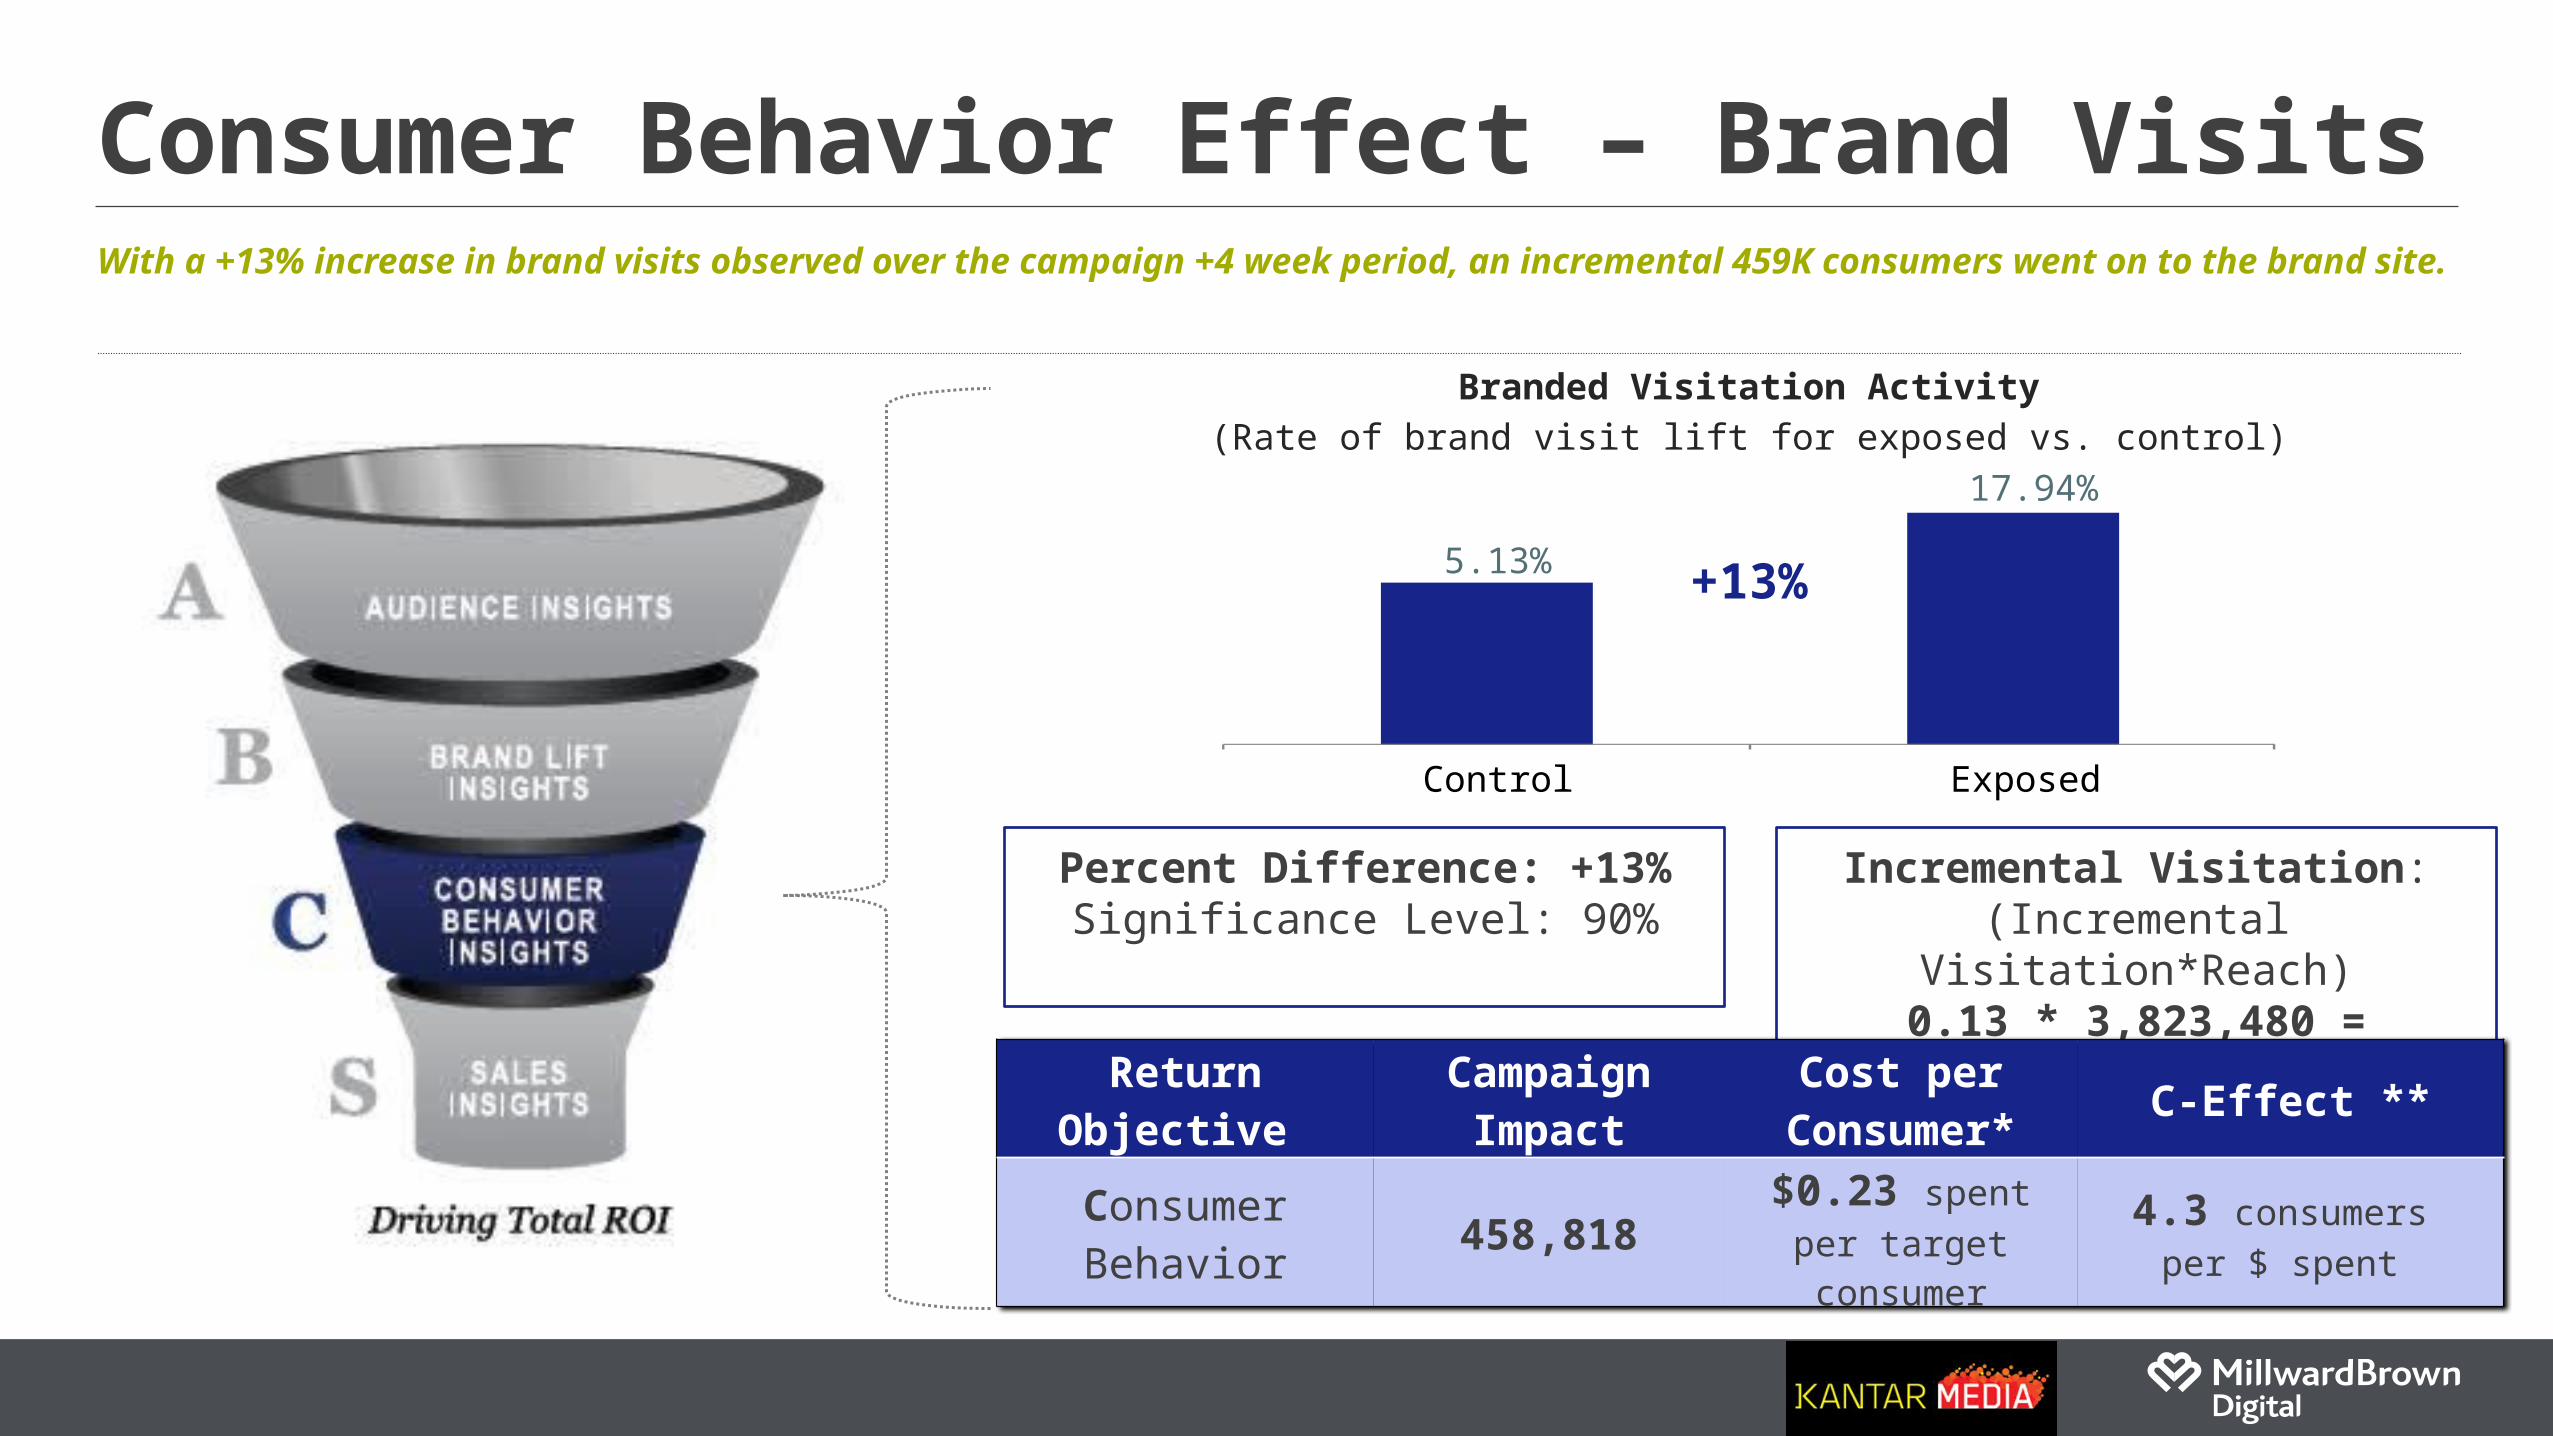
Consumer Behavior Effect – Brand VisitsWith a +13% increase in brand visits observed over the campaign +4 week period, an incremental 459K consumers went on to the brand site.
5.13%
17.94%
Control Exposed
+13%
Percent Difference: +13%Significance Level: 90%
Incremental Visitation:(Incremental Visitation*Reach)0.13 * 3,823,480 = +458,818
Return Objective Campaign Impact
Cost per Consumer* C-Effect **
Consumer Behavior 458,818
$0.23 spentper target consumer
4.3 consumers per $ spent
Branded Visitation Activity(Rate of brand visit lift for exposed vs. control)
Non-Exposed Exposed
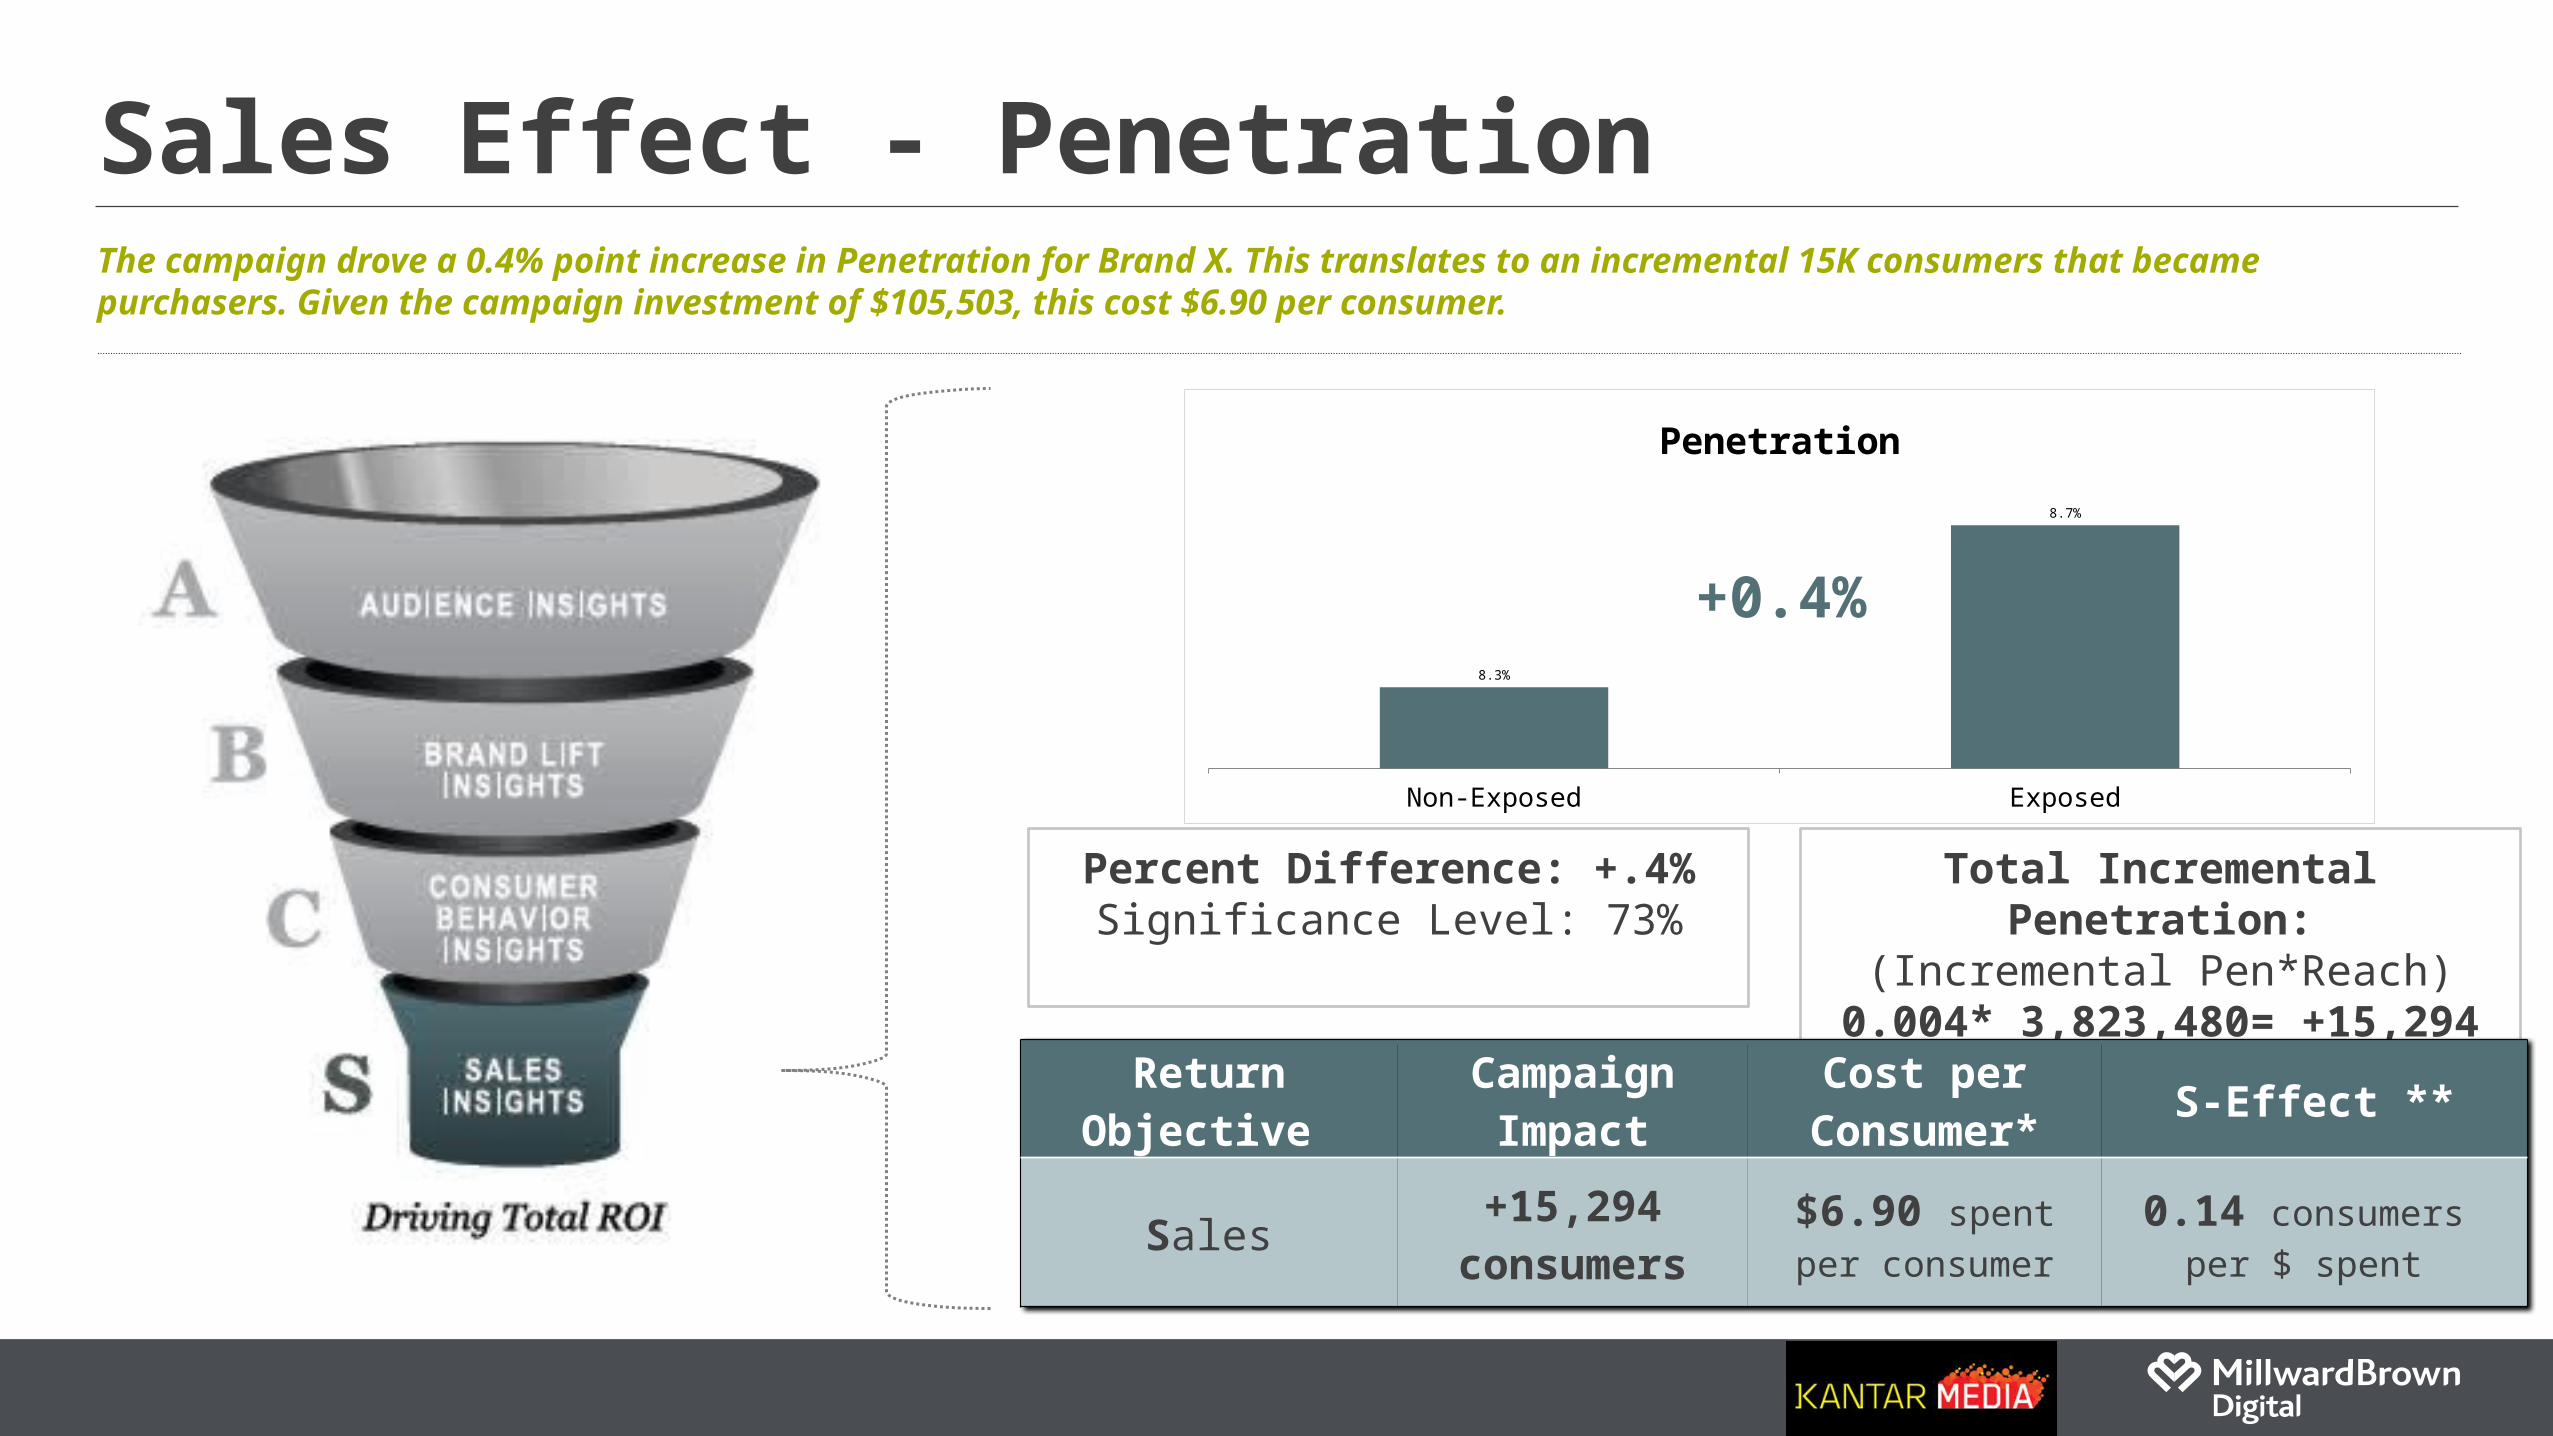
8.3%
8.7%
Penetration
Sales Effect - PenetrationThe campaign drove a 0.4% point increase in Penetration for Brand X. This translates to an incremental 15K consumers that became purchasers. Given the campaign investment of $105,503, this cost $6.90 per consumer.
Percent Difference: +.4%Significance Level: 73%
Total Incremental Penetration:(Incremental Pen*Reach)
0.004* 3,823,480= +15,294
Return Objective Campaign Impact
Cost per Consumer* S-Effect **
Sales +15,294 consumers
$6.90 spentper consumer
0.14 consumers per $ spent
+0.4%
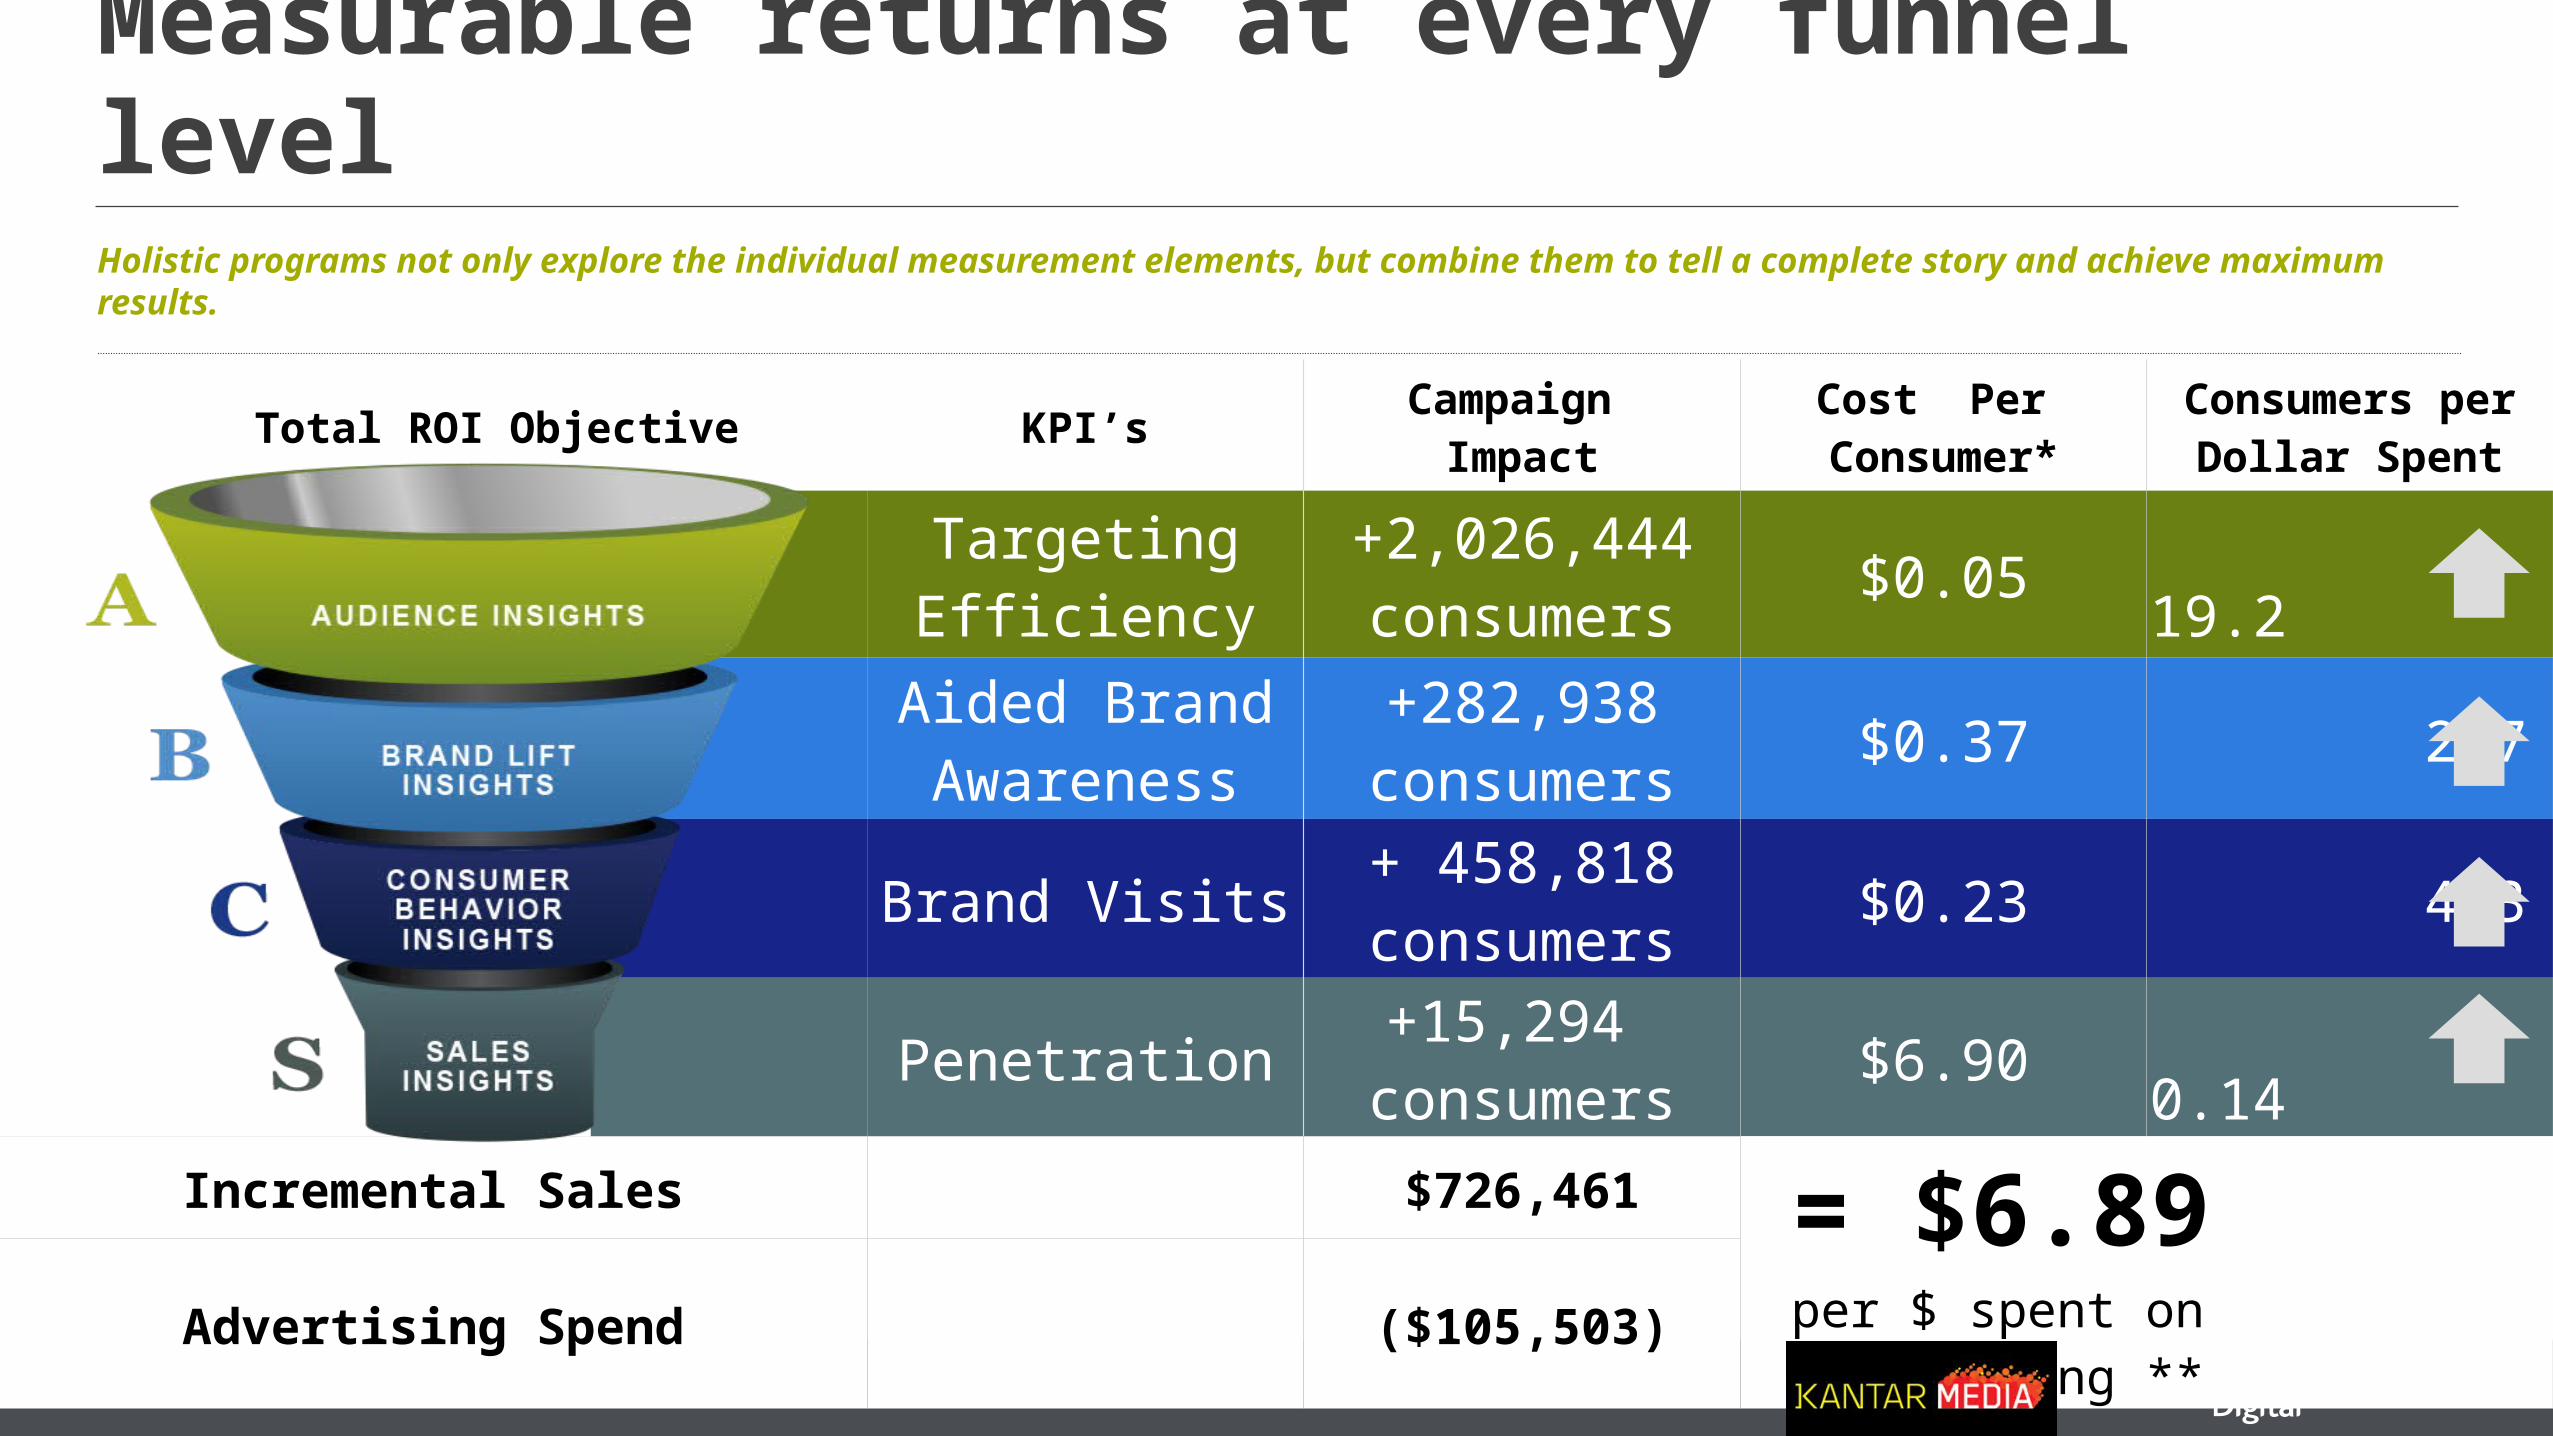
Measurable returns at every funnel levelHolistic programs not only explore the individual measurement elements, but combine them to tell a complete story and achieve maximum results.
Total ROI Objective KPI’s Campaign Impact
Cost Per Consumer*
Consumers per Dollar Spent
Targeting Efficiency
+2,026,444 consumers $0.05 19.2
Aided Brand Awareness
+282,938 consumers $0.37 2.7
Brand Visits + 458,818consumers $0.23 4.3
Penetration +15,294 consumers $6.90 0.14
Incremental Sales $726,461 = $6.89 per $ spent on advertising **Advertising Spend ($105,503)
What does this mean for Marketers?