insight using reports and dashboards participant guide
TRANSCRIPT

National Finance Center
Insight: Using Reports and Dashboards Participant Guide
June 2013

0

Table of Contents
Table of Contents .......................................................................................................... 1
Training Information ........................................................................................... 3 1.0.
1.1. Agenda .................................................................................................... 3
1.2. Purpose ................................................................................................... 3
1.3. Training Objectives ................................................................................ 3
1.4. Course Materials and Resources .......................................................... 4
Insight Overview ................................................................................................. 5 2.0.
2.1. Chapter Overview ................................................................................... 5
2.2. Insight Overview: Exercise ................................................................... 5
2.3. Purpose of Insight .................................................................................. 6
2.4. How Insight Works ................................................................................. 7
2.5. Data in Insight ......................................................................................... 7
2.6. Security in Insight .................................................................................. 8
2.7. Chapter Review .................................................................................... 12
Understanding Data in Insight ......................................................................... 13 3.0.
3.1. Chapter Overview ................................................................................. 13
3.2. Data Structure ....................................................................................... 13
3.3. Data Loading Cycle .............................................................................. 15
3.4. Insight Data Refresh Report ................................................................ 16
3.5. Insight Data Dictionary ........................................................................ 17
3.6. Understanding Data in Insight: Exercises ........................................ 18
3.7. Chapter Review .................................................................................... 19
Understanding Reports and Dashboards in Insight ...................................... 21 4.0.
4.1. Chapter Overview ................................................................................. 21
4.2. Common Report Library ...................................................................... 21
4.3. Types of Reports in the Common Report Library ............................. 23
4.4. Understanding Reports and Dashboards in Insight: Exercises ...... 26
1

4.5. Chapter Review .................................................................................... 27
Basic Navigation ............................................................................................... 29 5.0.
5.1. Chapter Overview ................................................................................. 29
5.2. Insight Key Terms ................................................................................ 29
5.3. Basic Navigation .................................................................................. 30
5.4. Insight Catalog ..................................................................................... 32
5.5. Basic Navigation: Exercise................................................................. 39
5.6. Chapter Review .................................................................................... 40
Access Reports ................................................................................................ 41 6.0.
6.1. Chapter Overview ................................................................................. 41
6.2. Run a Report ......................................................................................... 41
6.3. Manipulate Reports .............................................................................. 45
6.4. Schedule Reports to Run..................................................................... 52
6.5. Access Reports: Exercises ................................................................ 54
6.6. Chapter Review .................................................................................... 56
Access Dashboards ......................................................................................... 57 7.0.
7.1. Chapter Overview ................................................................................. 57
7.2. Run a Dashboard .................................................................................. 57
7.3. Drill-Down in a Dashboard................................................................... 60
7.4. Export/Print a Dashboard .................................................................... 62
7.5. Access Dashboards: Exercise ........................................................... 64
7.6. Chapter Review .................................................................................... 65
Course Summary .............................................................................................. 67 8.0.
8.1. Course Accomplishments ................................................................... 67
8.2. Additional Resources .......................................................................... 67
Appendices ....................................................................................................... 69 9.0.
9.1. Appendix A: Course Glossary ............................................................ 69
9.2. Appendix B: Permissions ................................................................... 72
2

Training Information 1.0.
1.1. Agenda
This course will include the following chapters:
Chapter
2.0 Insight Overview
3.0 Understanding Data in Insight
4.0 Understanding Reports and Dashboards in Insight
5.0 Basic Navigation
6.0 Access Reports
7.0 Access Dashboards
1.2. Purpose
Insight: Using Reports and Dashboards provides an overview of Insight, the National Finance Center’s business intelligence solution that provides integrated data and flexible analytics to drive strategic business decisions.
1.3. Training Objectives
By the end of this course, participants will be able to:
• Describe the purpose of Insight as a reporting and analytics solution
• Describe how data, reports, and dashboards are structured in Insight
• Identify key features of Insight’s basic navigation
• Demonstrate how to access, run, and export reports and dashboards
3

1.4. Course Materials and Resources
Participants will be provided with the following course materials to assist their learning:
• Insight: Using Reports and Dashboards Reference Card
• Insight training sign in information
As you move through this participant guide, be sure to take note of the following icons:
Icon Meaning or Use
IMPORTANT: Provides information essential to the completion of a task.
TIP: Helps users apply the techniques and procedures described in the text. A tip suggests alternative methods that may not be obvious and helps users understand the benefits and capabilities of the system.
Notes:
4

Insight Overview 2.0.2.1. Chapter Overview
This chapter will review the purpose of Insight and how Insight provides users with advanced reporting and business intelligence capabilities.
Chapter Objectives
By the end of this chapter, you will be able to:
• Describe Insight and the value it provides for strategic reporting and decision making
• Identify the data sources available within Insight
• Describe Insight security and access
2.2. Insight Overview: Exercise
Exercise 2.1: Reporting Discussion
Instructions: In groups of three (3), discuss the following questions and be prepared to share with the group.
1. What is your role in running or creating reports?
2. What reports do you run or create most often?
3. Are there instances in which you would like to have several reports that you run all in one place?
4. What are trends or reports that your managers would want to see over time?
5

2.3. Purpose of Insight
Figure 1: Purpose of Insight
Notes:
6

2.4. How Insight Works
Insight combines multiple data sources in one reporting application so users can view data in new ways and engage in strategic reporting.
Figure 2: How Insight Works
2.5. Data in Insight
Insight’s integrated data warehouse enables users to build reports and dashboards with data from the following sources:
Figure 3: Build 1 Data Sources and Descriptions
Data Source Description
Administrative Billings and Collections System (ABCO)
ABCO provides billings for administrative accounts receivable and provides internal accounting control and reporting.
Payroll Accounting System (PACS)
PACS provides biweekly net salary payroll data for salary payments and employee leave after the Pay Computation System (PAYE) runs. It also provides Time & Attendance data for an employee (Note: Equivalent to PAYTA in FOCUS).
Personnel Personnel contains employee profile information and processed personnel actions such as transfer, promotion, accession, performance appraisals, etc. (Note: Equivalent to PAYPERS in FOCUS).
Personnel History (PERHIS) PERHIS contains historical payroll and personnel information.
Salary Salary provides the payroll actions processed each pay period (Note: Equivalent to PAYPERS in FOCUS).
Table Management (TMGT) TMGT provides table records (reference data) containing selected data elements from the payroll/personnel, financial, and administrative systems.
7

2.6. Security in Insight
Security and Access Overview
Insight security and access protocols provide users with tailored access to data, based on Agency Security Officer (ASO) approved authorization. This influences:
Figure 4: Security in Insight
Notes:
8

Security and Access: Org Level
Insight tailors users’ view of data based on the level of the organization (e.g., department, agency, etc.) they have access to.
Figure 5: Security by Org Level
Whereas users with access at the department level have the ability to view data across all agencies, users with access at the agency level can only view data for their individual agency. The same structure applies for org levels 3-8.
Figure 6: Access at the Department Level versus Access at the Agency Level
9

Security and Access: Sensitive Information
Users’ tailored access to sensitive information impacts the view of common reports and dashboards and what data is visible in ad hoc.
Figure 7: Sensitive Information in Common Reports and Dashboards
Figure 8: Sensitive Information in the Ad Hoc Environment
10

Security and Access: Role
The Insight Consumer and Insight Author roles tailor the actions a user can take in the application.
Figure 9: User Roles in Insight
Figure 10: User Roles in Running Reports
11

Figure 11: User Roles in the Ad Hoc Environment
2.7. Chapter Review
Chapter Summary
Having completed this chapter, you should now be able to:
• Describe Insight and the value it provides for strategic reporting and decision
making
• Identify the data sources available within Insight
• Describe Insight security and access
Notes:
12

Understanding Data in Insight 3.0.
3.1. Chapter Overview
This chapter will review the way users interact with data in Insight, the frequency of data updates in the warehouse, and resources available to support understanding of data in Insight.
Chapter Objectives
By the end of this chapter, you will be able to:
• Describe how data elements are organized in Insight
• Describe the different types of data elements in Insight
• Describe the Insight data loading cycles
• Identify where users can access a detailed description of available data elements
3.2. Data Structure
Data is structured according to a hierarchy of information, from the broadest view to the most detailed view.
Figure 12: Data Structure in Insight
13

The hierarchy of information is demonstrated within the Subject Areas pane in the ad hoc report editing page.
Figure 13: Example of Data Structure in Insight
Types of Data
There are three types of data elements in Insight represented by unique icons. Figure 14: Types of Data Elements
14

3.3. Data Loading Cycle
Insight data updates align with traditional NFC PINE, ABCO, and BEAR updates.
• Daily Updates: Insight updates after PINE1 on a daily basis.
• Weekly Updates: Insight updates after ABCO2 on a weekly basis.
• Biweekly Updates: Insight updates after BEAR3 on a biweekly basis. Figure 15: Insight Data Loading Calendar
1 PINE = Personnel Input and Edit System 2 ABCO = Administrative Billings and Collections System 3 BEAR = Biweekly Examination Analysis and Reporting
15

3.4. Insight Data Refresh Report
Insight includes a Data Refresh Report that users can access to validate the last date data was updated in the warehouse. The report is structured by Subject Area.
Figure 16: Insight Data Refresh Report
The Data Refresh Report is located in the Insight System Reports folder within the Catalog Shared Folders.
Notes:
16

3.5. Insight Data Dictionary
The Insight Data Dictionary outlines the data available within Insight. Use the Insight Data Dictionary as a reference to better understand:
• Data elements that comprise each Subject Area
• COBOL name, FOCUS name, and description for each data element
• Data source - either Insight or PPS
• Update frequency for each data element in the warehouse
Figure 17: Insight Data Dictionary
Notes:
17
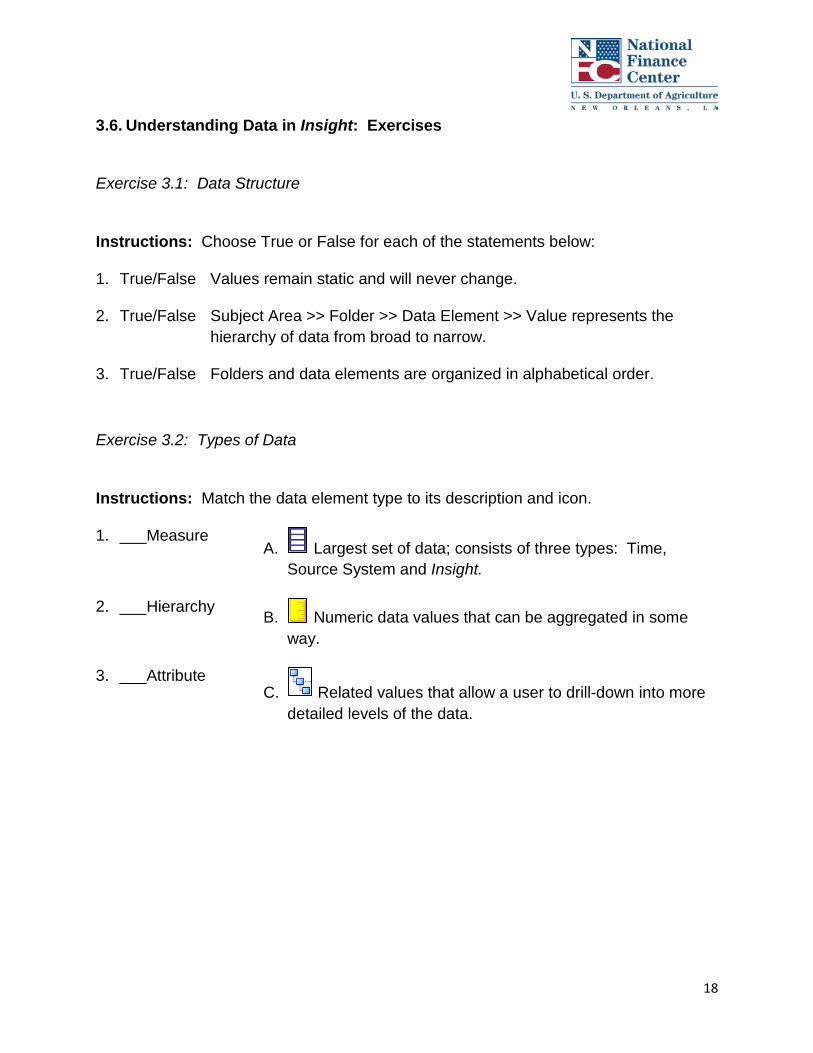
3.6. Understanding Data in Insight: Exercises
Exercise 3.1: Data Structure
Instructions: Choose True or False for each of the statements below:
1. True/False Values remain static and will never change.
2. True/False Subject Area >> Folder >> Data Element >> Value represents the hierarchy of data from broad to narrow.
3. True/False Folders and data elements are organized in alphabetical order.
Exercise 3.2: Types of Data
Instructions: Match the data element type to its description and icon.
1. ___Measure A. Largest set of data; consists of three types: Time,
Source System and Insight.
2. ___Hierarchy
B. Numeric data values that can be aggregated in some
way.
3. ___Attribute C. Related values that allow a user to drill-down into more
detailed levels of the data.
18

3.7. Chapter Review
Chapter Summary
Having completed this chapter, you are now able to:
• Describe how data elements are organized in Insight
• Describe the different types of data elements in Insight
• Describe the Insight data loading cycles
• Identify where users can access a detailed description of available data elements
Notes:
19

20

Understanding Reports and Dashboards in Insight 4.0.
4.1. Chapter Overview
This chapter will review the purpose of the Common Report Library and the value of common reports and dashboards in Insight.
Chapter Objectives
By the end of this chapter, you will be able to:
• Describe the purpose of the Common Report Library
• Describe the types of common reports available within the Common Report Library
• Describe the value and utility of dashboards
• Identify the relationship between reports and dashboards
4.2. Common Report Library
The Common Report Library is a set of frequently used, government-wide reports and dashboards that serve as templates for agencies to customize for their specific needs.
Figure 18: Description of the Insight Common Report Library
21

The structure of the Common Report Library follows the Office of Personnel Management’s (OPM) Business Reference Model (BRM) categories which outline each function in the Human Resource (HR) life cycle. Each folder within the Common Report Library represents one of these functions.
Figure 19: Folder Structure of the Common Report Library
The Common Report Library contains both reports and dashboards, which are represented by different icons and serve different purposes in the reporting process.
Figure 20: Reports and Dashboards
22

4.3. Types of Reports in the Common Report Library
Operational Reports
Operational reports are the most detailed reports and answer a business question with a simple table or graph.
Figure 21: Operational Report
Managerial Reports
Managerial reports provide a mid-level data detail. Drill-down functionality gives users a more detailed data view based on the selection, ideal for supervisors and managers. Users can distinguish managerial reports from operational reports as the title will include “Managerial Report.”
Figure 22: Managerial Report
23

Dashboards
Dashboards provide the user with the “30,000 foot view” of data across a common theme or purpose with the ability to drill-down to a detailed look at a specific subset of information.
Figure 23: Dashboard
Notes:
24
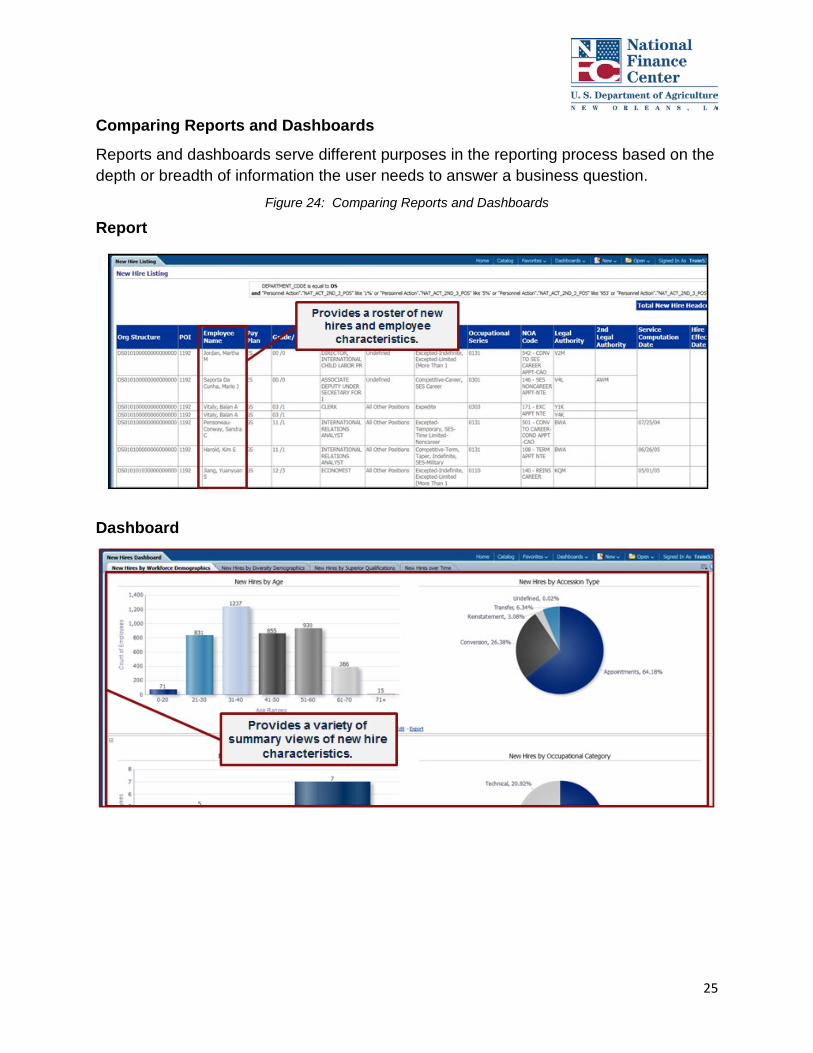
Comparing Reports and Dashboards
Reports and dashboards serve different purposes in the reporting process based on the depth or breadth of information the user needs to answer a business question.
Figure 24: Comparing Reports and Dashboards
Report
Dashboard
25

4.4. Understanding Reports and Dashboards in Insight: Exercises
Exercise 4.1: Common Report Library
Instructions: Circle the four (4) statements that accurately describe the Insight Common Report Library:
1. Illustrates the type of reporting users can conduct in the ad hoc environment.
2. Includes a comprehensive list of all reports that agencies use.
3. Contains “final” reports that cannot be edited or customized.
4. Includes a collection of frequently used, government-wide standard reports.
5. Contains the only common reports that will be available within Insight.
6. Contains a combination of reports and dashboards.
7. Serves as a collection of templates for users to customize based on their agency specific requirements.
8. Contains only reports that I create as an individual user.
26

Exercise 4.2: Reports and Dashboards
Instructions: Write “R” next to the situation(s) in which you would create a report and write “D” next to the situation(s) in which you would create a dashboard.
1. You need to provide agency leadership with the amount of leave each employee has remaining for the fiscal year.
2. Department leadership has asked you to create a snapshot view of the number of employees in each agency, the amount of open positions in each agency, and number of retirements from each agency for the last 5 years.
3. You want to see a summary view of the reports you share with your leadership on a bi-weekly basis.
4. You need to create a list of employees on injury leave by pay plan.
4.5. Chapter Review
Chapter Summary
Having completed this chapter, you are now able to:
• Describe the purpose of the Common Report Library
• Describe the types of common reports available within the Common Report Library
• Describe the value and utility of dashboards
• Identify the relationship between reports and dashboards
27

28

Basic Navigation 5.0.
5.1. Chapter Overview
This chapter will review Insight’s user friendly functionality, including basic navigation and accessing the Common Report Library.
Chapter Objectives
By the end of this chapter, you will be able to:
• Describe Insight key terms
• Demonstrate Insight sign in and basic navigation
• Describe structure of Insight My Folders and Shared Folders
5.2. Insight Key Terms
The Insight Participant Guide Appendix contains a glossary of key terms and icons that are helpful as users navigate Insight, including:
• Analysis: Another name for report in Insight, an analysis answers an inquiry or request against an organization’s data.
• Catalog: Organization system that provides access to personal and shared folders, including the Common Report Library.
• Dashboard: A “snapshot” of data findings across multiple reports in a common theme or purpose.
• My Folders: Folders that contain the user’s privately saved reports; these reports cannot be accessed by other users.
• Prompt: Mechanism that the user can manipulate to restrict the data at the time the report or dashboard runs.
• Shared Folders: Folders that allow the user to access the Common Report Library, Insight System Reports, Shared Across Agencies, agency specific folders, and other reports users have made available.
29

5.3. Basic Navigation
Sign in to Insight
Step Action
1. Sign in using User ID and Password. Figure 25: Insight Sign in page
Navigate the Insight Home Page
Step Action
1. View the Insight home page. Figure 26: Insight Home Page
TIP: The tab in the top left corner of the screen will update based on the page within Insight the user has accessed.
30

Step Action
2. Navigate to the top navigation bar. This provides shortcuts to a number of frequently accessed pages within Insight.
• Home: Returns user to the home page.
• Catalog: Provides users access to My Folders and Shared Folders, including the Common Report Library.
• Favorites: Provides a shortcut to favorite reports that have been bookmarked for easy access.
• Dashboards: Provides user access common dashboards and My Dashboard.
• New: Allows the user to create a new report, dashboard, or other reporting component.
• Open: Provides the user access to an existing report or dashboard.
Figure 27: Top Navigation Bar
31

Step Action
3.
View the center navigation which includes shortcuts to the most recent and popular reports and dashboards.
• The Most Popular section of the home page populates with the most frequently accessed reports among the user’s community.
• Click the Open, Edit, More action links under each report or dashboard to view or customize these reports/dashboards from the home page.
Figure 28: Center Navigation on Insight Home Page
5.4. Insight Catalog
Access the Insight Catalog
Step Action
1. Click the Catalog action link from the top navigation bar. Figure 29: Catalog Action Link on Insight Home Page
32

Step Action
2. View the Folders pane. This contains My Folders and Shared Folders where all saved reports and dashboards are stored.
• My Folders: Personal folder; only the user has access to the reports and dashboards in My Folders.
• Shared Folders: Public folder; contains the Common Report Library, Insight System Reports, Shared Across Agencies folder, and Agency Folders.
Figure 30: My Folders and Shared Folders in Folders Pane
TIP: Users with the Insight Author role can create new folders within My Folders and Shared Folders. Insight Authors can control access to new folders created within Agency Folders. For more information regarding controlling access and permissions, reference Appendix B.
33

Step Action
3. View the Common Report Library. Figure 31: Insight Common Report Library
4. Identify reports and dashboards using the unique icon that precedes the title of each item.
Report or Analysis: Includes a combination of information that answers a single business question. Reports can include a table, text, graph, etc.
Dashboard: Presents a snapshot of data findings across multiple reports in a common theme or purpose. Answers several business questions on a similar theme.
Notes:
34

Manipulate the View Within the Catalog
Step Action
1. Manipulate the Catalog view by using the Type or Sort drop-down menus, which change how items are displayed in the Catalog.
Figure 32: Type and Sort Drop-Down Menus
2. Use the Type drop-down to filter the Catalog to a certain type of item (e.g., Analysis (report) or Dashboard).
Figure 33: Type Drop-Down Menu
TIP: Set the Type back to All in order to reset the Catalog to the default view of all items.
35
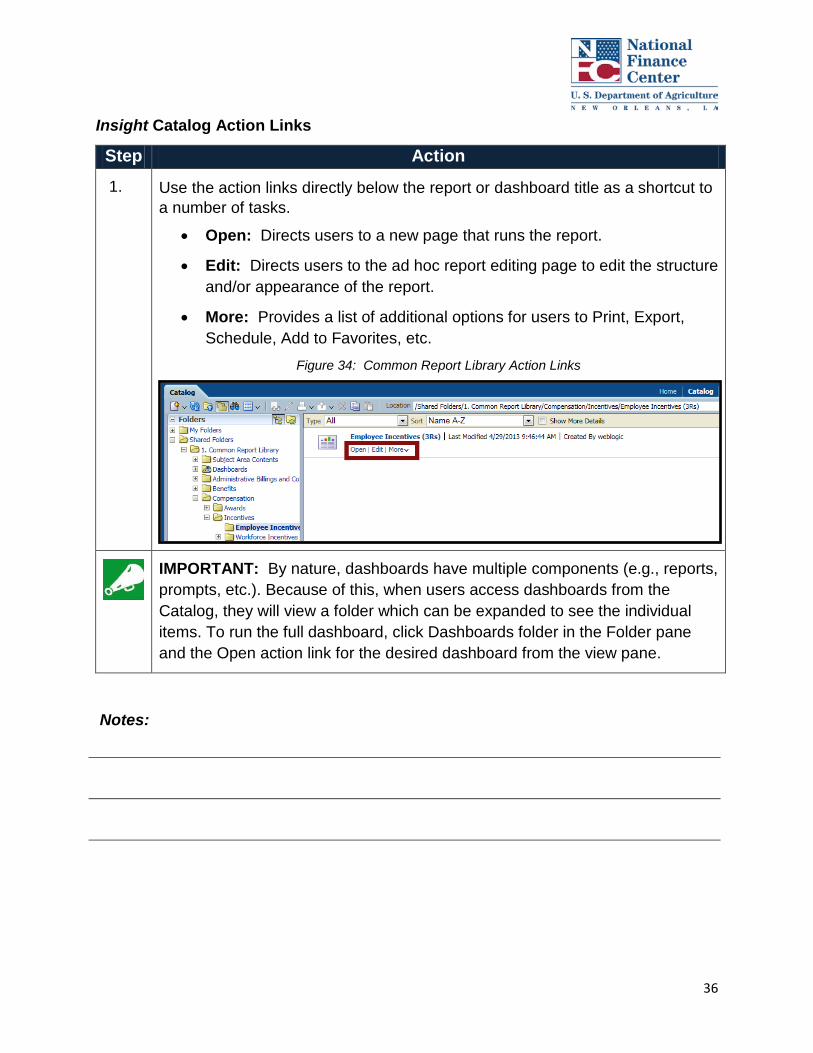
Insight Catalog Action Links
Step Action
1. Use the action links directly below the report or dashboard title as a shortcut to a number of tasks.
• Open: Directs users to a new page that runs the report.
• Edit: Directs users to the ad hoc report editing page to edit the structure and/or appearance of the report.
• More: Provides a list of additional options for users to Print, Export, Schedule, Add to Favorites, etc.
Figure 34: Common Report Library Action Links
IMPORTANT: By nature, dashboards have multiple components (e.g., reports, prompts, etc.). Because of this, when users access dashboards from the Catalog, they will view a folder which can be expanded to see the individual items. To run the full dashboard, click Dashboards folder in the Folder pane and the Open action link for the desired dashboard from the view pane.
Notes:
36

Add a Report to Favorites
Step Action
1. Click the More action link from the Catalog and select Add to Favorites. Figure 35: More Drop-Down Menu with Add to Favorites Highlighted
2. View the yellow star on the report icon indicating it is part of the Favorites menu.
Figure 36: Favorite Indicator
3. Click the Favorites action link to view the list of favorite reports in the top navigation bar.
Figure 37: Favorites Action Link
37

Step Action
4. Click the More action link and select Remove From Favorites to remove the report from Favorites.
Figure 38: More Drop-Down Menu with Remove from Favorites Highlighted
Notes:
38

5.5. Basic Navigation: Exercise
Exercise 5.1: Add a Report to Favorites
Scenario: John wants to add the Leave Data and Usage by Employee report to his Favorites so he can easily access it for his weekly report to leadership.
Instructions: Follow the steps below to complete the exercise in Insight:
1. Sign in to the Insight training environment using the provided training ID and password.
2. Click the Catalog action link from the top navigation bar.
3. Expand the Shared Folders and navigate to the desired report by expanding the following folders: Shared Folders >> Common Report Library >> Compensation >> Leave >> Leave >> Leave Data and Usage by Employee.
a. Click the Leave Data and Usage by Employee folder to show folder contents in the view pane.
4. Click the More action link that corresponds to Leave Data and Usage by Employee report.
5. Select Add to Favorites.
6. Click the Favorites action link from the top navigation bar to validate the report has been added.
Check Your Work:
Figure 39: Leave Data and Usage by Employee Report Added to Favorites
39

5.6. Chapter Review
Chapter Summary
Having completed this chapter, you are now able to:
• Describe Insight key terms
• Demonstrate Insight sign in and basic navigation
• Describe structure of Insight My Folders and Shared Folders
Notes:
40

Access Reports 6.0.
6.1. Chapter Overview
This chapter will review how users can access a report in the Catalog to run, export, print, and schedule.
Chapter Objectives
By the end of this chapter, you will be able to:
• Demonstrate how to run a report from the Common Report Library
• Demonstrate how to manipulate report appearance in run mode
• Demonstrate how to export and print a report
• Demonstrate how to schedule a report to run
6.2. Run a Report
Open a Report
Step Action
1. Click the Open action link below the desired report. Figure 40: Open Action Link
TIP: When navigating through folders within the Folders pane, you must click the folder name to see the list of folder contents.
41

Step Action
2. Navigate to the Prompts page. Many of the reports within the Common Report Library will contain a series of report prompts which allow the user to restrict data in a report each time it runs.
Figure 41: Report Prompt Page
IMPORTANT: Report prompts distinguished by an asterisk (*) indicate a mandatory field; users must make a selection.
42

Step Action
3. Use report prompts to restrict the data within a report. Users will interact with two different types of report prompts based on the type of data: drop-down and calendar.
• Drop-Down: Select from a list of potential values or type the selection directly into the values box.
Figure 42: Drop-Down Prompt
• Calendar: Select the date (month, day, year) from a Calendar View.
Figure 43: Calendar Prompt
TIP: Some drop-down prompts will cascade based on user selection. For example, as a user selects Department, Agency Name will update to only the available agencies within the selected department.
43

Step Action
TIP: After making selections in a drop-down prompt, click in the white space of the prompts page to accept the selections.
IMPORTANT: Reports that use time prompts, such as the calendar, contain historical data which allow users to restrict the date range based on prompt selections.
4. Click OK to run the report. Figure 44: Report Prompt Page with OK Highlighted
TIP: Select Reset to return all report prompts to the default view.
44

Step Action
5. View the Report in the run view with the report name in the tab at the top left corner of the page. The report table, graph, or other report components populate based on restrictions applied by the report prompts.
Figure 45: Report Run View
6.3. Manipulate Reports
Manipulate a Report After it Runs
Step Action
1. Hold the cursor over a column heading to view the gray handle bar. Figure 46: Gray Handle Bar
45
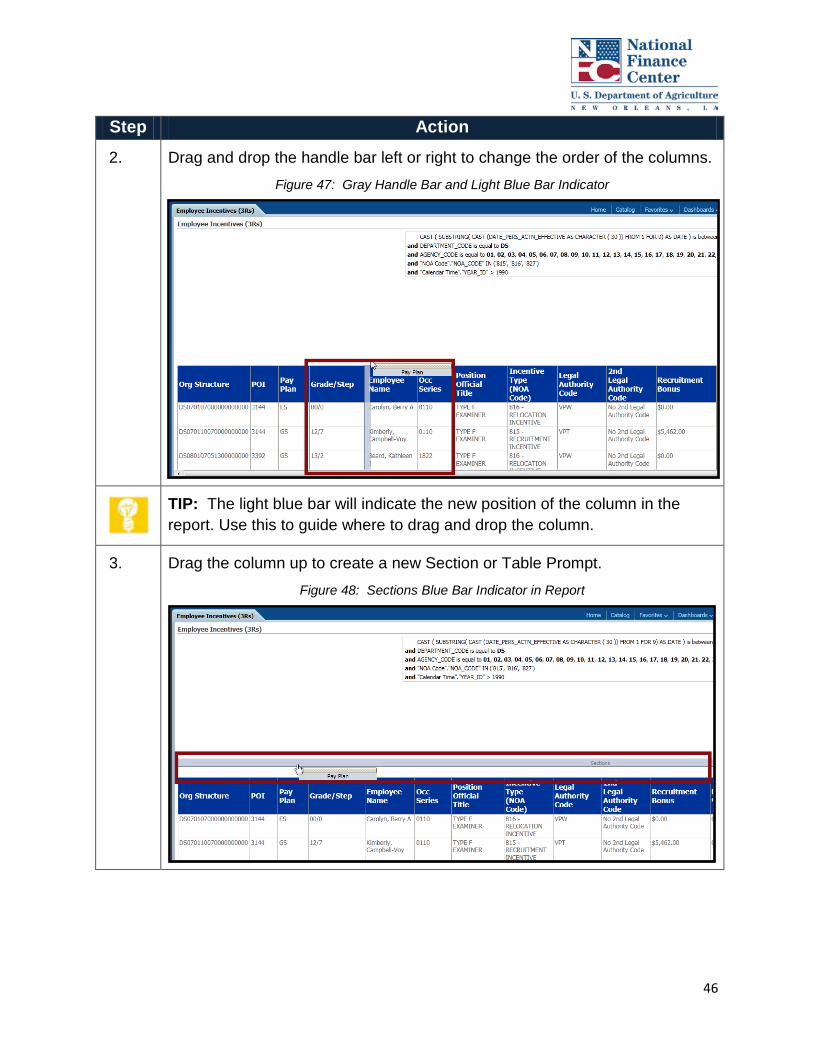
Step Action
2. Drag and drop the handle bar left or right to change the order of the columns. Figure 47: Gray Handle Bar and Light Blue Bar Indicator
TIP: The light blue bar will indicate the new position of the column in the report. Use this to guide where to drag and drop the column.
3. Drag the column up to create a new Section or Table Prompt. Figure 48: Sections Blue Bar Indicator in Report
46

Step Action
• Section: Results in several tables separated by the individual values of the data element.
Figure 49: Table Sections in Report
• Table Prompts: Creates a drop-down menu that restricts the data in the table based on the selected value.
Figure 50: Table Prompts in a Report
47

Step Action
4. Return the data element from Section or Table Prompts to the table by hovering over the data element name and dragging the handle bar to the report table.
Figure 51: Gray Handle Bar to Remove Section or Table Prompts
48

Step Action
5. Right-click on a column header to view a menu of options allowing users to customize report structure.
• Sort Column: Sort the data in ascending or descending order.
• Keep Only: Choose to only show values that meet certain criteria.
• Remove: Choose to remove values that meet certain criteria.
• Show Subtotal: Add a subtotal for that data element within the table.
• Show Row Level Grand Total: Add a Grand Total to follow the values within the table. Default is not to include the Grand Total.
• Exclude Column: Remove the column from the table.
• Hide Column: Temporarily hide the column from the table.
• Move Column: Change the sequence of the columns or move the data element into the Table Prompts or Sections position.
Figure 52: Column Header Drop-Down Menu
49

Export a Report
Step Action
1. Click the Export action link to choose from a number of export options including PDF, Excel, PowerPoint, Web Archive, or Data.
Figure 53: Export Action Link Drop-Down Menu
• The Export feature in Insight has several overall requirements:
o Files must be 20 MB or less, or approximately 100,000 rows or less.
o Java and ActiveX are required to display the File Download dialog box.
o Pop-ups must be allowed.
o Maximum number of rows per page must be displayed (500).
• Some file types also have specific restrictions:
o PDF: Prints only what is displayed on one page. Users can elect to see all the rows by maximizing the row count displayed.
o Excel: 2003 version has a limit of 65,536 rows. When exporting a dashboard, the report is saved in HTML format where Excel will automatically position the graphs.
o PowerPoint: 2003 and 2007 versions print the dashboard to multiple slides, with each dashboard page on one slide.
50

Print a Report
Step Action
1. Click the Print action link and choose from Printable PDF or Printable HTML.
Figure 54: Print Action Link Drop-Down Menu
IMPORTANT: To open a PDF, users must have Adobe installed.
Notes:
51
6.4. Schedule Reports to Run
Use the Scheduler Agent
Step Action
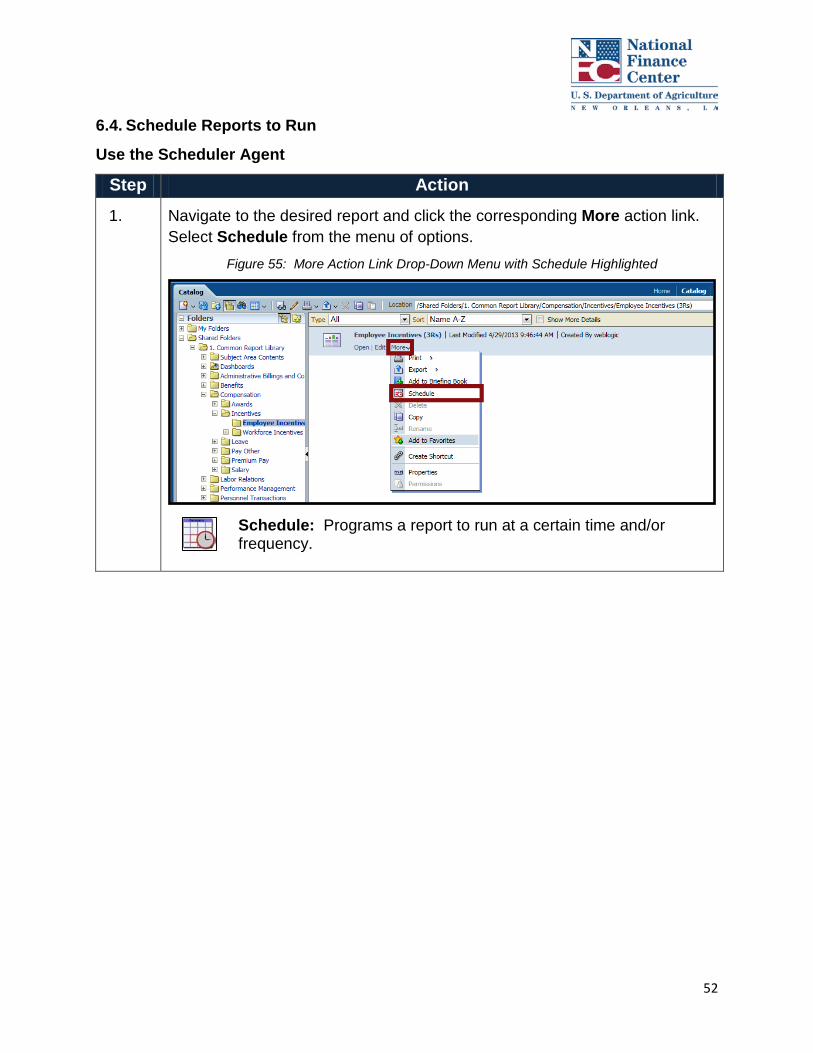
1. Navigate to the desired report and click the corresponding More action link. Select Schedule from the menu of options.
Figure 55: More Action Link Drop-Down Menu with Schedule Highlighted
Schedule: Programs a report to run at a certain time and/or frequency.
52

Step Action
2. View the New Scheduler page to customize the Scheduler using the following seven tabs:
• General: Allows users to set the priority of the report.
• Schedule: Allows users to define the frequency, start, and end time of the agent.
• Condition: Provides users the ability to set conditions for the Scheduler to run based on characteristics of another report in the Catalog.
• Delivery Content: Identifies the delivery type.
• Recipients: Provides users the ability to identify the recipient of the run report.
• Destinations: Allows users to choose the location to which the report will be delivered.
• Actions: Provides users the ability to specify actions to take once the Scheduler runs.
Figure 56: New Scheduler Page and Tabs
TIP: As selections are made within each of the New Scheduler tabs, the Overview section will populate with the user’s selection.
53

6.5. Access Reports: Exercises
Exercise 6.1: Run and Export a Common Report
Scenario: Caitlin needs to provide her manager with a report of all new hires in Excel format.
Instructions: Follow the steps below to complete the exercise in Insight:
1. Click the Catalog action link from the top navigation bar.
2. Expand the Shared Folders to navigate to the desired report by expanding the following folders: Shared Folders >> Common Report Library >> Staff Acquisition >> Accessions >> New Hires.
a. Click the New Hires folder to show folder contents.
3. Click the Open action link corresponding to New Hire Listing to run the report.
4. From the New Hires Listing prompts page, select the following prompt values:
a. Date of Action between: 01/01/2012 and 01/01/2013
b. Department Code: DS
c. Agency Name: Agency for Service Area 1, Agency for Service Area 10, Agency for Service Area 11, Agency for Service Area 12
5. Click OK.
6. Click the Export action link to open the menu of export options.
7. Select Excel to download the report in an Excel file.
Check Your Work: Figure 57: New Hire Listing Report Exported to Excel
54

Exercise 6.2: Run, Manipulate, and Export a Common Report
Scenario: Ivan’s manager has requested a copy of the Leave and Data Usage by Employee report, but Ivan needs to make small edits to the structure before he shares it.
Instructions: Follow the steps below to complete the exercise in Insight:
1. Click the Catalog action link from the top navigation bar.
2. Expand the Shared Folders to navigate to the desired report by expanding the following folders: Shared Folders >> Common Report Library >> Compensation >> Leave >> Leave >> Leave Data and Usage by Employee.
a. Click the Leave Data and Usage by Employee folder to show folder contents.
3. Click the Open action link corresponding to Leave Data and Usage by Employee report.
4. From the Leave Data and Usage by Employee report prompts page, select the following prompt values:
a. Department Code: DS
b. Agency Code: 01, 10, 11, 12
5. Click OK.
6. Hover over the Org Structure column heading until the gray handle bar appears at the top of the column.
7. Click on the gray handle bar and drag the Org Structure column one space to the right so that it follows POI.
8. Right-click the Grade/Step column heading and select Sort Column, then Sort Ascending.
9. Click the Export link to open a menu of export options.
10. Select Excel from the drop-down menu to export the report as an Excel file.
55

Check Your Work:
Figure 58: Customized Report Exported to Excel
6.6. Chapter Review
Chapter Summary
Having completed this chapter, you are now able to:
• Demonstrate how to run a report from the Common Report Library
• Demonstrate how to manipulate report appearance in run mode
• Demonstrate how to export and print a report
• Demonstrate how to schedule a report to run
Notes:
56

Access Dashboards 7.0.
7.1. Chapter Overview
This chapter will review how Insight users can run a dashboard to see the “30,000 foot view” of their data.
Chapter Objectives
By the end of this chapter, you will be able to:
• Demonstrate how to access a dashboard
• Demonstrate how to drill-down within a dashboard
• Demonstrate how to export and print a dashboard
7.2. Run a Dashboard
Open a Dashboard to Run Results
Step Action
1. Navigate to the Dashboards folder within the Common Report Library. Click the Open action link corresponding to the desired dashboard.
Figure 59: Open Action Link
TIP: Clicking the Expand action link will reveal each individual component of the dashboard (not recommended). Users should click the Open action link to run the dashboard.
TIP: Common dashboards can also be accessed from the Dashboards action link in the top navigation bar.
57

Step Action
2. View the dashboard in a new window that contains several components, including dashboard pages, dashboard prompts, and dashboard reports.
• Dashboard pages: Separates pages within the dashboard.
• Dashboard prompts: Allows users to manipulate the restrictions on data across multiple reports.
• Dashboard reports: Views individual reports that create each dashboard page.
Figure 60: Dashboard Pages, Prompts, and Reports
IMPORTANT: Dashboards from the Common Report Library will not display results in the dashboard reports until the mandatory prompt selections are made in the prompts section.
58

Step Action
3. Select the data to display in the dashboard reports by using the dashboard prompts at the top of the dashboard page.
Figure 61: Dashboard Prompt Drop-Down Menu
IMPORTANT: Reports or dashboards containing a current snapshot will include a disclaimer identifying whether the data is updated daily or bi-weekly.
TIP: If the user selects a dataset that is too limited, an error message appears that the “specified criteria didn’t result in any data.” Use the reset button to return the prompts to default values.
4. Click Apply and the dashboard reports will update based on the selections made.
Figure 62: Dashboard Reports
59

7.3. Drill-Down in a Dashboard
Use the Drill-Down Functionality to View Details
Step Action
1. Click on any component of a graph to drill-down to a respective data set. Figure 63: Graph Drill-Down Capability
2. View a new page with an operational report filtered by the data selected in the graph.
Figure 64: Operational Report with Data Filtered from Graph Drill-Down
TIP: The Filters Record above the report will include the drill-down selection as one of the recorded filters in this view of data.
60
Step Action
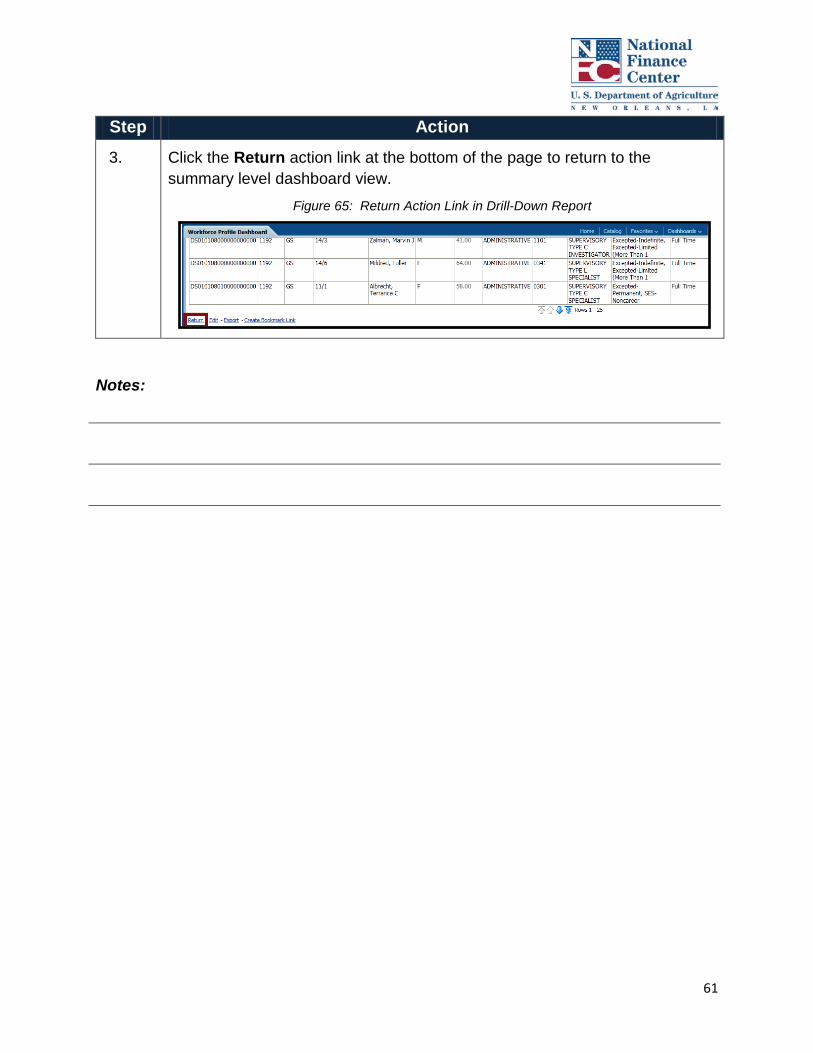
3. Click the Return action link at the bottom of the page to return to the summary level dashboard view.
Figure 65: Return Action Link in Drill-Down Report
Notes:
61

7.4. Export/Print a Dashboard
Print a Dashboard From the Run View
Step Action
1. Click the Edit icon and select Print to print a dashboard from the run view. Figure 66: Edit Icon and Drop-Down Menu
Edit: Displays a menu of customization options.
2. View the two options for printing dashboards, Printable PDF and Printable HTML.
Notes:
62

Export Dashboard Reports
Step Action
1. Export each dashboard report by clicking the Export action link below the item.
Figure 67: Dashboard Export Action Link
2. Choose among PDF, Excel, PowerPoint, Web Archive, and Data export options when exporting the dashboard report.
63

7.5. Access Dashboards: Exercise
Exercise 7.1: Run, Drill-down, and Print a Common Dashboard
Scenario: Tom wants to share the New Hires Dashboard with his manager. As he is reviewing the dashboard, he notices some interesting data about the New Hires by Pay Plan report, so he decides to drill-down into the dashboard for a more detailed look.
Instructions: Follow the steps below to complete the exercise in Insight:
1. Click the Dashboards action link from the top navigation bar and select the New Hires Dashboard.
2. Within the prompts section, select the following prompt values and click in the white space after each selection:
a. Date of Action between: 01/01/2012 and 01/01/2013
b. Department Code: DS
c. Agency Code: 01, 10, 11, 12
3. Click Apply.
4. On the first page, navigate to the New Hires by Pay Plan-Grade graph and click the GS vertical column to view the detailed operational report.
5. Click the Return action link to return to the dashboard.
6. Click the Edit icon and from the drop-down menu, select Print.
7. Select Printable PDF to print the dashboard in PDF format.
64

Check Your Work:
Figure 68: New Hires Dashboard Printed to PDF
7.6. Chapter Review
Chapter Summary
Having completed this chapter, you are now able to:
• Demonstrate how to access a dashboard
• Demonstrate how to drill-down within a dashboard
• Demonstrate how to export and print a dashboard
Notes:
65

66

Course Summary 8.0.
8.1. Course Accomplishments
Having completed this course, participants are now able to:
• Describe the purpose of Insight as a reporting and analytics solution
• Describe how data, reports, and dashboards are structured in Insight
• Identify key features of Insight’s basic navigation
• Demonstrate how to access, view, and export reports and dashboards
8.2. Additional Resources
For additional resources please refer to the Insight website: www.nfc.usda.gov/insight
67

68
Appendices 9.0.
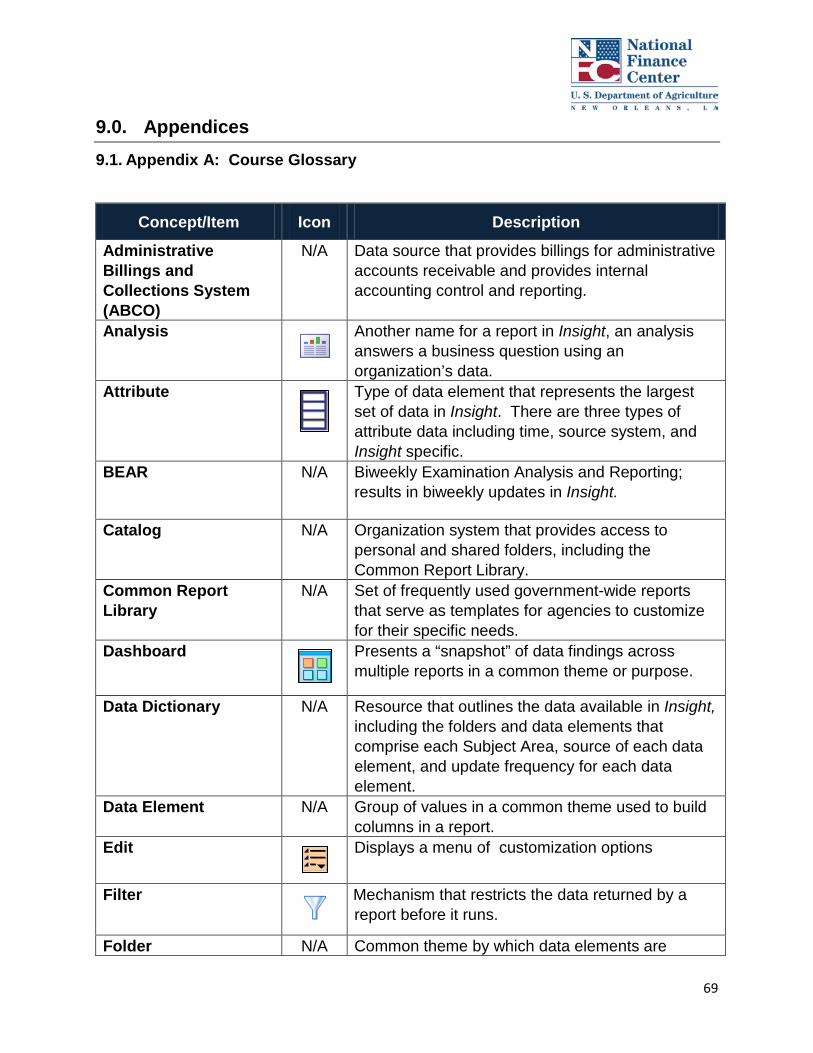
9.1. Appendix A: Course Glossary
Concept/Item Icon Description
Administrative Billings and Collections System (ABCO)
N/A Data source that provides billings for administrative accounts receivable and provides internal accounting control and reporting.
Analysis
Another name for a report in Insight, an analysis answers a business question using an organization’s data.
Attribute
Type of data element that represents the largest set of data in Insight. There are three types of attribute data including time, source system, and Insight specific.
BEAR
N/A Biweekly Examination Analysis and Reporting; results in biweekly updates in Insight.
Catalog N/A Organization system that provides access to personal and shared folders, including the Common Report Library.
Common Report Library
N/A Set of frequently used government-wide reports that serve as templates for agencies to customize for their specific needs.
Dashboard
Presents a “snapshot” of data findings across multiple reports in a common theme or purpose.
Data Dictionary N/A Resource that outlines the data available in Insight, including the folders and data elements that comprise each Subject Area, source of each data element, and update frequency for each data element.
Data Element N/A Group of values in a common theme used to build columns in a report.
Edit
Displays a menu of customization options
Filter
Mechanism that restricts the data returned by a report before it runs.
Folder N/A Common theme by which data elements are
69

Concept/Item Icon Description
structured in a Subject Area. Hierarchy
Type of data element that represents related values that allow a user to drill-down into more detailed levels of the data.
Insight N/A An enterprise-wide data warehouse and reporting solution with advanced reporting and business intelligence capabilities.
Insight Author N/A User with access to the ad hoc environment to create and/or edit reports and dashboards.
Insight Consumer N/A User with read-only access to reports and dashboards.
Managerial Report N/A Type of report that provides mid-level detail of data with drill-down functionality to provide a more detailed data view.
Measure
Type of data element that represents numeric values that can change based on the calculation or scenario (e.g., employee count, totals).
My Folders N/A Folder in the Catalog that contains the user’s privately saved reports; these reports cannot be accessed by other users.
Operational Report N/A Type of report that provides the most detailed view of data and answers a business question with a simple table and/or graph.
Pay Data (PAYTA) N/A Data source that provides bi-weekly net salary payroll data for salary payments and employee leaves after the Pay Computation System (PAYE).
Payroll Accounting System (PACS)
N/A Data source that contains employee profile information and process personnel actions such as transfer, promotion, accession, performance appraisals etc.
Personnel History (PERHIS)
N/A Data source that contains historical payroll and personnel information.
PINE N/A Personnel Input and Edit System; data results in daily updates in Insight.
Prompt
Mechanism that restricts data at the time the report or dashboard runs.
Salary N/A Data source that provides the payroll actions processed each pay period.
70

Concept/Item Icon Description
Schedule
Program a report to run at a certain time and/or frequency.
Shared Folders N/A Folder in the Catalog that provides access to the Common Report Library, Agency Folder, Shared Across Agencies Folder, etc.
Subject Area N/A Broadest category of data in Insight. Table Management (TMGT)
N/A Data source that provides table records containing selected data elements from the payroll/personnel, financial and administrative systems.
Value N/A Individual piece of information reported for a data element.
71

9.2. Appendix B: Permissions
Applying Permissions to Catalog Objects
Permissions control access to shared information in Catalog Objects and Interactive Dashboards.
1. Click the Catalog action link from the top navigation bar.
1. Highlight the object in the Catalog.
2. Click on the More action link and select Permissions from the more drop-down menu.
3. From the Permissions window users can set permissions for Catalog objects including folders, dashboards, and reports.
4. The permissions table lists the users for which you have assigned permissions.
5. Click the New icon to add permissions to users.
6. From the Add Application Roles, Catalog Groups and Users window, type the user name in the Name text box.
7. Select Users from the List Drop-Down Menu.
8. Click Search.
9. The user name appears in the Accounts table. Select the user name and click on the More arrow to add it to the Selected Members table.
10. Click OK to Navigate back to the Permissions window.
11. Apply permissions to the users in the Accounts table from the Permissions drop-down menu.
• Full Control: Grants full permissions for a Catalog Object.
• Modify: Grants read, write, and delete permissions.
• Open: Grants read access to all objects and allows users to traverse folders.
• Traverse: Applies only to folders, allows movement through the folder to reach other objects or folders.
• No Access: Denies all permissions for a Catalog Object.
• Custom: Creates specific permissions to grant to users.
IMPORTANT: Users can select permissions for IDs with “Custom” permissions by clicking the Edit View icon and selecting from a menu of options (e.g., Read, Write, Delete etc.).
72

12. Additional options for permission modification are available in the Permissions
window navigation bar.
• Apply Effective Permissions: Applies permissions based on the selected user’s group role and assignments.
• Replace with Parent’s Folder Permissions: Applies permissions from the highest level folder.
• Set Parent’s Folder’s Permission to Traverse Folder: Applies permissions for users to access through folders to a desired folder, report or dashboard, but necessarily to all items within that folder.
• Apply Permissions: Allows users to select permissions for the object for the selected user or role.
• Delete: Delete a user’s permission and settings.
IMPORTANT: Users can use Ctrl+click to select multiple users in the list and apply permissions to multiple users by clicking the Apply Permissions icon.
13. Select “Apply permissions to sub-folder” to grant the same permissions granted to a parent folder on a sub-folder.
14. Select “Apply permissions to items within folder” to grant the same permissions granted to a parent folder on a sub-folder.
IMPORTANT: When an object is saved to the Catalog the parent folder’s permissions are applied automatically.
73