insight, innovation, and communication through visual...
TRANSCRIPT
1
Insight, Innovation, and Communication Through Visual Computing at Virginia Tech
PRELIMINARY DRAFT
May 5, 2007 Vers. 0.7
Nicholas F. Polys, Ph.D. VT Research and Cluster Computing
Terry Herdman, Ph.D. Associate Vice President for Research Computing
Director, ICAM
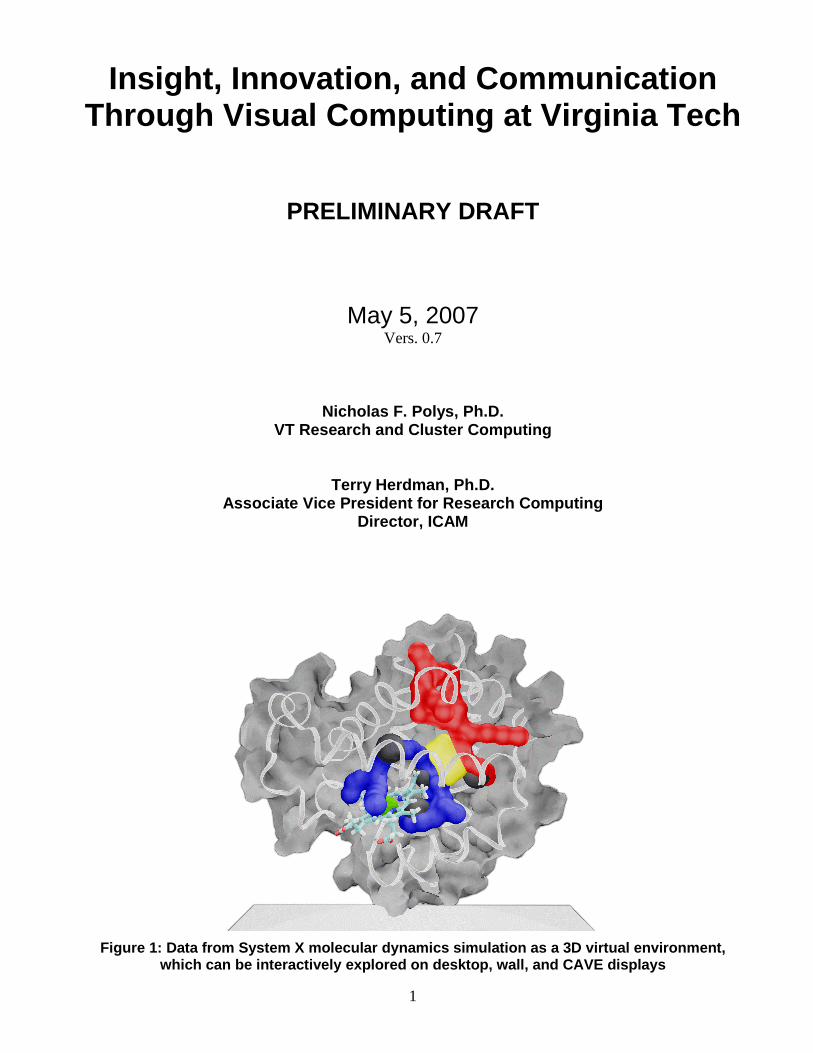
Figure 1: Data from System X molecular dynamics simulation as a 3D virtual environment,
which can be interactively explored on desktop, wall, and CAVE displays

2
Table of Contents:
1. Introduction 3 2. Background 4 3. Competitive Assessment 4 4. Strategic Plan 5 5. Proposal 6 6. Summary 8 7. Budget 9 Appendix A: Faculty Testimonials 10 Appendix B: CAVE history 13
ABSTRACT Virginia Tech rounded out the millennium as a world leader in Scientific Visualization and Immersive Virtual Environments. With one of the few CAVEs in academia during the late 90s and early 00s, Virginia Tech faculty used the facility for scientific discovery, engineering design, training, and as a venue to test the benefits of immersive technology. Through classes and projects in multiple colleges, numerous graduate and undergraduate students have used the facility to innovate application tools and visualization methods. The CAVE is also a flagship venue for outreach and tours of VT’s technological capabilities. The CAVE has always been an open resource for the VT community at large. While it has generated significant research dollars over the years, few of those have made it back to the CAVE for overhead or maintenance. Despite its high-profile status and widespread value to the community, the CAVE has maintained its operation only through a few angel deans. As a result the CAVE projection and tracking technology has become outdated and failing. While many other institutions have invested in visualization infrastructure over the years, VT has not. More and more research in Human-Computer Interaction (HCI) is proving the benefits of immersive display technology in the research, and design, and educational enterprises. This proposal describes a strategic plan to modernize and expand Virginia Tech’s visualization activities across campus. Through personnel changes, upgrades of visualization infrastructure, and a budget for overhead and operational costs, university researchers and students will have reliable, centralized access to cutting-edge facilities and expertise.

3
1. INTRODUCTION A top concern for computational scientists, the one recognized by the NIH, NSF, DHS, DoD, DoE, and DARPA, is managing the data explosion through the development of better visualization tools. Across domains, researchers, engineers, and designers are faced with large volumes of heterogeneous data. While computers can provide excellent memory and computational prostheses for solving complex problems, they are unable to match the human’s abilities for pattern-recognition, creative reasoning, and insight. It is imperative that next-generation user interfaces leverage the strengths of the human operator to create useful and economical tools for analysis and decision-making.
Visual Computing tools facilitate analytical reasoning on large heterogeneous data sets through interactive visual interfaces. Visual Computing tools include graphical user interfaces, virtual environments, information visualization, and augmented reality. Such tools are also known as ‘visual analytics’ tools and complement data-mining, statistics and High-Performance Computing (HPC) systems such as simulation and numeric computation. These are essential tools for discovery and learning.
Visual computing research activities include visualization, computer graphics, image processing, medical imaging, virtual reality, user interfaces, computer-supported collaborative work, computer-aided design, multimedia, and computational geometry, as well as numerous applications of these areas.
Figure 1 shows a conceptual model of the role of Visual Computing as a transformational technology. The Visual Computing Group of Virginia Tech will provide the dedicated staff and infrastructure support required to fully realize the potential of visual computing for computational science and education at Virginia Tech. Because integrated visualization capabilities are necessary for users to gain a full understanding of complex relationships in their heterogeneous data, application designers must take account of how humans build their cognitive models and what perceptual predispositions and biases are in play. With such knowledge, interface designers can take steps to minimize or leverage their effect and create advantageous research, design, and decision-support applications.
The benefits of Visual Computing methodology can be seen in empirical studies of visual analysis tools and display venues (e.g. Polys, 2006). On large-format projection displays for example, we are able to view and interact with visual objects at life size. Tracking and stereo technology further embody the user in the dataset. In surround displays such as the CAVE, immersion can be advantageous for both visualization and design tasks (e.g Bowman & Raja, 2004). On large format high-resolution displays such as the Gigapixel, users can analyze 27 times more data in 1/3 the time (Ball et al, 2005; Ni et al 2006).
The group represents an important element of advancing VT leadership in research and education through visual communication. Through faculty and graduate education and development support, VT Visual Computing Group can help scientists and researchers to be more productive and more competitive. In addition, the proposed plan will proliferate visual computing solutions around university and classrooms. The Visual Computing Group will anchor VT’s efforts in establishing visual computing as a core competency and world-class resource.
Figure 1: Concept Map for Visual Computing as a Critical, Transformational Technology

4
2. BACKGROUND
In its first eight months, the pilot position created in Virginia Tech Information Technology for 2006-2007 has enabled significant progress and opportunities for the Virginia Tech Community. The position has served several important functions in advancing the University’s Visual Computing capabilities and paving the way for further progress. Through personnel reorganization and improvements to hardware and software infrastructure, the activity and tenor of activities surrounding visualization have become quite positive.
The goals of adoption and access for the VT community have been pursued through a number of avenues such as spring and summer FDI courses (“Deep Media for Research and Education”) as well as a credit GEDI course (“Introduction to Computational Science”). Specific, high-impact projects were also targeted to demonstrate the technology and value of Visual Computing in the research enterprise. Through a series of project-consultations and development, the Visual Computing team has delivered solutions for cutting-edge computational scientists in domains as varied as Molecular Dynamics to Space Energetics to Spatial Statistics Analysis. The results are shown throughout this report.
We have continued to further VT’s leadership and recognition in enabling visualization tools and technologies. VT Visual Computing has actively engaged in the specification of international standards for networked interactive 3D media and user interfaces (Web3D / ISO ) as well as 3D medical imaging (DICOM). During this time we have also notably contributed to numerous well-regarded international conferences as: program co-chair, workshops chair, workshop organizer, paper presenter, panelist, and exhibitioners.
Our initial successes provide guidance as to how we may meet the multiple requirements of world-class research, education, and outreach. Transferring technology insights from CS and HCI research into applied solutions for scientists, students, and citizens. We hope to forge stronger partnerships and networks of support within the University, the Commonwealth, and national agencies. With the common goals of enabling knowledge and discovery, we hope to advance the VT Visual Computing program and grow the vibrant and innovative environments of next-generation communication. The future of visualization at Virginia Tech depends sustained commitment from the community and the administration for personnel, equipment, and software resources.
3. COMPETITIVE ASSESSMENT
The trend towards visualization investments can be seen in a number of prominent National Labs and Research Universities that have made significant commitments in visualization infrastructure and support. These investments include visualization facilities, equipment, and operational costs including maintenance and administration of the technology. For example, Purdue’s Envision Center (http://www.envision.purdue.edu/) is the result of a modest initial investment ($2 mil) but sustained support. Iowa State’s Virtual Reality Applications Center (http://www.vrac.iastate.edu/) ($10 mil+), the University of Louisiana’s Immersive Technology Enterprise (http://www.lite3d.com) ($27 mil), and the UNC Charlotte Visualization Center (http://www.viscenter.uncc.edu) are other examples where institutional commitment has resulted in attracting and retaining the best scientists, faculty, and students.
Nationwide in the last 5 years, over 35 colleges and universities ranging from Marshall University to Indiana University to Stanford have built modern visualization facilities with large-format, high-resolution immersive displays. Many of the National Labs and Research Centers such as Los Alamos, Oak Ridge, and NIST also operate cutting-edge visualization facilities with a staff of visualization technology experts who support the domain experts in building tools for their research. These visualization experts essentially facilitate the process of discovery through the development of digital tools. They learn the scientists’ language, the details of their problem, and devise useful solutions. These experts are crucial to the success of next-generation of Visual Computing applications.

5
4. STRATEGIC PLAN
A. Visual Computing Group Mission:
• Education, outreach, and consulting support to faculty and researchers regarding the value and application of Visual Computing and HPC for their productivity
o FDI tracks o GEDI courses o Office hours & consulting o Open-house every semester
• Provide ‘World-Class’ visualization facilities for university researchers, faculty, and students
o Upgrade and proliferate display hardware for resolution and brightness o Build cutting-edge software stack for domains, emphasizing content portability and
ease of use o Build and maintain online multi-user collaborative spaces o Deploy visualization web services middleware to HPC systems
• Provide staff to:
o Consult with researchers about applications of visualization technology o Train graduate students o Develop visualization solutions for domain experts / HPC users o Develop additional grants and funding streams with domain experts to include
visualization tools and HPC
B. Development & Support Well-run facilities are only part of the equation however. From scientific, medical, design, and teaching domains, visual communication is the common denominator for the knowledge economy. To lower the barrier of entry to high-end computation and visualization tools, support services and software infrastructure are required, specifically technical expertise for application development services. By establishing a focused venue for visualization development, VT can produce industry-grade tools that address the most challenging research problems (e.g. Figures 1 and 2). Through consultation and project development, we have provided expertise and solutions for projects in the following departments: CS, Math, Biochemistry, Physics, Plant Pathology, Building & Construction,
Architecture, Art & Art History.
In the interest of connecting the CAVE, satellite sites, and HPC resources, the group will continue to the development of open-source solutions for information management, delivery, and visualization. This includes informatics gateways and lab management software as well as visualization components and web services for individual or collaborative use. The group will actively participate in International Standards (e.g. ISO, Web3D, W3C) development for networked 3D graphics and
Figure 2: ICAM DARPA Project: Movie & Vis Processing Framework (Polys et al, 2007)

6
visualization systems, further establishing VT as a leader in visual computing technology. As the hardware and software technology infrastructure is established, the staff will be expanded to serve more researchers, departments, and projects.
C. Engineering Education & NSF Center for eDesign In order to build more momentum behind the use of 3D visualization in research and education, we initiated and completed the relocation of Dr. Janis Terpenny and her NSF Center for eDesign to the CAVE lab in Torgersen hall. Dr. Terpenny’s research in design process and prototyping strongly complements the capabilities of the Visual Computing Group. Her collaborators, industry contacts and students continue to drive innovative applications of visual methods in engineering.
D. Northern Capitol Region A crucial component in the success of VT’s Northern Capitol Region (NCR) presence is visual computing and communication. The top national agencies, labs, and universities recognize the importance of visualization support for scientists through their hardware and software infrastructure and application development. In order to be competitive in this space, VT must make a commitment to build this program and enable the community with cutting-edge capabilities and expertise.
By building up the Visual Computing program at the main campus, VT will be well-positioned to present its best and brightest to the NCR. For example with infrastructure, staff, and tools in place on the main campus, VT scientists and educators will be enabled with visual tools for analysis, insight and communication. This will be especially beneficial for visual presentations of their research results on big science problems to funding agencies and industry. In addition, these tools can be the basis for workshops and training sessions held for local industry. E. The Commonwealth and the Nation Through Usability and Software Engineering, computer scientists are enabling powerful new tools to manage the information explosion. As a leader in building the future of research and engineering, Virginia Tech has a distinct opportunity to put its knowledge and land-grant charter into practice. Through technology development and support, VT can innovate and deliver robust Visual Computing solutions. The Visual Computing technologies described here can be applied to any number of additional remote collaboration and distance learning applications, including K-12, other universities, local and state institutions.
5. PROPOSAL
A. Personnel The pilot position as facilitator and enabler of visualization applications for Research Computing has proven to meet an important need of the community by connecting researchers and their data through best-of-breed technology and tools. In addition, consulting, development, and grant proposals have resulted in a number of successful and high-profile projects and publications. The flexibility to meet new opportunities and liaison with multiple stakeholders is important for this role.
Significant progress has been made in supporting faculty research and education through this position. In addition, significant progress has been made in advancing VT’s international leadership in cutting-edge technologies. However, the nature of a post-doctoral position has some limitations in fully meeting the needs of all the Visual Computing activities on campus. For example, faculty and students from many colleges use the CAVE and Stereo wall facilities for research, classes and outreach and to great benefit. However, there is no funding stream in place to support educational and outreach activities involving these resources. The CAVE is an essential research and pedagogical tool as well as a flagship publicity venue.
We recommend that a Directorship position be created to take over management and administrative duties related to Visual Computing facilities around campus, including the CAVE. This position should

7
have a base funding stream for salaries, overhead, and maintenance in serving the VT community for 3-5 years. This position may be an academic year appointment in order that the Director can pursue external research funding as PI or Co-PI.
More staff may be added in coming years, but in the short term, a set of students internships and GRAs should also be created that would assist in developing web-based interactive 3D environments for class and public communication. Graduate and Undergraduate students can scale the impact of visualization technologies across domains. Through consultation and project development we have provided expertise to graduate students and their projects from CS, Civil Engineering, Mechanical Engineering, Fisheries & Wildlife Science.
A VR Systems Engineer is crucial for the maintenance and development of VT’s cutting-edge visualization and immersive systems. IT, College of Engineering, and the office of the Provost have secured one year of continued support for Patrick Shinpaugh, an experienced developer and administrator. We recommend this position be made permanent to facilitate operations and maintain access to software, hardware, and files for HPC, stereo wall and CAVE systems across campus and the CRC. In the coming years, collaborative virtual environments will explode; we must be ready to leverage the impact of collaboration research and distance learning systems. We propose VR and Webservices programmers to be hired to build and maintain VT’s Multi-user online worlds (environments similar to games or SecondLife). The collaborative infrastructure will support multiple platforms.
In all aspects of visual computing and communication, ‘Content is King’. With more groups on campus producing interactive 3D data and environments, providing multiple avenues to build authors’ skill sets will be valuable. Student wage staff could assist in running scheduled and special-case tours of the facilities. With additional consensus toward a positive broad-based plan and with financial support from the University, we believe VT can make quantum progress in visualization, in line with other top-tier schools and national labs.
B. Facilities A strategic investment from the University now will enable the Visual Computing Group to initiate its multi-disciplinary development, deployment, and research program and position Virginia Tech well for future research and educational productivity. Our approach to building infrastructure and support services includes both hardware and software resources that increase accessibility and enable adoption.
• Upgrade and Proliferate Visual Computing Display Platforms
o The CAVE Over the next 2 years, VT’s display, computing, and network infrastructure in Torgersen needs to be modernized. New high-resolution projectors, tracking systems, and graphics workstations must be purchased to replace the aging CAVE computer system (Figure 3). Resolution and brightness are key components for supporting applications such as medical imaging, microscopy, and applications with text rendering. High-bandwidth network connections are targeted to connect the CAVE and other display systems to System X. As equipment is replaced in Torgersen, it will be distributed to other sites on campus including labs and classrooms.
Figure 3: Biochemical Analysis in the CAVE

8
o The Gigapixel In recent CHCI research, large-format high-resolution visualization displays have demonstrated an analytic workforce multiplier of up to 10x. This purchase will make Gigapixel technology accessible to more researchers and students (Figure 4).
o Stereo walls With modern commodity projectors, large-format stereo walls may be proliferated to labs, departments, and instructional venues. In conjunction with faculty, we have deployed stereo walls to a number of labs and departments including IT (Figure 5), Art, Architecture, Biology, Civil Engineering, and possibly VCOM.
• Software Infrastructure
o Cross-cutting technology foundations for content pipelines We will continue to target integrated information services to enable storage and retrieval of large heterogeneous data sets over the web including macro, micro, and nano objects, their structures, properties and relationships. Standards-based systems insure interoperability and longevity.
o Visualization and analysis components We will continue to develop front-end interface components for integrated information spaces on desktop and immersive systems. In addition, we hope to purchase Amira, a long-requested industry-grade analytic tool with support for molecular, microscopy, medical, CAD, and GIS data.
o Domain-specific solutions & evaluations We have surveyed, collected, formalized, and installed a core base of visual analytic software that can serve a majority of users across campus. Across departments, we identified the top tools and data formats in use for domains as varied as: Physical and Bio-chemistry, CAD, Fluid Dynamics, and GIS. This software stack enables users to run familiar applications on the range of hardware systems and display platforms.
6. SUMMARY
In this first year, we have demonstrated the value of visualization development and operations for VT to be a world-renown innovator in Visual Computing. To be truly successful and compete with top-tier institutions, we believe is essential to have sustained commitment from the University administration and community as well as federal funding agencies. The organizational structure of Virginia Tech has been a challenge for our goals of open access. For example, visualization capabilities cut across research, education, and outreach activities. While we have proven that our approach meets a broad-based need and we have engaged stakeholders, obtaining consensus and investment from multiple parties has proven a difficult task. Indeed at the current level of support, we are at a bare-bones survival budget: if equipment breaks, that functionality goes off line.
Figure 4: Geospatial Analysis on the Gigapixel
Figure 5: Molecular Dynamics Analysis on a high-res stereo wall

9
The most positive outcome would be administrative support for this comprehensive visualization plan that leverages VT’s expertise and resources. By funding staff, overhead, and maintenance costs, we can provide the community with demonstrated solutions that are on par with other nationally-ranked institutions. For example, the strategic investments proposed here will allow reliable access to facilities and a scaling of visualization consulting and development services.
7. BUDGET
There are many stakeholders in VT Visual Computing; the benefits and responsibilities must be shared. For example, ETF, Governor’s funds, ICTAS, and the Provost could contribute to hardware upgrade and electrical upgrade funding. Then IT, Research Division, Provost, and Deans could contribute to Operations and Personnel. The key to success is long-term thinking and cooperation toward a shared vision. This plan will re-energize VT’s visualization activities and put it once again at the forefront of research, education, and outreach.
Table 1: Proposed Budget for Visual Computing Activities (See spreadsheet Visual_Computing08-12.xls)
References
Bowman, D., and Raja, D. A . (2004). Method for Quantifying the Benefits of Immersion Using the CAVE. Presence-Connect (online journal) 4(2), Available at: www.presence-connect.com.
Munzner, T. J., C.; Moorhead, R.; Pfister, H.; Rheingans, P.; Yoo, T.S. (2006). NIH-NSF visualization research challenges report summary. IEEE Computer Graphics and Applications 26, 20 - 24.
Ni, T., Bowman, D., and Chen, J. (2006). Increased Display Size and Resolution Improve Task Performance in Information-Rich Virtual Environments. Paper presented at: Proceedings of Graphics Interface.
Polys, N. F. (2006) Display Techniques in Information-Rich Virtual Environments, Computer Science Dissertation, Virginia Polytechnic Institute and State University, Blacksburg.
Polys, Nicholas F., Shapiro, Michael., Duca, Karen, “IRVE-Serve: A Visualization Framework for Spatially-Registered TimeSeries Data”. The Web3D 2007 Symposium, ACM SIGGRAPH, 2007.
Thomas, J. J., and Cook, Kristin A. (2006). A Visual Analytics Agenda. IEEE Computer Graphics & Applications, 10-13.

10
Appendix A: Testimonials for Visual Computing as a Critical University Resource
“As a scientist and educator in Computer Science and Human Computer Interaction, I am especially familiar with the value of visual computing tools for analysis, insight, and communication. Much of my research is in this area and it is an important concern for funding agencies such as NSF, NIH, DHS. By supporting improved visualization facilities and software infrastructure, we will have more opportunities for research funding and more members of the VT community will benefit from these modern technologies.
For example, our recent $0.5M grant from DTO/NGA is a direct result of NSF and VT investments in new visual display technologies at our university such as the GigaPixel Display ($200k GigaPixel, $400k CRI). Our research has shown that such advanced displays and visualizations can provide an analytic workforce multiplier of up to 10x. As a result, federal intelligence agencies have begun to install advanced display equipment for their own analysts and are seeking our help in design. Given our initial successes, VT has a unique opportunity to *invent the future* of visual computing and guide such agencies for many years to come. Through strategic investments in advanced equipment, research, and applications that augment our existing strengths in this area, VT can be a world leader in advanced visual computing.” - Chris North, Associate Professor Computer Science & Center for HCI
“As a scientist and educator in Computer Science and Human Computer Interaction, I am entirely convinced of with value of visual computing tools for domain-specific problems. Much of our success in the development of Virtual Environment and 3D interface tools comes from ‘user-centered’ design where the requirements are the result of extensive user interview and analysis. I support the university initiative to expand visualization activities through the improvement of the CAVE facilities and the addition of staff to enable new tools through development and consultation. In this way, we can realize the benefits of visual computing for many groups on campus. “
- Doug Bowman, Associate Professor Computer Science & Center for HCI
“In many complex systems, dynamic properties are best modeled with their spatial and structural aspects - spatial relationships are important when structure, location, and function are related. Indeed, this is the case in many domains where complex systems are designed, simulated, or analyzed. Complex systems such as epidemiology, social networks, and transportation may be clearly apprehended when visual analysis tools are developed through user-centered methods. I support the university initiative to expand visualization activities through the improvement of the CAVE facilities and the addition of staff to enable new tools through development and consultation. Open access to modern facilities such as large-format and high-pixel displays will improve our success as researchers.”
- Madhav Vishnu Marathe, Deputy Director for Simulation and Computer Sc. Virginia Bioinformatics Institute “In the domain of Materials Science and Engineering, we study the relationships between structure and properties of materials. In particular, my research involves these relationships at the nano and atomistic scales. Our work typically involves the simulation, and analysis of complex crystal structures with features at the nanoscale, atom by atom. Three dimensional visual analyses are essential to provide insight into the structure property relationships that are the main issues in materials design. The CAVE and improved visual computing tools are essential to my research. The CAVE provides the unique three dimensional environment for this purpose. Specific software for doing this research both in the CAVE and my desktop is of great importance. For example, AMIRA software is in use in my laboratory as well as in the new Materials Characterization Facility. The same software running on the CAVE will greatly enhance our research capabilities. “
- Diana Farkas, Professor Materials Science & Engineering

11
“In the domain of Biochemistry, we are concerned with the structure and dynamics of molecules as well as their interactions with one another, with an ultimate goal of gaining new insights into function. Our work typically involves the design, simulation, and analysis of complex compounds and visual computing tools are important to my success as a scientist and educator. Many commercial and open-source tools exist for visual communication and analysis, but fall short in providing the features needed for insight into my specific research problems. I support the university initiative to expand visualization activities through the improvement of the CAVE facilities and the addition of staff to enable new tools through development and consultation. Open access to modern facilities such as large-format and large-pixel displays will improve my success as a researcher and teacher.”
- David R. Bevan, Associate Professor Biochemistry
“As a scientist and educator in the field of Engineering, I have observed the continued development and value of visual digital tools for prototyping, analysis, and communication. I support the university initiative to expand visualization activities through the improvement of the CAVE facilities and the addition of staff to enable new tools through development and consultation. Open access to modern facilities such as large-format and large-pixel displays will improve my success as a researcher and as an educator.
Further, these technologies would allow those of us devoted to reversing trends of under representation to develop initiatives that build on the well documented studies of the positive impacts that visualization has on engaging girls and women in science and engineering at all levels (K-12, undergraduate and graduate students). Finally, visualization is one of the key research thrust areas for the NSF Center for e-Design. Improving the infrastructure at Virginia Tech for visualization is very likely to dramatically improve our ability to expand our industry membership in the Center, distinguishing Virginia Tech as a national resource in the country for the use of visualization in the design of products and systems.”
- Janis Terpenny, Associate Professor Dept. of Engineering Education
“As a scientist and educator in Gerontology, I have been involved in visual computing and the CAVE in a variety of exciting ways. For example, through support from the VT-UVA-Carilion Biomedical Institute initiative, VT researchers affiliated with the Center for Geronotlogy have collaborated with colleagues from UVA Neurorehabilitation to construct a virtual tool to assess older adults' memory skills for everyday tasks. This work would not have been possible without open access and support for the CAVE facility. As we continue to think about innovated ways to study and address issues facing our aging nation, open access to modern facilities such as large-format and high-pixel displays will enhance both gerontology research and practice.” - Karen Roberto, Professor/Director Center for Gerontology
“The VT CAVE facility provides a unique and immeasurable benefit to the University community. In my research, the ability to implement and test software algorithms on the 6DOF motion platform prior to costly sea trials allows me to develop robust, effective, and affordable deliverables for my sponsors.” - Leigh McCue, Asst Professor Aerospace and Ocean Engineering
“In the artistic enterprise, we are constantly looking for new avenues of expression and design. Venues such as the CAVE and stereo walls provide exciting opportunities for artists to experiment with rich media in immersive forms. By supporting improved visualization facilities and software infrastructure, more members of the VT community will be able to benefit from these modern technologies. Open access to modern facilities such as large-format and high-pixel displays will continue to drive VT’s innovation and creativity in the digital arts.”
- Truman Capone Head, Art and Art History College of Architecture and Urban Studies

12
“As a practitioner and educator in Architecture, we make extensive use of visual computing tools for design and communication. Through modern databases and graphics, architects are empowered to envision new spaces and guide them into reality. In the future, we look forward to connecting our desktop tools, stereo walls, Gigapixels, and the CAVE into a seamless workspace for innovation and insight. Open access to modern facilities such as large-format and high-pixel displays will improve our success as both researchers and teachers.”
- Robert Schubert, Professor/Assc.Dean of Research College of Architecture and Urban Studies
“The VT CAVE facility provides an important service to University and its research, educational, and outreach goals. For two years I had my office in the VT CAVE space and can testify first hand how important that facility is for many of my colleagues. The accessibility of the CAVE and other equipment helped me tremendously to do research in tangible user interfaces and visual analytics, as well as to support NIH and DARPA funded research. The proposed upgrade and expansion of VT CAVE is long overdue. I will be happy to help that expansion and I am looking forward to use the new capabilities once they become available.“
- Denis Gracanin, Associate Professor Computer Science & Center for HCI

13
Appendix B: History In 1995 nine faculty were identified as “building authors” who were associated with the Advanced Communication and Information Technology Center (ACITC). These original faculty were asked to lead their respective areas as a university wide multidisciplinary activity in not only research, but also education and outreach. Through a series of NSF grants and cost sharing from 4 colleges, the CAVE was built as part of the University Visualization and Animation Group (UVAG) facility in the ACITC. The UVAG is one of several information technology activities: Digital Libraries, Human Computer Interaction, High Performance computing, Institute for Distance Learning, etc. are all located in the ACITC. The faculty who have actively used the UVAG facility in Torgersen Hall in their research, education, and outreach activities provide one of the best examples of multidisciplinary activity both within the ACITC and also across campus. Table 2 summarizes UVAG’s historical activities.
1996 TO 2004 2004 TO 2006
Participation • Over 30 faculty, 5 colleges and more than 20 departments
• Over 15 faculty, 5 colleges and more than 11 departments
Research • $7,044,461* in funded research projects to UVAG ‘residents’
• 8 M.S. degrees and 2 Ph.D. degrees
• 19 archival publications and 38 conference proceedings
• $ 1,402,434 * in funded research projects to UVAG ‘residents’
• 6 M.S. degrees and 3 Ph.D. degrees • 8 archival publications and 28
conference proceedings • 4 visiting international researchers
and collaborators
Education • 7 new classes, and the modification of 2 existing classes
• 12 workshops and conferences at Virginia Tech
• 2 new classes, and the modification of 2 existing classes
Outreach • A new VE software API (DIVERSE) now used at several national laboratories
• A new inexpensive CAVE computer system: DIVERSE Adaptable Display System (DADS)
• 30+ projects on campus: five colleges
• 9 significant state, national, and international projects
• Expanded user base for DIVERSE software tools
• 14+ projects on campus: five colleges • Significant state, national, and
international projects
Table 2: Summary of UVAG multi-disciplinary success (* denotes grants to UVAG residents Kriz, Bowman, Hix, Gracanin)
After 10 years of successfully building a valuable multidisciplinary resource, the UVAG is poised to re-define
and re-invigorate its mission to the VT community. Our vision for Virginia Tech includes the establishment of University-supported visualization and development facilities to continue the mission of uniting research and educational programs through the development of software resources and hardware facilities such as the CAVE. This includes a dedicated research and administrative staff of visualization and computational experts that support scientists and educators in the development of simulation and visual analysis tools. Enabling domain experts from all across campus with visual computing technology is the primary mission of this group. This will be achieved through the design and development of visual analysis tools - the tools that will drive scientific discovery and pedagogy in this century.