inside quick facts d.c. area labor force top private ... · trendslabor market metropolitan...
TRANSCRIPT

trends Labor Market Research Information
Data for December 2013
Volume 01 | Issue 02
December 2013
labor market
METROPOLITAN WASHINGTON, DC
inside Quick Facts
D.C. Area Labor Force
Top Private Sector Employers
“High Demand, High Wage” Occupations
NEW

trendslabor market
METROPOLITAN WASHINGTON, DC
NEW
Table of Contents
Quick Facts: Over the Month and Over 3 the Year Changes in Unemployment Rate and Job Growth
National Unemployment Rates 3
State Unemployment Rates (Seasonally Adjusted) 3
District of Columbia’s Unemployment Rate 5
District of Columbia’s Civilian Labor Force, 5 Employment and Unemployment
District of Columbia Job Growth 5
Washington Metropolitan Statistical 6 Area (MSA) Job Growth
District of Columbia, Washington 8 Metropolitan Division, and Washington Metropolitan Area Civilian Labor Force
Washington Metropolitan Division Civilian 8 Labor Force Employment and Unemployment Rate
Washington Metropolitan Area Civilian Labor 8 Force Employment and Unemployment Rate
Employment Status by Demographic Groups 10
Unemployment Duration 11
Labor Force by Educational Attainment 11
Not in the Labor Force 11
D.C. Unemployment Insurance Benefit Statistics 15
Explanation of “High Demand, High Wage” Methodology 19
Glossary of Terms and Concepts 19
Note to Our Readers 21

Data for December 2013 | Volume 01 | Issue 02
December 2013 3
States Unemployment Rates
State Net Change From
Dec. 2013p
Nov. 2013
Dec. 2012
Nov. 2013
Dec. 2012
RHODE ISLAND 9.1 9.0 9.9 0.1 -0.8
NEVADA 8.8 9.0 9.8 -0.2 -1.0
ILLINOIS 8.6 8.7 8.6 -0.1 0.0
MICHIGAN 8.4 8.8 8.9 -0.4 -0.5
CALIFORNIA 8.3 8.5 9.8 -0.2 -1.5
DISTRICT OF COLUMBIA 8.1 8.6 8.4 -0.5 -0.3
KENTUCKY 8.0 8.2 8.0 -0.2 0.0
MISSISSIPPI 8.0 8.3 8.9 -0.3 -0.9
TENNESSEE 7.8 8.1 7.6 -0.3 0.2
ARIZONA 7.6 7.8 7.9 -0.2 -0.3
ARKANSAS 7.4 7.5 7.1 -0.1 0.3
CONNECTICUT 7.4 7.6 8.2 -0.2 -0.8
GEORGIA 7.4 7.6 8.7 -0.2 -1.3
NEW JERSEY 7.3 7.8 9.5 -0.5 -2.2
OHIO 7.2 7.4 6.7 -0.2 0.5
NEW YORK 7.1 7.4 8.2 -0.3 -1.1
MASSACHUSETTS 7.0 7.1 6.7 -0.1 0.3
OREGON 7.0 7.3 8.3 -0.3 -1.3
INDIANA 6.9 7.3 8.3 -0.4 -1.4
NORTH CAROLINA 6.9 7.4 9.4 -0.5 -2.5
PENNSYLVANIA 6.9 7.3 7.9 -0.4 -1.0
SOUTH CAROLINA 6.6 7.1 8.6 -0.5 -2.0
WASHINGTON 6.6 6.8 7.5 -0.2 -0.9
ALASKA 6.4 6.4 6.6 0.0 -0.2
NEW MEXICO 6.4 6.4 6.6 0.0 -0.2
COLORADO 6.2 6.5 7.5 -0.3 -1.3
DELAWARE 6.2 6.5 7.1 -0.3 -0.9
FLORIDA 6.2 6.4 7.9 -0.2 -1.7
MAINE 6.2 6.4 7.2 -0.2 -1.0
WISCONSIN 6.2 6.3 6.7 -0.1 -0.5
ALABAMA 6.1 6.2 6.8 -0.1 -0.7
MARYLAND 6.1 6.4 6.7 -0.3 -0.6
TEXAS 6.0 6.1 6.2 -0.1 -0.2
MISSOURI 5.9 6.1 6.6 -0.2 -0.7
WEST VIRGINIA 5.9 6.0 7.4 -0.1 -1.5
IDAHO 5.7 6.1 6.3 -0.4 -0.6
LOUISIANA 5.7 6.3 5.6 -0.6 0.1
OKLAHOMA 5.4 5.4 5.1 0.0 0.3
MONTANA 5.2 5.2 5.6 0.0 -0.4
VIRGINIA 5.2 5.4 5.6 -0.2 -0.4
NEW HAMPSHIRE 5.1 5.1 5.7 0.0 -0.6
KANSAS 4.9 5.1 5.5 -0.2 -0.6
MINNESOTA 4.6 4.6 5.4 0.0 -0.8
HAWAII 4.5 4.4 5.1 0.1 -0.6
WYOMING 4.4 4.4 4.9 0.0 -0.5
IOWA 4.2 4.3 5.0 -0.1 -0.8
VERMONT 4.2 4.4 4.9 -0.2 -0.7
UTAH 4.1 4.3 5.4 -0.2 -1.3
NEBRASKA 3.6 3.7 3.8 -0.1 -0.2
SOUTH DAKOTA 3.6 3.6 4.3 0.0 -0.7
NORTH DAKOTA 2.6 2.6 3.2 0.0 -0.6
p: Preliminary
Quick Facts: Over the Month and Over the Year Changes in Unemployment Rate and Job Growth
National Unemployment Rates
The December 2013 national unemployment rate of 6.5 percent (not seasonally adjusted) was 0.1 percentage point lower than the rate in November 2013 and 0.9 percentage points lower than the rate in December 2012.
The seasonally adjusted national unemployment rate in Decem-ber 2013 was 6.7 percent, down 0.3 percentage points from the November 2013 rate and 1.2 percentage points lower than the December 2012 unemployment rate.
State Unemployment Rates (Seasonally Adjusted)
In December 2013, the District of Columbia had the sixth highest unemployment rate at 8.1 percent. Rhode Island recorded the high-est jobless rate at 9.1 percent followed by Nevada at 8.8 percent; Illinois at 8.6 percent; Michigan at 8.4 percent; and California at 8.3 percent. North Dakota, at 2.6 percent, posted the lowest unem-ployment rate, followed by South Dakota at 3.6 percent, Nebraska at 3.6 percent, and Utah at 4.1 percent.
Forty states, including the District of Columbia, reported over-the-month unemployment decreases, two states had rate increases, and nine states had no rate change. Louisiana recorded the largest rate decrease (0.6 percentage points), followed by District of Columbia, New Jersey, North Carolina, and South Carolina (0.5 percentage points).
Compared to a year earlier, forty-three states, including the District of Columbia, registered unemployment rate decreases, six states reported rate increases, and two states (Kentucky and Illinois) saw no rate change. North Carolina reported the largest jobless rate decrease from a year earlier (-2.5 percentage points), followed by New Jersey (-2.2 percentage points), and South Carolina (-2.0 percentage points). Twelve other states had jobless rates at least 1.0 percentage point lower than a year earlier.

trendslabor market
METROPOLITAN WASHINGTON, DC
NEW
December 2013 (Preliminary)
Ward Labor Force Employment Unemployment UnemploymentRate
1 54,412 51,916 2,496 4.6
2 53,542 52,037 1,505 2.8
3 53,880 52,546 1,334 2.5
4 45,398 42,491 2,907 6.4
5 41,564 37,338 4,226 10.2
6 52,850 49,550 3,300 6.2
7 34,466 29,578 4,888 14.2
8 28,891 24,445 4,446 15.4
November 2013 (Revised)
Ward Labor Force Employment Unemployment UnemploymentRate
1 54,133 51,518 2,615 4.8
2 53,215 51,639 1,576 3.0
3 53,542 52,144 1,398 2.6
4 45,211 42,166 3,045 6.7
5 41,480 37,052 4,428 10.7
6 52,628 49,171 3,457 6.6
7 34,473 29,351 5,122 14.9
8 28,917 24,258 4,659 16.1
December 2012
Ward Labor Force Employment Unemployment UnemploymentRate
1 54,584 51,442 3,142 5.8
2 53,456 51,562 1,894 3.5
3 53,747 52,067 1,680 3.1
4 45,763 42,104 3,659 8.0
5 42,317 36,997 5,320 12.6
6 53,252 49,098 4,154 7.8
7 35,462 29,308 6,154 17.4
8 29,819 24,222 5,597 18.8
Note: Estimates for the latest year are subject to revision early the following calendar year.Ward Labor force data is based on the District’s monthly unemployment data, and the 5-year American Community Survey (ACS)
Source: DOES - Office of Labor Market Research and Information (OLMRI).Not seasonally adjusted data
District of Columbia Labor Force, Employment, Unemployment and Rate by Ward

Data for December 2013 | Volume 01 | Issue 02
December 2013 5
District of Columbia’s Unemployment Rate
The District of Columbia’s seasonally adjusted December 2013 unem-ployment rate was 8.1 percent, down 0.5 percentage points from the November 2013 rate and 0.3 percentage points lower than the rate in December 2012.
District of Columbia’s Civilian Labor Force,
Employment and Unemployment
Over the month, the District of Columbia’s not seasonally adjusted civilian labor force increased by 1,400 to 365,000. A total of 339,900 residents were employed and 25,100 were unemployed in December 2013. The number of employed residents increased by 2,600 along with a decrease in the number of unemployed residents of 1,200, resulting in a 0.3 percentage point drop in the not seasonally adjusted unemployment rate.
From December 2012 to December 2013, the District’s civilian labor force decreased by 3,400, as the number of employed residents increased by 3,100 and the number of unemployed residents decreased by 6,500, resulting in an over the year 1.7 percentage point decrease in the not seasonally adjusted unemployment rate.
District of Columbia Job Growth
The not seasonally adjusted number of District wage and salary jobs decreased by 2,300 (-0.3 percent) from November to December 2013. The private sector lost 2,700 jobs (-0.5 percent) while the public sector added 400 jobs (+0.2 percent). In the private sector, Trade, Transportation and Utilities increased by 500 jobs (+1.8 percent), and Professional and Business Services added 100 jobs. The private sectors that lost jobs included: Educational and Health Services (-1,400 jobs), Leisure and Hospitality (-1,000 jobs), Other Services (-400 jobs), Natural Resources and Construction (-400 jobs), and Financial Activities (-100 jobs). Meanwhile, the Information and Manufac-turing sectors were unchanged over the month. In the public sector, the District government and the Federal government gained 200 jobs each, while Transportation remained unchanged over the month.
In the last twelve months, the District lost a total of 400 jobs (-0.1 per-cent). The private sector added 5,100 jobs (+1.0 percent) and the public sector lost 5,500 jobs (-2.3 percent). The private sector growth occurred in Leisure and Hospitality (up by 3,900 jobs or 6 percent), Professional and Business Services (up by 1,700 jobs), Financial Activities (up by 700 jobs), and Trade, Transportation and Utilities and Educational and Health Services (up by 400 jobs each). Losses were noted in Other Services and Natural Resources and Construction (down by 700 jobs each), and Information (down by 600 jobs). Meanwhile, Manufacturing remained unchanged over the year. In the public sector, the District government gained 700 jobs and Transportation added 100 jobs, while the Federal government shed 6,300 jobs over the year.
8.1%The District of Columbia’s seasonally adjusted December 2013 unemployment rate was 8.1 percent.

trendslabor market
METROPOLITAN WASHINGTON, DC
NEW
!"
#"
$"
%"
&"
'"
()"
Nov-12 Dec-12 Jan-13 Feb-13 Mar-13 Apr-13 May-13 Jun-13 Jul-13 Aug-13 Sep-13 Oct-13 Nov-13
Une
mpl
oym
ent
Rat
e (%
)
Unemployment Rate November 2012 - November 2013
(Seasonally Adjusted)
D.C. MSA D.C. U.S.
!"
#"
$"
%"
&"
'"
)"
Nov-12 Dec-12 Jan-13 Feb-13 Mar-13 Apr-13 May-13 Jun-13 Jul-13 Aug-13 Sep-13 Oct-13 Nov-13
Unemployment Rate November 2012 - November 2013
(Seasonally Adjusted)
D.C. MSA D.C. U.S.
4
5
6
7
8
9
10
Dec-12 Jan-13 Feb-13 Mar-13 Apr-13 May-13 Jun-13 Jul-13 Aug-13 Sep-13 Oct-13 Nov-13 Dec-13
Une
mpl
oym
ent
Rat
e (%
)
Unemployment Rate December 2012 - December 2013
(Seasonally Adjusted)
D.C. MSA D.C. U.S.
Washington Metropolitan Statistical Area (MSA)
Job Growth
Total wage and salary employment in the Washington Metropolitan Statistical Area decreased over the month in December 2013 by 400. The private sector decreased by 1,300 jobs (-0.1 percent) while the public sector increased by 900 jobs (+0.1 percent). Within the private sector, gains were registered in Trade, Transportation and Utilities (up by 2,400 jobs or 0.6 percent), Financial Activities (up by 900 jobs), Information (up by 500 jobs), and Professional and Business Services (up by 400 jobs). Losses were experienced in Natural Resources and Construction (down by 2,300 jobs), Leisure and Hospitality (down by 1,400 jobs), Other Services (down by 700 jobs), Educational and Health Services (down by 600 jobs), and Manufacturing (down by 500 jobs). In the public sector, the Federal government gained 200 jobs.
During the last twelve months, the Washington Metropolitan Statistical Area gained a total of 25,800 jobs (+0.8 percent). The private sector add-ed 28,800 jobs (+1.2 percent) and the public sector lost 3,000 jobs (-0.5 percent). Private sector growth occurred in Leisure and Hospitality (up by 15,300 jobs or 5.5 percent), Financial Activities (up by 6,600 jobs), Trade, Transportation and Utilities (up by 4,400 jobs), Educational and Health Services (up by 3,600 jobs), and Professional and Business Services (up by 2,600 jobs). Losses were registered in Other Services (down by 1,700 jobs), Information (down by 1,100 jobs), Manufacturing (down by 500 jobs), and Natural Resources and Construction (down by 400 jobs). In the public sector, the Federal government decreased by 8,400 jobs.
Unemployment Rate December 2012 - December 2013 (Seasonally Adjusted)
Un
emp
loy
men
t R
ate
(%)
Dec-12 Jan-13 Feb-13 Mar-13 Apr-13 May-13 Jun-13 Jul-13 Aug-13 Sep-13 Oct-13 Nov-13 Dec-13
4
5
6
7
8
9
10
D.C. MSA D.C. U.S.
!"
#"
$"
%"
&"
'"
()"
Nov-12 Dec-12 Jan-13 Feb-13 Mar-13 Apr-13 May-13 Jun-13 Jul-13 Aug-13 Sep-13 Oct-13 Nov-13
Une
mpl
oym
ent
Rat
e (%
)
Unemployment Rate November 2012 - November 2013
(Seasonally Adjusted)
D.C. MSA D.C. U.S.
!"
#"
$"
%"
&"
'"
)"
Nov-12 Dec-12 Jan-13 Feb-13 Mar-13 Apr-13 May-13 Jun-13 Jul-13 Aug-13 Sep-13 Oct-13 Nov-13
Unemployment Rate November 2012 - November 2013
(Seasonally Adjusted)
D.C. MSA D.C. U.S.
4
5
6
7
8
9
10
Dec-12 Jan-13 Feb-13 Mar-13 Apr-13 May-13 Jun-13 Jul-13 Aug-13 Sep-13 Oct-13 Nov-13 Dec-13
Une
mpl
oym
ent
Rat
e (%
)
Unemployment Rate December 2012 - December 2013
(Seasonally Adjusted)
D.C. MSA D.C. U.S.

Data for December 2013 | Volume 01 | Issue 02
December 2013 7
INDUSTRY Dec.b
2013Nov.c
2013Dec.2012
Net Change From % Change From
Nov.2013
Dec.2012
Nov.2013
Dec.2012
TOTAL 734.7 737.0 735.1 -2.3 -0.4 -0.3% -0.1%
Total Private Sector 500.5 503.2 495.4 -2.7 5.1 -0.5% 1.0%
Total Government 234.2 233.8 239.7 0.4 -5.5 0.2% -2.3%
Total Goods Producing 13.6 14.0 14.3 -0.4 -0.7 -2.9% -4.9%
Manufacturing 0.9 0.9 0.9 0.0 0.0 0.0% 0.0%
Natural Resources, Mining & Construction 12.7 13.1 13.4 -0.4 -0.7 -3.1% -5.2%
Total Service Providing 721.1 723.0 720.8 -1.9 0.3 -0.3% 0.0%
Trade, Transportation & Utilities 28.3 27.8 27.9 0.5 0.4 1.8% 1.4%
Wholesale Trade 5.1 5.1 5.1 0.0 0.0 0.0% 0.0%
Retail Trade 19.2 18.7 18.7 0.5 0.5 2.7% 2.7%
Information 29.2 29.3 28.5 -0.1 0.7 -0.3% 2.5%
Financial Activities 17.3 17.3 16.9 0.0 0.4 0.0% 2.4%
Finance and insurance 11.9 12.0 11.6 -0.1 0.3 -0.8% 2.6%
Real Estate and Rental and Leasing 157.1 157.0 155.4 0.1 1.7 0.1% 1.1%
Professional and Business Services 110.5 110.1 108.6 0.4 1.9 0.4% 1.7%
Professional, Scientific, and Technical Services 30.3 30.4 29.8 -0.1 0.5 -0.3% 1.7%
Legal Services 13.3 11.8 11.7 1.5 1.6 12.7% 13.7%
Administrative & Support & Waste Mgmt & Remediation 44.5 44.8 45.5 -0.3 -1.0 -0.7% -2.2%
Employment Services 12.1 12.1 13.3 0.0 -1.2 0.0% -9.0%
Educational and Health Services 119.1 120.5 118.7 -1.4 0.4 -1.2% 0.3%
Educational Services 54.0 55.6 54.3 -1.6 -0.3 -2.9% -0.6%
Colleges, Universities, and Professional Schools 38.9 40.9 40.0 -2.0 -1.1 -4.9% -2.8%
Health Care and Social Assistance 65.1 64.9 64.4 0.2 0.7 0.3% 1.1%
Ambulatory Health Care Services 16.3 16.1 15.7 0.2 0.6 1.2% 3.8%
Hospitals 28.4 28.1 28.0 0.3 0.4 1.1% 1.4%
Nursing and Residential Care Facilities 7.8 7.8 8.1 0.0 -0.3 0.0% -3.7%
Leisure and Hospitality 68.6 69.6 64.7 -1.0 3.9 -1.4% 6.0%
Arts, Entertainment, and Recreation 6.6 6.8 6.7 -0.2 -0.1 -2.9% -1.5%
Accommodation and Food Services 62.0 62.8 58.0 -0.8 4.0 -1.3% 6.9%
Accommodation 15.9 16.0 15.5 -0.1 0.4 -0.6% 2.6%
Food Services and Drinking Places 46.1 46.8 42.5 -0.7 3.6 -1.5% 8.5%
Full-Service Restaurants 22.8 23.0 22.4 -0.2 0.4 -0.9% 1.8%
Limited-Service Eating Places 15.0 14.9 14.2 0.1 0.8 0.7% 5.6%
Special Food Services 5.0 5.4 5.0 -0.4 0.0 -7.4% 0.0%
Wage and Salary Employment by Industry and Place of Work (In Thousands)a
District of Columbia

trendslabor market
METROPOLITAN WASHINGTON, DC
NEW
Wage and Salary Employment by Industry and Place of Work (In Thousands)a
District of Columbia (cont.)
INDUSTRY Dec.b
2013Nov.c
2013Dec.2012
Net Change From % Change From
Nov.2013
Dec.2012
Nov.2013
Dec.2012
Other Services 68.3 68.7 69.0 -0.4 -0.7 -0.6% -1.0%
Religious, Grantmaking, Civic, Prof, & Similar Organizations
60.6 60.9 61.5 -0.3 -0.9 -0.5% -1.5%
Business, Professional, Labor, Political, & Similar Organizations
26.5 26.4 26.7 0.1 -0.2 0.4% -0.7%
Government 234.2 233.8 239.7 0.4 -5.5 0.2% -2.3%
Federal Government 200.1 199.9 206.4 0.2 -6.3 0.1% -3.1%
State Government & Local Government / Public Transportation
34.1 33.9 33.3 0.2 0.8 0.6% 2.4%
Local Government 29.6 29.4 28.9 0.2 0.7 0.7% 2.4%
Public Transportation 4.5 4.5 4.4 0.0 0.1 0.0% 2.3%aData may not equal totals due to independent rounding. Data reflect 2007 benchmark revisions. bPreliminary. cRevised.Data includes all full and part-time employees who worked or received pay for any part of pay period which includes the 12th of the month.Proprietors, self-employed, unpaid family workers, and private household workers are excluded.SOURCE: Prepared by the Department of Employment Services Office of Labor Market Research and Information in cooperation with the Virginia Employment Commission, the Maryland Department of Labor, Licensing and Regulation, the West Virginia Bureau of Employment Programs and the U.S. Bureau of Labor Statistics.
District of Columbia, Washington Metropolitan Division, and Washington Metropolitan Area Civilian Labor Force
Washington Metropolitan Division Civilian Labor Force
Employment and Unemployment Rate
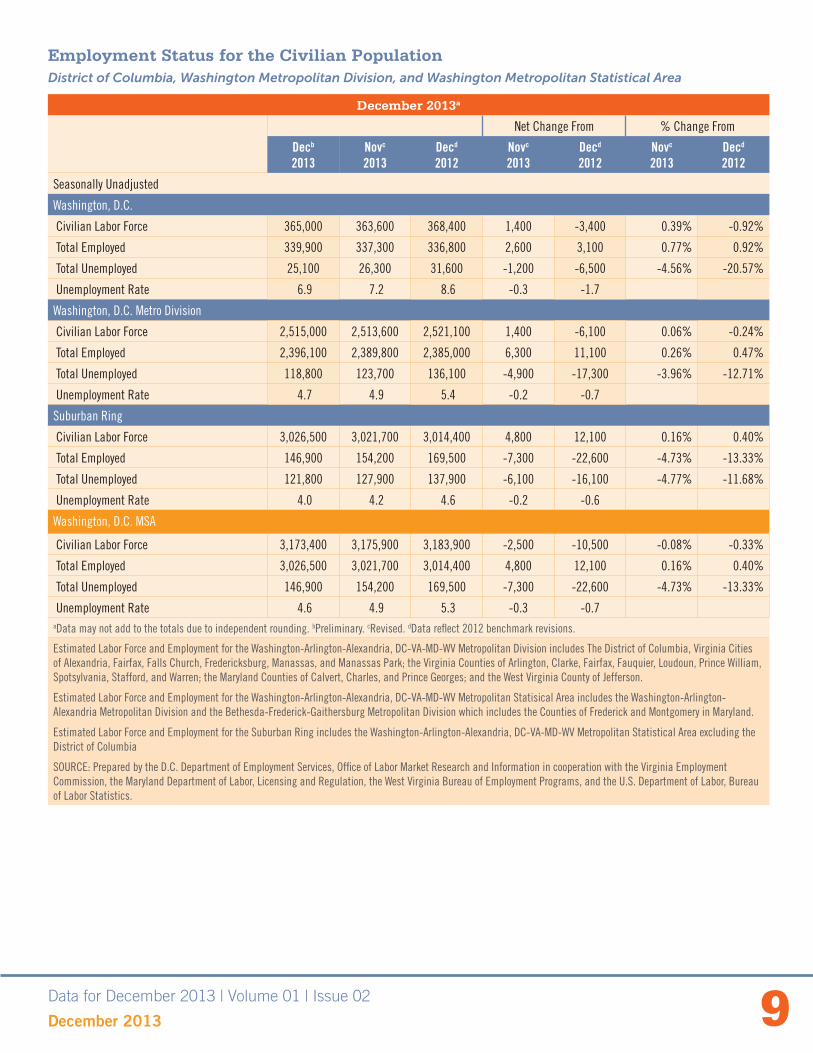
The civilian labor force in the Washington Metropolitan Division increased by 1,400 from November to December 2013, as employment increased by 6,300 and the number unemployed decreased by 4,900. The not seasonally adjusted unemployment rate in the Washington Metropolitan Division, at 4.7 percent in December 2013, was down 0.2 percentage points from the previous month.
Over the last twelve months, the number of employed residents in the Washington Metropolitan Division rose by 11,100. Over the year, 17,300 fewer Division residents were unemployed, and the division civilian labor force fell by 6,100. The Metropolitan Division’s not seasonally adjusted December 2013 unemployment rate was down 0.7 percentage points from the rate in December 2012.
Washington Metropolitan Area Civilian Labor Force
Employment and Unemployment Rate
The civilian labor force in the Suburban Ring of communities surrounding the District of Columbia decreased by 3,900 from November to December 2013, as employment rose by 2,200 and the number of unemployed residents decreased by 6,100. The not seasonally adjusted unemployment rate in the Suburban Ring, at 4.3 percent in December 2013, was down 0.2 percentage points from the prior month.
Over the year, there was an increase of 9,000 employed residents in the Subur-ban Ring. While there were 16,100 fewer unemployed suburban residents, the suburban civilian labor force also fell by 7,100. The Suburban Ring’s December unemployment rate was down 0.6 percentage points from December 2012.
For the Washington Metropolitan Statistical Area (MSA), in December 2013, the number of persons in the civilian labor force decreased by 2,500 from the previous month, the number of employed residents increased by 4,800, and the number of unemployed residents decreased by 7,300. The MSA’s unemployment rate for December 2013 was 4.6 percent, down 0.3 percentage points from the rate in November 2013. Compared to December 2012, the MSA’s civilian labor force fell by 10,500. Employment increased by 12,100 and unemployment decreased by 22,600. The Washington Metropolitan Area’s December 2013 not seasonally adjusted unemployment rate was down 0.7 percentage points from the December 2012 rate of 5.3 percent.
Data for December 2013 | Volume 01 | Issue 02
December 2013 9
December 2013a
Net Change From % Change From
Decb
2013Novc
2013Decd
2012Novc
2013Decd
2012Novc
2013Decd
2012
Seasonally Unadjusted
Washington, D.C.
Civilian Labor Force 365,000 363,600 368,400 1,400 -3,400 0.39% -0.92%
Total Employed 339,900 337,300 336,800 2,600 3,100 0.77% 0.92%
Total Unemployed 25,100 26,300 31,600 -1,200 -6,500 -4.56% -20.57%
Unemployment Rate 6.9 7.2 8.6 -0.3 -1.7
Washington, D.C. Metro Division
Civilian Labor Force 2,515,000 2,513,600 2,521,100 1,400 -6,100 0.06% -0.24%
Total Employed 2,396,100 2,389,800 2,385,000 6,300 11,100 0.26% 0.47%
Total Unemployed 118,800 123,700 136,100 -4,900 -17,300 -3.96% -12.71%
Unemployment Rate 4.7 4.9 5.4 -0.2 -0.7
Suburban Ring
Civilian Labor Force 3,026,500 3,021,700 3,014,400 4,800 12,100 0.16% 0.40%
Total Employed 146,900 154,200 169,500 -7,300 -22,600 -4.73% -13.33%
Total Unemployed 121,800 127,900 137,900 -6,100 -16,100 -4.77% -11.68%
Unemployment Rate 4.0 4.2 4.6 -0.2 -0.6
Washington, D.C. MSA
Civilian Labor Force 3,173,400 3,175,900 3,183,900 -2,500 -10,500 -0.08% -0.33%
Total Employed 3,026,500 3,021,700 3,014,400 4,800 12,100 0.16% 0.40%
Total Unemployed 146,900 154,200 169,500 -7,300 -22,600 -4.73% -13.33%
Unemployment Rate 4.6 4.9 5.3 -0.3 -0.7 aData may not add to the totals due to independent rounding. bPreliminary. cRevised. dData reflect 2012 benchmark revisions.
Estimated Labor Force and Employment for the Washington-Arlington-Alexandria, DC-VA-MD-WV Metropolitan Division includes The District of Columbia, Virginia Cities of Alexandria, Fairfax, Falls Church, Fredericksburg, Manassas, and Manassas Park; the Virginia Counties of Arlington, Clarke, Fairfax, Fauquier, Loudoun, Prince William, Spotsylvania, Stafford, and Warren; the Maryland Counties of Calvert, Charles, and Prince Georges; and the West Virginia County of Jefferson.
Estimated Labor Force and Employment for the Washington-Arlington-Alexandria, DC-VA-MD-WV Metropolitan Statisical Area includes the Washington-Arlington- Alexandria Metropolitan Division and the Bethesda-Frederick-Gaithersburg Metropolitan Division which includes the Counties of Frederick and Montgomery in Maryland.
Estimated Labor Force and Employment for the Suburban Ring includes the Washington-Arlington-Alexandria, DC-VA-MD-WV Metropolitan Statistical Area excluding the District of Columbia
SOURCE: Prepared by the D.C. Department of Employment Services, Office of Labor Market Research and Information in cooperation with the Virginia Employment Commission, the Maryland Department of Labor, Licensing and Regulation, the West Virginia Bureau of Employment Programs, and the U.S. Department of Labor, Bureau of Labor Statistics.
Employment Status for the Civilian Population District of Columbia, Washington Metropolitan Division, and Washington Metropolitan Statistical Area

trendslabor market
METROPOLITAN WASHINGTON, DC
NEW
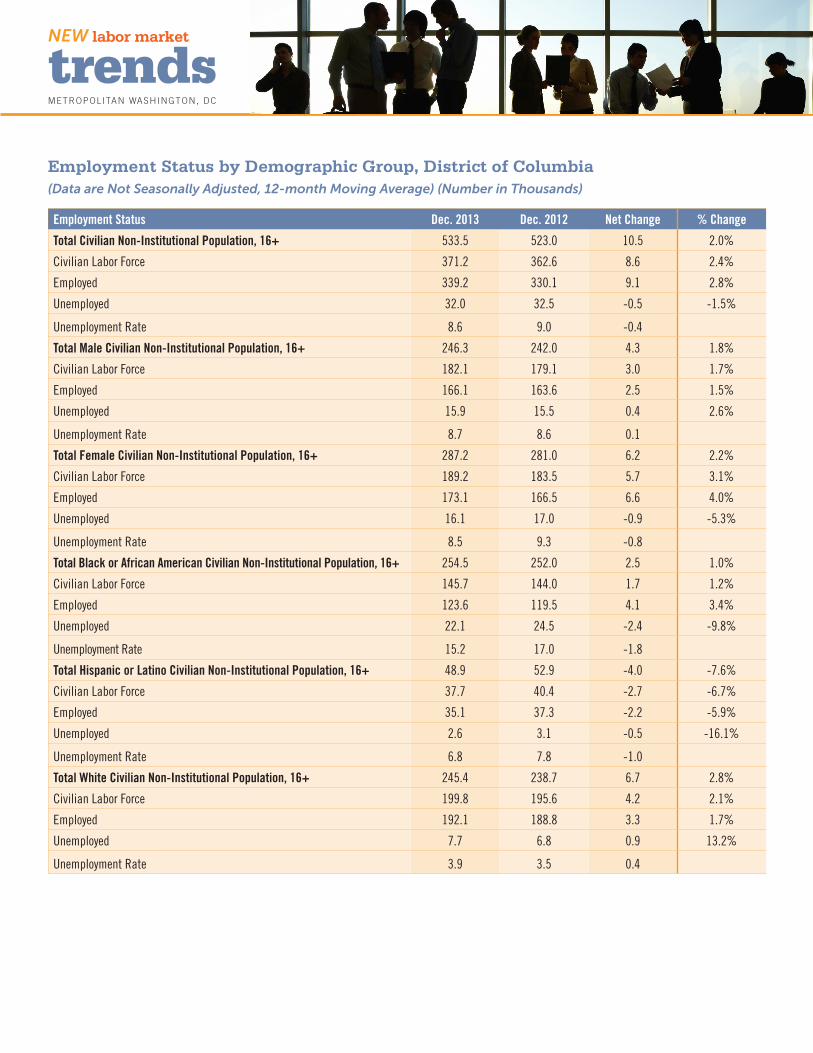
Employment Status by Demographic Groups
From December 2012 to December 2013, the civilian labor force for the white population in the District increased by 4,200, as the number of employed increased by 3,300, and the number of unemployed increased by 900. The unemployment rate for whites in December 2013 was 3.9 percent, up 0.4 percentage points from the rate in December 2012. The African American civilian labor force increased by 1,700, as the number of employed increased by 4,100, and the number of unemployed decreased by 2,400. The unem-ployment rate for African Americans in December 2013 was 15.2 percent, down 1.8 percentage points from the rate in December 2012. Meanwhile, the Hispanic civilian labor force decreased by 2,700, as the number of employed decreased by 2,200, and the number of unemployed decreased by 500. The unemployment rate for Hispanic residents in December 2013 was 6.8 percent, down 1.0 percentage point from the rate in December 2012.
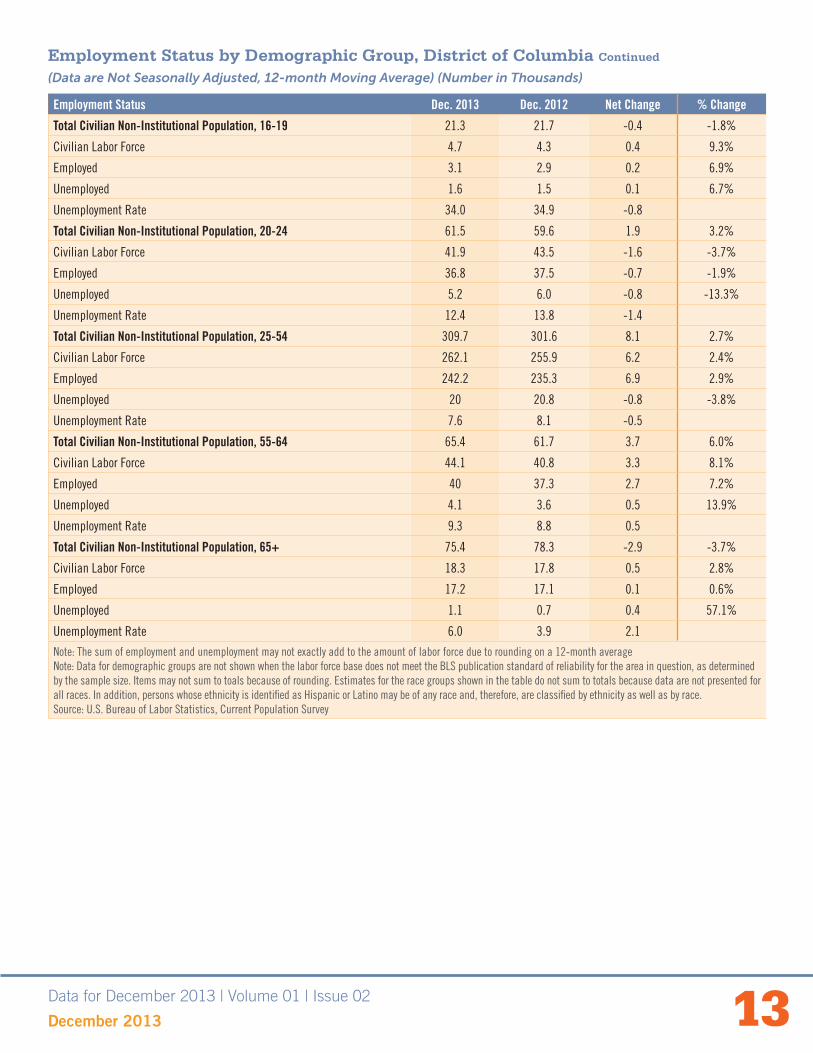
Within the age category, the prime working-age group of 25 – 54 years exhibited an increase in the number of persons in the civilian labor force of 6,200 from December 2012 to December 2013, the number of employed in-
Unemployment Rates for Counties in the Washington-Arlington-Alexandria, D.C.- Va.-Md.-W.Va. Metropolitan Statistical Area, not seasonally adjusted, June 2013

Data for December 2013 | Volume 01 | Issue 02
December 2013 11
creased by 6,900, and the number of unemployed decreased by 800. The unemployment rate for the 25 – 54 year old age group in December 2013 was 7.6 percent, down 0.5 percentage points from the rate in December 2012.
The civilian labor force for the 16 – 24 year old group decreased by 1,100, as the number of employed decreased by 500, and the number of unem-ployed decreased by 700. The unemployment rate for 16 – 24 year olds in December 2013 was 14.6 percent, down 1.1 percentage points from the rate in December 2012.
The civilian labor force for the 55 and older age group increased by 3,800 from December 2012 to December 2013, as the number of employed increased by 2,800 and the number of unemployed increased by 1,000. The unemployment rate for those 55 and over in December 2013 was 8.3 percent, up 1.0 percentage point from the rate in December 2012.
Unemployment by Duration
The total number of unemployed persons in the District’s civilian labor force decreased from 32,500 in December 2012 to 32,000 in December 2013. The number of long-term unemployed (27 weeks or longer) decreased 14.3 per-cent over the year, from 17,500 to 15,000. The share of long-term unemployed fell roughly 7 percentage points from 53.8 percent of the total unemployed population in December 2012 to 46.9 percent of the total unemployed popula-tion in December 2013.
Labor Force by Educational Attainment
Approximately 6 percent of the District’s labor force possesses less than a High School Diploma; 15 percent has attained a High School Diploma or equivalent; 12 percent have completed some college or have obtained an Associate Degree; and nearly 70 percent of the labor force has attained a Bachelor’s or more advanced degree.
The December 2013 unemployment rate for those with less than a high school diploma was 16.4 percent in December 2013, down 1.6 percentage points from a year earlier. From December 2012 to December 2013, the unemploy-ment rate for high school graduates decreased 2.2 percentage points to 16.4 percent. The unemployment rate in December 2013 for those with some college credits or an Associate Degree was 13.3 percent, up .2 percentage points from a year earlier. Finally, the December 2013 unemployment rate for those with a Bachelor’s Degree or above was 4.2 percent, up from 3.6 percent in December 2012.
Not in the Labor Force
An important and recently puzzling population is those who are not in the labor force. Across the nation individuals are leaving the labor force, many because they have reached retirement age, some due to discouragement, and a proportion for reasons not entirely understood by labor economists.
In the District, following the national upward trend, the number of individuals not in the labor force grew by 1.2 percent, from 160,400 in December 2012 to 162,300 in December 2013. Further, in December 2013, out of the more than 162,000 individuals not in the labor force, over 21,000 indicated that they want a job, and 7,300 described themselves as ‘available for work’. Moreover, 10,500 individuals stated that they had searched for work within the past twelve months.
For more detailed quantitative information on all of the demographic analyses described in this section, please see the tables on pages 12 through 15. Please note that the monthly information presented in these tables represents 12-month moving averages.
5,10000Number of private-sector jobs added during the last twelve months in the District of Columbia.
trendslabor market
METROPOLITAN WASHINGTON, DC
NEW
Employment Status Dec. 2013 Dec. 2012 Net Change % Change
Total Civilian Non-Institutional Population, 16+ 533.5 523.0 10.5 2.0%
Civilian Labor Force 371.2 362.6 8.6 2.4%
Employed 339.2 330.1 9.1 2.8%
Unemployed 32.0 32.5 -0.5 -1.5%
Unemployment Rate 8.6 9.0 -0.4
Total Male Civilian Non-Institutional Population, 16+ 246.3 242.0 4.3 1.8%
Civilian Labor Force 182.1 179.1 3.0 1.7%
Employed 166.1 163.6 2.5 1.5%
Unemployed 15.9 15.5 0.4 2.6%
Unemployment Rate 8.7 8.6 0.1
Total Female Civilian Non-Institutional Population, 16+ 287.2 281.0 6.2 2.2%
Civilian Labor Force 189.2 183.5 5.7 3.1%
Employed 173.1 166.5 6.6 4.0%
Unemployed 16.1 17.0 -0.9 -5.3%
Unemployment Rate 8.5 9.3 -0.8
Total Black or African American Civilian Non-Institutional Population, 16+ 254.5 252.0 2.5 1.0%
Civilian Labor Force 145.7 144.0 1.7 1.2%
Employed 123.6 119.5 4.1 3.4%
Unemployed 22.1 24.5 -2.4 -9.8%
Unemployment Rate 15.2 17.0 -1.8
Total Hispanic or Latino Civilian Non-Institutional Population, 16+ 48.9 52.9 -4.0 -7.6%
Civilian Labor Force 37.7 40.4 -2.7 -6.7%
Employed 35.1 37.3 -2.2 -5.9%
Unemployed 2.6 3.1 -0.5 -16.1%
Unemployment Rate 6.8 7.8 -1.0
Total White Civilian Non-Institutional Population, 16+ 245.4 238.7 6.7 2.8%
Civilian Labor Force 199.8 195.6 4.2 2.1%
Employed 192.1 188.8 3.3 1.7%
Unemployed 7.7 6.8 0.9 13.2%
Unemployment Rate 3.9 3.5 0.4
Employment Status by Demographic Group, District of Columbia(Data are Not Seasonally Adjusted, 12-month Moving Average) (Number in Thousands)
Data for December 2013 | Volume 01 | Issue 02
December 2013 13
Employment Status Dec. 2013 Dec. 2012 Net Change % Change
Total Civilian Non-Institutional Population, 16+ 533.5 523.0 10.5 2.0%
Civilian Labor Force 371.2 362.6 8.6 2.4%
Employed 339.2 330.1 9.1 2.8%
Unemployed 32.0 32.5 -0.5 -1.5%
Unemployment Rate 8.6 9.0 -0.4
Total Male Civilian Non-Institutional Population, 16+ 246.3 242.0 4.3 1.8%
Civilian Labor Force 182.1 179.1 3.0 1.7%
Employed 166.1 163.6 2.5 1.5%
Unemployed 15.9 15.5 0.4 2.6%
Unemployment Rate 8.7 8.6 0.1
Total Female Civilian Non-Institutional Population, 16+ 287.2 281.0 6.2 2.2%
Civilian Labor Force 189.2 183.5 5.7 3.1%
Employed 173.1 166.5 6.6 4.0%
Unemployed 16.1 17.0 -0.9 -5.3%
Unemployment Rate 8.5 9.3 -0.8
Total Black or African American Civilian Non-Institutional Population, 16+ 254.5 252.0 2.5 1.0%
Civilian Labor Force 145.7 144.0 1.7 1.2%
Employed 123.6 119.5 4.1 3.4%
Unemployed 22.1 24.5 -2.4 -9.8%
Unemployment Rate 15.2 17.0 -1.8
Total Hispanic or Latino Civilian Non-Institutional Population, 16+ 48.9 52.9 -4.0 -7.6%
Civilian Labor Force 37.7 40.4 -2.7 -6.7%
Employed 35.1 37.3 -2.2 -5.9%
Unemployed 2.6 3.1 -0.5 -16.1%
Unemployment Rate 6.8 7.8 -1.0
Total White Civilian Non-Institutional Population, 16+ 245.4 238.7 6.7 2.8%
Civilian Labor Force 199.8 195.6 4.2 2.1%
Employed 192.1 188.8 3.3 1.7%
Unemployed 7.7 6.8 0.9 13.2%
Unemployment Rate 3.9 3.5 0.4
Employment Status Dec. 2013 Dec. 2012 Net Change % Change
Total Civilian Non-Institutional Population, 16-19 21.3 21.7 -0.4 -1.8%
Civilian Labor Force 4.7 4.3 0.4 9.3%
Employed 3.1 2.9 0.2 6.9%
Unemployed 1.6 1.5 0.1 6.7%
Unemployment Rate 34.0 34.9 -0.8
Total Civilian Non-Institutional Population, 20-24 61.5 59.6 1.9 3.2%
Civilian Labor Force 41.9 43.5 -1.6 -3.7%
Employed 36.8 37.5 -0.7 -1.9%
Unemployed 5.2 6.0 -0.8 -13.3%
Unemployment Rate 12.4 13.8 -1.4
Total Civilian Non-Institutional Population, 25-54 309.7 301.6 8.1 2.7%
Civilian Labor Force 262.1 255.9 6.2 2.4%
Employed 242.2 235.3 6.9 2.9%
Unemployed 20 20.8 -0.8 -3.8%
Unemployment Rate 7.6 8.1 -0.5
Total Civilian Non-Institutional Population, 55-64 65.4 61.7 3.7 6.0%
Civilian Labor Force 44.1 40.8 3.3 8.1%
Employed 40 37.3 2.7 7.2%
Unemployed 4.1 3.6 0.5 13.9%
Unemployment Rate 9.3 8.8 0.5
Total Civilian Non-Institutional Population, 65+ 75.4 78.3 -2.9 -3.7%
Civilian Labor Force 18.3 17.8 0.5 2.8%
Employed 17.2 17.1 0.1 0.6%
Unemployed 1.1 0.7 0.4 57.1%
Unemployment Rate 6.0 3.9 2.1
Note: The sum of employment and unemployment may not exactly add to the amount of labor force due to rounding on a 12-month averageNote: Data for demographic groups are not shown when the labor force base does not meet the BLS publication standard of reliability for the area in question, as determined by the sample size. Items may not sum to toals because of rounding. Estimates for the race groups shown in the table do not sum to totals because data are not presented for all races. In addition, persons whose ethnicity is identified as Hispanic or Latino may be of any race and, therefore, are classified by ethnicity as well as by race. Source: U.S. Bureau of Labor Statistics, Current Population Survey
Employment Status by Demographic Group, District of Columbia Continued
(Data are Not Seasonally Adjusted, 12-month Moving Average) (Number in Thousands)

trendslabor market
METROPOLITAN WASHINGTON, DC
NEW
Duration Dec. 2013 Dec. 2012 Net Change % Change
Total 32.0 32.5 -0.5 -1.5%
Less than 5 weeks 5.1 4.8 0.3 6.3%
5 to 14 weeks 6.4 5.6 0.8 14.3%
15 to 26 weeks 5.6 4.5 1.1 24.4%
27 to 51 weeks 4.3 4.5 -0.2 -4.4%
52 weeks and over 10.7 13 -2.3 -17.7%
Percent of Unemployed (%)
Less than 5 weeks 15.9% 14.8% 1.2
5 to 14 weeks 20.0% 17.2% 2.8
15 to 26 weeks 17.5% 13.8% 3.7
27 to 51 weeks 13.4% 13.8% -0.4
52 weeks and over 33.4% 40.0% -6.6
Note: Detail may not add to total due to rounding Source: U.S. Bureau of Labor Statistics, Current Population Survey
Unemployment by Duration, District of Columbia(Number and Percent of Persons Unemployed, 12-month Moving Average) (Number in Thousands)
Employment Status by Educational Attainment Dec. 2013 Dec. 2012 Net Change % Change
Less than a High School Diploma 42.6 47.3 -4.7 -9.9%
Civilian Labor Force 19.5 21.3 -1.8 -8.5%
Employed 16.3 17.5 -1.2 -6.9%
Unemployed 3.2 3.8 -0.6 -15.8%
Unemployment Rate 16.4 18 -1.6
High School Graduates, No College1 84.1 84.3 -0.2 -0.2%
Civilian Labor Force 47.1 46.3 0.8 1.7%
Employed 39.4 37.7 1.7 4.5%
Unemployed 7.7 8.6 -0.9 -10.5%
Unemployment Rate 16.4 18.6 -2.2
Some College or Associate Degree 61.9 61.7 0.2 0.3%
Civilian Labor Force 39.4 39.3 0.1 0.3%
Employed 34.1 34.2 -0.1 -0.3%
Unemployed 5.3 5.1 0.2 3.9%
Unemployment Rate 13.3 13.1 0.2
Bachelor's Degree and Higher2 262.1 248.3 13.8 5.6%
Civilian Labor Force 218.6 207.8 10.8 5.2%
Employed 209.5 200.4 9.1 4.5%
Unemployed 9.1 7.4 1.7 23.0%
Unemployment Rate 4.2 3.6 0.61 Includes persons with a high school diploma or equivalent 2Includes person with bachelor's, master's, professional and doctoral degreesSource: U.S. Bureau of Labor Statistics, Current Population Survey
Employment Status of the Civilian Population 25 years and Over by Educational Attainment, District of Columbia (Data are Not Seasonally Adjusted, 12-month Moving Average)

Data for December 2013 | Volume 01 | Issue 02
December 2013 15
District of Columbia Top 30 Private Employers (June 2013)*
Rank Trade Name
1 Georgetown University
2 Washington Hospital Center
3 George Washington University
4 Children’s National Hospital
5 American University
6 Georgetown University Hospital
7 Howard University
8 Booz Allen & Hamilton Inc.
9 Federal National Mortgage Association
10 Providence Hospital
11 Allied Barton Security Services LLC
12 Howard University Hospital
13 Red Coats
14 The Catholic University of America
15 The George Washington University Hospital
Rank Trade Name
16 Sibley Memorial Hospital
17 The Advisory Board
18 Safeway Inc
19 George Washington Medical Faculty Associates
20 The Washington Post
21 Restaurant Associates LLC
22 Insperity People Services
23 Hyatt Corporation
24 The Hilton Hotels Corporation
25 CVS Pharmacy
26 Gallaudet University
27 National Geographic Society
28 DC Water and Sewer Authority
29 Levy Premium Food Services
30 AARP
Discouragement Dec. 2013 Dec. 2012 Net Change % Change
Not in the labor force . . . 162.3 160.4 1.9 1.2%
. . . but want a job 21.1 20.7 0.4 1.9%
. . . and searched recently 10.5 9.3 1.2 12.9%
. . . and available for work 7.3 6.9 0.4 5.8% . . and discouraged 2.3 2.1 0.2 9.5%
Percent of NILF (%)
. . . but want a job 13.0% 12.9% 0.10
. . . and searched recently 6.5% 5.8% 0.67
. . . and available for work 4.5% 4.3% 0.20
. . . and discouraged 1.4% 1.3% 0.11
Note: “NILF” is not in the labor force”. Detail may not add to total due to rounding. “Searched recently” means in the past 12 months. “Discouraged” are, specifically, those persons not currently looking for work because they are discouraged over job prospects. Source: U.S. Bureau of Labor Statistics, Current Population Survey
Civilians Not in the Labor Force, District of Columbia(Number and Percent of Persons Unemployed, 12-month Moving Average)
D.C. Unemployment Insurance Benefit Statistics
In December 2013, initial claims filed for Unemployment Insurance (UI) in the District of Columbia rose 14.6 percent from the November 2013 level of 1,633 to 1,871. Over the year, UI initial claims were up 5.5 percent from the 1,774 level in December 2012. The December 2013 initial claims for all programs were up from November 2013 by 232 to 1,906 and higher by 94 or 5.2 percent from the December 2012 level of 1,812.
Across all programs, final payments were up 28.6 percent to 1,438, benefits paid increased 23.8 percent to $15,715,724, weeks compensated were up 23.4 percent to 53,851, weeks claimed were up 23.0 percent to 26,061, first payments increased 1.5 percent to 2,360, average weekly benefit amount (A.W.B.A.) rose 0.3 percent to $291.84.
Over the year, benefits paid increased by 25.7 percent, weeks compensated increased 24.4 percent, first payments were up 14.7 percent, weeks claimed were up 7.2 percent, average weekly benefit amount rose 1.0 percent from $288.91, and final payments were down 0.1 percent.
* Ranking by size of employment
Source: U.S. Bureau of Labor Statistics, Quarterly Census of Employment and Wages (QCEW), June 2013
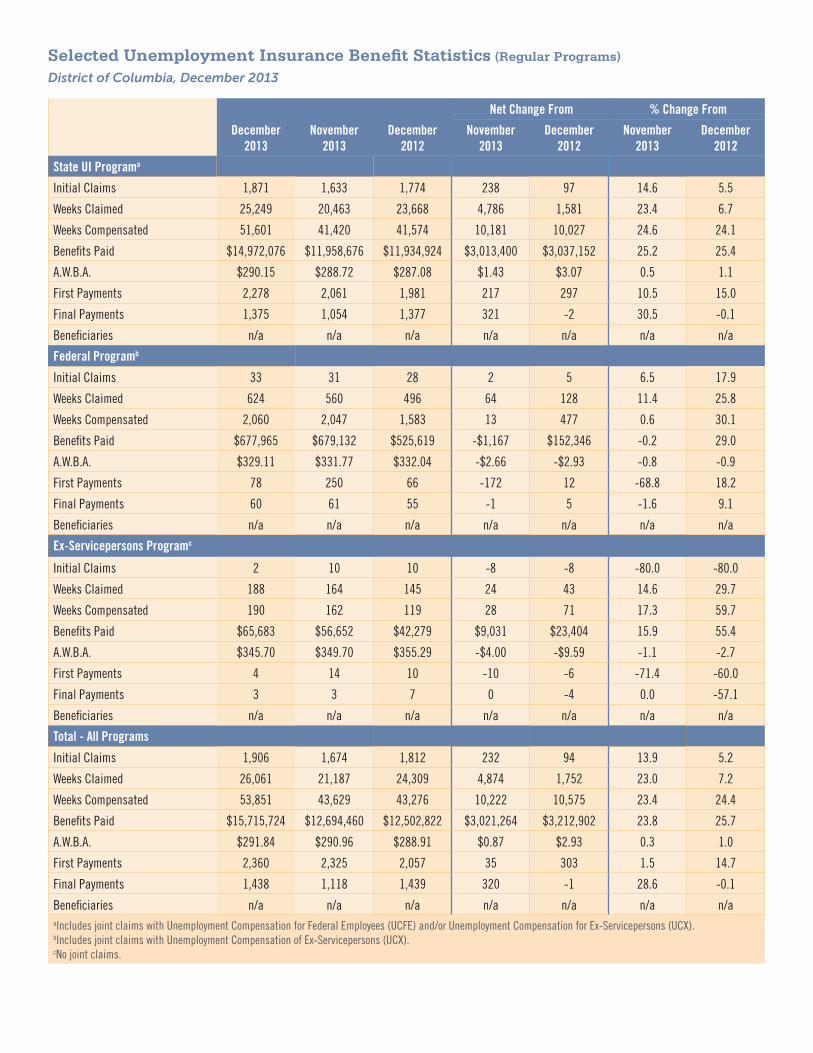
Selected Unemployment Insurance Benefit Statistics (Regular Programs)
District of Columbia, December 2013
December2013
November2013
December2012
Net Change From % Change From
November2013
December2012
November2013
December2012
State UI Programa
Initial Claims 1,871 1,633 1,774 238 97 14.6 5.5
Weeks Claimed 25,249 20,463 23,668 4,786 1,581 23.4 6.7
Weeks Compensated 51,601 41,420 41,574 10,181 10,027 24.6 24.1
Benefits Paid $14,972,076 $11,958,676 $11,934,924 $3,013,400 $3,037,152 25.2 25.4
A.W.B.A. $290.15 $288.72 $287.08 $1.43 $3.07 0.5 1.1
First Payments 2,278 2,061 1,981 217 297 10.5 15.0
Final Payments 1,375 1,054 1,377 321 -2 30.5 -0.1
Beneficiaries n/a n/a n/a n/a n/a n/a n/a
Federal Programb
Initial Claims 33 31 28 2 5 6.5 17.9
Weeks Claimed 624 560 496 64 128 11.4 25.8
Weeks Compensated 2,060 2,047 1,583 13 477 0.6 30.1
Benefits Paid $677,965 $679,132 $525,619 -$1,167 $152,346 -0.2 29.0
A.W.B.A. $329.11 $331.77 $332.04 -$2.66 -$2.93 -0.8 -0.9
First Payments 78 250 66 -172 12 -68.8 18.2
Final Payments 60 61 55 -1 5 -1.6 9.1
Beneficiaries n/a n/a n/a n/a n/a n/a n/a
Ex-Servicepersons Programc
Initial Claims 2 10 10 -8 -8 -80.0 -80.0
Weeks Claimed 188 164 145 24 43 14.6 29.7
Weeks Compensated 190 162 119 28 71 17.3 59.7
Benefits Paid $65,683 $56,652 $42,279 $9,031 $23,404 15.9 55.4
A.W.B.A. $345.70 $349.70 $355.29 -$4.00 -$9.59 -1.1 -2.7
First Payments 4 14 10 -10 -6 -71.4 -60.0
Final Payments 3 3 7 0 -4 0.0 -57.1
Beneficiaries n/a n/a n/a n/a n/a n/a n/a
Total - All Programs
Initial Claims 1,906 1,674 1,812 232 94 13.9 5.2
Weeks Claimed 26,061 21,187 24,309 4,874 1,752 23.0 7.2
Weeks Compensated 53,851 43,629 43,276 10,222 10,575 23.4 24.4
Benefits Paid $15,715,724 $12,694,460 $12,502,822 $3,021,264 $3,212,902 23.8 25.7
A.W.B.A. $291.84 $290.96 $288.91 $0.87 $2.93 0.3 1.0
First Payments 2,360 2,325 2,057 35 303 1.5 14.7
Final Payments 1,438 1,118 1,439 320 -1 28.6 -0.1
Beneficiaries n/a n/a n/a n/a n/a n/a n/a aIncludes joint claims with Unemployment Compensation for Federal Employees (UCFE) and/or Unemployment Compensation for Ex-Servicepersons (UCX).bIncludes joint claims with Unemployment Compensation of Ex-Servicepersons (UCX). cNo joint claims.

Data for December 2013 | Volume 01 | Issue 02
December 2013 17
Rank SOC Code SOC Title Index
% Change Employ-
ment 2010-2020
Average Annual
Openings 2010-2020
Annual Median
Wage 2011
Typical Level of Education Required
1 172061 Computer Hardware Engineers 19.5 35.09 79 $111,550 Bachelor's degree
2 - 3 151121 Computer Systems Analysts 19 34.39 176 $85,230 Bachelor's degree
2 - 3 151179Information Security Analysts, Web Devel-opers, and Computer Network Architects
19 36.21 158 $87,050 Bachelor's degree
4 - 8 112031 Public Relations Managers 18.5 16.03 157 $118,910 Bachelor's degree
4 - 8 151132 Software Developers, Applications 18.5 45.71 134 $94,180 Bachelor's degree
4 - 8 151133 Software Developers, Systems Software 18.5 53.30 95 $97,150 Bachelor's degree
4 - 8 152041 Statisticians 18.5 19.05 87 $105,220 Master's degree
4 - 8 231011 Lawyers 18.5 15.29 1429 $152,640 Doctoral or professional degree
9 - 12 112021 Marketing Managers 18 16.70 66 $124,630 Bachelor's degree
9 - 12 113021Computer and Information Systems
Managers18 17.83 139 $136,880 Bachelor's degree
9 - 12 151142Network and computer systems architects
and administrators18 38.85 219 $82,600 Bachelor's degree
9 - 12 291062 Family and General Practitioners 18 31.24 23 $120,010 Doctoral or professional degree
13 - 18 132061 Financial Examiners 17.5 23.31 23 $135,480 Bachelor's degree
13 - 18 151141 Database Administrators 17.5 43.92 90 $80,450 Bachelor's degree
13 - 18 152031 Operations Research Analysts 17.5 19.65 89 $93,000 Bachelor's degree
13 - 18 171011 Architects, Except Landscape and Naval 17.5 21.45 88 $86,080 Bachelor's degree
13 - 18 291067 Surgeons 17.5 29.68 15 $187,200 Doctoral or professional degree
13 - 18 292021 Dental Hygienists 17.5 35.50 28 $89,930 Associate's degree
19 - 31 119032Education Administrators, Elementary
and Secondary School17 19.87 43 $86,010 Master's degree
19 - 31 119033 Education Administrators, Postsecondary 17 25.31 89 $75,520 Master's degree
19 - 31 119151 Social and Community Service Managers 17 22.71 69 $83,980 Bachelor's degree
19 - 31 131081 Logisticians 17 20.28 39 $94,960 Bachelor's degree
19 - 31 132051 Financial Analysts 17 24.06 118 $80,950 Bachelor's degree
19 - 31 151131 Computer Programmers 17 22.83 125 $83,460 Bachelor's degree
19 - 31 193094 Political Scientists 17 8.45 188 $115,740 Master's degree
19 - 31 211091 Health Educators 17 42.68 47 $74,860 Bachelor's degree
19 - 31 251011 Business Teachers, Postsecondary 17 21.16 46 $101,870 Doctoral or professional degree
19 - 31 273031 Public Relations Specialists 17 21.43 448 $72,860 Bachelor's degree
19 - 31 291051 Pharmacists 17 16.32 30 $113,820 Doctoral or professional degree
19 - 31 291111 Registered Nurses 17 20.53 389 $73,330 Associate's degree
19 - 31 474011 Construction and Building Inspectors 17 35.53 48 $81,530High school diploma or
equivalent
High Demand, High Wage Occupations in the District of Columbia

Rank SOC Code SOC Title Index
% Change Employ-
ment 2010-2020
Average Annual
Openings 2010-2020
Annual Median
Wage 2011
Percent of Employees with Less Than Bachelor's Degree
2 - 3 151121 Computer Systems Analysts 19 34.39 176 $85,230 Greater Than 20%
2 - 3 151179Information Security Analysts, Web Devel-opers, and Computer Network Architects
19 36.21 158 $87,050 Greater Than 20%
4 - 8 151132 Software Developers, Applications 18.5 45.71 134 $94,180 Greater Than 20%
4 - 8 151133 Software Developers, Systems Software 18.5 53.30 95 $97,150 Greater Than 20%
9 - 12 113021Computer and Information Systems
Managers18 17.83 139 $136,880 Greater Than 20%
9 - 12 151142Network and computer systems architects
and administrators18 38.85 219 $82,600 Greater Than 20%
13 - 18 292021 Dental Hygienists 17.5 35.50 28 $89,930 Greater Than 30%
19 - 31 131081 Logisticians 17 20.28 39 $94,960 Greater Than 20%
19 - 31 151131 Computer Programmers 17 22.83 125 $83,460 Greater Than 20%
19 - 31 211091 Health Educators 17 42.68 47 $74,860 Greater Than 20%
19 - 31 291111 Registered Nurses 17 20.53 389 $73,330 Greater Than 20%
19 - 31 474011 Construction and Building Inspectors 17 35.53 48 $81,530 Greater Than 20%
32 - 41 413031Securities, Commodities, and Financial
Services Sales Agents16.5 19.05 37 $88,300 Greater Than 20%
42 - 53 111021 General and Operations Managers 16 0.09 594 $127,790 Greater Than 20%
42 - 53 113011 Administrative Services Managers 16 13.27 143 $79,700 Greater Than 30%
42 - 53 131121 Meeting and Convention Planners 16 47.51 159 $62,440 Greater Than 20%
54 - 75 113061 Purchasing Managers 15.5 3.38 61 $126,250 Greater Than 20%
54 - 75 113121 Human Resources Managers 15.5 3.37 39 $136,130 Greater Than 20%
54 - 75 131199 Business Operations Specialists, All Other 15.5 9.58 1146 $82,840 Greater Than 20%
54 - 75 151150 Computer Support Specialists 15.5 22.36 230 $60,080 Greater Than 30%
54 - 75 151799 Computer Occupations, All Other 15.5 -4.46 210 $106,850 Greater Than 20%
54 - 75 232011 Paralegals and Legal Assistants 15.5 16.32 232 $64,550 Greater Than 20%
54 - 75 333021 Detectives and Criminal Investigators 15.5 2.38 84 $122,410 Greater Than 20%
54 - 75 414011Sales Representatives, Wholesale and
Manufacturing, Technical and Scientific Products
15.5 22.19 45 $69,370 Greater Than 20%
76 - 97 131078Human resources, labor relations, and
training specialists, all other15 7.17 188 $82,360 Greater Than 30%
76 - 97 211012Educational, Vocational, and School
Counselors15 28.07 85 $55,440 Greater Than 20%
76 - 97 253021 Self-Enrichment Education Teachers 15 30.91 45 $55,430 Greater Than 30%
76 - 97 292037 Radiologic Technologists and Technicians 15 26.71 34 $64,220 Greater Than 30%
98 - 114 253999 Teachers and Instructors, All Other 14.5 15.42 180 $62,460 Greater Than 30%
98 - 114 331012First-Line Supervisors/Managers of Police
and Detectives14.5 -4.67 54 $131,510 Greater Than 20%
98 - 114 431011First-Line Supervisors/Managers of Office
and Administrative Support Workers14.5 15.71 221 $58,850 Greater Than 30%
High Demand, High Wage Occupations in the District of Columbia Occupations with Significant Levels of Employed D.C. Residents with Less Than a Bachelor’s Degree

Glossary of Terms and Concepts
How are the labor force components (i.e., civilian labor
force, employed, unemployed, and unemployment rate)
defined?
Below are the official concepts and definitions, as used in the Bureau of Labor Statistics (BLS) Current Population Survey (CPS):
Civilian labor force: Included are all persons in the civilian non-institutional pop-ulation classified as either employed or unemployed. (See the definitions below).
Employed persons: These are all persons who, during the reference week (the week including the 12th day of the month), (a) did any work as paid employees, worked in their own business or profession or on their own farm, or worked 15 hours or more as unpaid workers in an enterprise operated by a member of their family, or (b) were not working but who had jobs from which they were temporarily absent because of vacation, illness, bad weather, childcare problems, maternity or paternity leave, labor-management dispute job training, or other family or personal reasons, whether or not they were paid for the time off or were seeking other jobs. Each employed person is counted only once, even if he or she holds more than one job.
Unemployed persons: Included are all persons who had no employment during the reference week, were available for work, except for temporary illness, and had made specific efforts to find employment some time during the 4 week-period ending with the reference week. Persons who were waiting to be recalled to a job from which they had been laid off need not have been looking for work to be classified as unemployed.
Unemployment rate: The ratio of unemployed to the civilian labor force expressed as a percent [i.e., 100 times (unemployed/labor force)].
What is a Metropolitan Statistical Area? A Metropolitan Statistical Area (MSA) is a geographic area that contains at least one urbanized area of 50,000 or more population plus adjacent territory that has a high degree of social and economic integration with the core urban area.
What is seasonal adjustment? Seasonal adjustment is a statistical technique that eliminates the influences of weather, holidays, the opening and closing of schools, and other recurring seasonal events from economic time series. This permits easier observation and analysis of cyclical, trend, and other non-seasonal movements in the data. By eliminating seasonal fluctuations, the unemployment series becomes smoother and it is easier to compare data from month to month. In the Local Area of Unemployment Statistics (LAUS) program, data for census regions, census divisions, states, the District of Columbia, Puerto Rico, and the seven sub-state areas are seasonally adjusted. For a more complete description of seasonal adjustment and the methodology used to esti-mate seasonal adjustment factors, visit http://www.bls.gov/lau/lauseas.htm.
Explanation of “High Demand, High Wage” Methodology
This three-variable index has been constructed using occupational data to create the Best Occupations in D.C. ranking. To arrive at this single three-variable index, the following steps were completed:
1. For each 6-digit Standard Occupational Classification (SOC) Code, the following three variables were included: projected percent change in D.C. employment in 2010-2020; projected annual total openings in D.C. in 2010-2020; and median annual wage in D.C. in 2011. The first two variables cap-ture the projected occupational demand, while the third focuses on wages.
2. Each of the three variables was converted to new categorical variables with values ranging from 10 to 1 (i.e. from best to worst). These categories roughly represent the deciles of ranking by each corresponding variable.
3. A single three-variable index was generated of Best Occupations in D.C. by using the three categorical variables and the following formula:
Three variable index = 0.5*percent change category + 0.5*annual total openings category + median annual wage category.
Note that the formula puts equal weights on occupational demand (the first two categories together) and occupational wages (the third category). For the occupational demand component of the index, the formula puts equal weights on the “percent change” and the “annual total openings” catego-ries. Theoretically, the value of the index can range from 20 to 2, although in practice the best occupation scores 19.5. An occupation has a high total score if it has high projected percent change in employment, high projected number of annual total openings, and a high median wage.
The “Education” column displays the typical level of education required for each occupation (according to national data provided by the U.S. Bureau of Labor Statistics).
The second “High Demand, High Wage” table employs the same three variable index scoring methodology as the first table; however, this table in-troduces a variable to measure the percent of employees in each occupation who possess less than a Bachelor’s degree. The purpose of this table is to present jobseekers who have obtained an Associate’s degree or less with the best occupations in the District that align with their educational background.

trendslabor market
METROPOLITAN WASHINGTON, DC
NEW
How is the unemployment rate related to unemployment insurance claims? Some people think that to get these figures on unemployment the Government uses the number of persons filing claims for unemployment insurance (UI) benefits under State or Federal Government programs. But some people are still jobless when their benefits run out, and many more are not eligible at all or delay or never apply for benefits. So, quite clearly, UI information cannot be used as a source for complete information on the number of unemployed.
The number of unemployed persons in the United States and the national unemployment rate are produced from data collected in the Current Popu-lation Survey (CPS), a monthly survey of over 60,000 households. A person’s unemployment status is established by responses to a series of questions on whether they have a job or are on layoff, whether they want a job and are available to work, and what they have done to look for work in the preceding 4 weeks. The unemployment rate is the number of unemployed persons as a percent of the labor force (employed and unemployed persons).
Statistics on persons receiving unemployment insurance benefits (some-times called insured unemployment) in the United States are collected as a byproduct of unemployment insurance programs. Workers who lose their jobs and are covered by these programs typically file claims which serve as notice that they are beginning a period of unemployment. Claimants who qualify for benefits are counted in the insured unemployment figures. More infor-mation about the Unemployment Insurance (UI) program is available from the Department of Labor’s Employment and Training Administration, here: http://www.workforcesecurity.doleta.gov/unemploy/uifactsheet.asp; including weekly data on UI claims, here: http://workforcesecurity.doleta.gov/unemploy/claims_arch.asp.
What is the CES definition of employment? Each month the Current Em-ployment Statistics (CES) program surveys about 145,000 businesses and government agencies, representing approximately 557,000 individual worksites, in order to provide detailed industry data on employment, hours, and earnings of workers on nonfarm payrolls for all 50 States, the District of Columbia, Puerto Rico, the Virgin Islands, and about 400 metropolitan areas and divisions.
Employment is the total number of persons on establishment payrolls em-ployed full or part time who received pay for any part of the pay period which includes the 12th day of the month. Temporary and intermittent employees are included, as are any workers who are on paid sick leave, on paid holiday, or who work during only part of the specified pay period. A striking worker who only works a small portion of the survey period, and is paid, would be included as employed under the CES definitions. Persons on the payroll of more than one establishment are counted in each establishment. Data exclude proprietors, self-employed, unpaid family or volunteer workers, farm workers, and domestic workers. Persons on layoff the entire pay period, on leave without pay, on strike for the entire period or who have not yet reported for work are not counted as employed. Government employment covers only civilian workers.
Glossary of Terms and Concepts Continued

Data for December 2013 | Volume 01 | Issue 02
December 2013 21
Note to Our Readers
The Department of Employment Services’ Office of Labor Market Research & Information (OLMRI) collects the majority of the labor market information presented in this report on a monthly basis, as an agent for the United States Department of Labor, Bureau of Labor Statistics (BLS).
Information presented is derived from BLS labor force models, Current Popula-tion Survey (CPS), Local Area Unemployment Statistics (LAUS), or the Current Employment Statistics (CES) survey.
The CPS measures levels of employment and unemployment through a citywide monthly survey of approximately 660 households. This survey collects informa-tion on the employment status of each member of these households, 16 years of age and over. Members of these households who are working at more than one job are counted as employed only once. The data reflect the county where the person lives.
The CES survey contacts approximately 1,500 businesses in the District of Columbia each month and collects information as to the number of jobs on the payroll for that month. Individuals who hold more than one job are counted once for each job. The data reflect the county where the job is located. These data, which present employment by industry division, are commonly referred to as the “establishment survey” or the “wage and salary employment series.” Each month the CES Program releases “Preliminary” employment and hours and earnings data for the prior month; also, “Revised” data are published for the month preceding the prior month. Once OLMRI and BLS have verified the “Revised” data, they remain unchanged until the new benchmark is completed in March of the following year.
The LAUS county data are estimated using a BLS prescribed multi-step estima-tion process, incorporating a variety of information including, but not limited to, CES survey data, agricultural employment, and unemployment claims data for local areas. The data reflect the county where the person lives.
6,50000Number of unemployed residents by which the District’s
civilian labor force decreased over the year.

trendslabor market
METROPOLITAN WASHINGTON, DC
NEW4058 Minnesota Avenue, NE Washington, DC 20019 Phone: (202) 724-7000 Fax: (202) 673-6993 TTY: (202) 698-4817