innovid 2015 h1 interactive video benchmarks
TRANSCRIPT

2015 H1 Interactive Video BenchmarksYour video, your interactivity, your results.
August 2015

Innovid Benchmarks | 2015
More Data. More Engagement.
The engagement of sight, sound and motion is increasingly vital for marketers looking to make an impact and better understand their audiences. That’s why we’re keeping you armed and ready with the most up-to-date data in our 2015 H1 Interactive Video Benchmarks.
The first half of this year yielded some amazing video campaigns and we’ve analyzed thousands of them—interactive and pre-roll— to better measure campaign performance for the rest of the year. Using these metrics will help you understand how various ad formats, publisher placements and ad lengths perform with respect to time earned, activity rate, engagement rate, completion rate, and much more. We’re also introducing a benchmark for the blocking solution powered by Innovid and DoubleVerify.
Making data-driven decisions based on audience behavior is ultimately going to improve your strategy by creating better content and ensuring that your target consumers see it. These benchmarks will help guide you towards understanding the optimal lengths, placements, and publisher choices for your video content to achieve your KPIs.
Welcome
Glossary
Activity Rate
Summary of Findings
Engagement Rate
Time Earned
Completion Rate
% Ad Viewed
Click-Thru Rate
Awareness
Viewability
Cross Device
Ad-Blocking
Find Your Industry
Wrap Up

Innovid Benchmarks | 2015
Glossary
Hover over the words for the definition.Welcome
Glossary
Activity Rate
Summary of Findings
Engagement Rate
Time Earned
Completion Rate
% Ad Viewed
Click-Thru Rate
Awareness
Viewability
Cross Device
Ad-Blocking
Find Your Industry
Wrap Up

Across all metrics, interactive video outperforms pre-roll video.
Once again, consumers show that they want to take an active role in their brand experiences, as interactive video outperforms static pre-roll in every arena. Overall, custom interactive campaigns generated 5.6 times more user activity than standard pre-roll campaigns. And in terms of ad length, shorter, 15-seconds ad spots saw
higher completion rates than 30-second ad spots, but the longer form content generated more user activity.
Engagement rate increases by 165% when interactive units are placed on premium publishers, and improves by 7% with 30 second vs. 15 second spots.
Click-thru rates jump by 81% using interactive units designed for CTR, than static pre-roll video.
Awareness levels rise by 51%when using interactive video, as well as when executing broadcast media buys.
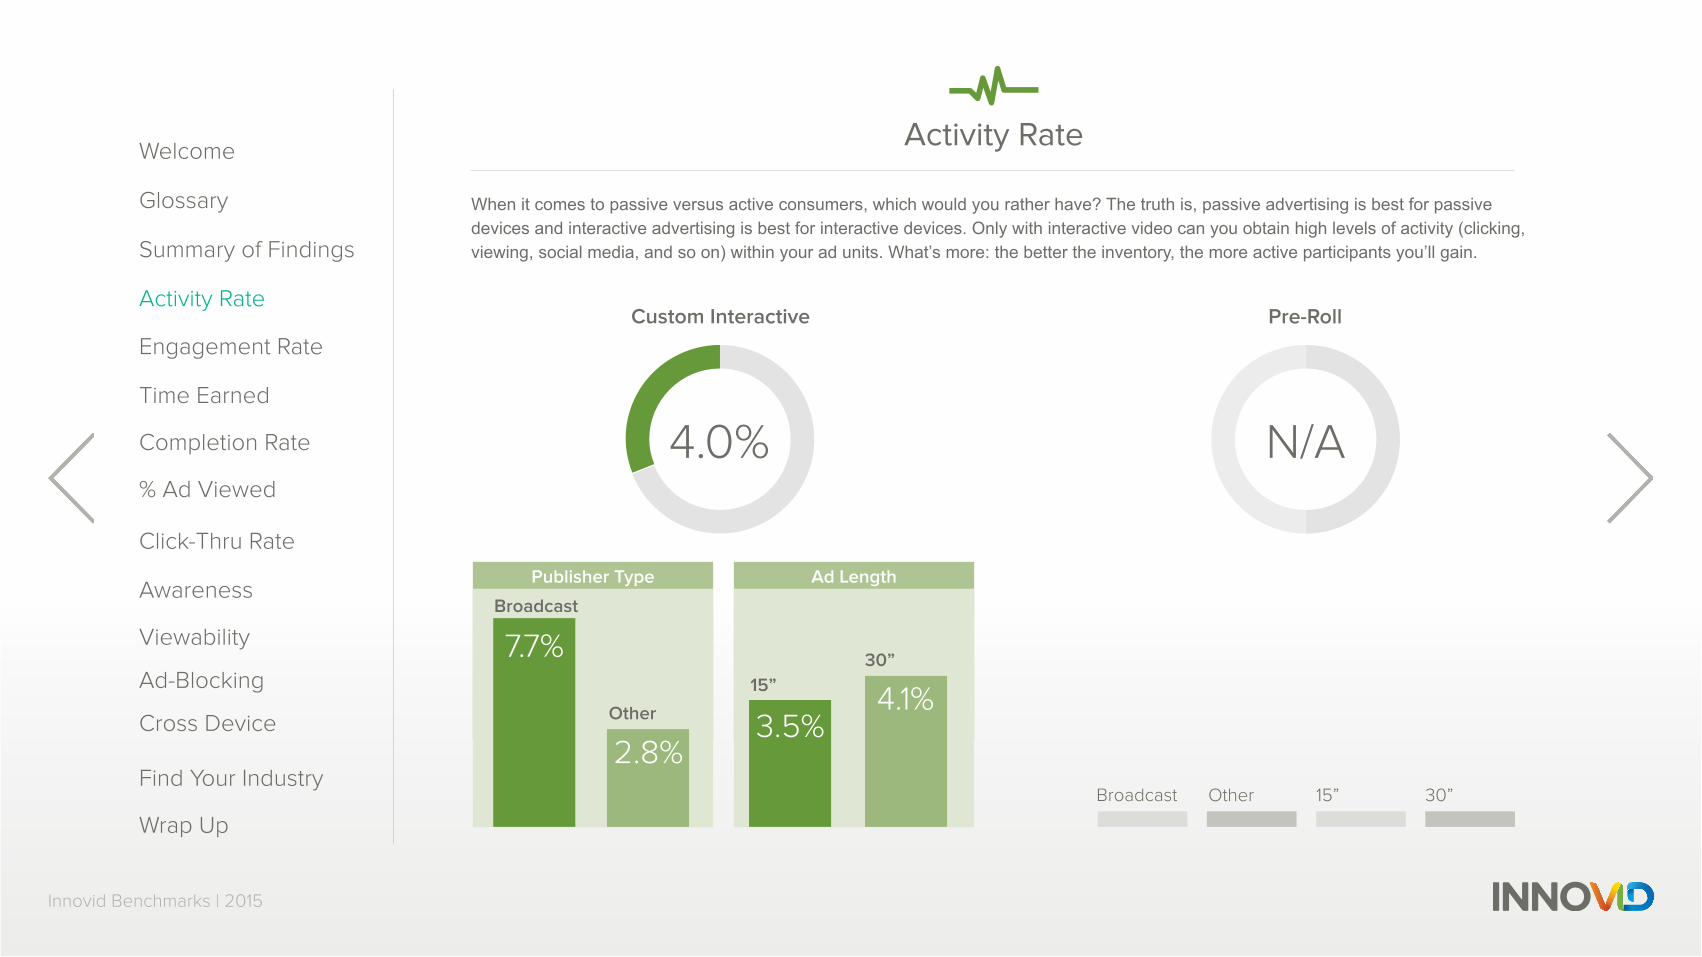
Activity rates lift by nearly 174%on broadcast placements over other content providers and aggregators.
Ads are 95% more viewable on broadcast placements than on lower tier publishers.
Interactive broadcast placements gained an additional 28 seconds of time earned than other content providers and aggregators.
Completion rates are 20% better on Broadcast placements than other content providers and aggregators. Mobile video
commands 176% more interactive engagementwhen it comes to cross-device campaigns than desktop.
Roku devices achieve a 99% completion rate and percent ad viewed rate for interactive video.
Summary of Findings
Ad LengthPublisher Type
Activity Rate
Innovid Benchmarks | 2015
When it comes to passive versus active consumers, which would you rather have? The truth is, passive advertising is best for passive devices and interactive advertising is best for interactive devices. Only with interactive video can you obtain high levels of activity (clicking, viewing, social media, and so on) within your ad units. What’s more: the better the inventory, the more active participants you’ll gain.
Broadcast Other 15” 30”
N/A4.0%
Pre-Roll
Other
2.8%
7.7%
Broadcast
30”
4.1%3.5%
15”
Custom Interactive
Welcome
Glossary
Activity Rate
Summary of Findings
Engagement Rate
Time Earned
Completion Rate
% Ad Viewed
Click-Thru Rate
Awareness
Viewability
Cross Device
Ad-Blocking
Find Your Industry
Wrap Up

Ad LengthPublisher Type
Engagement Rate
Innovid Benchmarks | 2015
Broadcast Other 15” 30”
N/A
Pre-Roll
Other
1.5%
3.9%
Broadcast
30”
2.1%2.0%
15”
2.1%
Custom Interactive
If you want consumers to take part in your brand story, it’s time to make your video ads interactive, in addition to engaging. Why? Because interactive video automatically gives consumers a reason to reach out and touch your content. With pre-roll video, the content merely passes them by—not to mention you have no idea if the content is resonating with your target audience. If that’s the case, you may as well just stick to TV. Go interactive and get the engagement insights you need to reinforce your marketing decisions.
Welcome
Glossary
Activity Rate
Summary of Findings
Engagement Rate
Time Earned
Completion Rate
% Ad Viewed
Click-Thru Rate
Awareness
Viewability
Cross Device
Ad-Blocking
Find Your Industry
Wrap Up

Ad LengthPublisher Type
Time Earned
Innovid Benchmarks | 2015
Broadcast Other 15” 30”
45.3
Custom Interactive
Seconds Seconds0
Pre-Roll
Other
38.7
66.8
Broadcast
30”
48.2 39.6
15”
Let’s face it: your ad buys are expensive and precious. But what if you could expand your video length without actually paying for a longer spot? That’s exactly what interactive video is designed to do. It’s something you just can’t achieve with pre-roll. With interactive, you’re basically earning an entire full ad’s time on top of the spot you already bought. Talk about ROI.
Welcome
Glossary
Activity Rate
Summary of Findings
Engagement Rate
Time Earned
Completion Rate
% Ad Viewed
Click-Thru Rate
Awareness
Viewability
Cross Device
Ad-Blocking
Find Your Industry
Wrap Up

Innovid Benchmarks | 2015
Completion Rate
78.3%79.3%
Custom Interactive
75.4%
Click-Thru Interactive Pre-Roll
Ad LengthPublisher Type
71.0%74.3%
89.6%
86.6%
Broadcast
15”
Other30”
Ad LengthPublisher Type
75.0% 74.5%
89.1%
82.4%
Broadcast
15”Other 30”
You spent a lot of time and money creating that video spot, so it’s definitely important that the majority of users are watching it in full. Even though marginal, using interactive elements does help squeeze out a bit more video completions than pre-roll, or even click-thru units. With the right ad placement and creative, consumers simply want to see what the entirety of your video has to offer—in addition to engaging with the unit.
Broadcast
15”
Ad LengthPublisher Type
Other 30”
90.8%
75.7%
84.7%
76.5%
Welcome
Glossary
Activity Rate
Summary of Findings
Engagement Rate
Time Earned
Completion Rate
% Ad Viewed
Click-Thru Rate
Awareness
Viewability
Cross Device
Ad-Blocking
Find Your Industry
Wrap Up

Innovid Benchmarks | 2015
% Ad Viewed
81.8% 82.7%85.3%
Custom Interactive Click-Thru Interactive Pre-Roll
Interactive units which are designed to draw in the audience and discover more content within the video, ultimately lead to more of your ad being seen—even more so than a standard pre-roll ad, which is easy to ignore. It’s also important to remember that the last 1.5 to 2 seconds for 15 second spots and the last 5 to 6 seconds for 30 second spots are rarely seen, so put your best content forward in the beginning and invite users to engage. Not to mention, when purchasing higher quality inventory, more of your ad gets seen—a win-win for your media plan.
Ad LengthPublisher Type Ad LengthPublisher TypeAd LengthPublisher Type
15” 15”15”
30”30”30”
Broadcast BroadcastBroadcast
Other OtherOther
82.8% 83.3%
93.3%89.2%
78.4%81.3%
92.9% 90.8%
80.3% 79.9%
90.6%86.2%
Welcome
Glossary
Activity Rate
Summary of Findings
Engagement Rate
Time Earned
Completion Rate
% Ad Viewed
Click-Thru Rate
Awareness
Viewability
Cross Device
Ad-Blocking
Find Your Industry
Wrap Up

Innovid Benchmarks | 2015
Click-Thru Rate
1.1% 0.6%0.6%
Custom Interactive Click-Thru Interactive Pre-Roll
If click-thrus are what you’re after, an interactive video designed to do just that will gain you far better metrics than pre-roll. However, custom interactive video is designed to keep the user in the unit itself, not clicking-thru, while utilizing the media buy to gain more ROI per impression.
Ad LengthPublisher Type Ad LengthPublisher TypeAd LengthPublisher Type
15”15”
15”30” 30”
30”
Broadcast
Broadcast
Broadcast
Other Other
Other
0.6% 0.7%0.4% 0.4%
1.0%1.6%1.4%
0.8% 0.6% 0.7%0.7%0.6%
Welcome
Glossary
Activity Rate
Summary of Findings
Engagement Rate
Time Earned
Completion Rate
% Ad Viewed
Click-Thru Rate
Awareness
Viewability
Cross Device
Ad-Blocking
Find Your Industry
Wrap Up

Innovid Benchmarks | 2015
Awareness
20.0% 15.7%23.7%
Custom Interactive Click-Thru Interactive Pre-Roll
Want to know if audiences are actually seeing your ad and your impressions aren’t being wasted? In order to understand both viewability and engagement implications, knowing if users are mousing over your video is crucial. After all, only “real” people can have ad awareness. What’s more, the nature of interactive media invites users to click, mouse and engage, something pre-roll just can’t achieve to scale.
Ad LengthPublisher Type Ad LengthPublisher TypeAd LengthPublisher Type
15”
15”15”
30”30”
30”
Broadcast
BroadcastBroadcast
OtherOtherOther
15.9%22.2%
48.8%
26.0%
11.7%
25.1%
47.0%
17.2%10.4%
17.1%
32.8%
14.6%
Welcome
Glossary
Activity Rate
Summary of Findings
Engagement Rate
Time Earned
Completion Rate
% Ad Viewed
Click-Thru Rate
Awareness
Viewability
Cross Device
Ad-Blocking
Find Your Industry
Wrap Up

Innovid Benchmarks | 2015
Viewability
Viewability (for VPAID) values ads based on potential eyeballs, rather than engagement, action or results. We now more than ever, have the ability to understand engagement and audience, thanks to a wealth of creative tools and technology at our disposal. However, at the end of the day, your better inventory buys get you better placements and subsequently, better viewability.
34%70%
Broadcast
42%
Portals & Publishers Platforms & Aggregators
Player Size Player Volume
Large
SmallLow
Mid
High
25%
94%
2%6%
72%
Player Size Player Volume
LargeSmall Low
Mid
High
55%
81%
21% 19%24%
Player Size Player Volume
Large
Small Low
Mid
High
54%
74%
26%17%
29%
Welcome
Glossary
Activity Rate
Summary of Findings
Engagement Rate
Time Earned
Completion Rate
% Ad Viewed
Click-Thru Rate
Awareness
Viewability
Cross Device
Ad-Blocking
Find Your Industry
Wrap Up
Innovid Benchmarks | 2015
Ad-Blocking
Percent of Impressions Blocked Reasons for Blocked Impressions
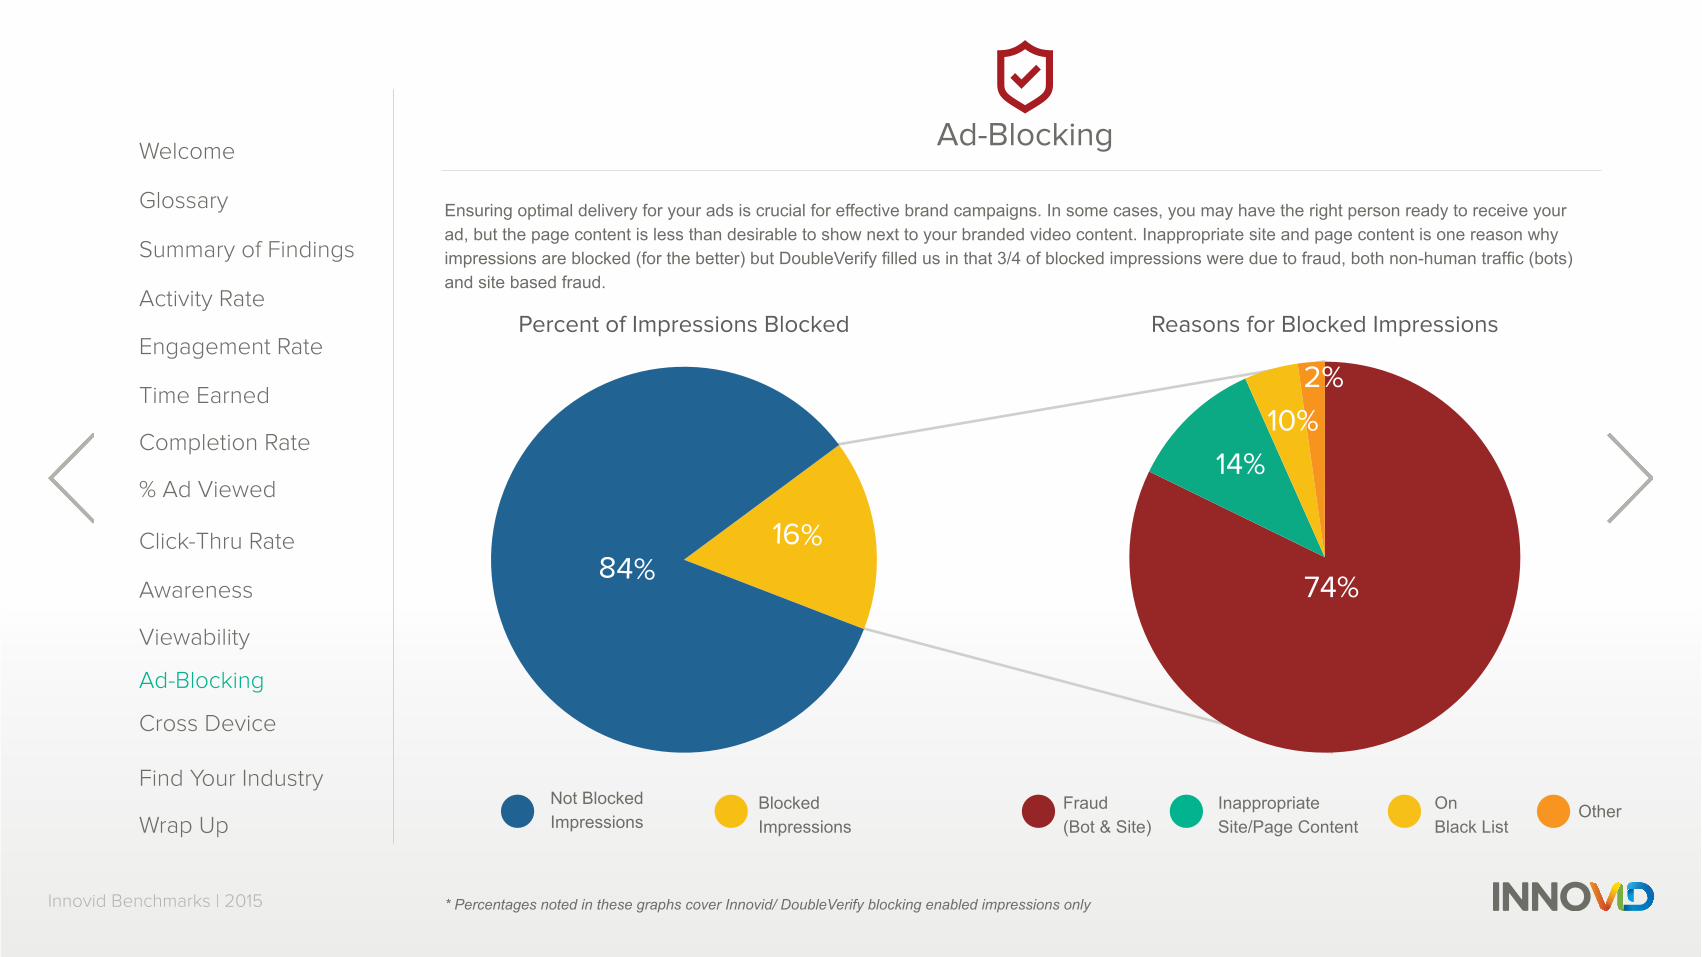
Ensuring optimal delivery for your ads is crucial for effective brand campaigns. In some cases, you may have the right person ready to receive your ad, but the page content is less than desirable to show next to your branded video content. Inappropriate site and page content is one reason why impressions are blocked (for the better) but DoubleVerify filled us in that 3/4 of blocked impressions were due to fraud, both non-human traffic (bots) and site based fraud.
* Percentages noted in these graphs cover Innovid/ DoubleVerify blocking enabled impressions only
Welcome
Glossary
Activity Rate
Summary of Findings
Engagement Rate
Time Earned
Completion Rate
% Ad Viewed
Click-Thru Rate
Awareness
Viewability
Cross Device
Ad-Blocking
Find Your Industry
Wrap UpFraud (Bot & Site)
On Black List
OtherInappropriate Site/Page Content
Not Blocked Impressions
Blocked Impressions
74%
10%
14%
2%
84%16%

Desktop
Desktop Mobile Roku
Activity Rate 3.8% 22.3% 3.8%
Engagement Rate 2.1% 5.7% 0.8%
Time Earned 81.8” 46.7” 93.7”
Completion Rate 83.1% 72.2% 99.0%
% Ad Viewed 88.1% 84.4% 99.2%
CTR 0.2% 4.1% N/A
Innovid Benchmarks | 2015
Cross Device
Advertising is going through a fundamental shift as cross-screen behaviors evolve with technology. OTT devices like Roku are gaining traction and our data is continued proof. Interactive placements on Roku devices gain an average of 94 additional seconds of time earned on top of pre-roll ads, which is 12 seconds more than on desktop and twice as long as on mobile devices.
Welcome
Glossary
Activity Rate
Summary of Findings
Engagement Rate
Time Earned
Completion Rate
% Ad Viewed
Click-Thru Rate
Awareness
Viewability
Cross Device
Ad-Blocking
Find Your Industry
Wrap Up

Innovid Benchmarks | 2015
Find Your Industry
Now that you’ve digested the video benchmarks as a whole, you probably want to know what works for your exact vertical. Good news: we’ve got it! We can provide benchmarks for almost any industry.
Simply email your account rep or [email protected] and we’ll set you up with your custom data.
Entertainment Finance/Insurance
Telecom
Gaming
QSR/Restaurants OtherPharma
Auto
Retail Travel/Tourism
CPG: HouseholdCPG: Food andBeverage
Welcome
Glossary
Activity Rate
Summary of Findings
Engagement Rate
Time Earned
Completion Rate
% Ad Viewed
Click-Thru Rate
Awareness
Viewability
Cross Device
Ad-Blocking
Find Your Industry
Wrap Up

Innovid Benchmarks | 2015
Innovid Headquarters30 Irving Place12th floorNew York, NY 10003Tel: +1-212-966-7555www.innovid.com
The numbers don’t lie.When it comes to pre-roll or interactive video, the choice is clear. The power that combining digital and interactivity yields is the next step in the evolution of consumer behavior.
Today’s audience consistently show a willingness to engage and participate with brand campaigns, so long as they’re convenient and tailored to their tastes. Passive content simply doesn’t satisfy the behaviors of audiences.
Are you ready to see how digital video can be easily transformed to draw in the consumer and invite them to interact with your brand story across multiple devices? You’ll earn more time, closer connections and better ROI. If your current creative strategy isn’t capable of communicating with your customers in these ways, you might want to see what Innovid’s interactive solutions are capable of.
Let Innovid take your audience on an interactive journey—and lift your brand higher.
Welcome
Glossary
Activity Rate
Summary of Findings
Engagement Rate
Time Earned
Completion Rate
% Ad Viewed
Click-Thru Rate
Awareness
Viewability
Cross Device
Ad-Blocking
Find Your Industry
Wrap Up