innovative use of petrophysics in field rehabilitation
TRANSCRIPT

Brovig RDS
Field Rehabilitation
Innovative Use of Petrophysics in Field Rehabilitation, with
Examples from the Heather Field
Simon Kay, Steve Cuddy, Paul Glover

Brovig RDS
Innovative Petrophysical Methods
• Dynamic log curve repair
• Permeability prediction
• Saturation modeling
• Geosteering using saturation modeling

Brovig RDS
Genetic Algorithm and Fuzzy Logic (GAFL)
• GAFL - statistical methods that find relationships within datasets and use these to make predictions.
• A family of log curves from the same geological formation will have many physical characteristics in common, and relationships exist between, for example, core permeabilities and GR, RHOB, RT, DT.
• Proprietary software developed by Brovig-RDS and Aberdeen University to run GAFL within Paradigm Geophysical’s Geolog log analysis software.
• The processes are automatic and fast.

Brovig RDS
Fuzzy Logic Prediction Method
Sonic log
Gamma-ray
NMROther logs

Brovig RDS
Light green areas denote extent of oil accumulation.
Heather Field Examples of Curve Repair and Permeability Prediction
Planned injector location
Planned producer location
West Heather
North Terrace
Main Field
Drilled to date
Drilled to date

Brovig RDS
Dynamic Curve Repair
Hole washout
Tool failure
Hole washout

Brovig RDS
Permeability Prediction
Brovig RDS
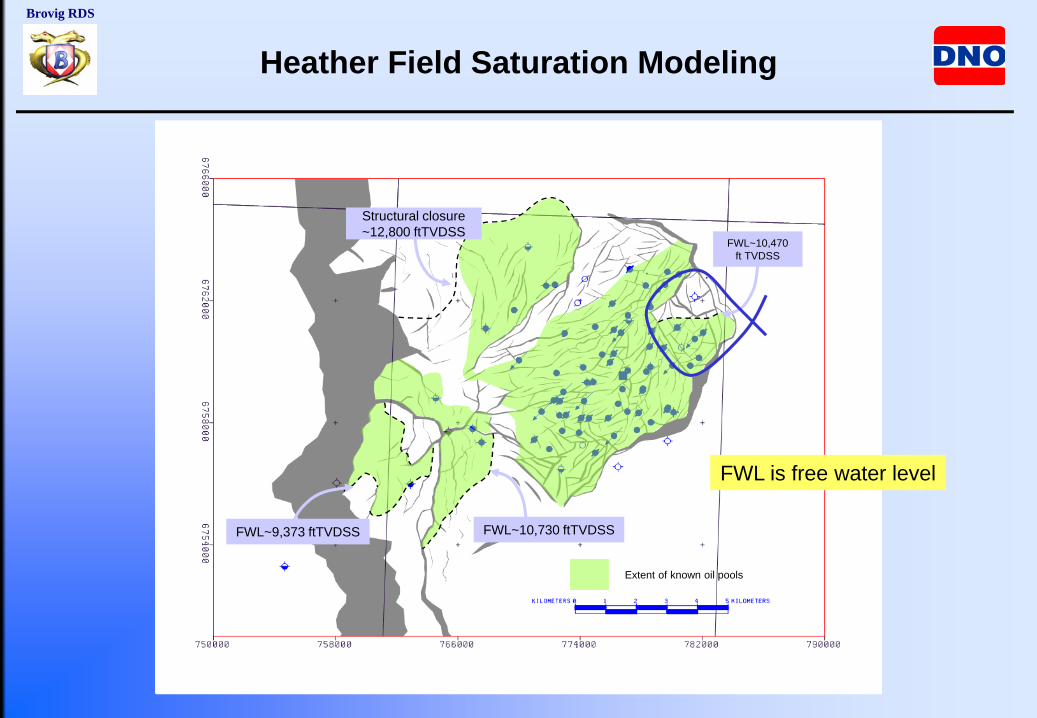
Heather Field Saturation Modeling
FWL~10,470 ft TVDSS
Extent of known oil pools
Structural closure~12,800 ftTVDSS
FWL~9,373 ftTVDSS FWL~10,730 ftTVDSS
FWL is free water level

Brovig RDS
Free water level approx. 10,730ft TVDSS
0.00
00.
000
0.02
50.
025
0.05
00.
050
0.07
50.
075
0.10
00.
100
0.12
50.
125
0.15
00.
150
0.17
50.
175
0.20
00.
200
0.22
50.
225
0.25
00.
250
10350 10350
10390 10390
10430 10430
10470 10470
10510 10510
10550 10550
10590 10590
10630 10630
10670 10670
10710 10710
10750 10750
FOIL vs. TVD CrossplotWell: 2/5-17 2/5-6
Filter: CALC.BED==1
TV
DS
S (
Fe
et)
FOIL (V/V)
Well Legend:2/5-17 2/5-6
362372
0
10
0 0
Saturation Modeling -Foil Plot for North Terrace Wells 2/5-6 and 2/5-17 (1)

Brovig RDS
Saturation Modeling -Foil Plot for North Terrace Wells 2/5-6 and 2/5-17 (2)
FOIL function = a H bwhere a=0.7873, b= -0.6513, H is height above free water level
Note plot is in height above free water level
The fluid distribution can be completely described by only one variable!
FWL

Brovig RDS
FWL approx. 12,800ft TVDSS?
Saturation Modeling -FOIL Plot for NW Heather

Brovig RDS
FWL approx. 11,550ft TVDSS
Saturation Modeling -FOIL Plot from Main Field Blocks A, H & C

Brovig RDS
Saturation Modeling -FOIL Plots from Main Field including Crestal Wells
A, H & C Block FWL approx. 11,550ft TVDSS (previous slide)
FWL~10,470 ft TVDSS
FWL higher in crestal D & E Blocks

Brovig RDS
Heather Field: Possible FWLs
FWL~12,800 ftTVDSS
FWL~10,730 ftTVDSS
FWL~9,373 ftTVDSS
FWL~10,470 ft TVDSS
FWL~11,550 ftTVDSS

Brovig RDS
Example Well CPI Comparing SW Calculated from Resistivity and Directly from FOIL Function
Swept zone - FOIL function computes initial saturations
Thin beds - FOIL function is probably a better measure of saturations than the resistivity tool
FOIL function accurately describes saturation in thick beds
From logsFrom FOIL Function

Brovig RDS
Geosteering using Modeled Curve Data
• Determine free water level (FWL) in offset wells
• Build 3D model and extract curve data (GR, resistivity, density)
• Model for tool response and hole angle
• Back out resistivity/height profile
TVD
SS
Phie*Sw
FWL ~ 10,500 ft Hei
ght a
bove
FW
L
Phie*Sw
FWL ~ 10,500 ft TV
DS
Sresistivity
FWL ~ 10,500 ft

Brovig RDS
Resistivity vs Height Example

Brovig RDS
• Compensated Waveform Resistivity– R55A - Blue– R25A - Green– R55P - Red– R25P – Black
• Anisotropy = 1• Dielectric Constant = 10
Rt Model
Wellbore Inclination = 81 degrees
Resistivity Model Example for a High Angle Well
Rt
Distance along borehole
shale
water leg
sand

Brovig RDS
Conclusions
• Fuzzy Logic is a powerful predictive tool with many rock property prediction applications
• Dynamic Curve Repair - LWD data are often lower quality than wireline data Dynamic curve repair can bridge the quality gap
• Permeability prediction by Fuzzy Logic allows better choice of perforating intervalsIt is still reliant on a good core permeability database
• The FOIL function is a simple and effective way of describing fluid saturations It can help in thin beds and in wells where the resistivity tool was not run
• Saturation modeling with the FOIL function has many uses Locate free water levelsAid understanding of structural complexityIdentify swept zonesCan be used in geosteering to maintain a required distance from fluid boundaries3D reservoir modeling