innovative & emerging sanitation & dtitii...
TRANSCRIPT

Current & Innovative Approaches to Microbiological Food Safety Management
Innovative & Emerging Sanitation & D t i ti I i thDecontamination Issues in the
Food Industry
Katherine MJ Swanson, Ph.D.Katherine MJ Swanson, Ph.D.Vice President Food Safety
New Delhi, IndiaNew Delhi, IndiaOctober 22, 2008

Discussion topics
Hygiene – essential food safety foundation Hygiene improvement driversCleaning & disinfection evolutionCleaning & disinfection evolutionExpansion of application to direct product treatments

Hygiene –Hygiene Essential Food Safety FoundationSafety Foundation

Top 10 Factors Contributing to US Foodborne Illness 1998-2002Foodborne Illness 1998-2002
1 F d t t f l h 29%1. Food at room temp for several hours – 29%2. Bare-hand contact by food handler – 25%3 Inadequate cleaning of equipment – 22%C t i ti 3. Inadequate cleaning of equipment 22%4. Handling by infected person or carrier – 20%5. Inadequate cold-holding temperature – 19%Growth
Contamination
q g p6. Cross contamination from raw animal products – 12%7. Insufficient cooking – 12%Survival
8. Raw ingr. contaminated by animal or environment – 11%9. Slow cooling – 11%
I d t h t h ldi ti /t t 10%10. Inadequate hot-holding time/temperature – 10%
Source: CDC 2006 MMWR 55(SS10):1-34

Examples of Lapses in Sanitation
Mexican-style cheese, USA, 1985Listeriosis from cheese contaminated with raw milkListeriosis from cheese contaminated with raw milk
142 confirmed cases, 48 deathsCost ? – Industry/regulation changing eventE ti t j il Executives to jail
New England J Med. 1988. 319:823-8.
Salmonella in ice cream USA 1993Salmonella in ice cream, USA, 1993Unpasteurized eggs in same tank truck
up to 224,000 people sick 593 fi d 593 confirmed cases25,000 lawsuits
New England J Med. 1996. 334:1281-6

More Examples
Staphylococcus aureus in low-fat milk, Japan 2000p y , pContamination in production-line value or powdered milk
>13,000 casesPolice investigation plant closed CEO resignedPolice investigation, plant closed, CEO resignedCost: Market leader lost consumer confidence
IASR 2001. 22:185-6
Norovirus & hurricane Katrina evacuees, US 2005Crowding and inadequate hygieneg q yg
>1000 evacuees and relief workers ill in the Huston AstrodomeCost: added stress to traumatized people
MMWR 2005 54(40):1016 8MMWR 2005. 54(40):1016-8.

Role of Hygiene & Disinfection in Food Safety Objectives (FSO)Objectives (FSO)
Controlling initial levels (H )Controlling initial levels (Ho)Supplier programs that minimize contamination
Reducing a hazard (Σ R)Reducing a hazard (Σ R)Inactivation on food surfacesInactivation / reduction on hands
Controlling increase of the hazard (Σ I)Prevent recontamination from the environment and equipment
Ho - Σ R + Σ I ≤ FSO or PO

Hygiene ygImprovement DriversDrivers

1900s Food PlantsL l d ti h d li it d l tiLocal production reached limited population
Small facilitiesServe local market
Hundreds of people
Q i k t Quick turnover Local regulatory
i trequirements

Today’s Global Food PlantsC t h th li f MILLIONS f lCan touch the lives of MILLIONS of people
Large facilitiesServe the world Serve the world
Millions of peopleLong distribution timesgMultiple regulatory requirements

Shelf life extensionM b d d f l di t ib tiMay be needed for long distribution
Extending shelf life provides more time for problems to 6
8
onmore time for problems to
developLower initial population (H0)
4
6
Po
pu
lati
o
Lower initial population (H0) can increase shelf lifeImproved hygiene can lower
2
Lo
g P
Improved hygiene can lower initial population 0
0 5 10 15 20 25 30
Time (days)Time (days)

Aging population increases susceptibility
55

Environmental contamination can persist
Example: L. monocytogenes persistence in manufacturing
Process plant type TimeCheese 11 months – 7 yearsFish Months – 4 yearsIce cream 7 yearsMeat Months – 4 yearsPoultry 12 yearsTompkin, J Food Protect. 6(4): 709

Extending the time between cleaning may allow microbial build upallow microbial build up
Potential development of biofilms biofilms
Higher populationsResistant organisms
CLEANING is essential to help prevent formation

H iHygiene Evolution

Sanitation 4 x 4
Pre-rinsePre rinseWash - remove soil
Concentration
Concentration
TemperatureCo ce a oTemperatureTime Mechanical force
Concentration
TemperatureMechanical
Temperature
Mechanical force
RinseS iti
TimeForce
SanitizeKill microorganisms Mechanical Force
Time

Wet Cleaning Evolution
Sink, bucket & brush → Clean Out of Place (COP) tanks & Clean In Place (CIP) systemstanks & Clean In Place (CIP) systemsLiquids → Foams/GelsDirect food treatments

Sanitizer Evolution ExampleT ffi tt li k d ith t i ti t fTraffic patterns linked with contamination transfer
Automated doorway ffoamersEasier maintenanceApplicable to footwear & wheelsMore consistent coverageMore consistent coverage

Clean-In-Place (CIP )

Common Cleaning Issues with Heated SurfacesSurfaces
Heat denatures proteins, starches, fatsComplex soil matrix burned onto surfacesResidual soils create a harborage for bacteriaResidual soils create a harborage for bacteriaResidual soils reduce heat-transfer efficiencyResidual soils contaminate startup process stream

Fouling Mechanism TheoryHow does fouling build-up?
*. *.
Two different types of deposit:;
;°
;
;°
Two different types of deposit:
Dense mineral deposit layers on stainless
;
;:
:
;
;:
:
Dense mineral deposit layers on stainless steel pipe surfaces
;:
;:
Second layer of protein / fat / carbohydrate matrix depending on product

Caustic Cleaning Dairy ExampleI fl f N OH t tiInfluence of NaOH concentration
*. *.*. *.
High NaOH concentrations cause fouling ;
;°
;
;°
;
;°
;
;°
High NaOH concentrations cause fouling layer to swell and a protein gel forms (rubber-like top layer)
P t id t ti f th lk li
;
;:
:
;:
:
;
;:
:
;:
:
Prevents rapid penetration of the alkaline cleaning solution into the soil layerSoil removal takes more time.
;:
;:
;:
;:
Degree of “gel formation” depends on NaOH concentration, soil temperature, contact time, and process stream

Patented Cleaning Approach for CIPSTEP 1: Pre-treatment product (oxidizer-based) circulated to penetrate soil layerSTEP 2: Alkaline detergent circulated and the rise in pH triggers Step 3STEP 3: Hydroxide ions interact with oxygen components, triggering rupture of burnt-on soil matrix into piecesSTEP 4: Cleaning solution easily removes the smaller pieces of soil that are no longer adhering to the surface
OH-
Step 1 Step 2 Step 3 Step 4

Laboratory Comparison – Dairy SoilMilk cooked on to stainless steel disks simulates pasteurizer soils30 minute cleaning Standard Cleaning = 2.0% Alkaline Detergent + 1.0% Chelating AgentAdvanced Cleaning = 0.75% Pretreatment (15min); 1.25% Alkaline Detergent (15min)
AdvancedCleaningStandard CleaningWater Control

Pilot Plant Cleaning Comparison
Pilot Plant Pasteurizer for Raw Milk and Whey
Pilot Scale HTST Soil beforecleaning Standard Two-Part

Customer A – Cleaning ResultsN il i i b h i i iNo soil remaining – better than previous inspection

Sanitizer Evolution for Food Use
Peracid CombinationAcidified Sodium Chlorite
A id S itiPeracetic Acid
Peracid Combination
Acid AnionicsAcid Sanitizers
IodophorsQuats
1950 1960 1970 20001980 1990Hypochlorites
950 960 9 0 000980 1990

There is NO Perfect Sanitizer
Chlorine Iodine Quat Acid Anionic Fatty Acid Peracid
C i Corrosive (ss) High Moderate None Low Low Low
Temp Sensitivity Low High Moderate High Moderate LowSensitivity
pH Sensitivity Moderate Low Low High High Low
Foam Level None Moderate Moderate High Low NoneFoam Level None Moderate Moderate High Low None
Phosphate None High None High High None
Residual Residual Activity None None High Low Moderate None
Soil Load Sensitivity High Moderate Low Moderate Moderate Lowy

Follow Regulatory Requirements
Local and importing country requirements may vary
DIRECTIONS FOR USE:It is a violation of Federal law to use this product in a manner inconsistent with its labeling.g
Sanitizer Product Label

F E i tFrom Equipment to Product

US FoodNet Estimates of Foodborne Illness 1996-2007Illness 1996-2007
Rate/100,000Organism Overall 2007 Change*Salmonella 14.92 8% ↓Campylobacter 12.79 31% ↓Shigella 6.26 36% ↓Cryptosporidium 2 67 Not significantCryptosporidium 2.67 Not significantE. coli O157 1.20 25% ↓Yersinia 0.36 49% ↓Yersinia 0.36 49% ↓Vibrio 0.24 Not significantListeria monocytogenes 0.27 42% ↓
*Compared to 1996-98 baselineSource: CDC 2008. Preliminary FoodNet Data MMWR 57(14);366-370

US Department of Agriculture Data on Salmonella Prevalence in BroilersSalmonella Prevalence in Broilers
20
Incentive for improvement
10
15
% P
ositive
5
10
1998 2000 2002 2004 2006 2008
%
1998 2000 2002 2004 2006 2008
USDA FSIS“Persistent upward trend in positive verification samples Persistent upward trend in positive verification samples provides reason for concern”
USDA Food Safety & Inspection Service, after 2005 data released y p ,Targeted 2006 sampling based on reduction of % positive
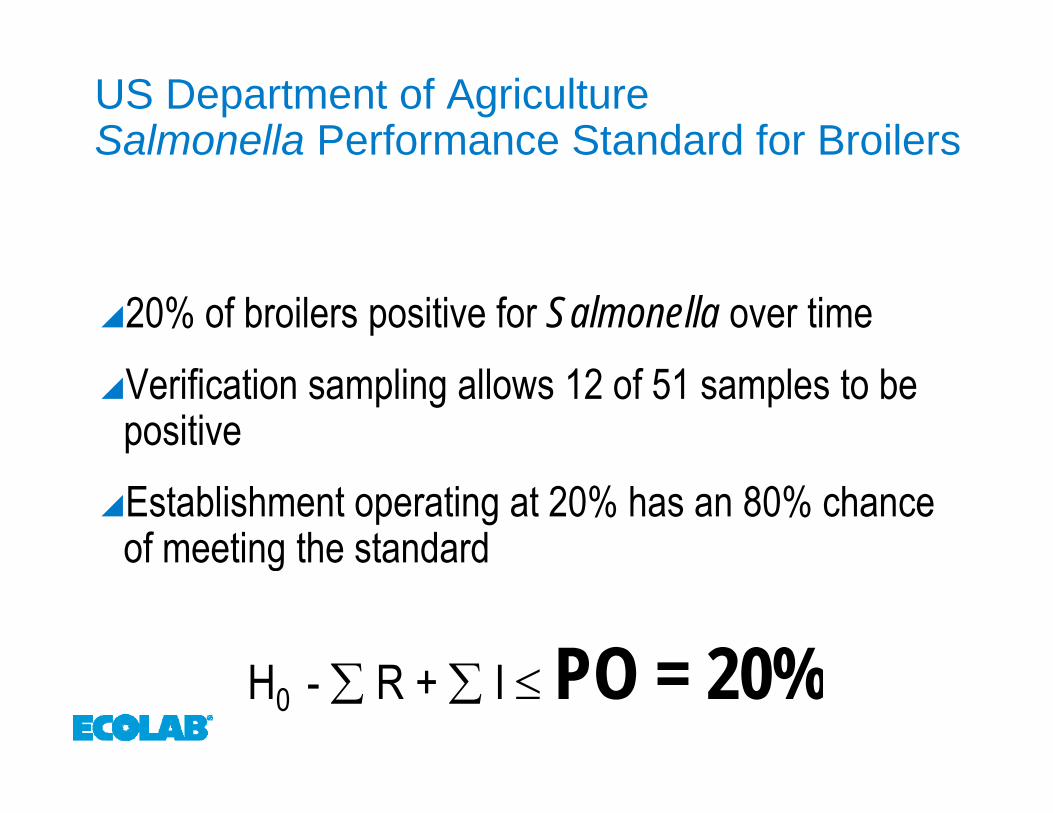
US Department of AgricultureSalmonella Performance Standard for BroilersSalmonella Performance Standard for Broilers
20% of broilers positive for Salmonella over timeVerification sampling allows 12 of 51 samples to be positiveEstablishment operating at 20% has an 80% chance of meeting the standardof meeting the standard
PO = 20%H0 - ∑ R + ∑ I ≤ PO = 20%

Hypothetical Distribution & Meeting Standard
Salmonella Performance Standard for Broilers
qu
en
cyti
ve
fre
qR
ela
0 10 20 30 40 50
% Positive

Chicken Process Flow –Antimicrobial Enhancements (light background)Antimicrobial Enhancements (light background)
Receiving Killing Bleedingg
W hi D f th i S ldi
g g
Washing Defeathering Scalding
Inside/OutsideBird WashEviscerating On Line
Reprocessing
AntimicrobialChillingShipping Packaging Post-Chill
Dip

Major Antimicrobial Treatments
HypochloriteTri sodium phosphate (TSP)Chlorine dioxide (ClO )Chlorine dioxide (ClO2)Peracid treatmentsAcidified sodium chlorite (ASC)

Potential Antimicrobial Treatments in the USAUSA
Process step Chemical treatmentInside-outside bird wash Typically chlorine
On-line reprocessing Peracid, ASC, TSP, ClO2On line reprocessing Peracid, ASC, TSP, ClO2
Chiller Chlorine, peracid, ClO2
Post-chill spray or dip ASC, ClO2

Poultry Plant Salmonella Interventions
ASC Post-Chill Dip +
Incoming Post-chillNot detected
Peracid in Chiller
Peracid in Chiller
Trisodium phosphate
Acidified sodiumchlorite (ASC) OLR
Chlorine dioxide OLR
Trisodium phosphateOLR
0 20 40 60 80 100Salmonella spp. Prevalence (%)
NOTE: Use requires country approval
Adapted from: Danilson. 2005. US Poultry & Agr Assoc, Salmonella Control Conference, March 17, 2005
NOTE: Use requires country approval

Multi-hurdle antimicrobial treatment
Salmonella prevalence during broiler processing
100
60
4060
80
ence
(%
)
15520
40
Pre
vale
0Before ASC
sprayAfter ASC
sprayAfter
peracidchiller
After ASCdip
chiller

Acidified Sodium Chlorite on Chicken CarcassesCarcassesSubstantial reduction in prevalence and levelAustralian commercial operation
TPC E coli Salmonella Campylobacter
Australian commercial operation
TPC E. coli Salmonella Campylobactercfu/cm2 % cfu/cm2 % cfu/cm2 % cfu/cm2
Untreated 2 78 100 1 55 90 1 80 100 1 59Untreated 2.78 100 1.55 90 -1.80 100 1.59
Treated 1.23 13 -0.64 10 -1.85 23 -2.21
Mean log difference
1.55 2.19 0.05 3.80
Sexton et al 2007. Intl J. Food Microbiol. 115 (2): 252-5

Summary
Increasing importance of hygiene
Broad distribution magnifies riskShelf life extension magnifies problemsAging & immunocompromised population growingAging & immunocompromised population growingEnvironmental harborage must be eliminatedOperational efficiency (extending run times) requires cleaner systemsy

Summary
Cleaning & Disinfecting Systems are Evolving
Manual to CIP, and soap & water to foam can provide more consistent results with greater efficiencymore consistent results with greater efficiencyThere is no perfect cleaner or sanitizer
Match it to the equipment, application, and regulatory requirements
Antimicrobial treatments for food may provide improvements over traditional methods
R i l t lRequires regulatory approval