innovation, competitiveness and economic development
TRANSCRIPT
INNOVATION, COMPETITIVENESS AND ECONOMIC DEVELOPMENTUNDERSTANDING THE SITUATION FOR STARTUPS IN INDIA

INNO
VATIO
N, C
OM
PETIT
IVEN
ESS
AND
ECO
NOM
IC D
EVEL
OPM
ENT
WHAT IS COMPETITIVENESS?
• Competitiveness is the productivity (value per unit of input) with which a nation, region, or cluster utilizes its human, capital, and natural resources. Productivity sets a nationʼs or regionʼs standard of living (wages, returns on capital, returns on natural resources)• Productivity depends both on the value of products and services (e.g. uniqueness, quality) as well as the
efficiency with which they are produced. • It is not what industries a nation or region competes in that matters for prosperity, but how firms compete
in those industries• Productivity in a nation or region is a reflection of what both domestic and foreign firms choose to do in
that location. The location of ownership is secondary for prosperity.• The productivity of “local” industries is of fundamental importance to competitiveness, not just that of
traded industries• Devaluation and revaluation do not make a country more or less “competitive”
• Nations and regions compete in offering the most productive environment for business
Source: Michael E. Porter and Institute for Strategy and Competitiveness

INNO
VATIO
N, C
OM
PETIT
IVEN
ESS
AND
ECO
NOM
IC D
EVEL
OPM
ENT
WHAT DETERMINES COMPETITIVENESS
Source: Michael E. Porter and Institute for Strategy and Competitiveness
Microeconomic Competitiveness
Quality of Business Environment
State of Cluster Development
Sophistication of Company Operations & Strategy
Macroeconomic Competitiveness
Sound Monetary and Fiscal Policy
Human Development and Effective Public Institutions
Endowments
Sophistication of Company Operations & Strategy
Clusters are “geographically
proximate group of interconnected companies and
associated institutions in a particular field,
linked by commonalities and complementarities.
The geographic scope of clusters ranges from
a region, a state, or even a single city to
span nearby or neighboring countries.”
INNO
VATIO
N, C
OM
PETIT
IVEN
ESS
AND
ECO
NOM
IC D
EVEL
OPM
ENT
WHAT IS INNOVATION?
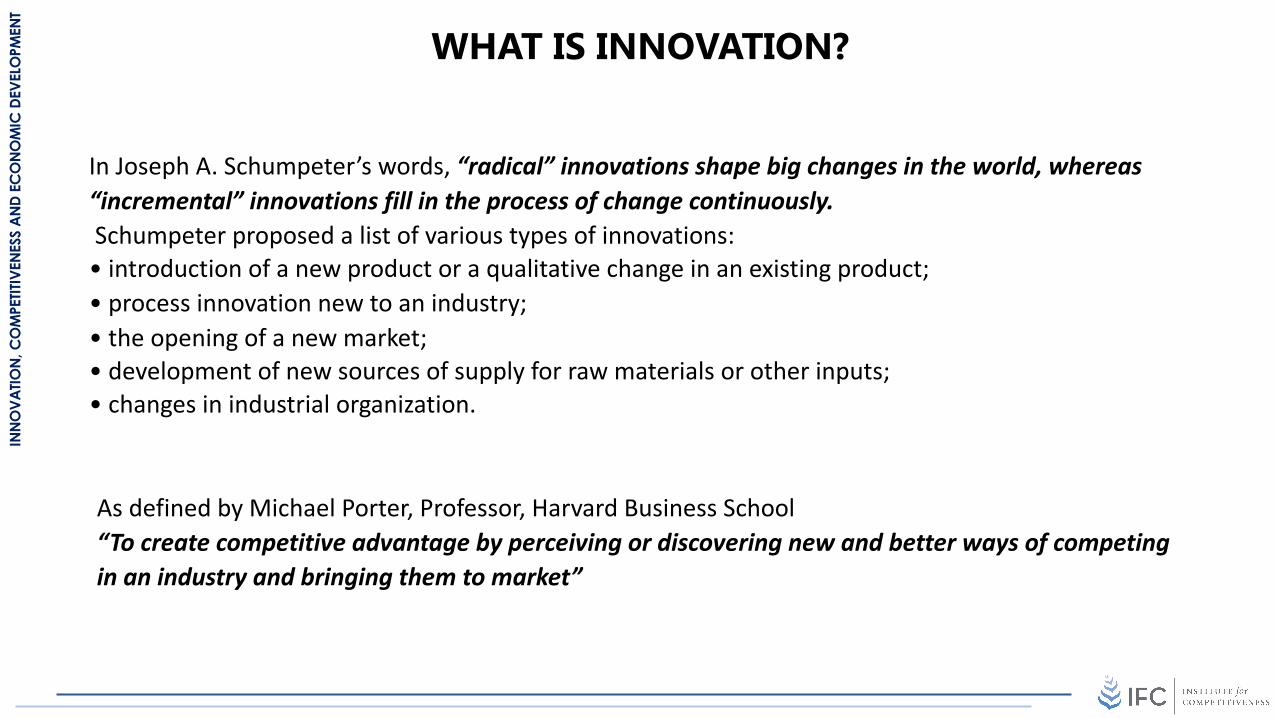
In Joseph A. Schumpeter’s words, “radical” innovations shape big changes in the world, whereas “incremental” innovations fill in the process of change continuously.Schumpeter proposed a list of various types of innovations: • introduction of a new product or a qualitative change in an existing product; • process innovation new to an industry; • the opening of a new market; • development of new sources of supply for raw materials or other inputs;• changes in industrial organization.
As defined by Michael Porter, Professor, Harvard Business School“To create competitive advantage by perceiving or discovering new and better ways of competing in an industry and bringing them to market”

INNO
VATIO
N, C
OM
PETIT
IVEN
ESS
AND
ECO
NOM
IC D
EVEL
OPM
ENT
WHY INNOVATE?
The capability to innovate and to bring innovation successfully to market is a crucial determinant of the global competitiveness of nations.
• Firms create value adding goods and services by realizing the potential of natural resources
Inherited Prosperity(Natural Resources)
Created Prosperity
Government
• Land• Labour• Capital
• To create conducive conditions to enable innovation
INNO
VATIO
N, C
OM
PETIT
IVEN
ESS
AND
ECO
NOM
IC D
EVEL
OPM
ENT
GLOBAL INNOVATION
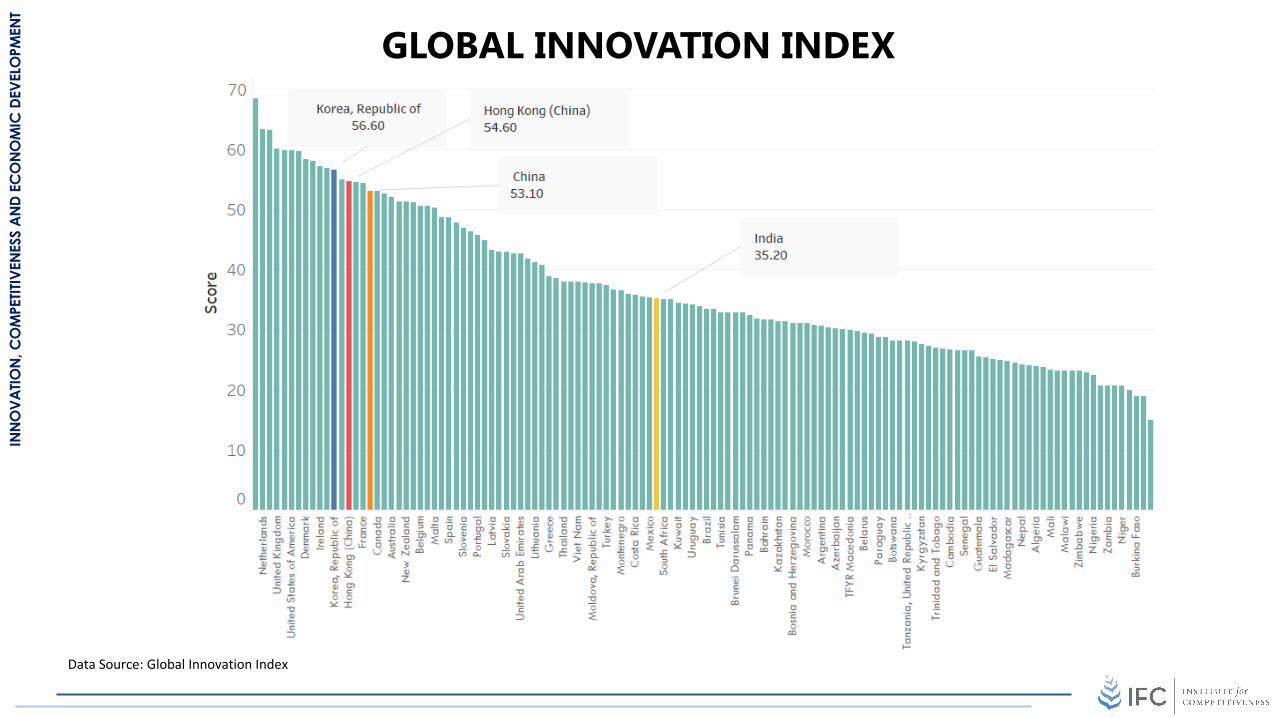
Data Source: Global Innovation Index
GLOBAL INNOVATION INDEX

INNO
VATIO
N, C
OM
PETIT
IVEN
ESS
AND
ECO
NOM
IC D
EVEL
OPM
ENT
COUNTRY-WISE GROWTH IN PATENTSUNITED STATES
JAPAN
GERMANY SOUTH KOREATAIWAN
UNITED KINGDOMFRANCE CANADA
SWITZERLANDNETHERLANDS
SWEDEN
CHINA
ISRAELAUSTRALIA
FINLANDBELGIUMAUSTRIA
INDIA
DENMARK SPAINSINGAPORENORWAY IRELAND
NEW ZEALANDRUSSIA
SOUTH AFRICA
BRAZIL
HUNGARYMEXICO MALAYSIA
SAUDI ARABIA
ARGENTINA
POLANDTHAILAND
GREECE
VENEZUELA
TURKEY
BULGARIAPHILIPPINES
CHILEPORTUGALUKRAINE ICELAND ROMANIAKUWAIT
COLOMBIACOSTA RICAINDONESIA
EGYPTUNITED ARAB EMIRATESESTONIA
URUGUAY
CUBALEBANON
PERU
LITHUANIA PAKISTAN
SRI LANKA
BERMUDA KENYA
1
10
100
1000
10000
100000
1000000
-10 -5 0 5 10 15 20 25 30 35
Tota
l Num
ber o
f Pat
ents
gra
nted
in 2
015
CAGR Growth Rate of Patents granted from 2002-2015Source: USPTO, http://www.uspto.gov/web/offices/ac/ido/oeip/taf/cst_utlh.htm
COUNTRY WISE GROWTH IN PATENTS

INNO
VATIO
N, C
OM
PETIT
IVEN
ESS
AND
ECO
NOM
IC D
EVEL
OPM
ENT
LINK BETWEEN PATENTS AND COMPETITIVENESS
Delhi
Goa
Haryana
Maharashtra
Tamil Nadu
Uttarakhand
Gujarat
Kerala
Karnataka
Punjab
Himachal Pradesh
Andhra Pradesh
West Bengal
Rajasthan
Chhattisgarh
Madhya Pradesh
Odisha
Jammu & Kashmir
Jharkhand
Uttar Pradesh
Bihar
Sikkim
Nagaland
MizoramTripura
Assam
y = 118.32x - 6267.6R² = 0.5581
1
10
100
1000
10000
50.00 52.00 54.00 56.00 58.00 60.00 62.00 64.00 66.00 68.00 70.00
Num
ber o
f Pat
ents
file
d in
201
5-16
(in
log
scal
e)
State Competitiveness Index Scores 2016Source: Annual Reports of CGPDTM Various Rounds
LINK BETWEEN PATENTS AND COMPETITIVENESS

INNO
VATIO
N, C
OM
PETIT
IVEN
ESS
AND
ECO
NOM
IC D
EVEL
OPM
ENT
Switzerland
SwedenNetherlands
United States of America
United Kingdom
Denmark
Singapore
Finland
Germany
Ireland
South Korea
Luxembourg
Iceland
Japan
France
Hong Kong (China)
IsraelCanada
Norway
AustriaNew Zealand
China
Australia
Czech RepublicEstonia
Malta
Belgium
Spain
Italy
Cyprus
PortugalSloveniaLatvia
Slovakia
United Arab Emirates
Bulgaria
Malaysia
Poland
Hungary
Lithuania
Croatia
RomaniaTurkey
Greece
Russian FederationChile
Vietnam
Montenegro
Qatar
Ukraine
Thailand
Mongolia
Costa Rica
Moldova
Saudi Arabia
KuwaitSouth AfricaMexico
Armenia
India
Macedonia
Serbia
PanamaMauritius
Colombia
Bahrain
UruguayGeorgia
BrazilPeruMorocco
Philippines
Tunisia
Iran
Argentina
OmanKazakhstan
Dominican RepublicKenyaLebanon
Azerbaijan
Jordan
Jamaica
Paraguay
Indonesia
BotswanaSri Lanka
Trinidad and TobagoEcuador
AlbaniaTajikistan
KyrgyzstanTanzania
NamibiaGuatemala
Rwanda
Senegal
Cambodia
UgandaEl Salvador
Honduras
Egypt
Bolivia
Mozambique
AlgeriaNepalEthiopia
Madagascar
Cote dIvoire
Pakistan
Bangladesh
Malawi
BeninCameroonMali
NigeriaZimbabwe
Burundi
Zambia
Yemen
y = 0.0495x + 2.4882R² = 0.8064
2
3
4
5
6
7
10 20 30 40 50 60 70
Glo
bal C
ompe
titiv
enes
s Ind
ex 2
016-
17
Global Innovation index Score 2017
COUNTRY-WISE GROWTH IN PATENTSINNOVATION & COMPETITIVENESS: GLOBAL LEVEL
INDIA INNOVATION INDEX
ANALYSING INNOVATION ECOSYSTEM AT THE SUB-REGIONAL LEVEL IN INDIA

INNO
VATIO
N, C
OM
PETIT
IVEN
ESS
AND
ECO
NOM
IC D
EVEL
OPM
ENT
WHY INDIA INNOVATION INDEX?
• The Global Innovation Index reveals the variation in performance across countries. It helps our policymakers in identifying the areas in which our country is lagging behind.
• But the conditions vary significantly within the country. Region specific insights are important as different regions have disparate needs and challenges. And therefore policies driving progress in these regions should also be framed accordingly. Thus, India Innovation Index is conceptualised to analyse innovation ecosystem at sub-regional level in India.
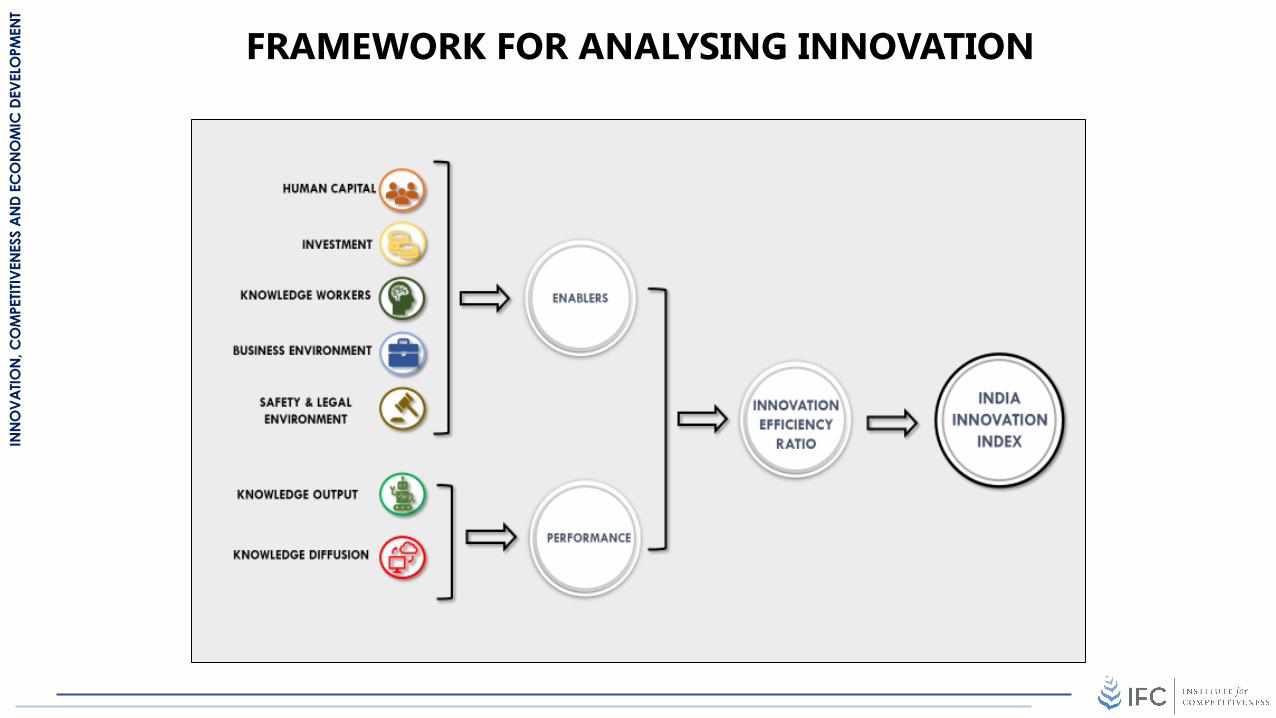
• India Innovation Index intends to help in better understanding of a state’s innovation ranking and its performance relative to its economic peers. It incorporates key indicators relating to six pillars that can be used to understand the performance of a state with regards to innovation capabilities. The pillar performance rankings can also serve to identify key areas where a state is under or over performing.

INNO
VATIO
N, C
OM
PETIT
IVEN
ESS
AND
ECO
NOM
IC D
EVEL
OPM
ENT
WHY INDIA INNOVATION INDEX?
CHALLENGES & OPPORTUNITIES
Identifying key challenges and opportunities for
policymakers, businesses and state governments
RANKINGS
Ranking of Indian states to measure the current
state of innovation
ACTIONS
Assisting in tailoring governmental policies to
foster innovation by providing focus areas and identifying opportunities.
I N D I A I N N O V AT I O N I N D E X
INNO
VATIO
N, C
OM
PETIT
IVEN
ESS
AND
ECO
NOM
IC D
EVEL
OPM
ENT
FRAMEWORK FOR ANALYSING INNOVATION

INNO
VATIO
N, C
OM
PETIT
IVEN
ESS
AND
ECO
NOM
IC D
EVEL
OPM
ENT
INNOVATION SCORES
Insights
• The states show variation across innovation scores with scores ranging from 42.9 to 6.2.
• Karnataka, Delhi, Tamil Nadu and Maharashtra are the best performing states.
• 11 out of thirty-six states register single digit score.

INNO
VATIO
N, C
OM
PETIT
IVEN
ESS
AND
ECO
NOM
IC D
EVEL
OPM
ENT
HOW INNOVATION HAS CHANGED?
INNO
VATIO
N, C
OM
PETIT
IVEN
ESS
AND
ECO
NOM
IC D
EVEL
OPM
ENT
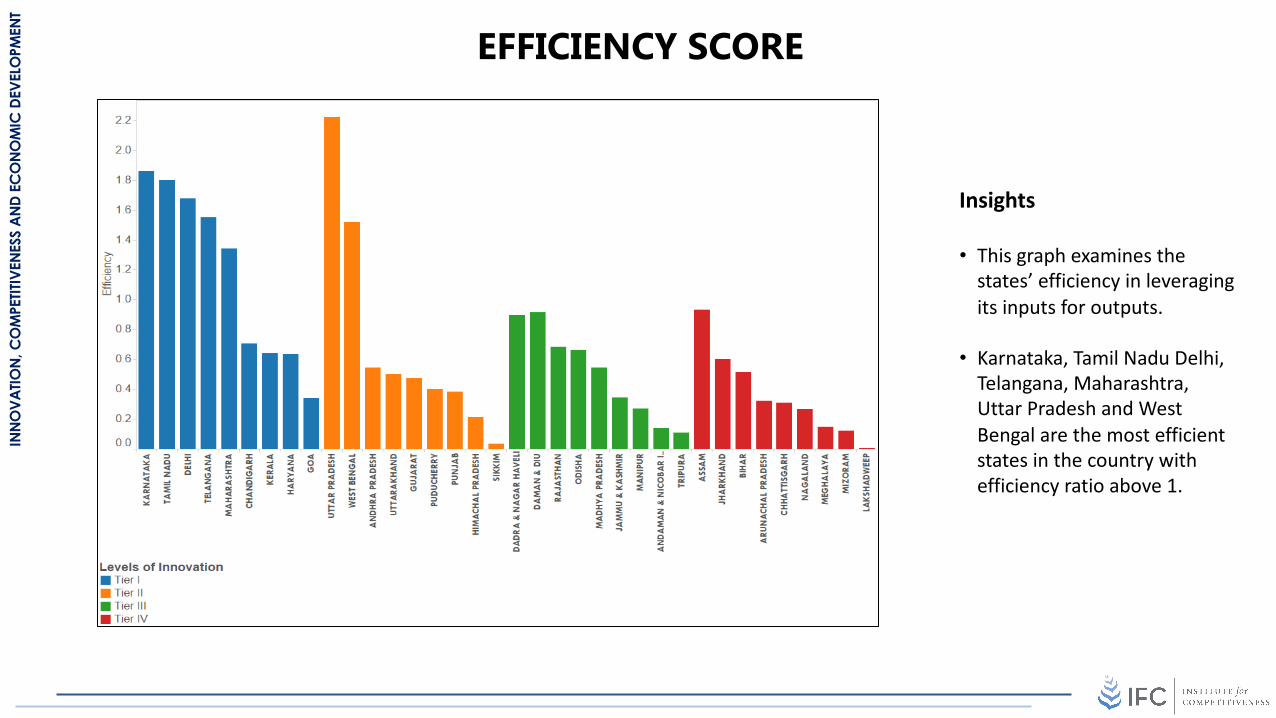
EFFICIENCY SCORE
Insights
• This graph examines the states’ efficiency in leveraging its inputs for outputs.
• Karnataka, Tamil Nadu Delhi, Telangana, Maharashtra, Uttar Pradesh and West Bengal are the most efficient states in the country with efficiency ratio above 1.

INNOVATION, CLUSTERS AND COMPETITIVENESS

INNO
VATIO
N, C
OM
PETIT
IVEN
ESS
AND
ECO
NOM
IC D
EVEL
OPM
ENT
CLUSTER BASED ECONOMIC DEVELOPMENT:PROCESS
CLUSTER IDENTIFICATION
CLUSTER ASSESSMENT
POLICY FORMULATION
Cluster mapping aims at creating a detailed record of all the existing clusters across all sectors in India.
A comprehensive evaluation of the clusters identified in Stage 1 is conducted.
The detailed assessment of clusters conducted in Stage 2 helps in designing effective cluster based strategies for economic development.

INNO
VATIO
N, C
OM
PETIT
IVEN
ESS
AND
ECO
NOM
IC D
EVEL
OPM
ENT
CLUSTER IDENTIFICATION
TYPES OF INDUSTRIES
Traded Industries
Copyright ©
Local Industries
• Traded industries are those that concentrate inparticular regions but sell products acrossregions and countries. (Delgado, Bryden, & Zyontz)
• Examples of traded industries include apparel, automotive, textiles etc.
• Local industries are dispersed throughout thenation. Their presence in a particular region isgenerally proportional to the region’s size asthey primarily serve the local market. (Delgado,Bryden, & Zyontz)
• Examples of local industries are real estateservices, hospitals, etc.
Traded Clusters are formed by grouping traded industries and likewise, the groups of local industries form local clusters.

INNO
VATIO
N, C
OM
PETIT
IVEN
ESS
AND
ECO
NOM
IC D
EVEL
OPM
ENT
CLUSTER ASSESSMENT
Cluster Assessment
Analysing Business
Environment
Identifying the productivity of
clusters
Ascertaining barriers to
growth
Recognising Export Oriented
Clusters, Emerging Clusters
Analysing the relationship
between clusters and economic development
Role of clusters

INNO
VATIO
N, C
OM
PETIT
IVEN
ESS
AND
ECO
NOM
IC D
EVEL
OPM
ENT
POLICY FORMULATION
ROLE OF GOVERNMENT
Attracting FDI Workforce Training and Skill Upgrading
Addressing Bottlenecks by Public-Private
CollaborationsInfrastructure Development Export Promotion
A successful cluster policy is based on overall economic policies.

INNO
VATIO
N, C
OM
PETIT
IVEN
ESS
AND
ECO
NOM
IC D
EVEL
OPM
ENT
CLUSTER PERFORMANCE

INNO
VATIO
N, C
OM
PETIT
IVEN
ESS
AND
ECO
NOM
IC D
EVEL
OPM
ENT
CLUSTER STRENGTH
• A clear geographical distinction is observed, with the Southern region having a stronger cluster profile than the rest of the country.
• 32 percent of the regions have less than 20 stars, implying the lack of strong clusters that can enhance competitiveness and increase prosperity in the region.

INNO
VATIO
N, C
OM
PETIT
IVEN
ESS
AND
ECO
NOM
IC D
EVEL
OPM
ENT
CLUSTER MAP
MAHARASHTRA• Video Production &
Distribution• Local Commercial Services• Furniture
GUJARAT• Non-Metal Mining• Jewelry and Precious
Metals• Upstream Chemical
Products
TAMIL NADU• Footwear• Information Technology• Textile Manufacturing
UTTAR PRADESH• Livestock Processing• Communication
Equipment & Services• Footwear

INNO
VATIO
N, C
OM
PETIT
IVEN
ESS
AND
ECO
NOM
IC D
EVEL
OPM
ENT
HOW CLUSTERS IMPACT COMPETITIVENESS
By increasing the current (static) productivity of constituent firms or industries
By increasing the capacity of cluster participants for innovation and productivity growth
By stimulating new business formation that supports innovation and expands the cluster

INNO
VATIO
N, C
OM
PETIT
IVEN
ESS
AND
ECO
NOM
IC D
EVEL
OPM
ENT
CLUSTERS AND COMPETITIVENESS
Andhra Pradesh
Assam
Bihar
Chhattisgarh
Delhi
Goa
Gujarat
Haryana
Himachal PradeshJammu & Kashmir
Jharkhand
Karnataka
Kerala
Madhya Pradesh
Maharashtra
Manipur MeghalayaNagaland
Odisha
Punjab
Rajasthan
Sikkim
Tamil Nadu
Tripura
Uttar Pradesh
UttarakhandWest Bengal
0
20
40
60
80
100
120
140
0 5 10 15 20 25 30 35
Clus
ter S
tren
gth
State Competitiveness Rank

INNO
VATIO
N, C
OM
PETIT
IVEN
ESS
AND
ECO
NOM
IC D
EVEL
OPM
ENT
CLUSTERS AND PRODUCTIVITY
The productivity within clusters is enhanced as:
• clusters provide highly specialized inputs at a low cost
• clusters lead to a reduction in the transaction cost
• clusters facilitate complementarities between activities of cluster members
• clusters provide easy access to information, thereby reducing if not eliminating the information asymmetries

INNO
VATIO
N, C
OM
PETIT
IVEN
ESS
AND
ECO
NOM
IC D
EVEL
OPM
ENT
CLUSTERS AND INNOVATION
Clusters contribute to innovation in the following ways:• by easier and faster access to new processes needed for innovation
• by proceeding faster with innovations due to the proximity of potential suppliers•• by making the availability of specialized professionals easy
• by identifying new technological, operating and delivery opportunities
• by direct observation of other firms
• by utilizing complementarities of local innovation partners
• by reducing transaction costs of innovation

INNO
VATIO
N, C
OM
PETIT
IVEN
ESS
AND
ECO
NOM
IC D
EVEL
OPM
ENT
CLUSTERS AND INNOVATION

INNO
VATIO
N, C
OM
PETIT
IVEN
ESS
AND
ECO
NOM
IC D
EVEL
OPM
ENT
CLUSTERS AND BUSINESS FORMATION
Clusters lead to new business formation as:
• they offer lower barriers to entry (and exit) as the cost of specialized inputs is lower compared to non-cluster areas
• they provide information about new business opportunities
• they provide environment rich in social capital

INNO
VATIO
N, C
OM
PETIT
IVEN
ESS
AND
ECO
NOM
IC D
EVEL
OPM
ENT
INNOVATION AND EMPLOYMENT
Karnataka
Maharashtra
Kerala West Bengal
Tamil NaduAndhra PradeshJharkhand
Uttar PradeshHaryana
Gujarat
RajasthanPunjab
y = 4E-05x + 26.817R² = 0.3286
0
20
40
60
80
100
120
140
160
180
200
0 500000 1000000 1500000 2000000 2500000
Pate
nts p
er 1
0000
0 Em
ploy
ees
Employment

INNO
VATIO
N, C
OM
PETIT
IVEN
ESS
AND
ECO
NOM
IC D
EVEL
OPM
ENT
INNOVATION AND COMPETITIVENESS

INNO
VATIO
N, C
OM
PETIT
IVEN
ESS
AND
ECO
NOM
IC D
EVEL
OPM
ENT
CITIES & INNOVATION
THE DRIVERS OF INNOVATION

INNO
VATIO
N, C
OM
PETIT
IVEN
ESS
AND
ECO
NOM
IC D
EVEL
OPM
ENT
INDIA’S URBANISATION
290 million2001
340 million2008
590 million
2030
DATA SOURCE: MCKINSEY REPORT

INNO
VATIO
N, C
OM
PETIT
IVEN
ESS
AND
ECO
NOM
IC D
EVEL
OPM
ENT
NSDP VS URBANISATION
APAR
AS
BR
CH
DL
GA*
GJ*
HR
HP
JKJH
KAKL*
MP
MH
MN
MLMZ*
NL
OR
PB
RJ*
SK
TN
TR
UP
UK
WB
y = 1731.3x + 19928R² = 0.5605
0
50000
100000
150000
200000
250000
0.00 20.00 40.00 60.00 80.00 100.00 120.00
NSD
P pe
r cap
ita (a
t 200
4-05
pric
es) i
n 20
10-1
1
% of People residing in Urban Areas in 2011
* depicts states with NSDP per capita in 2011-12 all other figures for 2012-13

INNO
VATIO
N, C
OM
PETIT
IVEN
ESS
AND
ECO
NOM
IC D
EVEL
OPM
ENT
CONTRIBUTION OF URBAN AREAS TO INDIAN ECONOMY
70 %
More than 70 percent of India’s GDP will be generated by urban areas by 2020
8.8 %
The real GDP growth rate of urban India is 8.8 compared to 4 % of rural India
DATA SOURCE: MCKINSEY REPORT

INNO
VATIO
N, C
OM
PETIT
IVEN
ESS
AND
ECO
NOM
IC D
EVEL
OPM
ENT
HOW CLUSTERS IMPACT COMPETITIVENESS OF CITIES
HyderabadVijayawadaVishakhapatnam
GuwahatiPatna
Raipur
Delhi
AhmedabadRajkotSuratVadodara
ChandigarhFaridabad GurgaonShimla
JammuSrinagar
DhanbadJamshedpurRanchi
BengaluruMysore
KochiKozhikodeThiruvananthapuram
BhopalIndoreJabalpur
MumbaiNagpurNashik Pune
Bhubaneswar
Amritsar Ludhiana
JaipurKota
ChennaiCoimbatoreMadurai
AgraAllahabadKanpurLucknowMeerut NoidaVaranasi
DehradunAsansol Kolkata
y = 1.5677x + 3.5079
0
20
40
60
80
100
120
140
0.00 10.00 20.00 30.00 40.00 50.00 60.00 70.00
Stat
e Cl
uste
r Str
engt
h
Competitiveness Score
The presence of clusters and thelinkages between them in a stateimpact the competitiveness of itscities. In India, most of the highlycompetitive cities belong to asmall group of industrializedstates (including Maharashtra,Tamil Nadu, Gujarat andKarnataka) while the leastcompetitive cities belong to lessindustrialized states likeJharkhand, Bihar, Chhattisgarh,Jammu and Kashmir, etc.
INNO
VATIO
N, C
OM
PETIT
IVEN
ESS
AND
ECO
NOM
IC D
EVEL
OPM
ENT
INDIAN START-UP ECOSYSTEM

INNO
VATIO
N, C
OM
PETIT
IVEN
ESS
AND
ECO
NOM
IC D
EVEL
OPM
ENT
GLOBAL DISTRIBUTION OF STARTUPS
© GeoNames, HERE, MSFT, Microsoft, NavInfo, Thinkware Extract, WikipediaPowered by Bing
US83,000+
Canada6,100+
UK7,900+
China10,000+
India10,000+

INNO
VATIO
N, C
OM
PETIT
IVEN
ESS
AND
ECO
NOM
IC D
EVEL
OPM
ENT
$ 2.2 Bn Revenue(2016)
Over 23.7 Mn Total transactions(2016)
80 % Revenue Growth Y-O-Y(2017)
7 Mn +Transactions a day(2017)
$ 1 Bn Valuation(2017)
4x increase in number of rides
Raised over $ 115 Mn Funding till date(2017)
100% + Revenue Growth Y-O-Y(2017)
Data Source: NASSCOM Start-Up Report 2017
SELECT INDIAN START-UPS

INNO
VATIO
N, C
OM
PETIT
IVEN
ESS
AND
ECO
NOM
IC D
EVEL
OPM
ENT
Stages of a start-up lifecycle
PRE-STARTUP
GROWTH
STARTUP
DiscoveryIdentify a potential scalable product/service idea for a big enough target market
ValidationThe service or product discovered hits the market, looking for the first clients ready to pay for it
EfficiencyThe entrepreneur begins to define his/her business model and looks for ways to increase customer base
ScalePushing the growth of the business aggressively while increasing its capacity to grow in a sustainable manner
MaintenanceMaximising benefits and facing problems derived from the global dimension that the business has achieved
Sale or RenewalThe decision to sell the startup to a giant or acquire huge resources that the brand will need to continue growing
START-UP LIFECYCLE

INNO
VATIO
N, C
OM
PETIT
IVEN
ESS
AND
ECO
NOM
IC D
EVEL
OPM
ENT
GROWTH OF START-UPS
Data Source: NASSCOM Start-Up Report 2017

INNO
VATIO
N, C
OM
PETIT
IVEN
ESS
AND
ECO
NOM
IC D
EVEL
OPM
ENT
REGIONAL ANALYSIS
DELHI25 percent of the total start-ups
BANGALORE27 percent of the total start-upsMUMBAI
16 percent of the total start-ups

INNO
VATIO
N, C
OM
PETIT
IVEN
ESS
AND
ECO
NOM
IC D
EVEL
OPM
ENT
CHALLENGES FACED BY STARTUPS
FUNDING
PRODUCT MANAGEMENT
MARKET ACCESS
GOVERNMENT POLICIES
TALENT
START-UP CHALLENGES

INNO
VATIO
N, C
OM
PETIT
IVEN
ESS
AND
ECO
NOM
IC D
EVEL
OPM
ENT
SHARE OF FAILED START-UPS
64
36
80
30
0
10
20
30
40
50
60
70
80
90
B2C B2B
2016 2017
B2B start-ups show higher stability with further fall in share of failed B2B Start-ups Data Source: NASSCOM Start-Up Report 2017

INNO
VATIO
N, C
OM
PETIT
IVEN
ESS
AND
ECO
NOM
IC D
EVEL
OPM
ENT
SOCIAL PROGRESS

INNO
VATIO
N, C
OM
PETIT
IVEN
ESS
AND
ECO
NOM
IC D
EVEL
OPM
ENT
A unique tool to complement GDP
§The Social Progress Index provides the first concrete framework to measuresocial progress independent of GDP.
§It is an actionable tool designed in a way to helpleaders, policymakers, civilsociety and businesses to make policy decisions and CSR investments.
§It provides a holisticmeasure of social progress that encompasses the many aspects of health of societies.
§The core principle of the index is to measure theoutcomes that matter to the people, and not the inputs.The dimensions are further disaggregated into actionable components to allow for a multifaceted view of
welfare. Components are designed to reflect different aspects that make up the dimension. At the most granular level we have the outcome indicators which are aggregated to form components.
WHAT IS SOCIAL PROGRESS INDEX?The Social Progress Index is a comprehensive framework designed to measure the wellbeing of individuals,assessed through social and environmental indicators conceived on the understanding that regardless of theeconomic achievements, a region can’t be termed as successful if it fails to provide for people’s most essentialneeds, protect its environment, deliver building blocks to enhance and sustain individual’s wellbeing or helpcommunities to grow.
It is the starting point of a strategy that seeks to improve the quality of lives of millions of people in India.
Social Progress Index measures the progress based on three dimensions.

INNO
VATIO
N, C
OM
PETIT
IVEN
ESS
AND
ECO
NOM
IC D
EVEL
OPM
ENT
SOCIAL PROGRESS: FRAMEWORK

INNO
VATIO
N, C
OM
PETIT
IVEN
ESS
AND
ECO
NOM
IC D
EVEL
OPM
ENT
SOCIAL PROGRESS: OVERALL SCORES
STATE LEVEL DISTRICT LEVEL

INNO
VATIO
N, C
OM
PETIT
IVEN
ESS
AND
ECO
NOM
IC D
EVEL
OPM
ENT
INNOVATION AND SOCIAL PROGRESS
ANDHRA PRADESH
ARUNACHAL PRADESH
ASSAM
BIHAR
CHHATTISGARH
DELHIGOA
GUJARAT HARYANA
HIMACHAL PRADESH
JAMMU & KASHMIR
JHARKHAND
KARNATAKA
KERALA
MADHYA PRADESH
MAHARASHTRA
MANIPUR
MEGHALAYA
MIZORAM
NAGALAND
ODISHA
PUNJAB
RAJASTHAN
SIKKIM
TAMIL NADU
TRIPURA
UTTAR PRADESH
UTTARAKHAND
WEST BENGAL
40
45
50
55
60
65
70
0 5 10 15 20 25 30 35 40 45 50
Soci
al P
rogr
ess
Innovation
INNO
VATIO
N, C
OM
PETIT
IVEN
ESS
AND
ECO
NOM
IC D
EVEL
OPM
ENT
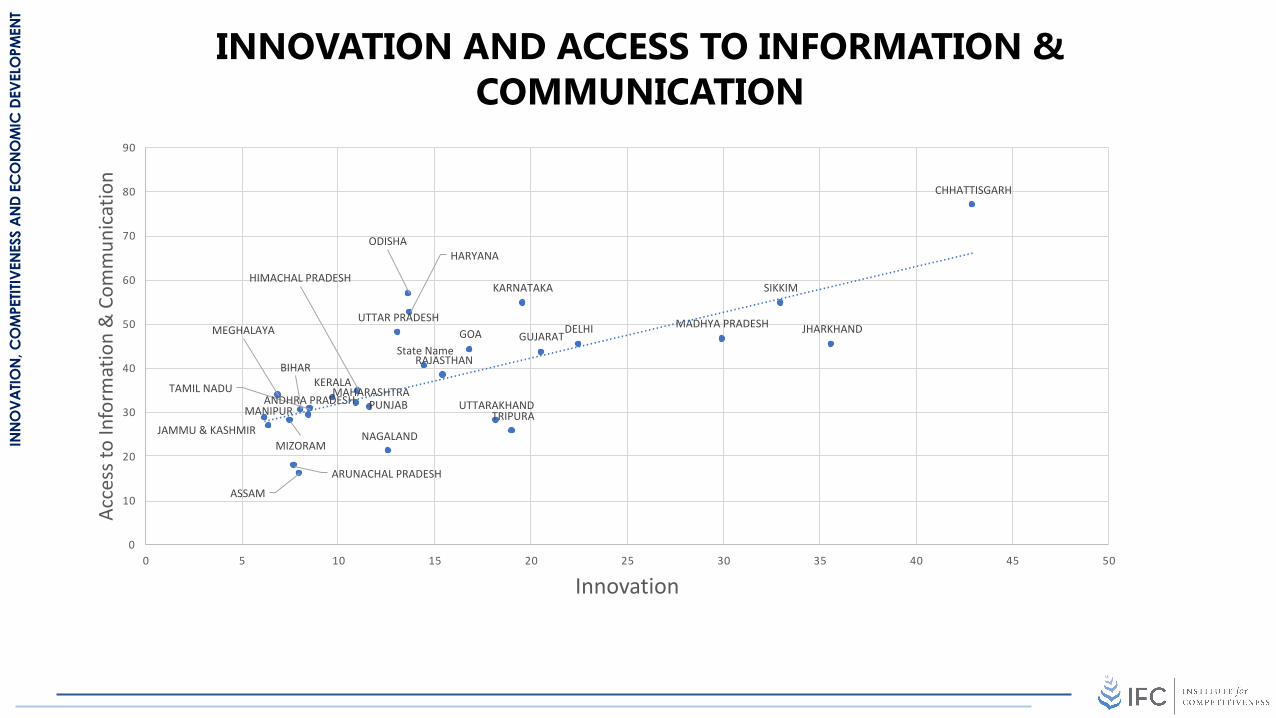
INNOVATION AND ACCESS TO INFORMATION & COMMUNICATION
State Name
ANDHRA PRADESH
ARUNACHAL PRADESH
ASSAM
BIHAR
CHHATTISGARH
DELHIGOA GUJARAT
HARYANA
HIMACHAL PRADESH
JAMMU & KASHMIR
JHARKHAND
KARNATAKA
KERALA
MADHYA PRADESH
MAHARASHTRAMANIPUR
MEGHALAYA
MIZORAMNAGALAND
ODISHA
PUNJAB
RAJASTHAN
SIKKIM
TAMIL NADU
TRIPURA
UTTAR PRADESH
UTTARAKHAND
0
10
20
30
40
50
60
70
80
90
0 5 10 15 20 25 30 35 40 45 50
Acce
ss to
Info
rmat
ion
& C
omm
unic
atio
n
Innovation

INNO
VATIO
N, C
OM
PETIT
IVEN
ESS
AND
ECO
NOM
IC D
EVEL
OPM
ENT
INNOVATION AND ACCESS TO ADVANCED EDUCATION
ANDHRA PRADESH
ARUNACHAL PRADESH
ASSAM
BIHAR
CHHATTISGARH
DELHI
GOA
GUJARAT
HARYANA
HIMACHAL PRADESH
JAMMU & KASHMIR
JHARKHAND
KARNATAKA
KERALA
MADHYA PRADESH
MAHARASHTRA
MANIPUR
MEGHALAYA
MIZORAMNAGALAND ODISHA
PUNJAB
RAJASTHANSIKKIM
TAMIL NADU
TRIPURA
UTTAR PRADESH
UTTARAKHAND
WEST BENGAL
0
10
20
30
40
50
60
70
0 5 10 15 20 25 30 35 40 45 50
Acce
ss to
Adv
ance
d Ed
ucat
ion
Innovation

INNO
VATIO
N, C
OM
PETIT
IVEN
ESS
AND
ECO
NOM
IC D
EVEL
OPM
ENT
SOCIAL PROGRESS: COUNTRY LEVEL PERFORMANCE
0
10
20
30
40
50
60
70
80
90So
cial
Pro
gres
s In
dex
Nut
ritio
n &
Bas
ic M
edic
al C
are
Wat
er &
San
itatio
n
Shel
ter
Pers
onal
Saf
ety
Acc
ess
to B
asic
Kno
wle
dge
Acc
ess
to In
form
atio
n &
Com
mun
icat
ion
Hea
lth &
Wel
lnes
s
Envi
ronm
enta
l Qua
lity
Pers
onal
Rig
hts
Pers
onal
Fre
edom
& C
hoic
e
Incl
usio
n
Adv
ance
d Ed
ucat
ion
Districts perform the beston knowledge, an areathat has been a focus ofMDGs, SDGs and theIndian government
India’s districts struggle with Advanced Education landscape and communication facilities.

INNO
VATIO
N, C
OM
PETIT
IVEN
ESS
AND
ECO
NOM
IC D
EVEL
OPM
ENT
SOCIAL PROGRESS: COMPONENT LEVEL PERFORMANCE
INNO
VATIO
N, C
OM
PETIT
IVEN
ESS
AND
ECO
NOM
IC D
EVEL
OPM
ENT
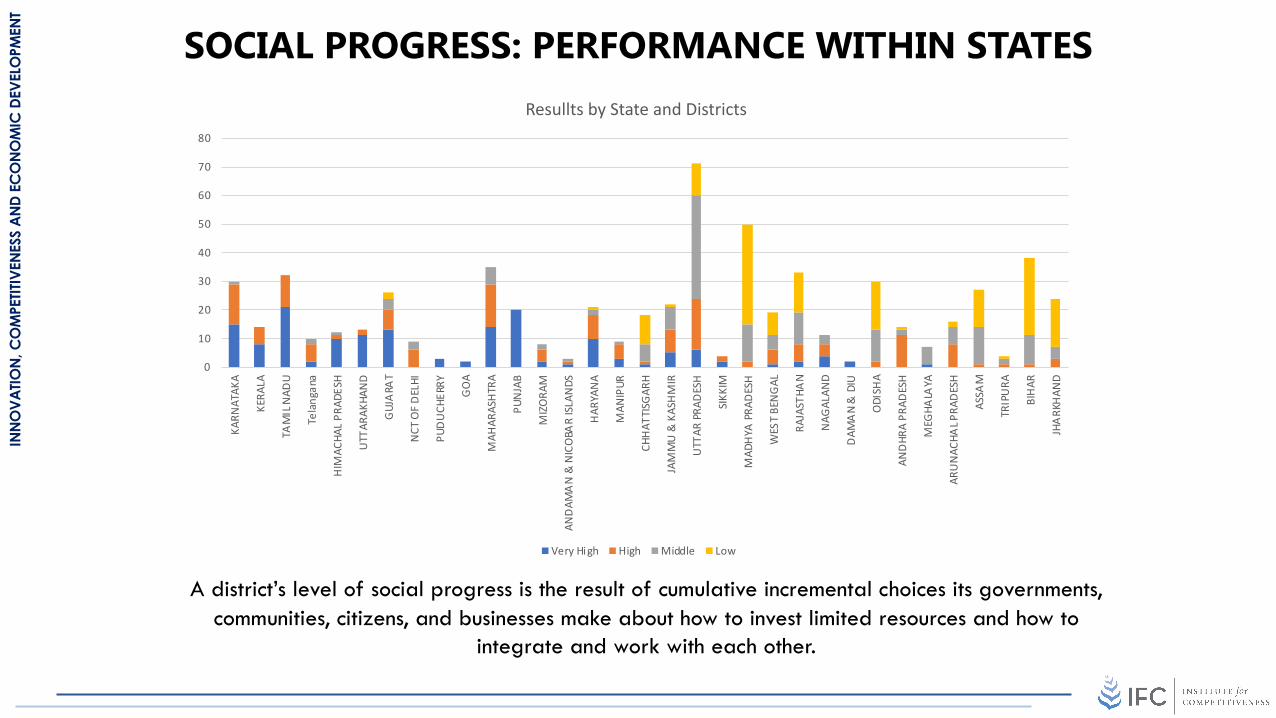
SOCIAL PROGRESS: PERFORMANCE WITHIN STATES
0
10
20
30
40
50
60
70
80
KARN
ATAK
A
KERA
LA
TAM
IL N
ADU
Tela
ngan
a
HIM
ACHA
L PR
ADES
H
UTT
ARAK
HAN
D
GUJ
ARA
T
NCT
OF
DEL
HI
PUD
UCH
ERRY
GO
A
MAH
ARAS
HTR
A
PUN
JAB
MIZ
ORA
M
AND
AMA
N &
NIC
OBA
R IS
LAN
DS
HAR
YAN
A
MAN
IPUR
CHH
ATTI
SGAR
H
JAM
MU
& K
ASH
MIR
UTT
AR P
RAD
ESH
SIKK
IM
MAD
HYA
PRA
DES
H
WES
T BE
NG
AL
RAJA
STHA
N
NAG
ALAN
D
DAM
AN
& D
IU
ODI
SHA
AND
HRA
PRAD
ESH
MEG
HALA
YA
ARU
NAC
HAL P
RAD
ESH
ASSA
M
TRIP
URA
BIH
AR
JHA
RKH
AND
Resullts by State and Districts
Very High High Middle Low
A district’s level of social progress is the result of cumulative incremental choices its governments, communities, citizens, and businesses make about how to invest limited resources and how to
integrate and work with each other.
INNO
VATIO
N, C
OM
PETIT
IVEN
ESS
AND
ECO
NOM
IC D
EVEL
OPM
ENT
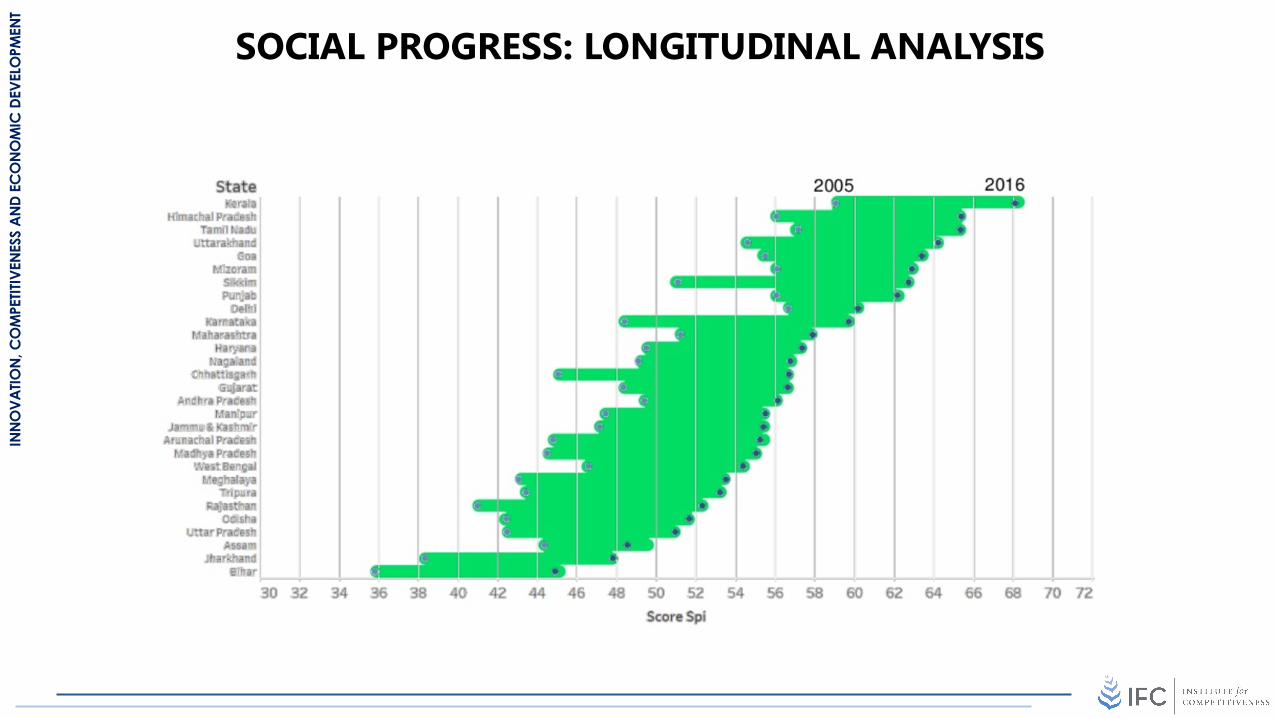
SOCIAL PROGRESS: LONGITUDINAL ANALYSIS

INNO
VATIO
N, C
OM
PETIT
IVEN
ESS
AND
ECO
NOM
IC D
EVEL
OPM
ENT

INNO
VATIO
N, C
OM
PETIT
IVEN
ESS
AND
ECO
NOM
IC D
EVEL
OPM
ENT
WHAT IF A COUNTRY LACKS A
ROBUST IP REGIME
Local rules and incentives that encourage productivity and investment are decreased :• Lower salaries due to low end work.• Lower capital investments as companies
want adequate standards.• Lesser incentive to innovate as knowledge
is not adequately protected.• Competition between companies becomes
more distorted as there is an absence of a level playing field.
• Companies reduce spending on R and D as they expect others to invest while they reap the benefits.
• IPR rules if they are not adequately present.• Distort incentives to share knowledge.• Adverse impact on innovation at the related
and supporting industry level.• It also results in a reduced network effect in
clusters as different firms in clusters are adamant about sharing their business knowhow.
Sophisticated and demanding local customers and needs .
• Strict quality, safety , and environmental standards are not met as IPR laws are weaker.
• Greater imports as companies are not able to meet sophisticated demand.
• Government procurement of advanced technology as no laws are in place.
Distortion in access to high quality business inputs especially in :-• Information• Scientific and Technological
infrastructure.• ‘Intellectual’ capital is not being
recognised.• In case of no protection this may
result in companies’ having no incentive to innovate.
Related, Supporting Industries And Institutions
Demand ConditionsFactor Conditions
Context for Firms Strategy And Rivalry
INNO
VATIO
N, C
OM
PETIT
IVEN
ESS
AND
ECO
NOM
IC D
EVEL
OPM
ENT
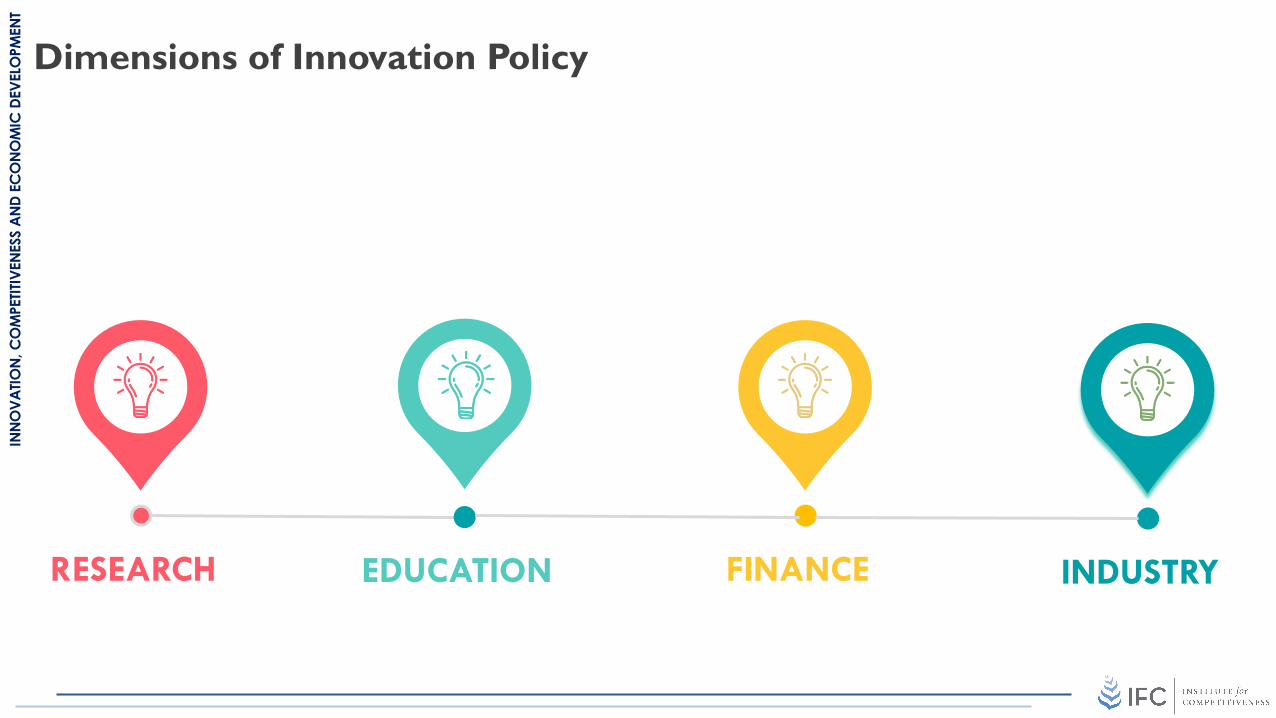
Dimensions of Innovation Policy
RESEARCH EDUCATION FINANCE INDUSTRY

INNO
VATIO
N, C
OM
PETIT
IVEN
ESS
AND
ECO
NOM
IC D
EVEL
OPM
ENT
Role of the Government
321ESTABLISH
INSTITUTIONS TO FACILITATE
RESEARCH AND
DEVELOPMENT
INCENTIVES TO SUPPORT
INNOVATORS
PROVIDE ENVIRONMENT TO SUPPORT INNOVATION BY REMOVING
OBSTACLES FACED BY
COMPANIES
4
INVEST IN CREATION OF KNOWLEDGE
WORKRS

INNO
VATIO
N, C
OM
PETIT
IVEN
ESS
AND
ECO
NOM
IC D
EVEL
OPM
ENT
RESEARCH & DEVELOPMENT EXPENDITURE
1ESTABLISH
INSTITUTIONS TO FACILITATE
RESEARCH AND
DEVELOPMENT

INNO
VATIO
N, C
OM
PETIT
IVEN
ESS
AND
ECO
NOM
IC D
EVEL
OPM
ENT
GERD
1ESTABLISH
INSTITUTIONS TO FACILITATE
RESEARCH AND
DEVELOPMENT

INNO
VATIO
N, C
OM
PETIT
IVEN
ESS
AND
ECO
NOM
IC D
EVEL
OPM
ENT
Business Environment
2
INCENTIVES TO SUPPORT
INNOVATORS
INNO
VATIO
N, C
OM
PETIT
IVEN
ESS
AND
ECO
NOM
IC D
EVEL
OPM
ENT
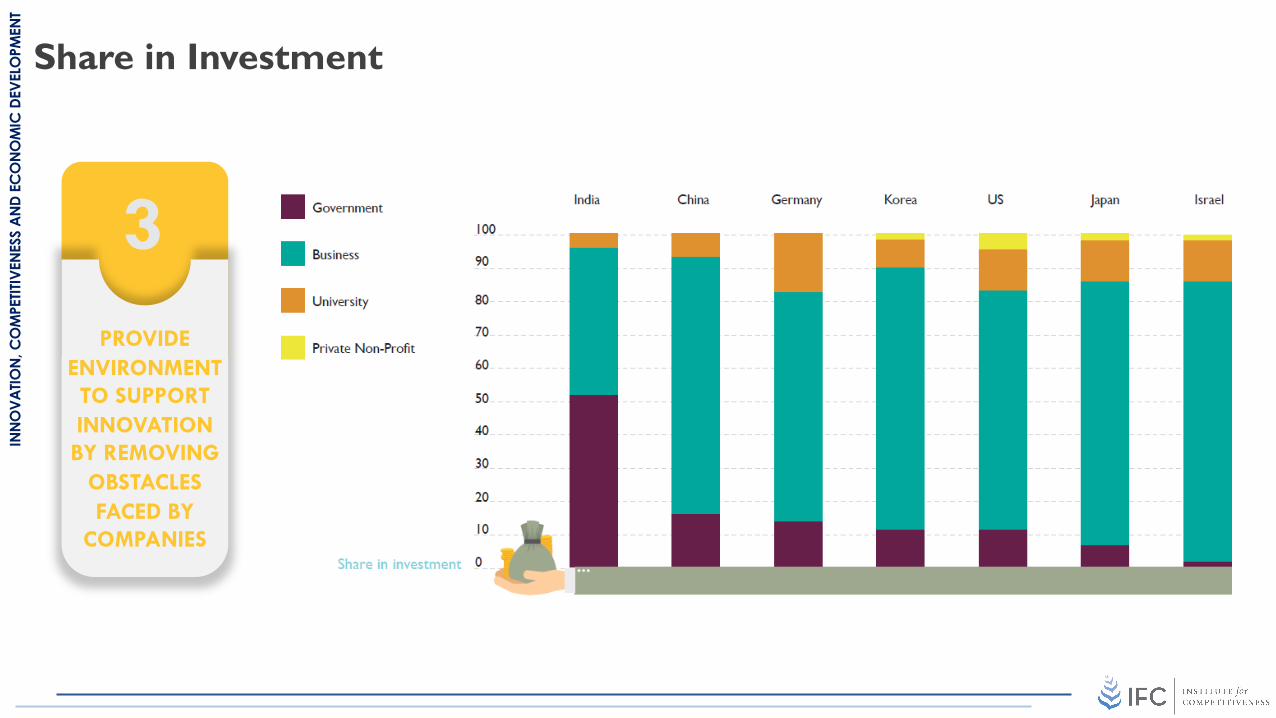
Share in Investment
3PROVIDE
ENVIRONMENT TO SUPPORT INNOVATION BY REMOVING
OBSTACLES FACED BY
COMPANIES

INNO
VATIO
N, C
OM
PETIT
IVEN
ESS
AND
ECO
NOM
IC D
EVEL
OPM
ENT
Regulatory Environment
3PROVIDE
ENVIRONMENT TO SUPPORT INNOVATION BY REMOVING
OBSTACLES FACED BY
COMPANIES

INNO
VATIO
N, C
OM
PETIT
IVEN
ESS
AND
ECO
NOM
IC D
EVEL
OPM
ENT
4
INVEST IN CREATION OF KNOWLEDGE
WORKERS

Institute for CompetitivenessU 24 / 8
DLF Phase 3Gurgaon 122 002
Haryana, IndiaPhone: +91 124 437 6676
www.competitiveness.in