inland empire utilities agency (ieua) recycled water …€¦ · · 2010-01-12inland empire...
TRANSCRIPT

Inland Empire Utilities Agency (IEUA)
Recycled Water Program
Martha Davis, IEUAMarch 4, 2009
State Water Board, California Public Utilities Commission and the Water Energy Climate Action Team
Climate Change Scoping Plan Implementation WorkshopMeasure W-2 Water Recycling

Inland Empire Utilities Agency (IEUA)
IEUA Profile
� “Wholesale” Water and Wastewater Utility in Southern California serving
242 square miles of the Chino Basin in the western portion of San
Bernardino County (308 employees)
� Regional wastewater service provider and distributor of wholesale
water and recycled water
� Chino Groundwater Basin (one of the largest in So. Calif.)
� 3 Products: Recycled Water, Compost and Renewable Energy
� Member of Metropolitan Water District of Southern California
� High urban growth – Inland Empire one of the most rapidly
growing regions in the U.S.
� Conversion of agricultural lands to urban use will increase municipal and
industrial demands for water

Tidal Wave of Water Challenges
Climate change
AB 32 Green
Building Codes
Rising Energy Costs
GHG reductions through water management
No Delta Fix
Drought
Decreased water reliability
Flooding
Delta PumpingRestrictions
Water qualityregulations
Water Bond?
Increasing costs
Less Snow –More Rain
Economic Recession
20x2020DWR/SWRCB
Budget Crisis
Water Agencies Are in a Pivotal Position to
Implement GHG Mitigation Strategies
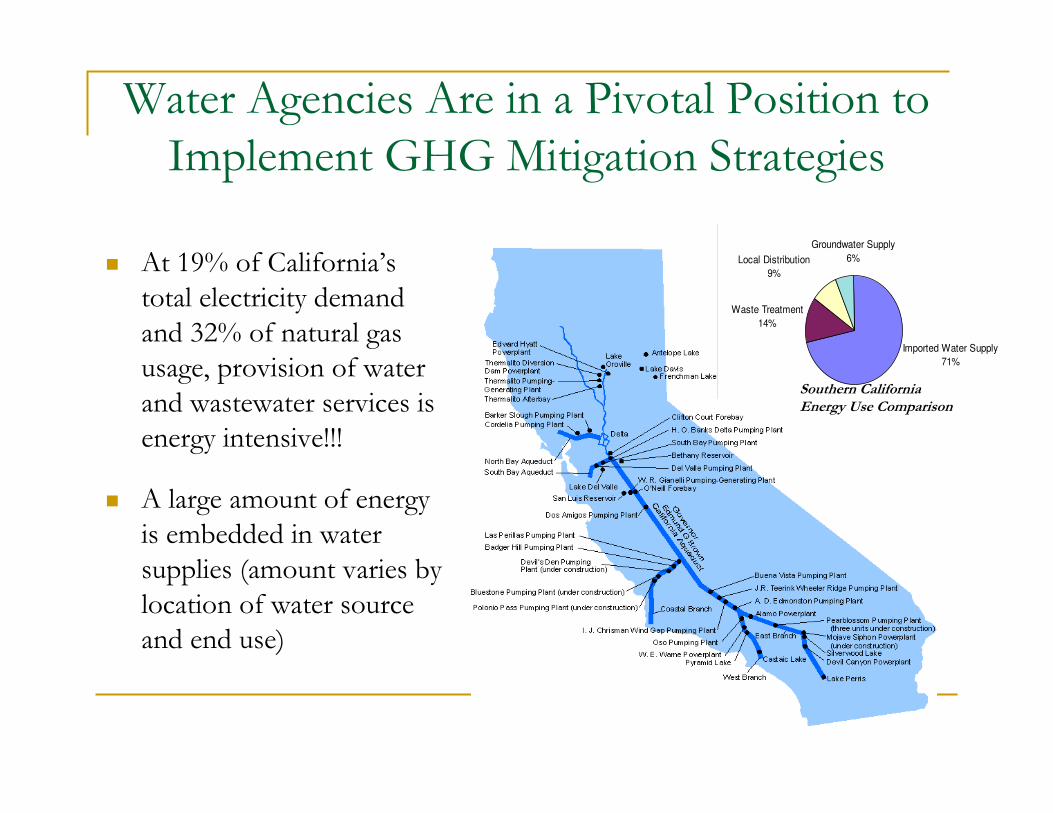
� At 19% of California’s
total electricity demand
and 32% of natural gas usage, provision of water
and wastewater services is
energy intensive!!!
� A large amount of energy
is embedded in water
supplies (amount varies by
location of water source and end use)
Local Distribution
9%
Groundwater Supply
6%
Imported Water Supply
71%
Waste Treatment
14%
Southern California
Energy Use Comparison

Based on the “energy intensity” of the water supplies used within IEUA’s service area, the amount of
energy needed to provide water to meet our area’s needs today is about 347,000 MWh
400
9501,050
1,700
2,000
2,500
3,200
4,400
-
500
1,000
1,500
2,000
2,500
3,000
3,500
4,000
4,500
KW
H/A
F
Recycling Groundwater
Pumping
Ion Exchange Chino
Desalter
Colorado
River
Aqueduct
West Branch
State Project
Water
East Branch
State Project
Water
Ocean
Desalter
Energy Use by Source

2000 Profound Shift in
Chino Basin Water Supply Strategy
Meet future water needs
through increased local water
development, minimize need
for imported water
� Recycled Water
� Enhanced Groundwater Recharge
� Desalters
� Dry Year Yield/Conjunctive Management
� Water Efficiency
� First pipeline constructed in 1995, with deliveries to El Prado Park and Golf Course in Chino and Ontario
� In the late 1990’s, IEUA began to implement groundwater recharge with recycled water at Ely Basin
� In 2002, IEUA completed the Recycled Water Feasibility Study
� In 2005, IEUA completed the Recycled Water Implementation Plan to prioritize the installation process of the regional recycle water distribution system
� In December 2007, IEUA adopted the aggressive Three Year Business Plan to increase the use of recycled water within the Agency’s service area
Recycle Water Program Background

Recycle Water Status Map

Recycle Water Deliveries
*Recycled Water Delivery Jul 08 – Dec 08: 9,648 AF

Recycled Water Connected Demand

Three Year Business Plan Goals:Three Year Business Plan Goals:
� 50,000 AFY Connected Demand by June 2012 (originally targeted for June 2010).
� Total future recycled water: 100,000 AFY
� Recycled Water Program to be ultimately self-funded through sales and MWD local project rebates.
� Total construction estimated at $250 million
Recycled Water Goals

Recycled Water Funding

Water/Energy Assets of the Chino Basin
� Groundwater� Continue to expand groundwater “conjunctive use” storage with MWD
� Recycled Water� Over 100,000 Acre-feet of water available for reuse----25-30 percent of all
water use in Chino Basin
� Storm Water Capture� Region now loses over 40,000 acre-feet per year on average of water that
historically recharged the Chino Groundwater Basin
� Opportunities for Water/Energy Efficiency� Water conservation and improvements in water use efficiency
Local supplies and conservation save an equivalent Local supplies and conservation save an equivalent of over 50 MW of generating capacityof over 50 MW of generating capacity

Example Of “Lost” Water-Energy Nexus
� Hard surfacing and flood control have changed the storm water runoff pattern within the Chino Basin
� Over 40,000 acre-feet per year on average is lost that historically recharged the groundwater basin
� Imported water supplies have been purchased, in part, to replace lost stormwater
� What is the energy value of the lost storm water supply? On average: 2250 kWh per acre-foot
Figure 2-6 Storm Water Discharge Time History for the Santa Ana River Below Prado Dam
0
50,000
100,000
150,000
200,000
250,000
300,000
350,000
400,000
450,000
500,000
1920
1921
1922
1923
1924
1925
1926
1927
1928
1929
1930
1931
1932
1933
1934
1935
1936
1937
1938
1939
1940
1941
1942
1943
1944
1945
1946
1947
1948
1949
1950
1951
1952
1953
1954
1955
1956
1957
1958
1959
1960
1961
1962
1963
1964
1965
1966
1967
1970
1971
1972
1973
1974
1975
1976
1977
1978
1979
1980
1981
1982
1983
1984
1985
1986
1987
1988
1989
1990
1991
1992
1993
1994
1995
1996
1997
1998
1999
An
nual S
torm
Wate
r D
isch
arg
e (
acre
-ft/yr)
-30
-20
-10
0
10
20
30
40
50
60
70
Cu
mu
lati
ve D
ep
art
ure
fro
m M
ean P
recip
itatio
n (in
/yr)
Annual Storm Water Discharge
Cum Dep from Mean Precip

Key Water/Energy Strategies
� Maximize local supply development to increase locally controlled “drought proof” supplies and balance less reliable, more costly imported supplies
� Implement “green” development standards for new housing in the most rapidly growing region in California
� Develop Santa Ana River Watershed “comprehensive”water quality/supply management strategies
� Maximize integration of water supply investments to reduce CO2 “Footprint” under AB 32

IEUA Innovations to Address Energy Needs
Constructed the nation’s first
platinum LEED-rated
headquarters by a public agency (2003). With
installation of cogeneration
in 2009, it will become a Zero Energy facility.
Constructed the nation’s first and largest centralized anaerobic
digester to convert dairy manure and
food waste to methane gas (2003). With planned expansions, it will
generate 3 MW.

IEUA’s Expanding Energy Project Portfolio� Of current energy needs of 11 MW, IEUA is self-generating about 7 MW –
recognized in July 2006 by the U.S. Environmental Protection Agency as one of the nation’s top ten local government “purchasers” of renewable energy from its own facilities
� Core Projects:� “Cow Power” Anaerobic Digester Program: 3 MW by 2009 (Partners include California
Energy Commission, USDA Natural Resources Conservation Service and the Milk Producers Council)
� Solar Power 3.5 MW installed in 2008� Renewable Energy Efficiency Project: achieve minimum 65% generation efficiency by
combining innovative processes including a Stirling Engine, Organic Rankine Cycle Unit, thermal energy storage and a fuel cell (Partners included the U.S. Department of Energy)
� Biogas Innovation Program� Three-Phase Thermophilic Digestion
� Food Waste Additions
� Flared Biogas Recovery (fuel cells)
� Gassifier with or without production of liquefied biofuel

Conclusions
� There are significant opportunities for wastewater and water agencies to save energy, self-generate and reduce the need for additional electricity from thestate’s electric grid and thereby reduce significantly GHG emissions
� Key strategies include:
� Increase on-site energy production
� Biogas, solar, wind, hydro recovery, combined heat and power systems
� Reduce water-related energy end-use
� Energy efficiency design standards, partnering with electric and gas utilities to increase efficiency of operations
� Increase drought benefits from local groundwater storage
� RAND report on Global Climate Change
� Save Energy by saving water
� Reduce dependence on imported water supplies
� Integrate water and energy conservation programs

For more information …
Contact:
Martha Davis
Inland Empire Utilities Agency
6075 Kimball Avenue
Chino, CA 91710
Direct Line: (909) 993-1742
E-Mail: [email protected]
20