injection-locked composite lasers for mm-wave …...3 sand2010-6338 unlimited release printed...
TRANSCRIPT

SANDIA REPORT SAND2010-6338 Unlimited Release Printed September 2010
Injection-Locked Composite Lasers for mm-Wave Modulation: LDRD 117819 Final Report
Anna Tauke-Pedretti, G. Allen Vawter, Weng Chow, Erik Skogen, Mark Overberg, Gregory Peake, Joel Wendt, James Raring, Charles Alford, David Torres, Florante Cajas
Prepared by Sandia National Laboratories Albuquerque, New Mexico 87185 and Livermore, California 94550
Sandia National Laboratories is a multi-program laboratory managed and operated by Sandia Corporation, a wholly owned subsidiary of Lockheed Martin Corporation, for the U.S. Department of Energy's National Nuclear Security Administration under contract DE-AC04-94AL85000. Approved for public release; further dissemination unlimited.

2
Issued by Sandia National Laboratories, operated for the United States Department of Energy
by Sandia Corporation.
NOTICE: This report was prepared as an account of work sponsored by an agency of the
United States Government. Neither the United States Government, nor any agency thereof,
nor any of their employees, nor any of their contractors, subcontractors, or their employees,
make any warranty, express or implied, or assume any legal liability or responsibility for the
accuracy, completeness, or usefulness of any information, apparatus, product, or process
disclosed, or represent that its use would not infringe privately owned rights. Reference herein
to any specific commercial product, process, or service by trade name, trademark,
manufacturer, or otherwise, does not necessarily constitute or imply its endorsement,
recommendation, or favoring by the United States Government, any agency thereof, or any of
their contractors or subcontractors. The views and opinions expressed herein do not
necessarily state or reflect those of the United States Government, any agency thereof, or any
of their contractors.
Printed in the United States of America. This report has been reproduced directly from the best
available copy.
Available to DOE and DOE contractors from
U.S. Department of Energy
Office of Scientific and Technical Information
P.O. Box 62
Oak Ridge, TN 37831
Telephone: (865) 576-8401
Facsimile: (865) 576-5728
E-Mail: [email protected]
Online ordering: http://www.osti.gov/bridge
Available to the public from
U.S. Department of Commerce
National Technical Information Service
5285 Port Royal Rd.
Springfield, VA 22161
Telephone: (800) 553-6847
Facsimile: (703) 605-6900
E-Mail: [email protected]
Online order: http://www.ntis.gov/help/ordermethods.asp?loc=7-4-0#online

3
SAND2010-6338
Unlimited Release
Printed September 2010
Injection-Locked Composite Lasers for mm-Wave Modulation:
LDRD 117819 Final Report
Anna Tauke-Pedretti, G. Allen Vawter, Erik Skogen, Mark Overberg, Gregory Peake,
James Raring*
RF/Optoelectronics Department
Weng Chow
Semiconductor Material and Device Sciences Department
Joel Wendt
Photonic Microsystems Technologies Department
Sandia National Laboratories
P.O. Box 5800
Albuquerque, New Mexico 87185-MS1085
Charles Alford
Sandia Staffing Alliance, LLC
Albuquerque, New Mexico 87185
David Torres, Florante Cajas
LMATA Government Services, LLC
Albuquerque, New Mexico 87185
*J. Raring left Sandia employment in January 2008
Abstract
This report summarizes a 3-year LDRD program at Sandia National Laboratories
exploring mutual injection locking of composite-cavity lasers for enhanced
modulation responses. The program focused on developing a fundamental
understanding of the frequency enhancement previously demonstrated for optically
injection locked lasers. This was then applied to the development of a theoretical
description of strongly coupled laser microsystems. This understanding was
validated experimentally with a novel “photonic lab bench on a chip”.

4
ACKNOWLEDGMENTS
The authors would like to acknowledge Zhenshan Yang of Sandia National Laboratories for
helpful technical discussions.

5
CONTENTS
1. Introduction ................................................................................................................................ 9
2. Theoretical work ....................................................................................................................... 10 2.1 Description of Model ........................................................................................................ 10 2.2 Results of Models ............................................................................................................. 11
2.3 Summary ........................................................................................................................... 13
3. Experimental Work ................................................................................................................... 14 3.1 Device Fabrication ............................................................................................................ 14 3.2 Coupled-Cavity Mutually Injection-Locked Lasers ......................................................... 15
3.2.1 External Injection Measurements ........................................................................ 16
3.2.2 Coupled-Cavity Mutual Injection Locking Measurements ................................. 16
3.2.3 Coupled-Cavity DBR Summary .......................................................................... 19
3.3 Mutually Injection-Locked Lasers Integrated with an EAM ............................................ 19 3.3.1 Design .................................................................................................................. 19
3.3.2 71% Mirror Reflectivity Design .......................................................................... 20 3.3.3 55% Mirror Reflectivity Design .......................................................................... 22
3.3.4 Summary of Mutually Injection Locked PICs with EAMs ................................. 24
4. Conclusions .............................................................................................................................. 25
4. References ................................................................................................................................ 26
Distribution ................................................................................................................................... 27
FIGURES
Figure 1: a) large lab bench set-up for injection locking and b) photonic microsystem version. ... 9
Figure 2: Coupled-laser configuration used in modeling isolator-free injectionlocking. Also
plotted are examples of passive-cavity eigenfunctions with frequencies indicated in the spectra
showing passive cavity resonances inside Laser 1 (lower spectrum) and Laser 2 (upper
spectrum). The points are actual solutions and the curves are extrapolated for the limit L, L’→∞
and
12
, )(res
res
Z
Z
mresm zudz
. .......................................................................................................... 10 Figure 3: Modulation response vs. modulation frequency for 15GHz detuning, R1=0.99,
R2=0.92 and R3=0.90 (solid curve), 30GHz detuning, R1=0.99, R2=0.82 and R3=0.90 (dashed
curve) and single laser (dotted curve). .......................................................................................... 12 Figure 4 : Optical micrograph of the coupled cavity PIC during testing. ..................................... 15 Figure 5 : Optical micrograph of the coupled cavity PIC die. ...................................................... 15 Figure 6: Slave laser under external injection for injected powers of 0.91 mW, 1.14 mW,
1.44 mW, 1.79 mW, 2.26 mW, and 2.84 mW. Master laser gain section is reverse biased.
(Igain=31 mA, Iphase = Ifront mirror = Irear mirror = 0 mA, λinjected = 1556.36 nm) .................................... 16 Figure 7: Spectra of the coupled cavity device for varying master laser gain currents. (Islave gain =
31 mA, Islave phase = 9.8 mA, Islave front mirror=1 mA, Ishared mirror=Imaster phase=Imaster rear mirror=0 mA) .... 17
6
Figure 8: Small signal frequency response of the coupled cavity device for varying master laser
gain currents. (Islave gain = 31 mA, Islave phase = 9.8 mA, Islave front mirror=1 mA, Ishared mirror=Imaster
phase=Imaster rear mirror=0 mA) ............................................................................................................. 18 Figure 9: Small signal frequency response of the coupled cavity device for phase section currents
of 14 mA, 10 mA, 9 mA, 8 mA, 7 mA, and 6 mA.. (Islave gain = 31 mA, Imaster gain = 55 mA,
Islave phase = 9.8 mA, Islave front mirror=1 mA, Ishared mirror=Imaster phase=Imaster rear mirror=0 mA)................. 18 Figure 10: Optical micrograph of the PIC consisting of (from left to right) the master DBR laser,
EAM, slave DBR laser and output waveguide. ............................................................................ 19 Figure 11: SMSR vs. slave laser gain current for varying master laser gain currents. (VEAM = -
1.5 V). ........................................................................................................................................... 20 Figure 12: The small-signal frequency response of the coupled cavity device for varying master
laser gain current (Islave gain = 31 mA, VEAM = -2V) and of the laser-EAM (VEAM = -2V). ........... 21 Figure 13: Small signal frequency response of the coupled cavity device for varying slave laser
gain current. (Imaster gain = 70 mA, VEAM = -2V) ............................................................................. 22 Figure 14: Optical spectrum of the PIC. (Igain-slave = 35 mA, Igain-master = 72 mA, VEAM = -1.5 V). 23
Figure 15: Small signal frequency response of the PIC (Igain-slave = 35 mA, Igain-master = 72 mA,
VEAM = -1.5 V), slave laser (Igain-slave = 35 mA), and DBR-EAM (VEAM = -1.5 V). ..................... 24

7
Nomenclature
DOE Department of Energy
SNL Sandia National Laboratories
PIC Photonic Integrated Circuit
EAM Electro-absorption Modulator
DBR Distributed Bragg Reflector
MOCVD Metal-Organic Chemical Vapor Deposition
OSA Optical Spectrum Analyzer
OIL Optical Injection Locking

8

9
1. INTRODUCTION
The bandwidth of directly modulated lasers is largely defined by the relaxation resonance
frequency which is intimately tied to the photon density in the gain region. However, optical
injection locking (OIL) has been used extensively in directly modulated lasers to increase the
relaxation resonance frequency, reduce nonlinear distortions and reduce chirp [1]. OIL
overcomes the dependence of relaxation resonance frequency position on gain section bias
current, allowing resonance frequencies as high as 50 GHz [1]. Basically, injecting a laser with a
frequency detuned from that laser’s optimal frequency enhances the modulation response by
roughly the difference of the two frequencies. However, these tabletop experiments were done
with multiple discrete devices requiring circulators and isolators, which prevent practical
implementation of high performance microsystems. Monolithic integration of the two injection
locked lasers has the benefits of reduced coupling losses, increased mechanical robustness,
smaller form factor and the compatibility of integration with other elements for the creation of
highly functional photonic integrated circuits. Additionally, the fundamental understanding of
this frequency enhancement is not well developed. Therefore, in this program we have focused
on developing the theoretical basis of injection locking of strongly-coupled laser cavities so as to
enable development of high-performance microsystems which exploit injection locking.
We have developed a new theoretical and practical understanding of strongly coupled laser
microsystems using combined theoretical work and a novel “photonic lab bench on a chip”.
Shrinking the lab bench onto a photonic integrated circuit (PIC) (Figure 1) required that two
primary obstacles be addressed, removal of the optical isolator and reduction of the time scale of
interactions to only a few picoseconds. Accordingly, we developed new theories for frequency-
and time- dependent coupled laser systems on the scale of a photonic integrated circuit. We then
verified this theory by building a photonic-lab-bench-on-a-chip which microscopically
reproduces the laser characteristics and laser-to-laser coupling in order to observe regimes of
stable, chaotic, and frequency-enhanced resonant oscillations.
Figure 1: a) large lab bench set-up for injection locking and b) photonic microsystem version.

10
2. THEORETICAL WORK
This section describes the theoretical work to develop a greater understanding of the bandwidth
enhancement in injection locked lasers and the looks at the application of this theory to coupled-
cavity devices compatible with integration. The model used in the simulations will be described
and the results of these simulations will be presented.
2.1 Description of Model
The models were based on a coupled-cavity device consisting of two laser cavities with DBR
mirrors and sharing a central mirror. In a coupled-cavity device, the need to treat the two lasers
on equal footing significantly complicates theoretical description. Numerical simulations are also
more involved because of a drastic increase in the parameter space controlling dynamical
behavior. Therefore, we had to develop an approach for analyzing the consequences of removing
the optical isolation between master and slave lasers. Central to the study and new to
semiconductor laser modeling is the treatment of the optically-coupled lasers and free space as a
combined system. This composite resonator treatment provides a description that is valid for
arbitrary coupling (i.e., from complete isolation to totally coupled). Furthermore, it circumvents
the long-standing inconsistency involving decoupling the calculations of cavity normal modes
and outcoupling losses, which turns out to be important in our problem.
Figure 2: Coupled-laser configuration used in modeling isolator-free injectionlocking. Also plotted are examples of passive-cavity eigenfunctions with frequencies indicated in the spectra showing passive
cavity resonances inside Laser 1 (lower spectrum) and Laser 2 (upper spectrum). The points are actual
solutions and the curves are extrapolated for the limit L, L’→∞ and
12
, )(res
res
Z
Z
mresm zudz
.

11
Since transverse effects are not expected to contribute to the enhancement phenomenon, we
consider a 1-dimensional geometry, with the arrangement of the different components of the
experimental setup described via the permittivity ε(z), where z is displacement along the laser
axis. In principle, one should solve Maxwell’s equations using the precise ε(z) describing the
spatial variations in permittivity from the different material layers making up the DBRs, quantum
wells, spacer layers and waveguides. In practice, such a detailed description is unnecessary and
our investigation revealed that dynamical response enhancement depends primarily on the
linewidths of the resonators, in addition to detuning and coupling between resonators. Based on
this finding, we choose the baseline configuration shown in Figure 2 (right). The DBR sections
are replaced by equivalent, infinitely-thin partially-reflecting mirrors that are described by
dielectric 'bumps' in the permittivity. Detuning between resonators is determined by difference in
round-trip optical path lengths, and cavity lifetimes are determined by the reflectivities of end
and shared mirrors, where the latter also controls the optical coupling between resonators. The
entire coupled-laser device is embedded in the middle of a very large cavity, approximating free
space.[2] End results are extrapolated by taking the limit of an infinitely long large cavity.
Writing the laser field as a linear superposition of the eigenmodes of the composite-
resonator/free-space system, we derived the following equations of motion for the complex mode
amplitudes and carrier densities in both lasers:
where
Jres and γres are the injection current density and distributed optical loss in resonator res, εb is the
background permittivity inside the lasers, ω is the approximate lasing frequency and γ is an
effective carrier loss rate from spontaneous emission and nonradiative recombination. In deriving
the equations, we use the rate equation and quasi-equilibrium approximations. Furthermore, we
assume a linear carrier density N(z) dependence of material (local) gain and carrier-induced
refractive index, g(z)+ikδn(z)=(1-iα)A[N(z)-Ntr], where α is the linewidth enhancement factor, A
is the gain coefficient and Ntr is the transparency carrier density. In the limit of operation in a
closed, Fabry-Perot resonator, the above equations reduce exactly to the widely-used single-laser
rate equations with Γmn,res→Γδm,n, where Γ is the mode confinement factor.
2.2 Results of Models
When attempting to minimize the effects of removing the optical isolator, we search for coupled-
laser configurations where the individual lasers exhibit some resemblances of master and slave
laser behaviors. Figure 2 (left) shows the passive-cavity resonances in each laser for such a
configuration. To produce the desired effect, the resonator optical path lengths are adjusted to
give 15-GHz detuning between resonances and the mirror reflectivites are chosen as R1 = 99%,

12
R2 = 92%, and R3 = 90%. One may reasonably identify Laser 1 as the master laser, based on
noting that in the bottom spectra, one of the resonances is a strong narrow peak, resembling a
master-laser resonance, and the other is a smaller, broader peak, that may be interpreted as
feedback from the slave laser. The top spectra depict a distinctly different situation, with two
resonances of roughly equal amplitudes, suggesting a slave laser under strong injection
condition. Here, the broad peak is the free-running slave-laser resonance and the narrow peak
may be attributed to injection from the master. Comparison of top and bottom spectra shows
nonreciprocity in the coupling mirror effective transmission. This asymmetry, achieved without
optical isolation, is from resonator linewidth disparity. A second configuration is also model
were detuning between resonances is increased to 30 GHz. We kept the end mirror reflectivities
at R1 = 99%, and R3 = 90% and decrease the coupling mirror reflectivity to R2 = 82% to
compensate the reduction in coupling because of increase detuning.
The next step is to explore modulation response enhancement in the above coupled-laser
configurations. We apply a 20% sinusoidal modulation to J2, while operating both lasers above
their lasing thresholds. Equations in Section 2.1 are solved numerically for the complex field
amplitudes of over 300 eigenmodes describing the combined free-space and composite-resonator
system. In the simulations, we use αabs(µ0εb)-1/2
= 1011
s-1
in free space and 4x10¹¹
s-1
inside the
lasers, γ = 109 s
-1, α = 2, A = 2 x 10
-16 cm
2, Ntr = 10
18 cm
-3 and lasing wavelength is assumed to
be around 1.5 µm. To obtain the modulation response for a given modulation frequency, the time
evolution of the total laser field is obtained at each time step. A Fourier transform of the absolute
square of the total field over a time interval long compared to the modulation period is then
performed to obtain the intensity spectrum. The procedure is repeated until convergence is
reached. We define as the modulation response MR = (B+B’)/(2A), where B and B’ are the
spectral amplitudes at ±Ω, Ω is the modulation frequency, and A is the dc (unmodulated)
amplitude.
Figure 3: Modulation response vs. modulation frequency for 15GHz detuning, R1=0.99, R2=0.92 and
R3=0.90 (solid curve), 30GHz detuning, R1=0.99, R2=0.82 and R3=0.90 (dashed curve) and single laser (dotted curve).
Figure 3 shows examples of results from numerical simulations using the above theory. They
illustrate the appreciable sensitivity of modulation response to experimental configuration. We
selected coupled-laser configurations where the individual lasers exhibit some resemblances of

13
master and slave laser behaviors. The curves are obtained by modulating the current to one laser,
while operating both lasers above their lasing thresholds. The simulations trace the enhancement
of modulation response to the system’s ability to generate and support additional frequencies
because of spatial hole burning and dynamical bifurcations involving period doubling and
perhaps chaos. With spatial hole burning, the fundamental and sideband fields extract gain from
different lasers, thus resulting in greater growth of modulation-generated sidebands because of
decreased gain competition. Additional frequencies are generated by bifurcations occurring
outside the locked region, e.g., period doubling arising from the interaction between nonlinear
gain medium and composite-cavity eigenmodes.
2.3 Summary In summary, coupled-cavity device configurations are found where the results achieved with
conventional injection-locked lasers are reproduced. However, eliminating the optical isolator
increases significantly the complexity of the problem because master and slave lasers have to be
treated on equal footing. A theory capable of treating strongly coupled lasers and providing a
rigorous description of outcoupling was developed. The resulting laser model provided
understanding of underlying physical mechanisms by tracing dynamical performance
improvements to spatial hole burning and dynamical bifurcations arising from the interaction
between nonlinear gain medium and coupled-cavity fields. Spatial hole burning allows
fundamental and sideband fields to extract gain from different lasers, thus decreasing gain
competition that would have inhibited the growth of modulation-generated sidebands. A more
through description of the models used can be found in [3-5].

14
3. EXPERIMENTAL WORK
The new theoretical perspective gained in this program was verified by the performance of
coupled-cavity devices designed, fabricated and tested for this project. Two types of PICs were
demonstrated. The first is a PIC composed of coupled-cavity DBR lasers where two laser
cavities share a central mirror determining the coupling between the laser cavities [6].
Additionally, a coupled-cavity PIC with an EAM between the two laser cavities was explored
[7]. This section will described the fabrication of these devices and report the results from
devices.
3.1 Device Fabrication
The devices were fabricated in the SNL microfabrication facility. The MOCVD grown
epitaxial base structure for this chip consists of seven quantum wells centered in a InGaAsP
waveguide layer grown on a conducting sulfur-doped InP substrate. A quantum-well
intermixing technique, similar to [8], is used to tailor the quantum well band edge with very low
optical reflections allowing the integration of different functionalities on the chip. The chips
consist of active optical regions for the laser gain section, intermediate regions with a slightly
blue-shifted bandedge, ~50 nm, for the EAMs, and passive regions with a fully blue-shifted
bandedge, ~100 nm, for waveguide, phase and grating sections. The DBR mirrors are defined
with e-beam lithography and dry etched into the semiconductor. Following the definition of the
mirror gratings, there is a single planar MOCVD regrowth of the InP p-cladding and p-doped
InGaAs contact layer. Topside n-contacts, designed for high-speed probing, are formed using
dry etching, metal deposition and annealing. Bis-benzocyclobutene (BCB) was used as a low-k
dielectric under the p-contact pads to reduce the capacitance and isolate the n-metal and p-metal.
A proton implant was used to isolate the p-contacts of the laser sections and EAM. A single layer
AR coating was used to suppress facet back reflections. The devices were cleaved and soldered
to copper submounts. The DC contacts were wirebonded to an AlN standoff and the high-speed
laser gain sections and EAMs were directly probed using a ground-signal-ground high-speed
probe for testing. A micrograph of a fabricated and mounted chip is in Figure 4.

15
Figure 4 : Optical micrograph of the coupled cavity PIC during testing.
3.2 Coupled-Cavity Mutually Injection-Locked Lasers
The coupled-cavity device consists of two DBR lasers sharing a center mirror (Figure 5).
Although there is not a clearly defined master and slave laser due to coupling between the lasers,
for reference purposes the laser nearest the output will be referred to as the slave and the back
laser will be referred to as the master. The slave laser consists of a 58 µm front mirror, a 50 µm
phase section, a 200 µm gain section and a 45 µm rear mirror. The rear mirror of the slave laser
is shared between the two lasers and also acts as the front mirror for the master laser. The master
laser consists of the shared mirror, a 500 µm gain section, a 50 µm phase section and a 150 µm
rear mirror. The DBR mirrors were designed for effective power reflectivities of 90%, 45% and
99% for the slave front mirror, shared mirror and master rear mirror respectively. The ridge
waveguide is 4 µm wide with a curved and flared output to reduce back reflections and improve
coupling efficiency.
Figure 5 : Optical micrograph of the coupled cavity PIC die.

16
3.2.1 External Injection Measurements
The coupled-cavity devices were first characterized with an external laser to verify the well
documented injection locking behavior between two lasers separated with an optical isolator.
The frequency response of the slave laser under external injection was taken for a number of
different injected powers (Figure 6). Light from a tunable external cavity laser was coupled into
the slave laser cavity. A circulator was used to separate the laser output light from the injected
light. The output of the modulated slave laser was input into a photodiode and then port 2 of a
network analyzer. The master laser gain section was reverse biased to -4 V rendering it
effectively an absorber. The level of injected power into the laser cavity was measured by
reverse biasing the slave laser gain section to -4 V and recording the measured photocurrent.
Injection locking operation was verified by observation that the slave’s lasing wavelength is
identical to master’s wavelength in an OSA. In this case the PIC slave laser is acting as a true
slave laser and the external cavity laser is the injection locking master laser. There is a 0.1 nm
detuning between the free running wavelength of the slave laser and the injected external laser as
determined by measurements on an OSA. The resonance peak moves out in frequency and is
dampened in amplitude with increasing injection power. This is in agreement with other
reported devices and theory [9].
Figure 6: Slave laser under external injection for injected powers of 0.91 mW, 1.14 mW, 1.44 mW,
1.79 mW, 2.26 mW, and 2.84 mW. Master laser gain section is reverse biased. (Igain=31 mA, Iphase = Ifront mirror = Irear mirror = 0 mA, λinjected = 1556.36 nm)
3.2.2 Coupled-Cavity Mutual Injection Locking Measurements
The coupled nature of the two lasers on the chip prevents the lasers from sharing a free running
wavelength. Therefore, single frequency operation indicates the lasers are operating in the
mutual injection locked regime. Due to the lack of optical isolation, there are three active cavities
in the PIC that create a complex cavity mode spacing. The relative cavity lengths and mode
spacing of the lasers were tuned by applying current to the laser phase and mirror sections to
achieve mutual injection locking over a wide range of master gain biases. The resulting side
17
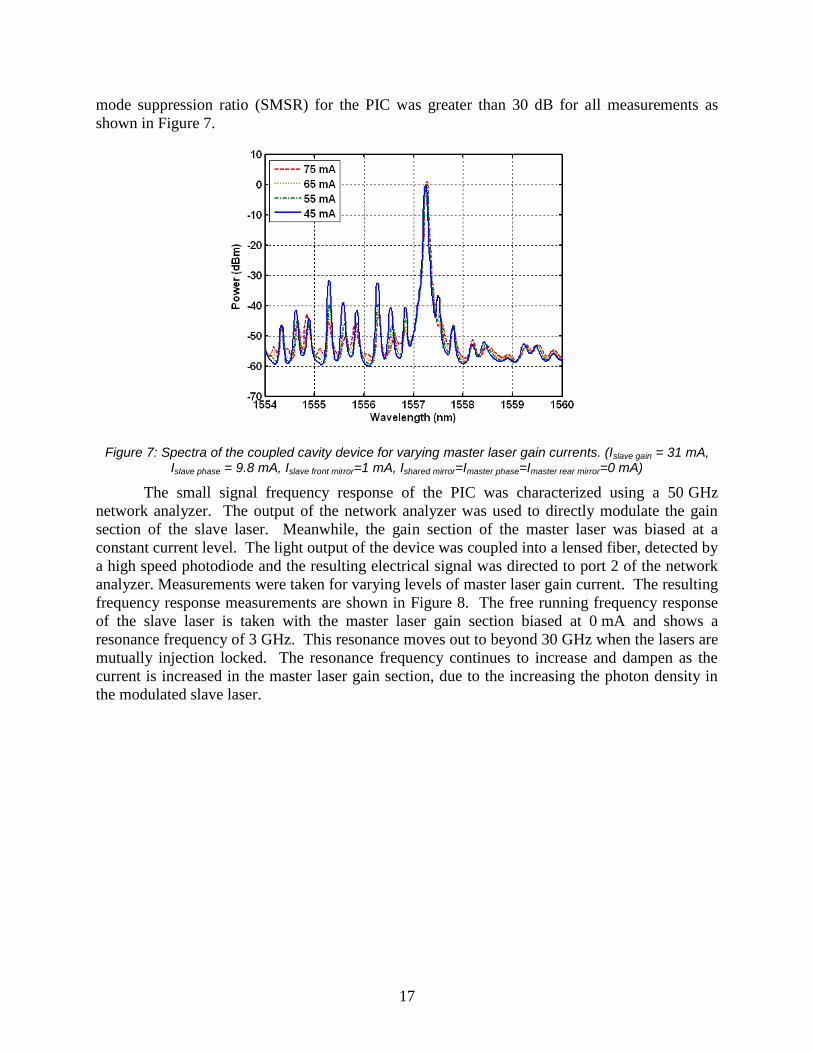
mode suppression ratio (SMSR) for the PIC was greater than 30 dB for all measurements as
shown in Figure 7.
Figure 7: Spectra of the coupled cavity device for varying master laser gain currents. (Islave gain = 31 mA, Islave phase = 9.8 mA, Islave front mirror=1 mA, Ishared mirror=Imaster phase=Imaster rear mirror=0 mA)
The small signal frequency response of the PIC was characterized using a 50 GHz
network analyzer. The output of the network analyzer was used to directly modulate the gain
section of the slave laser. Meanwhile, the gain section of the master laser was biased at a
constant current level. The light output of the device was coupled into a lensed fiber, detected by
a high speed photodiode and the resulting electrical signal was directed to port 2 of the network
analyzer. Measurements were taken for varying levels of master laser gain current. The resulting
frequency response measurements are shown in Figure 8. The free running frequency response
of the slave laser is taken with the master laser gain section biased at 0 mA and shows a
resonance frequency of 3 GHz. This resonance moves out to beyond 30 GHz when the lasers are
mutually injection locked. The resonance frequency continues to increase and dampen as the
current is increased in the master laser gain section, due to the increasing the photon density in
the modulated slave laser.

18
Figure 8: Small signal frequency response of the coupled cavity device for varying master laser gain
currents. (Islave gain = 31 mA, Islave phase = 9.8 mA, Islave front mirror=1 mA, Ishared mirror=Imaster phase=Imaster rear mirror=0 mA)
The small signal frequency response was also taken with varying levels of the slave phase
current (Figure 9). This changes the effective cavity length of the slave laser and as a result the
detuning between the free running wavelengths of the master and slave is altered. The detuning
is measured as the difference between the peak wavelength and the nearest cavity mode seen in
the spectra. The resonance frequency directly correlates to the difference between the lasing
wavelength and the nearest cavity mode seen in the optical spectra. The detuning decreases with
increased phase current, moving the frequency resonance with it.
Figure 9: Small signal frequency response of the coupled cavity device for phase section currents of 14 mA, 10 mA, 9 mA, 8 mA, 7 mA, and 6 mA.. (Islave gain = 31 mA, Imaster gain = 55 mA, Islave phase = 9.8 mA,
Islave front mirror=1 mA, Ishared mirror=Imaster phase=Imaster rear mirror=0 mA)

19
3.2.3 Coupled-Cavity DBR Summary
We have demonstrated an increase of the relaxation resonance frequency in a PIC composed of
two coupled DBR lasers. The relaxation resonance frequency moved from 3 GHz for a single
directly modulated laser to beyond 30 GHz with the mutual injection locking of the lasers. The
observed injection locking dynamics for the coupled-cavity device is consistent with tabletop
systems employing discrete lasers and circulators. This compact chip is compatible with further
integration enabling highly functional PICs to take advantage of the benefits of OIL.
3.3 Mutually Injection-Locked Lasers Integrated with an EAM
Recent research in optical injection locking (OIL) of directly modulated lasers has shown
increases in the relaxation resonance frequency, reductions of nonlinear distortions and
reductions in chirp [1,10]. However, in OIL lasers, increases in the relaxation resonance
frequency do not always translate into increased bandwidth due to a low frequency pole from the
laser carrier dynamics limiting the bandwidth before the relaxation resonance frequency. It was
recently reported that the injection of externally modulated master laser light can overcome this
limitation and does not exhibit the severe response dips seen in directly modulated lasers with
OIL [11]. While these are promising results, the size, complexity, and sensitivities of the
discrete component configuration stands in the way of practical implementation. Monolithic
integration of the two lasers and modulator on a single compact chip has the benefits of reduced
coupling losses, increased mechanical robustness, smaller form factor and the compatibility of
integration with other elements for the creation of highly functional photonic integrated circuits.
Such a chip would not be able to utilize optical isolators resulting in the intimate coupling of the
laser cavities. Therefore, we have modified our coupled-cavity DBR design to incorporate an
EAM. This compact photonic integrated circuit (PIC) incorporates two distributed Bragg
reflector (DBR) lasers and an electro-absorption modulator (EAM).
Figure 10: Optical micrograph of the PIC consisting of (from left to right) the master DBR laser, EAM,
slave DBR laser and output waveguide.
3.3.1 Design The PIC consisting of two DBR lasers and a 200 µm long EAM positioned between the lasers
was fabricated on an InP-based integration platform. An optical micrograph of the device is

20
shown in Figure 10. Although there is not a clearly defined master and slave laser due to
coupling between the lasers, for reference purposes the laser farthest from the front facet will be
referred to as the master laser and the laser closest to the facet is referred to as the slave laser. A
4 µm wide ridge waveguide guides the light and connects all the circuit elements. This ridge is
curved and flared at the output to increase coupling efficiency and reduce reflections. Devices of
two different coupling strengths were characterized. This coupling strength is defined by front
mirror of the master laser and the rear mirror of the slave laser.
3.3.2 71% Mirror Reflectivity Design The PIC design with weaker coupling between the lasers has mirrors designed for 99%, 71%,
71% and 90% reflectivities for the master rear mirror, master front mirror, slave rear mirror and
slave front mirror respectively. Physically this means the master laser consists of a 150 µm long
rear mirror, 50 µm long phase section, 500 µm long gain section and 38 µm long front mirror.
The slave laser consists of a 38 µm long rear mirror, 50 µm long phase section, 200 µm long
gain section and 58 µm long front mirror.
Figure 11: SMSR vs. slave laser gain current for varying master laser gain currents. (VEAM = -1.5 V).
Similar to the coupled-cavity laser, the coupling of the two lasers on the chip prevents the lasers
from sharing a free running wavelength. Therefore, single-frequency operation indicates the
lasers are operating in the mutual injection locked regime. Due to the lack of optical isolation,
there are five active cavities in the PIC which creates a complex cavity mode structure. The
relative cavity lengths and mode spacing of the lasers can be tuned by applying current to the
laser phase and mirror sections to achieve mutual injection locking over a wide range of master
gain biases. The injection locked bands of the PIC can be traced out by plotting the side-mode
suppression ratio (SMSR). A high (>30 dB) SMSR indicates the lasers operating at a single
frequency and thus are injection locked. The SMSR of the PIC as a function of the slave laser
electrical bias is plotted in Figure 11 for three different master laser gain biases. This plot shows
two separate lock-bands. In the first band where the slave gain bias is low, the master laser is
controlling the slave laser and defining the output wavelength. As the master gain bias increases
this lock-band widens due to the corresponding increase in power injected into the slave laser
cavity. In the second lock-band where the slave gain bias current is high, the slave laser is

21
controlling the master laser and the output modes. This lock-band narrows with increasing
master laser bias current due to a reduction in the relative power ratio. The locking behavior
seen in this integrated device agrees with the behavior seen in tabletop experiments utilizing
isolators [9].
The small signal frequency response of the PIC was characterized using a 50 GHz network
analyzer. The output of the network analyzer was connected to the EAM. A 50 Ω load resistor
was connected in parallel with the EAM for impedance matching. Meanwhile, the gain sections
of the two lasers were biased at a constant current level. The optical output signal from the PIC
was coupled into a lensed fiber and collected by a high speed photodiode. The generated
electrical signal was applied to the input port of the network analyzer. For all the measurements,
the lasers were biased in the first mutual injection locking regime, which was confirmed with
measurements of the optical spectra showing SMSR greater than 30 dB.
The EAM frequency response is taken using a separate chip consisting of a DBR laser integrated
with an EAM. The bandwidth of the EAM is 10 GHz and limited by the resistance and
capacitance of the device and load resistor (Figure 12).
Figure 12: The small-signal frequency response of the coupled cavity device for varying master laser gain
current (Islave gain = 31 mA, VEAM = -2V) and of the laser-EAM (VEAM = -2V).
Measurements were taken for varying levels of master laser gain current. The resulting
frequency response measurements are shown in Figure 3.10. There are two distinct resonances
in the optical response. It has been shown that the location of resonance peaks in optical
injection locked responses closely correlate with the detuning between the lasing wavelength and
the cavity modes of the free running laser [12]. The complex cavity of the PIC presented here
creates many closely spaced modes allowing the frequency modulation to correspond to the
detuning for multiple modes in the 50 GHz frequency scan. If the frequency response was
extended to higher frequencies additional resonances would be expected, similar to the
discrete-laser case. The changes in the gain current affect both the positions and amplitudes of
the resonances due to changes in the photon density and cavity spacing. Similar to a single
directly modulated laser, increases in the internal photon density result in the damping of

22
relaxation resonance. The modal cavity spacing changes with injected gain current because the
injected carriers change the refractive index and effective length of the laser cavity. This in turn
shifts the locations of the resonances.
Figure 13: Small signal frequency response of the coupled cavity device for varying slave laser gain current. (Imaster gain = 70 mA, VEAM = -2V)
We have also measured the frequency response for varying slave laser gain biases (Figure 13).
In this case, there is not a direct connection between the increase in photon density and the
amplitude of the second resonance. This is because the photon density in both laser cavities is
dominated by the light generated in the gain section of the master laser. The resonance
amplitude increase with increasing bias due to the movement of the operating position within the
lock-band. At 35 mA bias current in the slave laser, the lasers are operating closer to the edge of
the lock-band than at 25 mA, which results in a larger resonance, as previously shown with
discrete devices [9].
3.3.3 55% Mirror Reflectivity Design The PIC with stronger coupling between the lasers is designed for 99%, 55%, 55% and 90%
reflectivities for the master rear mirror, master front mirror, slave rear mirror and slave front
mirror respectively. In this case, the master laser consists of a 150 µm long rear mirror, 50 µm
long phase section, 500 µm long gain section and 30 µm long front mirror. The slave laser
consists of a 30 µm long rear mirror, 50 µm long phase section, 200 µm long gain section and 58
µm long front mirror.
As with the other designs, single frequency operation indicates the lasers are operating in the
mutually injection locked regime. An optical spectrum from the injection locked lasers with
greater than 35 dB side mode suppression ratio is shown in Figure 14.

23
Figure 14: Optical spectrum of the PIC. (Igain-slave = 35 mA, Igain-master = 72 mA, VEAM = -1.5 V).
The bandwidth of the device was measured using a 50 GHz network analyzer. The output from
the network analyzer drives the EAM. A 50 Ω load resistor on the probe was placed in parallel
with the EAM for impedance matching. The two laser gain sections were biased with a constant
current. Applying current to the phase and mirror sections allows tuning of the relative cavity
lengths and mode spacing. Biases were optimized to obtain single mode operation, which
indicates mutual injection locking of the master and slave lasers. The only inputs to the chip
were DC electrical biases and the electrical modulation signal. The device output was coupled
into a lensed fiber and detected by a high-speed photodetector connected to the input of the
network analyzer. The bandwidth of the EAM by itself was taken as a reference from a separate
device consisting of a DBR laser and EAM of the same design. To ensure that the modulated
power was similar, the laser on the EML chip was biased to achieve the same photocurrent as the
injection locked PIC. The direct modulation bandwidth of the slave laser was taken with a 4 V
reverse bias on the EAM to suppress feedback from the master laser cavity.
The small signal responses are seen in Figure 15. The complete PIC with the EAM under
modulation has a bandwidth extending beyond the 50 GHz measurement capabilities of the
network analyzer. This is a considerable improvement over the 10 GHz and 2.5 GHz
bandwidths demonstrated by the integrated DBR-EAM and directly modulated slave laser
respectively. It has been shown that the modulation sideband interaction with the free running
laser cavity modes is responsible for the resonance frequency enhancements [12]. Since there
are no isolators involved in the device, the PIC consists of five coupled active laser cavities
leading to closely spaced cavity mode spacing. These closely spaced modes create the multiple
response enhancements seen in the plotted frequency response. The plotted frequency response
is not normalized and the same output modulation power level was used for all testing.
Therefore, the relative amplitudes of the frequency response show that the injection-locked PIC
has a higher modulation efficiency compared to the EAM alone. Increasing the cavity photon
density, through higher gain currents, would dampen the frequency enhancements creating a flat

24
response, however this device did not achieve single frequency operation in this regime due to
the designs cavity mode spacing and coupling strength.
Figure 15: Small signal frequency response of the PIC (Igain-slave = 35 mA, Igain master = 72 mA, VEAM = -
1.5 V), slave laser (Igain-slave = 35 mA), and DBR-EAM (VEAM = -1.5 V).
3.3.4 Summary of Mutually Injection Locked PICs with EAMs
In summary, a PIC with two DBR lasers and an EAM has been fabricated. Mutual injection
locking between the two lasers has been demonstrated and the lock-band measured. The
frequency response measurements show a five-fold increase in the device bandwidth compared
to the EAM by itself. These PICs have demonstrated injection locking dynamics similar to large
complex tabletop systems employing discrete lasers and isolators. The simplicity and
compatibility with integration of the PIC make it an attractive building block in highly-functional
PICs. These devices would be well suited for applications requiring a narrow frequency range at
high frequencies. It is expected that improved engineering of the cavity spacing and coupling
strengths will produce devices with the broadband response needed for many applications.

25
4. CONCLUSIONS
We have been successful in simulating and experimentally demonstrating that the modulation
response enhancement from optical injection locking is possible even if the optical isolator
between the master and slave lasers is removed. This was done through the development of
composite coupled-mode theory capable of treating strongly coupled lasers and providing a
rigorous description of outcoupling. This modeling provided a greater fundamental
understanding of the physical mechanisms of the modulation of devices under injection locking.
The characterization of PICs designed according to the simulations verified the modulation
enhancement attributed to optical injection locking in coupled-cavity devices. Additionally,
more complex PICs incorporating an EAM demonstrated this enhancement without a low
frequency roll off. Ultimately, we have demonstrated PICs with strongly coupled-cavities that
have resonance frequencies tenfold that of a directly modulated laser and bandwidths 5x that of a
laser-modulator pair. A significant increase in the modulation efficiency under mutual injection
was also shown. Due to their compact size, these devices have to potential to be important
components of integrated photonics microsystems requiring extremely high bandwidths.

26
4. REFERENCES
1. L. Chrostowski, X. Zhao, and C.J. Chang-Hasnain, “Microwave Performance of Optically
Injection-Locked VCSELs,” IEEE Trans. on Microwave Theory and Techniques, Vol. 54,
No. 2, pp. 788-796, 2006
2. W.W. Chow, “Theory of emission from an active photonic lattice,” Phys. Rev. A, Vol. 73,
No. 1, pp. 013821-1-013821-9, 2006
3. W.W. Chow, Z.S. Yang, G.A. Vawter, and E.J. Skogen, “Modulation Response
Improvement With Isolator-Free Injection-Locking,” IEEE Photonics Tech. Letters, Vol. 21,
No. 13, pp. 839-841, 2009
4. W.W. Chow, “Dynamics in Isolator-Free Injection-Locked Lasers,” IEEE/LEOS Winter
Topicals Meeting Series, Innsbruck, Jan. 12-14, 2009
5. W.W. Chow, E.J. Skogen, and G.A. Vawter, “Modulation Response in Isolator-Free MOPA
and Injection-Locked Laser Configurations,” IEEE Int. Semiconductor Laser Conference,
Sorrento, Sept. 14-18, 2008
6. A. Tauke-Pedretti, G.A. Vawter, E.J. Skogen, G. Peake, M. Overberg, C. Alford, W.W.
Chow, Z.S. Yang, D. Torres, and F. Cajas, “Frequency Response Enhancement in Integrated
Coupled-Cavity DBR Lasers”, Photonics Society Annual Meeting, Denver, Nov. 7-11, 2010
7. A. Tauke-Pedretti, G.A. Vawter, E.J. Skogen, G Peake, M. Overberg, C. Alford, W.W.
Chow, Z.S. Yang, D. Torres, and F. Cajas, “Mutually Injection-Locked Lasers Integrated
with an Electro-absorption Modulator”, submitted to Optics Letters.
8. E.J. Skogen, J.S. Barton, S.P. DenBaars, and L.A. Coldren, “A Quantum-Well-Intermixing
Process for Wavelength-Agile Photonic Integrated Circuits,” IEEE Journal of Sel. Topics in
Quantum Electronics, Vol. 8, No. 4, pp. 863-869, 2002
9. E.K. Lau, H.-K. Sung, and M.C. Wu, “Frequency Response Enhancement of Optical
Injection-Locked Lasers,” IEEE J. of Quantum Electronics, Vol. 44, No. 1, pp. 90-99, 2008
10. H.-K. Sung, T. Jung, M.C. Wu, D. Tishinin, T. Tanbun-Ek, K.Y. Liou, W.T. Tsang,
“Modulation Bandwidth Enhancement and Nonlinear Distortion Suppression in Directly
Modulated Monolithic Injection-locked DFB Lasers,” International Topical Meeting on
Microwave Photonics, pp. 27-30, 2003
11. E.K. Lau, L.J. Wong, X. Zhao, Y.-K. Chen, C.J. Chang-Hasnain, M.C. Wu, “Bandwidth
Enhancement by Master Modulation of Optical Injection-Locked Lasers,” J. of Lightwave
Technology, Vol. 26, pp. 2584-2593, 2008
12. X. Zhao, D. Parekh, E. K. Lau, H. K. Sung, M. C. Wu, W. Hofmann, M.C. Amann and C. J.
Chang-Hasnain, "Novel cascaded injection-locked 1.55-µm VCSELs with 66 GHz
modulation bandwidth," Optics Express, Vol. 15, pp. 14812-14816, 2007

27
DISTRIBUTION
1 MS1078 Wahid Hermina 1710
1 MS1082 Joel Wendt 1725
1 MS1085 G. Allen Vawter 1742
1 MS1085 Erik Skogen 1742
1 MS1085 Anna Tauke-Pedretti 1742
1 MS1085 Mark Overberg 1742
1 MS1085 Gregory Peake 1742
1 MS1085 Charles Sullivan 1742
1 MS1086 Weng Chow 1123
1 MS0899 Technical Library 9536 (electronic copy)
1 MS0123 D. Chavez, LDRD Office 1011

28

