initial test of a wire suspension mount for missile ... · for missile virtual flight testing ......
TRANSCRIPT

AIAA 2002-0169 Initial Test of a Wire Suspension Mount for Missile Virtual Flight Testing J.C. Magill and Shawn Wehe Physical Sciences Inc. 20 New England Business Center Andover, MA 01810
40th AIAA Aerospace Sciences Meeting and Exhibit
14-17 January 2002/Reno, NV
For permission to copy or republish, contact the copyright owner named on the first page. For AIAA-held copyright, write to AIAA Permissions Department, 1801 Alexander Bell Drive, Suite 500, Reston, VA 20191-4344.

American Institute of Aeronautics and Astronautics
1
AIAA-2002-0169
INITIAL TEST OF A WIRE SUSPENSION MOUNT FOR MISSILE VIRTUAL FLIGHT TESTING
John C. Magill* and Shawn D. Wehe† Physical Sciences Inc. Andover, MA 01810
Abstract
A wire suspension system to enable wind tunnel Virtual Flight Testing of missile models has been designed, built, and tested. This prototype used six steel cables to suspend a model-mounting collar in the tunnel. The collar contained a three-axis ball-bearing pivot to enable roll, pitch, and yaw motion. Tension load cells in each of the cables allowed measurement of forces on the model. This paper describes the design of the system, mathematical prediction of its dynamic behavior, laboratory and calibration experience, and low-speed wind-tunnel demonstration experiments. One set of experiments provided vibration measure-ments for comparison to the mathematical models. For some laboratory tests, the system was fitted with a feedback-controlled motor to augment the damping. This device could be used as a safety feature when testing in unstable flight regimes. The experiments showed the viability of a wire suspension system, but future versions will require a number of improvements, particularly in the force measurement subsystems.
Introduction
Physical Sciences Inc. (PSI) has completed the first phase in the development of a cable suspension system to support test articles in a wind tunnel. The system - consisting of a six-wire support structure and a three-axis pivot - is intended to facilitate Virtual Flight Testing. It permits the model to roll, pitch, and yaw freely while measuring the vertical, horizontal, and streamwise restraining forces.
The preliminary work described in this paper
assessed the requirements for the system, addressed key _________________ * Principal Research Engineer, Member AIAA † Principal Scientist, AIAA member Copyright © 2001 by Physical Sciences Inc. Published by the American Institute of Aeronautics and Astronautics, Inc., with permission.
engineering challenges in system implementation, formulated a candidate design, and experimentally demonstrated its functionality. Key issues addressed included
• Model/support mechanical interface • Aerodynamic interference of the support • Three-component force measurement • Mechanical stiffness • Actuators for manipulating the model, damping
oscillations, and improving system safety. To demonstrate the feasibility of this system, PSI designed and built a prototype cable suspension system. The effort included both laboratory and scale wind tunnel tests of the system. These experiments provided a deeper understanding of the mechanics of the wire suspension system, identifying specific ways in which the engineering design models can be improved in future prototypes. The next section describes the proposed system in general terms, describing the test applications that drive the design. Requirements for a Virtual Flight Test Mount Virtual Flight Test (VFT) has been proposed as a means of testing missile guidance and attitude control systems in a wind tunnel using nearly flight-ready hardware. The purpose of a VFT is to reduce costs and risks associated with flight testing. The need for such tests is on the increase as missile users are demanding higher launch angles and more rapid post-launch maneuvers.1 To meet these demands, missiles must operate at extreme angles of attack where problems such as phantom yaw, a result of asymmetric separation on the forebody, occur. Analytical and numerical prediction tools for these flight regimes are limited at present and it is important to devise a means of iden-tifying problems and modifying control algorithms prior to flight tests.

American Institute of Aeronautics and Astronautics
2
At the highest level of test fidelity described by Ratliff and Marquart,2 a missile would be mounted in the wind tunnel on a three-degree of freedom (D.O.F.) pivot. It would be restrained from translation, but would be free to rotate about three axes. The missile would be outfitted with an appropriate suite of control actuators. A telemetry system would provide missile attitude information to a control computer, which would command the action of the control jets. Alternatively, the missile flight electronics hardware could be used to execute the control algorithms. The aerodynamic and control-induced loads on the missile would be measured at the mount. The computer controlling the experiment could then calculate the translational motions that would result from these loads if the model were in free flight. Thus, a complete model flight trajectory could be constructed. From the flight trajectory, an artificial scene could be generated and projected onto the focal plane array of an IR tar-geting system. A guidance system could then be tested in this virtual flight environment because it would have the same sensory input and control authority that it would have in flight. To implement the UFT test scenario, a mount must be developed which allows the missile model to pivot on three axes while measuring loads induced by aero-dynamics of the vehicle as well as by reaction control jets. The load sensing must accommodate a wide range of load magnitudes and frequencies. Key consider-ations for selecting a wind tunnel mount also include safety and aerodynamic interference. Cable Mount System Cable mount systems have been used to measure stability parameters for various aircraft in both U.S.3 and Japanese4,5 tunnels, and have been used at NASA Langley to test flutter models in transonic flows. In these systems the model is suspended in a wind tunnel by a cable and pulley system with cable arrangement depending on the type of motions to be tested. The cables serve as an elastic mount permitting the model some freedom of motion while restricting ultimate dis-placements and rotations. The flexibility of the system can be adjusted through servo motors that adjust cable tension. The model can be driven to oscillate using these same servo motors. Oscillatory motion experiments produce measure-ments of the stability parameters of the aircraft. If the model mass and moments of inertia are known, the net force acting on a model can be estimated from
accelerations taken from model motion time histories. These have been measured by other researchers using means such as onboard accelerometers and angular position sensors as well a video camera position measurement system. If the cable stiffnesses are known or if the tensions are directly measured, the mount loads can be extracted from the net loads to produce the aerodynamics loads and hence the stability derivatives. General Design and Design Issues In the past, cable mount systems were used primarily as oscillatory measurement systems. It is possible, though, to design a cable mount system which meets most of the requirements for a VFT model mount outlined above. Figure 1 shows PSI’s cable mount system for this purpose. This diamond-shaped mount design permits unlimited roll and pitch and can provide yaw angles as high as 60 deg on a set of ball bearings. The diamond could be replaced with a smaller circular ring, reducing its size and hence aerodynamic interference at the expense of restricting yaw angle displacement.
ControlCable Servo
TensionGage
Roll Bearing
Pitch Bearing
Yaw BearingE-4632sr
Figure 1. Proposed wire suspension system
configuration.
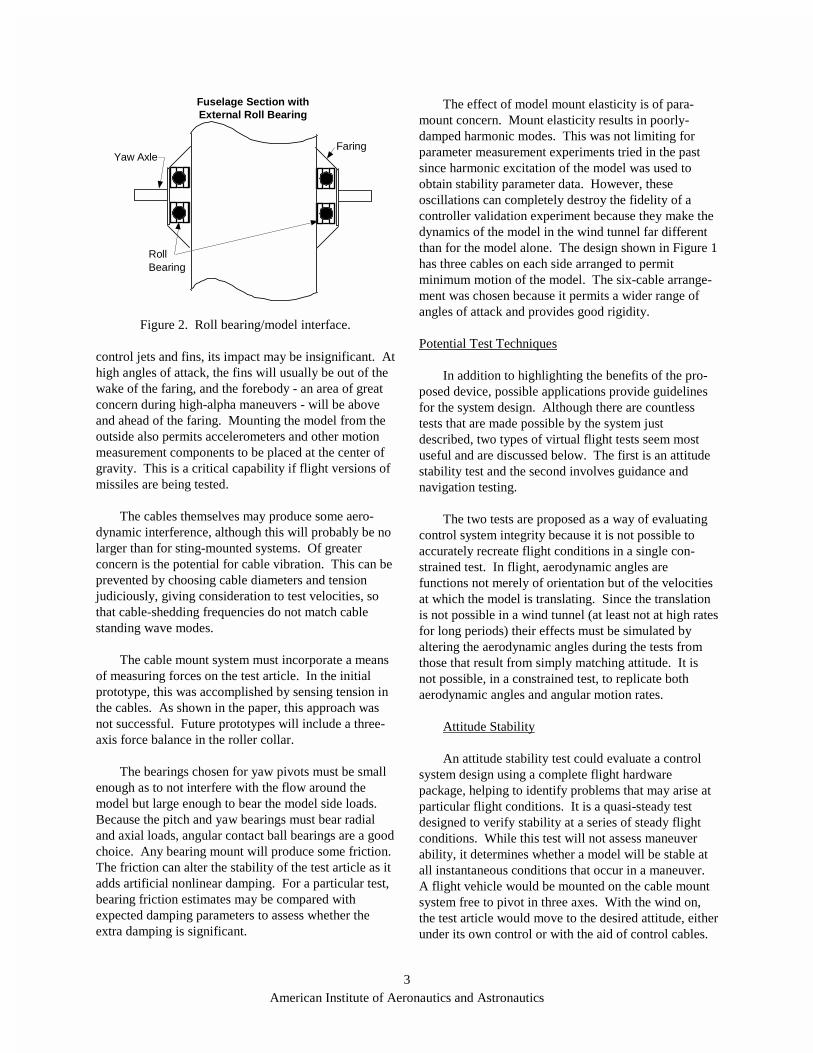
A model attachment design is shown in Figure 2. In this design, the external roll bearing is housed under a faring outside of the fuselage. The impact of this design on simulation fidelity depends upon the test article. If the mounting location is sufficiently far from
American Institute of Aeronautics and Astronautics
3
Yaw Axle
RollBearing
Fuselage Section withExternal Roll Bearing
Faring
E-4633a
Figure 2. Roll bearing/model interface.
control jets and fins, its impact may be insignificant. At high angles of attack, the fins will usually be out of the wake of the faring, and the forebody - an area of great concern during high-alpha maneuvers - will be above and ahead of the faring. Mounting the model from the outside also permits accelerometers and other motion measurement components to be placed at the center of gravity. This is a critical capability if flight versions of missiles are being tested. The cables themselves may produce some aero-dynamic interference, although this will probably be no larger than for sting-mounted systems. Of greater concern is the potential for cable vibration. This can be prevented by choosing cable diameters and tension judiciously, giving consideration to test velocities, so that cable-shedding frequencies do not match cable standing wave modes. The cable mount system must incorporate a means of measuring forces on the test article. In the initial prototype, this was accomplished by sensing tension in the cables. As shown in the paper, this approach was not successful. Future prototypes will include a three-axis force balance in the roller collar. The bearings chosen for yaw pivots must be small enough as to not interfere with the flow around the model but large enough to bear the model side loads. Because the pitch and yaw bearings must bear radial and axial loads, angular contact ball bearings are a good choice. Any bearing mount will produce some friction. The friction can alter the stability of the test article as it adds artificial nonlinear damping. For a particular test, bearing friction estimates may be compared with expected damping parameters to assess whether the extra damping is significant.
The effect of model mount elasticity is of para-mount concern. Mount elasticity results in poorly-damped harmonic modes. This was not limiting for parameter measurement experiments tried in the past since harmonic excitation of the model was used to obtain stability parameter data. However, these oscillations can completely destroy the fidelity of a controller validation experiment because they make the dynamics of the model in the wind tunnel far different than for the model alone. The design shown in Figure 1 has three cables on each side arranged to permit minimum motion of the model. The six-cable arrange-ment was chosen because it permits a wider range of angles of attack and provides good rigidity. Potential Test Techniques In addition to highlighting the benefits of the pro-posed device, possible applications provide guidelines for the system design. Although there are countless tests that are made possible by the system just described, two types of virtual flight tests seem most useful and are discussed below. The first is an attitude stability test and the second involves guidance and navigation testing. The two tests are proposed as a way of evaluating control system integrity because it is not possible to accurately recreate flight conditions in a single con-strained test. In flight, aerodynamic angles are functions not merely of orientation but of the velocities at which the model is translating. Since the translation is not possible in a wind tunnel (at least not at high rates for long periods) their effects must be simulated by altering the aerodynamic angles during the tests from those that result from simply matching attitude. It is not possible, in a constrained test, to replicate both aerodynamic angles and angular motion rates.
Attitude Stability An attitude stability test could evaluate a control
system design using a complete flight hardware package, helping to identify problems that may arise at particular flight conditions. It is a quasi-steady test designed to verify stability at a series of steady flight conditions. While this test will not assess maneuver ability, it determines whether a model will be stable at all instantaneous conditions that occur in a maneuver. A flight vehicle would be mounted on the cable mount system free to pivot in three axes. With the wind on, the test article would move to the desired attitude, either under its own control or with the aid of control cables.

American Institute of Aeronautics and Astronautics
4
The model would then maintain the flight attitude using its own control system. The test should include disturb-ance response testing wherein a large disturbance is applied, most suitably by a short-duration input to one of the model’s control actuators, and the response is observed. The aerodynamic angles induced by translation would not be included in the attitude stability test. In a steady flight condition these angles are small, resulting only when the model deviates from the desired con-dition. Since the deviations are for short times if the controller is functioning, the corresponding free-flight velocity changes would be small and the angle errors would probably not be significant. This test essentially consists of matching angular motion, then, and not aerodynamic angles. This type of test would also provide accurate assessment of rapid post-launch maneuvers such as a rapid rotation wherein the missile pitches to a high angle of attack. Some amount of time is needed for the missile to accelerate normal to the freestream in such a maneuver so that during the rotation, the induced aero-dynamic angles are small and the actual aerodynamic angles are close to the orientation angles.
Guidance and Navigation Test In the guidance and navigation test, the control
system’s maneuvering capabilities are tested. If the artificial scene projection is used, the navigation system in the missile will command the maneuvers. Otherwise, pre-planned maneuvers can be commanded directly. In this type of test, the aerodynamic angles are matched during the maneuvers but the actual angular rates are not. The damping due to angular motions will be reduced and the stability test will thus be conservative. Aerodynamic angle matching is accomplished by resisting model motion using the additional control cables. For example, during a pitchup, a servo motor and cable like those shown in Figure 1 would allow the model to pitch up to the angle of attack that would occur in the maneuver but the model would not undergo the actual pitching motion. A tension sensor on the cable (possibly a motor torque sensor) would sense pitching moment. Combining this with the forces sensed by the force balance, the corresponding free-flight trajectory could be computed and the aero-dynamic angle adjusted accordingly. In this case, the
angle measurement from the missiles own measurement system would need to be replaced by a signal arti-ficially generated by the computer predicting the pitching motion. Prototype Design Before the cable suspension can be used in a wind tunnel test, several key operating characteristics must be demonstrated. These include suspension stiffness, freedom of motion, friction, force measurement, and strength. Much of the effort in the design centers on ensur-ing that there is no significant potential for structural failure of the system. In fact, the structural integrity will be key to securing permission from wind tunnel operators to install the system in a tunnel. It is impor-tant that we design the failure modes so that, if there is a failure, it will occur in a controlled way. Evaluation of the failure modes will be a key component of the design for the next prototype. The effort described here was intended to demon-strate the basic functional characteristics - stiffness, range of motion, and force measurement. To accom-plish these goals, PSI built a scale mockup of the proposed design and perform static tests to validate all of the basic functional characteristics. The demon-stration included both laboratory and wind tunnel tests.
To perform the test, the Georgia Institute of Technology Aerocontrols Wind Tunnel test section was augmented with a specialized test section constructed to house a virtual flight test cable system. The virtual flight test section (VFTS) abutted the existing test section exit. The inner dimensions of the facility measure 43.0 in. wide by 42.0 in. high.
Structure
A cubical frame open at both ends with windows on four sides made up the flow section of the VFTS. A schematic of the test section is shown in Figure 3. Figure 3(a) shows one half of the structure looking upstream into the test section along with one of the wire systems (described below). Note, the centerline of the test section is on the left hand side. The windows were fabricated from 0.39 in. Lexan (polycarbonate) and fit conveniently in the frame’s slots.

American Institute of Aeronautics and Astronautics
5
0 .39
140 .4 ¡-Z
+ Y
+X
+Y
44 .06
W indowH ole
42 .73
CL CL
View looking upstream(a)
Side View(b )
C o lla rI
W indow
Tra nsdu ce rA ssem b ly
19 W ireC a ble
E -7 0 0 4
Figure 3. Frame structure.
Model Mounting Collar The collar consisted of six bearings, bearing blocks, and link rods. This assembly is shown in Figure 4. There were two pitch and two yaw bearings. The bearings were aircraft control bearings, able to withstand radial and thrust loads. The pitch and yaw bearings were held in blocks arranged on a diamond. All four of these bearings had a 0.250 in. bore and could withstand 2680 lb radial and 1200 lb thrust loads. The blocks were held together by steel rods, pinned at each end. The pinned-rod assembly was chosen to prevent the rods from carrying bending moments. At two corners of the diamond were attachment points for the cables.
Figure 4. Model mounting collar.
At the center of the diamond is the roll collar. It contained two aircraft control bearings that fit on the
outside of the model and permit model roll. The bearings were spaced one diameter apart to prevent angular play in the model. The collar edges were tapered to reduce aerodynamic interference. The roll bearings had a 3.063 in. bore and could support 27,500 lb radial loads and 12,100 lb thrust loads.
Wire System
The wire system consisted of two components: a
cable assembled with fasteners on each end and a trans-ducer assembly external to the test section. The cable is depicted in Figure 5. A ball end fit into the model collar and the threaded stud threaded into the transducer assembly located exterior to the tunnel. The cable wires were type 302 stainless steel with 1×19 construc-tion and possessed a working load limit (WLL) of 940 lbf. The choice of a multiple wire assembly was driven by the ease with which it can fasten to the other hardware, its low cost, and the added benefit of internal damping derived from multiple wires sliding over another.
E-6979
3/8-101x19 Type 302 SS Wire0.44
0.73
33
4.17
Figure 5. Schematic of the wire assembly.
The second portion of the wire system was the
transducer assembly. A schematic of the assembly, starting with the treaded stud, is shown in Figure 6. The cable stud threaded into a Model 1210 load cell made by Interface Inc. This was a precision load cell which is accurate up to 0.04%. Additionally, it had low temperature drift, 0.0008% per °F and had a linear range from ± 450 lbf. The cable pretension (expected to be approximately 300 lbf) was set by a forged galvanized steel turnbuckle with a WLL of 1200 lbf. The jaw end of the turnbuckle was connected to a lifting eye, approximating a pinned joint and elimi-nating any bending loads on the transducer assembly.
TurnbuckleCable Stud
InterfaceLoad Cell
Lifting Eye
FrameWeldment
Figure 6. Cable and load cell ground.
American Institute of Aeronautics and Astronautics
6
The lifting eye, in turn, connected to a frame weldment with a WLL of over 10000 lbf.
System Frequency Response
A cable suspension system will be subject to transient excitation forces that will excite resonance in the cable structure. Sustained excitation of poorly damped modes cold result in failure. Of greater concern is the adverse effect that oscillations will have on dynamic force measurement. We are seeking an engineering model that will predict dynamic behavior based on system parameters such as cable tension and diameter. Test engineers could use the tool to tailor the properties to a specific test.
There are three elements to consider regarding the resonant frequencies of the virtual flight test system. The first two are related to the motion of the wires, namely longitudinal and transverse vibrations. Sche-matics of each motion are illustrated in Figure 7. In Figure 7a, a simplified two-member truss system with the collar located in the center moving from side to side illustrates the longitudinal movement. The term "longitudinal" is used here to denote uniform lengthen-ing or contracting of the truss members. This should not be confused with standing or traveling waves com-prised of local expansion or contraction in the cables that move in the longitudinal direction. The latter were not considered in this program. Similarly, the funda-mental mode of transverse vibration is shown.
(a) (b)E-6980
Figure 7. A simplified two-member truss system
illustrates longitudinal vibration(a), and transverse vibration (b).
The third element is an excitation source due to
vortex shedding from the cable wires and test article. Each of the elements will be discussed below.
Analysis of the transverse vibration was simplified
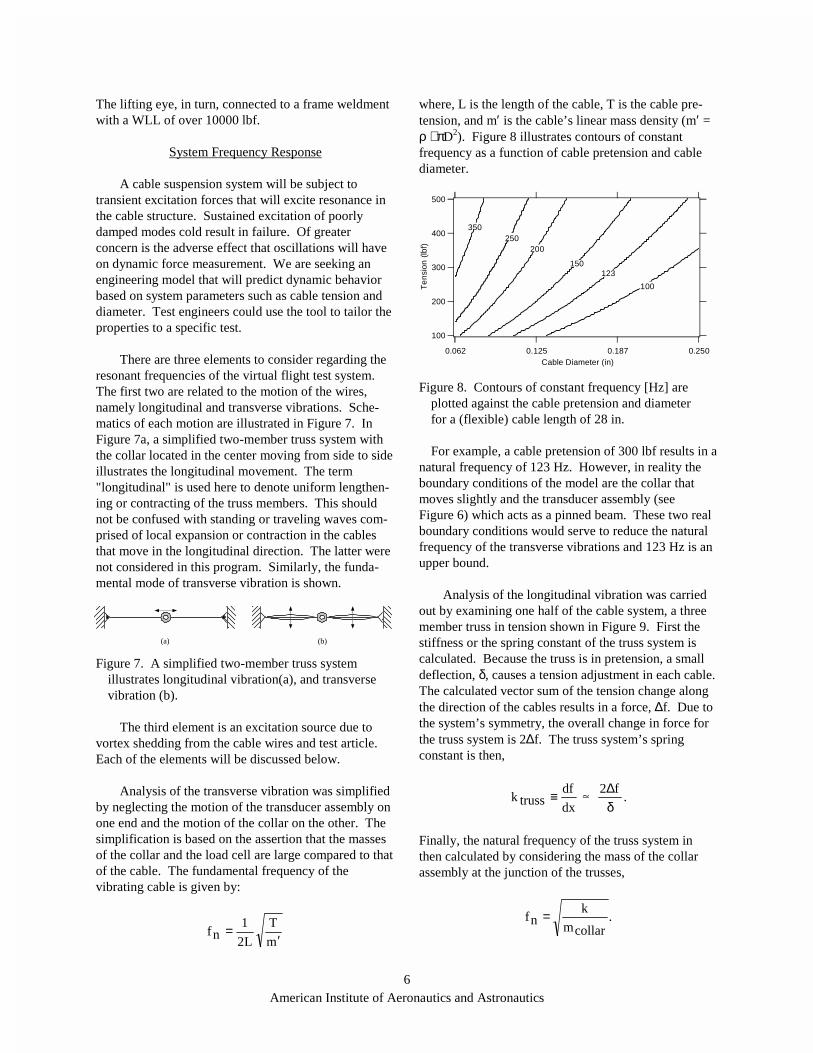
by neglecting the motion of the transducer assembly on one end and the motion of the collar on the other. The simplification is based on the assertion that the masses of the collar and the load cell are large compared to that of the cable. The fundamental frequency of the vibrating cable is given by:
m
T
L2
1nf
′=
where, L is the length of the cable, T is the cable pre-tension, and m′ is the cable’s linear mass density (m′ = ρ ⋅ πD2). Figure 8 illustrates contours of constant frequency as a function of cable pretension and cable diameter.
500
400
300
200
100
Te
nsio
n(lb
f)
0.2500.1870.1250.062Cable Diameter (in)
350250
150123
100
200
E-6976
Figure 8. Contours of constant frequency [Hz] are
plotted against the cable pretension and diameter for a (flexible) cable length of 28 in.
For example, a cable pretension of 300 lbf results in a
natural frequency of 123 Hz. However, in reality the boundary conditions of the model are the collar that moves slightly and the transducer assembly (see Figure 6) which acts as a pinned beam. These two real boundary conditions would serve to reduce the natural frequency of the transverse vibrations and 123 Hz is an upper bound.
Analysis of the longitudinal vibration was carried out by examining one half of the cable system, a three member truss in tension shown in Figure 9. First the stiffness or the spring constant of the truss system is calculated. Because the truss is in pretension, a small deflection, δ, causes a tension adjustment in each cable. The calculated vector sum of the tension change along the direction of the cables results in a force, ∆f. Due to the system’s symmetry, the overall change in force for the truss system is 2∆f. The truss system’s spring constant is then,
.f2
dx
dftrussk
δ∆≡
Finally, the natural frequency of the truss system in then calculated by considering the mass of the collar assembly at the junction of the trusses,
.collarm
knf =
�

American Institute of Aeronautics and Astronautics
7
φ δ (force)
X
Y
Z
θ
CableAssembly
E-6981
Figure 9. The analytical model of the virtual flight
system is a pretensioned truss resisting a deflection, δ. δ is imposed on the truss system over a range in angles φ and θ.
A range of natural frequencies were calculated for a constant deflection (|δ| = 0.001 in.) over a range of angles, 0<φ<90, 0<θ<180, where φ is a rotation about the x axis and θ is about the z axis as illustrated in Figure 9. A map of the natural frequencies in Figure 10 shows the angle dependence for a truss system com-posed of 3/16 in. thick, type 302 stainless steel cable.
90
60
30
0
Incl
inat
ion
φ°
1801501209060300
Azimuthal Angle θ°
305
300
290
280
260
240 220220 180180140 140
E-6977
Figure 10. Longitudinal natural frequency contours
(Hz) of a truss system as a function of the angles of deflection are shown for a collar mass of 10 lb and steel cable diameter of 3/16 in.
For a given collar mass, a range of natural frequen-cies can be accessed from the data shown in Figure 10. The band of natural frequencies possessed by the truss system is shown in Figure 11 as a function of the collar mass.
The final aspect of system dynamics to be con-
sidered was vortex shedding off of the cables. Shedding can potentially excite poorly dumped modes in the structure. The shedding frequency is governed by the Strouhal numbe for a cylinder on the Reynolds
500
400
300
200
100
Long
itudi
nalf
n(H
z)
10987654Collar Mass (lbm)
Max.Min.
E-6978
Figure 11. A range of natural frequencies for the truss
system as a function of the collar mass. number range 100 < ReD<105, on which St = 0.2. By definition,
∞=
U
DshedfSt
where fshed is the vortex shedding frequency, D is the cable diameter and U∞ is the free stream velocity. Design Summary
A set of basic engineering models provided pre-dictions of design performance to support the design of the prototype wire suspension system. They predicted stiffness and frequency response characteristics. They predict the harmonic oscillations that the system will exhibit, showing that the harmonic frequencies are wide spread and vary with direction of excitation. This design task also identified construction techniques and mechanical components that make assembly of the system easy. Many of these features, such as collar design, crimped cable ball-ends, load cells, and turn buckles will be carried into future systems. The next sections describe how the system was tested in the laboratory and wind tunnel. The results of the tests identified advantages and deficiencies in the design process and prototype system, so that an improved test system can be built in the next phase of the project.
Laboratory Experiments
Laboratory tests on the prototype system consisted of frequency response analysis, static calibration, and feedback damping tests. These tests quantified the behavior of the system for comparison to the engineer-ing model predictions, produced methods for cali-brating the six-wire system, and showed how system
American Institute of Aeronautics and Astronautics
8
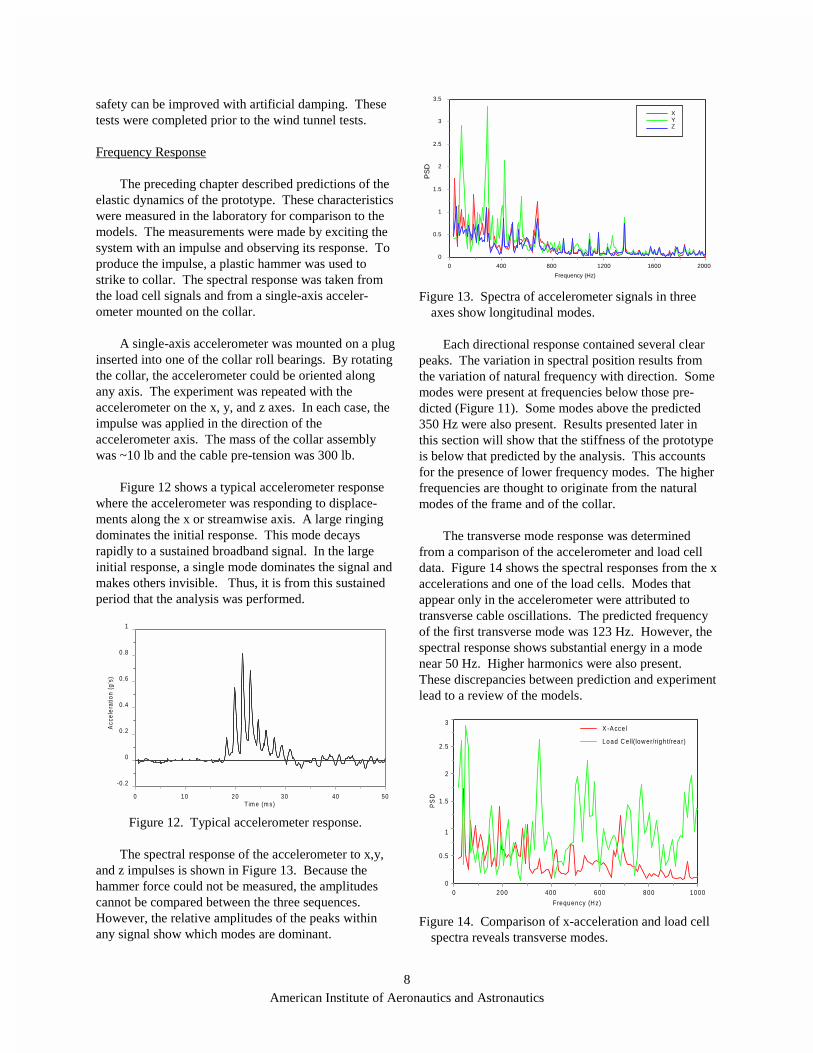
safety can be improved with artificial damping. These tests were completed prior to the wind tunnel tests. Frequency Response The preceding chapter described predictions of the elastic dynamics of the prototype. These characteristics were measured in the laboratory for comparison to the models. The measurements were made by exciting the system with an impulse and observing its response. To produce the impulse, a plastic hammer was used to strike to collar. The spectral response was taken from the load cell signals and from a single-axis acceler-ometer mounted on the collar. A single-axis accelerometer was mounted on a plug inserted into one of the collar roll bearings. By rotating the collar, the accelerometer could be oriented along any axis. The experiment was repeated with the accelerometer on the x, y, and z axes. In each case, the impulse was applied in the direction of the accelerometer axis. The mass of the collar assembly was ~10 lb and the cable pre-tension was 300 lb. Figure 12 shows a typical accelerometer response where the accelerometer was responding to displace-ments along the x or streamwise axis. A large ringing dominates the initial response. This mode decays rapidly to a sustained broadband signal. In the large initial response, a single mode dominates the signal and makes others invisible. Thus, it is from this sustained period that the analysis was performed.
-0 .2
0
0 .2
0 .4
0 .6
0 .8
1
Acc
ele
ratio
n(g
's)
0 10 20 30 40 50T im e (m s) E-7325
Figure 12. Typical accelerometer response.
The spectral response of the accelerometer to x,y,
and z impulses is shown in Figure 13. Because the hammer force could not be measured, the amplitudes cannot be compared between the three sequences. However, the relative amplitudes of the peaks within any signal show which modes are dominant.
0
0.5
1
1.5
2
2.5
3
3.5
0 400 800 1200 1600 2000
Frequency (Hz) E-7326
XYZ
PS
D
Figure 13. Spectra of accelerometer signals in three
axes show longitudinal modes. Each directional response contained several clear peaks. The variation in spectral position results from the variation of natural frequency with direction. Some modes were present at frequencies below those pre-dicted (Figure 11). Some modes above the predicted 350 Hz were also present. Results presented later in this section will show that the stiffness of the prototype is below that predicted by the analysis. This accounts for the presence of lower frequency modes. The higher frequencies are thought to originate from the natural modes of the frame and of the collar. The transverse mode response was determined from a comparison of the accelerometer and load cell data. Figure 14 shows the spectral responses from the x accelerations and one of the load cells. Modes that appear only in the accelerometer were attributed to transverse cable oscillations. The predicted frequency of the first transverse mode was 123 Hz. However, the spectral response shows substantial energy in a mode near 50 Hz. Higher harmonics were also present. These discrepancies between prediction and experiment lead to a review of the models.
0
0.5
1
1.5
2
2.5
3
PS
D
0 200 400 600 800 1000
Frequency (H z)
X -A cce l
Lo ad C ell(low er/righ t/rea r)
E-7341
Figure 14. Comparison of x-acceleration and load cell
spectra reveals transverse modes.

American Institute of Aeronautics and Astronautics
9
One model deficiency is the simple string assump-tion. Figure 15 shows why this simple model must be expanded. In the design analysis, we assumed that the mass of the load cell is large compared to that of the cable rendering the cable end point fixed. However, during the experiment, the load cells vibrated visibly. This occurred both in the impulse experiments and in the wind tunnel tests. The effect of the load cell motion is to reduce the frequency of oscillation, accounting for the 50 Hz mode. The right-hand sketch in Figure 15 shows how the cable assembly should more properly be modeled. This model would compensate for the motion of the load cell and turnbuckle.
Simple StringTurnbuckle
LoadCell
E-7324
Pin
Figure 15. Improved model is necessary to capture
transverse oscillatory behavior. A second key source of error is that the cables were not as stiff as anticipated at the modeling stage. Thus, the natural frequency of the cable truss is much lower than predicted. Improved cable models will be applied in the future. The higher frequencies in the spectral response probably resulted from the higher harmonics of the string modes. We had anticipated that higher harmonics would be small compared to the funda-mental, but it is clear from these spectra that higher cable harmonics must be considered to fully understand the frequency response. Motor Damping Experiments There is a danger that, during a dynamic test, a controller may fail to stabilize the model. This could result in angular oscillations of the model that could damage the model or test facility. To counter this danger, the experiments included a demonstration of a technique to damp out these oscillations using a motor and cable attached to the collar. Potentially, control software could detect unallowable oscillations and use the motor to restrain the model. The demonstration experiment is shown in Figure 16. A steel bar simulated the inertia of the model, and a pair of springs simulated the aerodynamic stiffness of a test article. A brushless motor was attached to the frame, and a pair of wires from the
motor to the collar caused the motor rotor and collar to
Bar
Springs
E-4638a
Controllerτ = -K θ Amp
Measured Angle
Figure 16. Active motor damping experiment.
move together in pitch. An encoder inside the motor was used to measure collar angular position. The bar was displaced from its resting position and released. The bar would oscillate several times before coming to rest. The angular motion of the collar was determined from an optical encoder mounted on the motor. The red trace in Figure 17 shows the measured natural angular response of the system when displaced.
-60
-40
-20
0
20
40
60
Ang
le(d
eg)
0 1 2 3 4 5T im e (s)
N a tu ra l
M o to r D a m p ed
E-7322
Figure 17. Motor damps oscillation of spring/bar
system. Next, closed-loop damping control was applied to the system. A torque opposing but proportional to the angular velocity was applied to the motor, as shown in Figure 16. A National Instruments FlexMotion board was used to implement the controller. Again, the bar was displaced and permitted to oscillate. As depicted by the blue trace in Figure 17, the oscillation amplitude was much smaller than in the uncontrolled experiment. This result shows that a motor can be used to artificially damp out model
American Institute of Aeronautics and Astronautics
10
oscillations, improving test system safety. Static Measurement Calibration A key capability of the cable suspension system is the measurement of static and dynamic loads on the test model. This project explored two techniques for cali-brating the load measurement hardware for the system.
Direct Method The first calibration technique was a direct method, in which we sought to formulate a matrix that would directly map the six load cell voltages to the three loads. Such a calibration takes the form
)oVV(AX −=
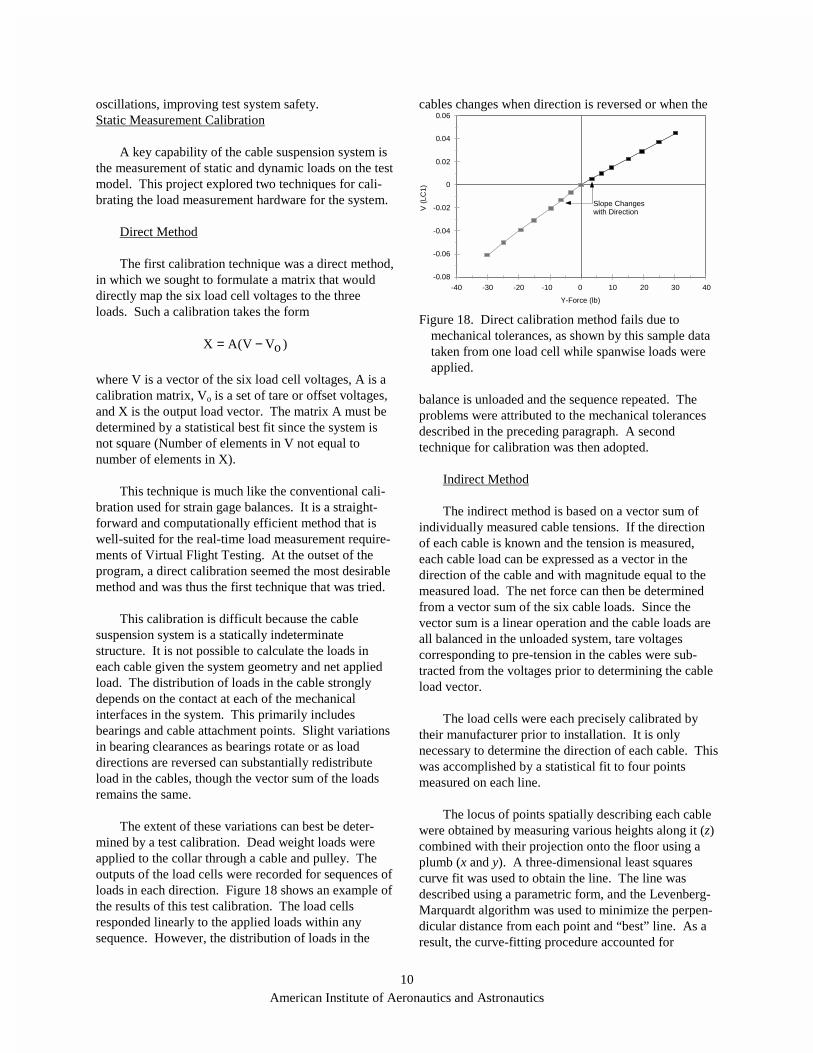
where V is a vector of the six load cell voltages, A is a calibration matrix, Vo is a set of tare or offset voltages, and X is the output load vector. The matrix A must be determined by a statistical best fit since the system is not square (Number of elements in V not equal to number of elements in X). This technique is much like the conventional cali-bration used for strain gage balances. It is a straight-forward and computationally efficient method that is well-suited for the real-time load measurement require-ments of Virtual Flight Testing. At the outset of the program, a direct calibration seemed the most desirable method and was thus the first technique that was tried. This calibration is difficult because the cable suspension system is a statically indeterminate structure. It is not possible to calculate the loads in each cable given the system geometry and net applied load. The distribution of loads in the cable strongly depends on the contact at each of the mechanical interfaces in the system. This primarily includes bearings and cable attachment points. Slight variations in bearing clearances as bearings rotate or as load directions are reversed can substantially redistribute load in the cables, though the vector sum of the loads remains the same. The extent of these variations can best be deter-mined by a test calibration. Dead weight loads were applied to the collar through a cable and pulley. The outputs of the load cells were recorded for sequences of loads in each direction. Figure 18 shows an example of the results of this test calibration. The load cells responded linearly to the applied loads within any sequence. However, the distribution of loads in the
cables changes when direction is reversed or when the
-0.08
-0.06
-0.04
-0.02
0
0.02
0.04
0.06
V(L
C1)
-40 -30 -20 -10 0 10 20 30 40
Y-Force (lb) E-8086
Slope Changeswith Direction
Figure 18. Direct calibration method fails due to
mechanical tolerances, as shown by this sample data taken from one load cell while spanwise loads were applied.
balance is unloaded and the sequence repeated. The problems were attributed to the mechanical tolerances described in the preceding paragraph. A second technique for calibration was then adopted.
Indirect Method The indirect method is based on a vector sum of individually measured cable tensions. If the direction of each cable is known and the tension is measured, each cable load can be expressed as a vector in the direction of the cable and with magnitude equal to the measured load. The net force can then be determined from a vector sum of the six cable loads. Since the vector sum is a linear operation and the cable loads are all balanced in the unloaded system, tare voltages corresponding to pre-tension in the cables were sub-tracted from the voltages prior to determining the cable load vector. The load cells were each precisely calibrated by their manufacturer prior to installation. It is only necessary to determine the direction of each cable. This was accomplished by a statistical fit to four points measured on each line.
The locus of points spatially describing each cable were obtained by measuring various heights along it (z) combined with their projection onto the floor using a plumb (x and y). A three-dimensional least squares curve fit was used to obtain the line. The line was described using a parametric form, and the Levenberg-Marquardt algorithm was used to minimize the perpen-dicular distance from each point and “best” line. As a result, the curve-fitting procedure accounted for

American Institute of Aeronautics and Astronautics
11
uncertainty in the measured x, y, and z positions. Implicit in this calibration method is an assumption that the truss is stiff, therefore, the directions do not change as loads are applied. Initial stiffness estimates for the truss indicate that this would be the case. However, the truss was more flexible than anticipated. The effects of this erroneous assumption were apparent in the calibration results. Figure 19 compares the loads measured from this calibration scheme to the actual applied loads. A perfect calibration would produce points that lie on the line with a slope of 1, indicated on each plot. The
35
35
5
0 5 10 15 20 25 30 3 5A c tua l Loa d (lb )
Id ea lU pU pD o wnD o wn
U p and D ow n
0
5
10
15
20
25
30
35
Me
asu
red
Lo
ad
(lb)
Id e a lR ig h tR ig h t
L e ftL e ft
Le ft & R ight
0 5 1 0 1 5 2 0 2 5 3 0A ctua l L oad ( lb )
35
Id ea lB a ckB a ckF ron t
Fron t & Back
0
5
10
15
20
25
30
Me
asu
red
Lo
ad
(lb
)
0 5 10 1 5 2 0 2 5 3 0 3 5A c tu a l L oad (lb ) E-7340
0
10
15
20
25
30
Me
asu
red
Lo
ad
(lb)
Figure 19. Comparison of loads measured by indirect
calibration to applied loads. points, however, deviate from this line by more than an allowable calibration error of 0.5% f.s.. The points fit best for left and right (y-axis) loads. In all cases, the linearity is excellent. Most lines fit to within 0.3% f.s., and all are within 0.6% f.s..
The problem of load asymmetry has not been com-
pletely remedied. The y-direction (middle, Figure 19) is the best case in this calibration, though the individual load cell measurements were shown to be asymmetric in the previous section (Figure 18). The truss is also stiffer in the y-direction than in the x or z direction, and the indirect calibration is thus least sensitive to defor-mation in this direction.
The errors in the indirect calibration have been attributed to the weakness of the stiff truss assumptions. Application of a few test loads showed that the collar was moving more than the distance predicted by the design models. Thus, elastic displacements of the truss must be accommodated mathematically or reduced by the use of rods in place of cables. To understand the influence of truss deflection, consider the sample system shows in Figure 20. This is a six-wire system like the VFT system, but has been projected into a single plane to simplify the explan-ation. For example, note that if θ=90 deg., the tension in cables 2 and 5 have no component in the direction of the force F. A stiff-truss analysis would only include the tensions in the other four cables when computing the force F from measured tension.
θ
T1
T3
T2
T6
T5
T4
F, δ
Top View
E-7339
θ
Figure 20. Model system and nomenclature for elastic

American Institute of Aeronautics and Astronautics
12
calibration effects analysis. However, suppose the truss deflects slightly in the direction of F. Now, cables 2 and 5 have small compo-nents in the direction of F. Although the cosine of θ is small, the large pre-tensions in the cables contributes significantly to supporting the load F. This is the mechanism by which elasticity impacts the calibration. The indirect method can still be applied to the system if the deflections can be determined. The dis-placement of the collar need not be measured directly. If the elastic properties of the cables can be well-determined, the displacement can also be calculated from the tensions. Modified direction vectors can then be calculated and used in the calibration. The indirect method is further complicated at higher speeds where aerodynamic drag will deform the cables, changing the directions and increasing overall tension. Predicting the aerodynamic shape change will greatly complicate the calibration. Because the process is very complex, it is likely that the next prototype will employ a more conventional strain gage balance integrated into the collar.
Laboratory Testing Summary
The laboratory tests provided a review of the design models, as well as experience in assembling and using a wire suspension system. Elastic modes identified through impulse response tests showed that more detailed models are necessary to accurately predict the dynamic behavior of the system. Improved models will also advance the knowledge of the static elastic properties of the system, reliable dynamic force measurements can be made. The latter may be the most important result of improved modeling. The common feature of the models and the experiments is that the system exhibits oscillations over a broad range of frequencies. The conventional direct calibration method failed to produce a directionally independent relationship between load cells and applied loads. An indirect method tried in this effort provides a better method, because it does not rely on a repeatable distribution of loads in the six wires. We believe, though, that a strain gauge balance within the roll collar will ultimately be necessary to obtain meaningful force measurements.
Wind Tunnel Tests A preliminary wind tunnel test showed the feasi-bility of testing a model on a cable suspension and
measured the aerodynamic interference of the cables. The test was conducted at the Georgia Tech AeroControls wind tunnel. The tunnel has a 42 in. x 43 in. test section and is driven by an upstream fan. The wire suspension prototype test section was attached at the open exit of the tunnel. The model for the wind tunnel test was a modified basic finner.7 The body of the model was a thin-walled PVC tube. The nose was a tangent ogive cut from balsa wood. A brass weight was added to the base of the nose cone to balance the model in the collar. The model was fitted with a pair of radio-controlled servo motors linked to the fins. One motor moved a pair of opposing fins to produce pitch about the mounting axis. The other motor moved the remain-ing pair of fins to produce roll. Model power was provided by a set of rechargeable batteries. The life of the battery pack was approximately 30 minutes. In tests of larger models, much greater power will be required, and test costs may dictate that the runs be much longer. We anticipate a need to pass power to the model through slip rings in future systems.
Figures 21 and 22 show the model maneuvering in the wind tunnel mounted on the wire suspension system. Figure 21 shows three frames acquired in a right-to-left yaw maneuver, while the other maneuvers (Figure 22) shows a pitch maneuver. Rapid motion about all three axes of motion was accomplished by deflecting the model fins. The freestream velocity here was 82 ft/s.
In the pictures just discussed, the model is fitted with control surface extension on the fins that produce rolling motion. The model was not able to roll before these were attached. It was impossible to determine whether this was due to aerodynamic blocking of the fins by the collar, such that the flow over them was insufficient to produce a rolling moment, or whether the rolling moment was simply too small to overcome bearing drag. The problem of aerodynamic interference may be remedied if the system is scaled to a larger model because the collar becomes smaller in relation to the model. The bearing drag problem will need to be addressed more carefully in the future, but as the tests move to higher speeds, the bearing drag will become small relative to the aerodynamic moments.
One factor that may contribute to increased
bearing drag is that the oil in the bearings tended to blow out during the test. It will be necessary to provide additional shielding to the bearings to prevent air from

American Institute of Aeronautics and Astronautics
13
passing through them.
(a) t=0 seconds
(b) t=0.73 seconds
(c) t=1.06 seconds
Figure 21. Test model executes yaw maneuver.
(a) t=0 seconds
(b) t=0.30 seconds
(c) t=0.80 seconds
Figure 22. Test model executes pitch-up maneuver.
American Institute of Aeronautics and Astronautics
14
Summary
PSI built and tested a prototype wire suspension system. The system was designed to support a model in a wind tunnel while allowing it to roll, pitch, and yaw. The device was also able to measure aerodynamic loads on the test model. The first task was to develop a set of engineering models to predict the behavior of candidate designs. These were used to design the prototype system. A complete working prototype was built. A set of labor-atory tests showed that more detailed mathematical models of system components are needed to accurately predict elastic dynamics of the system. However, the early models predicted that a wide range of frequencies can be excited in the wires, and that the frequencies of the natural modes are dependent on the angle of the excitation force. This general trend was confirmed in the experiments. Improving the predictive models and devising methods to damp elastic oscillations will be part of a future effort. Safety of the test apparatus is a paramount concern for tunnel operators. Because the wire suspension device will be used to test models at extreme conditions where their dynamics may not be well understood, there is a danger that the model might enter uncontrolled oscillations. This initial effort included tests of a tech-nique for damping oscillations with a brushless motor under active control. The tests in the laboratory showed that it is necessary to indirectly calibrate the force measurement capability if forces are to be determined from cable tension measurements. The geometry of the wires was used to determine the direction along which tensions were applied, and the load cell measurements determine the magnitudes of the six tension loads. From these, the net model restraining force vector was calculated. Results indicated that it is difficult to get accurate and repeatable calibration results without employing a detailed elastic model to account for cable direction variations. Thus, a strain gage balance will be mounted within the collar in future prototypes. The program concluded with a wind tunnel demonstration. This test demonstrated that a model can be installed and maneuvered in the tunnel on a wire suspension system. The project demonstrated the feasibility of a wire suspension system for wind tunnel virtual flight testing. Engineering challenges - specifically improved
mechanical models, force measurement, and reduction of aerodynamic interference - must receive further attention before the system can be installed and used for production wind tunnel testing.
References 1. Goals of the Navy Air & Surface Weapons
Technology (ASWT) Program, Program Manager: Mr. James Chew, Office of Naval Research.
2. Ratliff, C.L. and Marquart, E.J., “An Assessment of a Potential Flight Test Technique: Virtual Flight Testing,” AIAA 95-3472, AIAA Atmospheric Flight Mechanics Conference, August 7-9, 1995.
3. Bennett, Robert M., Farmer, Moses G., Mohr, Robert L., and Hall, W Earl Jr., “Wind-Tunnel Technique for Determining Stability Derivatives from Cable Mounted Models”, J. Aircraft, Vol. 15, No. 5, May, 1978.
4. Sasa, S., Takizawa, M., Shimomura, T., and Nonaka, O., “Spaceplane Longitudinal Aerodynamic Parameter Estimation by Cable Mount Dynamic Wind Tunnel Test”, SAE Transactions, V100, n Sect 1, Pt2, 911980, 1991, P2017-2025.
5. Yanigahara, M., Suzuki, S., Kayaba, S., Murota, K., “Estimation of Spaceplane Lateral Directional Stability and Control Derivatives from Dynamic Wind Tunnel Tests”, SAE Transactions, V100, n Sect 1, Pt2, 911979, 1991, P2008-2016.
6. Gebert, G., Kelly, Joy, and Lopez, Juan, "Virtual Flight Test (VFT) Modeling and Assessment," Technical Report, Sverdrup Technology, Inc, TEAS Group, 30 September 1998.
7. Uselton, B.L. and Jenke, L.M., "Experimental Missile Pitch- and Roll-Damping Characteristics at Large Angles of Attack," J. Spacecraft, Vol. 14, No. 4., pp. 241-247, April 1977.
Acknowledgement
This material is based upon supported by USAF/
Arnold Engineering Development Center(AEDC) under Phase I SBIR Contract F40600-00-C-0002. The contract monitor was Ron Bishel. The authors thank Frank Steinle, Clark Lawrence, and Ben Mills of Sverdrup/AEDC for their helpful input.
Disclaimer
Any opinions, findings and conclusions, or recommendations expressed in this material are those of the authors and do not necessarily reflect the views of the U.S. Air Force or AEDC.