initial results on the pom-ppmv development
TRANSCRIPT

Initial Results on the POM-PPMV
Development
Pavel Etingov (PNNL) and
Marianna Vaiman (V&R Energy)
November 18, 2020
PNNL-SA-157955

2
Project Background
• DOE Technology Commercialization Funds (TCF) project “Integration of PNNL Synchrophasor Analysis Tools into V&R Energy Real-Time Platform”
• The goal of the project is to integrate software applications for synchrophasor measurement analysis developed by Pacific Northwest National Laboratory (PNNL) into V&R Energy’s industry-grade real-time platform.
• PNNL
▪ Pavel Etingov
▪ Jim Follum
▪ Slaven Kincic
▪ Urmila Agrawal
▪ Frank Tuffner
▪ Heng Wang
▪ Renke Huang
• V&R Energy
▪ Marianna Vaiman
▪ Michael Vaiman
▪ Mark Povolotskiy
▪ Mikhail Karpoukhin

3
PNNL Tools Integration in V&R Platform
PNNL Open-Source Platform for Synchrophasor Analysis V&R ROSE platform

4
Power Plant Model Validation Tool (PPMV)
• Supports GE PSLF and Siemens/PTI PSS®E Play-In function for generator model validation.
• Maintains the database of model validation studies (projects).
• Maintains the database of the historic events.
• Maintains the database of the power plants.
• Advanced visualization capabilities.
• Automatically generates reports.
• Performs sensitivity analysis.
• Supports interface to external model calibration modules.

5
• PMU data processing
• Event detection
▪ Out of range
▪ Transient oscillations
▪ Forced oscillations
▪ Mode meter
▪ Wind ramps
• End-users notification via alarms and visualizations
Archive Walker

6
• Event detection
• Date extraction
• Passing Data to PPMV tool
PPMV Integration with Archive Walker

7
• PMU data stream stored in PDAT files
• Data link between AW and V&R platform
Testing Setup
DBPMU
streamAW
Event
Detection
PPMVAPI
Setup for
individual
plants
Automatic
play-inReporting
Advanced
metrics
Results
Archiving

8
• PPMV tool is integrated with POM-ROSE and implemented as a Tab in the POM-ROSE interface
• Works in Off-Line and Real-Time modes
• Linked steady-state and dynamic parameters
• The tool is connected with:
▪ The system one-line diagram to facilitate case creation for PPMV play-in functionality
▪ POM Data Tables for fast and easy viewing of both steady-state and dynamic parameters of the original planning data and files created for PPMV play-in functionality
PPMV Implementation in POM-ROSE

9
• Planning interconnection-wide WECC power flow case is used as the basis to create reduced cases for PPMV analysis under the project
• The steady state model includes the generator(s) under test and the associated network elements up to the point of PMU measurement
Creating Power Flow Cases for PPMV Play-In Functionality
10
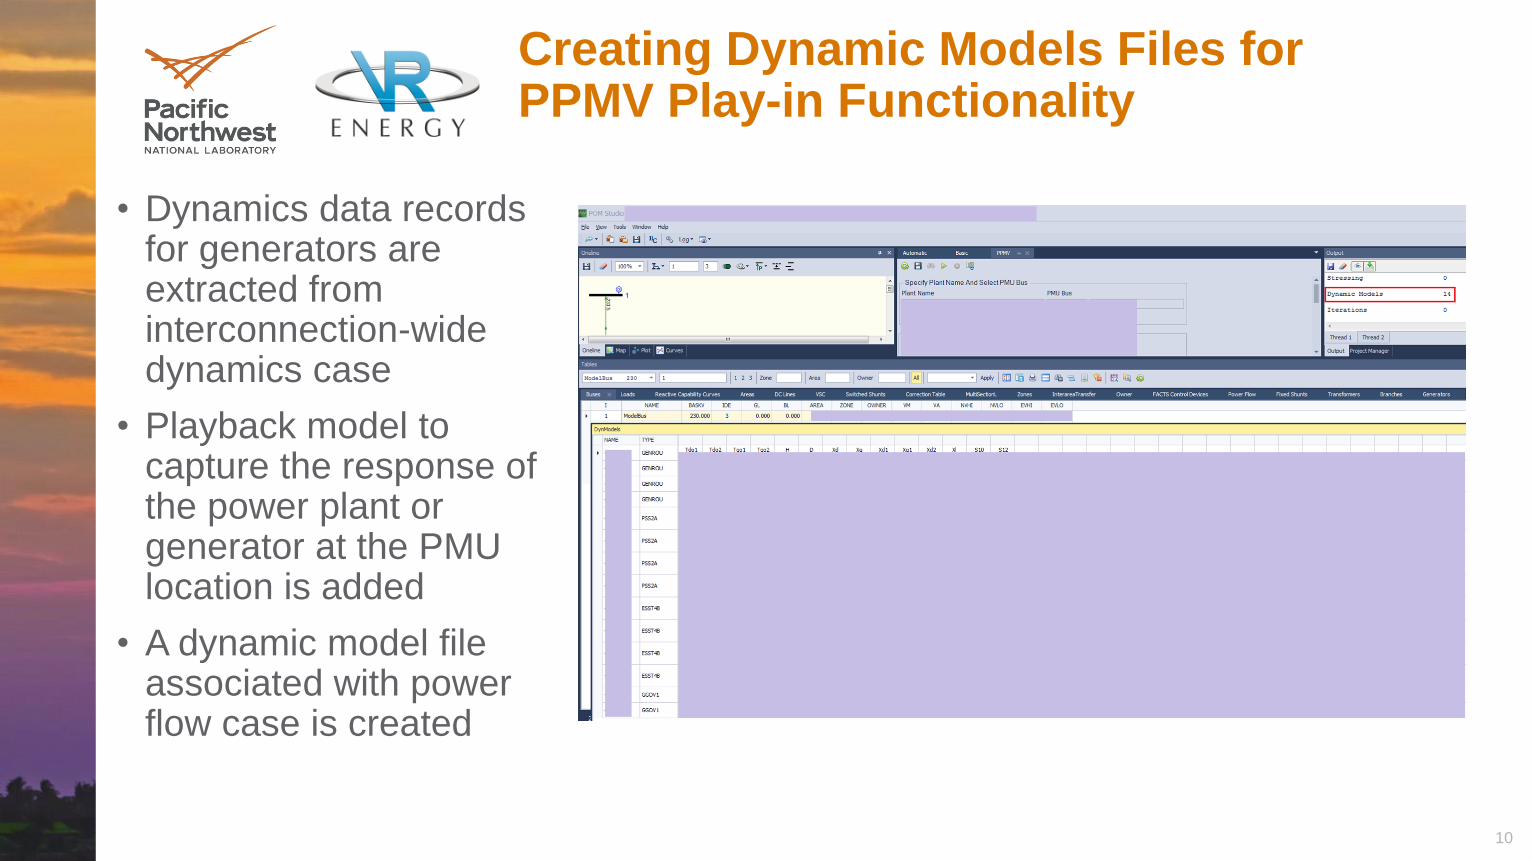
• Dynamics data records for generators are extracted from interconnection-wide dynamics case
• Playback model to capture the response of the power plant or generator at the PMU location is added
• A dynamic model file associated with power flow case is created
Creating Dynamic Models Files for PPMV Play-in Functionality

11
• PPMV is integrated with POM-TS module to enable time-domain simulation for play-in functionality
▪ Time-domain simulation available is invoked directly from the PPMV
▪ Bus voltage magnitude, frequency, and active and reactive power flows are played-back
POM-ROSE PPMV

12
• PPMV is invoked for one or multiple simulations:
▪ For one power plant, runs multiple dynamic models files
▪ For the same dynamic models file, runs multiple events (e.g., use multiple PMU data files)
POM-ROSE PPMV

13
Ongoing Efforts to Improve Model Validation Metrics
• Metrics for quantifying the model validation results has been a challenge for the automation
• Some existing metrics include simple root-mean square calculation
▪ Does not give an accurate analysis
• Ongoing effort is geared toward developing metrics to quantify the model validation results and further extend this work for model calibration
• Some initial work and results presented in: Agrawal, Urmila; Pavel Etingov; Renke Huang, "Initial Results of Quantification of Model Validation Results Using Modal Analysis", in Proceedings of the 2020 PES General Meeting.
Similarity measure Original Model Calibrated Model
Magnitude 0.3383 0.9622
Phase 0.7231 0.9218

14
Basic Overview of the Quantifying Metrics
• Metrics based on comparing system modes observed in the PMU measurements and the model-based response
• Mismatch error calculated for each system mode for magnitude and phase
• All these errors for several modes can combined to obtain a single metric for magnitude and phase
Original model Mode-1 Mode-2 Mode-3 Mode-4 Similarity
MeasureWeight -factor 1 0.115 0.105 0.076
Mag_Error 0.605 1 0.552 0.667 0.3383
Phase_Error 0.218 1 -0.088 0.067 0.7231
Calibrated model Mode-1 Mode-2 Mode-3 Mode-4 Similarity
MeasureWeight -factor 1 0.115 0.105 0.076
Mag_Error 0.010 0.138 0.055 0.066 0.9622
Phase_Error -0.071 -0.049 -0.045 -0.239 0.9218

15
Conclusions and Future Work
• PNNL and V&R developed requirements and specification for new PPMV module
• V&R implemented a prototype version of POM-PPMV
• PNNL collected a set of events for PPMV testing
• PNNL working on the advanced metrics for model validation results quantification
• Next steps:
▪ Testing and benchmarking by PNNL and V&R
▪ Working with PacifiCorp to test and validate POM-PPMV
▪ Integration with AW for automatic event detection
▪ Release by the end of 2021

Thank you
16