infrared spectra and molecular constants of gaseous tritium bromide and tritium chloride
TRANSCRIPT
Infrared Spectra and Molecular Constants of Gaseous Tritium Bromide and TritiumChlorideLlewellyn H. Jones and Eugene S. Robinson Citation: The Journal of Chemical Physics 24, 1246 (1956); doi: 10.1063/1.1742749 View online: http://dx.doi.org/10.1063/1.1742749 View Table of Contents: http://scitation.aip.org/content/aip/journal/jcp/24/6?ver=pdfcov Published by the AIP Publishing Articles you may be interested in Vibrational Spectra and Molecular Potential Fields of Mercurous Chloride, Bromide, and Iodide J. Chem. Phys. 50, 2130 (1969); 10.1063/1.1671343 Crossed Molecular Beam Reactions of Tritium Bromide J. Chem. Phys. 46, 4834 (1967); 10.1063/1.1840642 Heat Contents of Molten Zinc Chloride and Bromide and the Molecular Constants of the Gases J. Chem. Phys. 40, 978 (1964); 10.1063/1.1725291 Infrared Spectrum of Mercuric Chloride and Bromide J. Chem. Phys. 25, 397 (1956); 10.1063/1.1742933 Microwave Spectra and Molecular Constants of Tertiary Butyl Chloride, Bromide, and Iodide J. Chem. Phys. 18, 994 (1950); 10.1063/1.1747834
This article is copyrighted as indicated in the article. Reuse of AIP content is subject to the terms at: http://scitation.aip.org/termsconditions. Downloaded to IP:
130.70.241.163 On: Fri, 19 Dec 2014 15:14:37
1246 D. F. EVANS
pounds and it was shown by SalomonlO that treatment of rubber and similar olefinic polymers with silver salts resulted in the formation of insoluble complexes. However, it has been found in the present work that when polystyrene is shaken with a strong alcoholic solution of silver perchlorate, a viscous solution is obtained, from which the polystyrene can be completely precipitated unchanged by dilution with water. The samples of polystyrene used were completely insoluble in ethyl alcohol and in strong alcoholic solutions of magnesium perchlorate. The absorption spectrum of polystyrene dissolved in 2.9 M alcoholic silver perchlorate is shown in Fig. 3. It can be seen that an
10 G. Salomon, Cationic Polymerization and Related Complexes, P. H. Plesch. editor (W. Hefler and Sons Ltd., Cambridge, 1953), p.57.
THE JOURNAL OF CHEMICAL PHYSICS
additional strong absorption is superimposed upon the normal 2600 A aromatic band. A similar, though not so marked, difference was obtained by Andrews and Keeferll for toluene, where the existence of the AgT+ and Ag2r++ ions was demonstrated. Accordingly, it seems likely that the Ag+ ions are attached to the benzene rings of the polystyrene chain to form a rather unusual type of polyelectrolyte.
ACKNOWLEDGMENTS
I should like to thank Professor R. S. Mulliken for helpful discussions. Some preliminary work was carried out at the University of Oxford, to which I am indebted for an I.C.I. fellowship.
11 R. M. Keefer and L. J. Andrews, J. Am. Chern. Soc. 74, 640 (1952).
VOLUME 24. NUMBER 6 JUNE. 1956
Infrared Spectra and Molecular Constants of Gaseous Tritium Bromide and Tritium Chloride*
LLEWELLYN H. JONES AND EUGENE S. ROBINSON
Los Alamos Scientific Laboratory of the University of California, Los Alamos, New Mexico
(Received August 16, 1955)
The infrared spectra of TC)3·, TC)37, and TBr79 .8! have been observed using a CaF2 prism. Throughout this paper the notation TBr79 .8! indicates the natural isotopic mixture of Br79 and Br8!, and lack of spectral resolution of the two isotopes. A least squares treatment of the data yielded the following molecular constants for TBr79.81, TC)3·, and TCI", respectively:
Vo= 1519.26, B.= 2.899, a.= 0.046, D.= 4.5X1O-5
1739.10, 3.746, 0.061,
1735.51 cm-! 3.723 cm-! 0.066 em-1
6.8X 10⁻⁵ cm-1 7.7 X 10-·
INTRODUCTION
T HE infrared spectra of gaseous TBr and TCI were observed using a prism spectrometer. The isotopic
separation for the levels of TBr79 and TBr81 was not resolved. Throughout this paper TBr79 •81 indicates the natural isotopic mixture of Br79 and Br81 and lack of spectral resolution of the two isotopes. Most of the rotation-vibration peaks of TCp· and TCp7 displayed resolution of the two isotopic species.
Several reports are available for comparison. Rosenblum and Nethercot! recently reported microwave frequencies for TI127, TBr79 , and TBr81. Also, Burrus and co-workers2 reported microwave spectra of TCP·, TCl37, TBr79 , and TBr81. The independent results on TBr79 and TBr8! agree well with each other. The infrared spectra of HCp·, HCI37, DCP5, DCP7, HBr79,
* This work was sponsored by the U. S. Atomic Energy Commission.
1 B. Rosenblum and A. H. Nethercot, Jr., Phys. Rev. 97, 84 (1955).
2 Burrus, Gordy, Benjamin, and Livingston, Phys. Rev. 97, 1661 (1955).
HBr81, DBr79, and DBr81 have all been measured with high resolution.3- s
EXPERIMENTAL
TCI was prepared by reduction of AgCI with T2 at about 700°C. TBr was prepared by reaction of T 2 and Br2 at a hot filament. The absorption cell was glass with KBr windows sealed on with Apiezon W. It contained a Teflon insert to reduce the volume without obscuring the light path.
The spectra were recorded with a Perkin-Elmer Model 12-C spectrometer converted to double pass and using a calcium fluoride prism.
3 (DBr) F. L. Keller and A. H. Nielsen, J. Chern. Phys. 22, 294 (1954).
4 (HCI) (a) Mills, Thompson, and Williams, Proe. Roy. Soc. (London) A218, 29 (1953). (b) G. Herzberg, SPectra of Diatomic Molecules (D. Van Nostrand Company, Inc., New York, 1950), pp. 55, 534.
• (DCI) J. Pickworth and H. W. Thompson, Proc. Roy. Soc. (London) A218, 37 (1953).
6 (HBr) Thompson, Williams, and Callomon, Speetro-chim. Acta 5, 313 (1952).
This article is copyrighted as indicated in the article. Reuse of AIP content is subject to the terms at: http://scitation.aip.org/termsconditions. Downloaded to IP:
130.70.241.163 On: Fri, 19 Dec 2014 15:14:37
TCI AND TBr SPECTRA AND MOLECULAR CONSTANTS 1247
Calibra tion of the spectrometer in the region of interest (1600-1850 cm-I for TCI and 1400-1600 cm-I
for TBr) was a problem. The spectrum of water vapor provides many sharp peaks from 1300-2000 em-I. The frequencies of many of these peaks are reported by Downie and co-workers7 for calibration purposes. However, on our spectrometer these frequencies scatter about a smooth Friedel-McKinney8 curve by more than ± 1 em-I. These values were collected by Downie and co-workers7 from the low resolution (rock salt prism) spectra of Oetjen and co-workers9 and the high reso-
TABLE 1. Observed and calculated frequencies for TBr79,81.
R 19 18 17 16 15 14 13 12 11 10 9 8 7 6 5 4 3 2 1 o
P 1 2 3 4 5 6 7 8 9
10 11 12 13 14 15 16 17 18 19
Vern -1 observed
1613.08 1609.69 1605.76 1601.94 1597.83 1593.75 1589.33 1585.08 1580.88 1576.18 1571.67 1566.85 1561.82 1556.92 1551.87 1546.64 1541.41 1535.80 1530.46 1524.98
1513.46 1507.64 1501.68 1495.68 1489.62 1483.32 1477.11 1470.78 1464.31 1457.80 1451.26 1444.47 1437.61 1430.78 1423.89 1416.84 1409.51 1402.77 1395.10
Vern -1 calculated
1613.23 1609.57 1605.81 1601.93 1597.92 1593.80 1589.57 1585.23 1580.77 1576.20 1571.53 1566.76 1561.87 1556.89 1551.81 1546.62 1541.34 1535.96 1530.49 1524.92
1513.51 1507.66 1501.73 1495.71 1489.60 1483.40 1477.11 1470.75 1464.30 1457.76 1451.14 1444.44 1437.67 1430.81 1423.86 1416.84 1409.74 1402.56 1395.30
vobs-Vculc
-0.15 cm-1
+0.12 -0.05 +0.01 -0.09 -0.05 -0.24 -0.15 +0.11 -0.02 +0.14 +0.09 -0.05 +0.03 +0.06 +0.02 +0.07 -0.16 -0.03 +0.06
-0.05 -0.02 -0.05 -0.03 +0.02 -0.08
0.00 +0.03 +0.01 +0.04 +0.02 +0.03 -0.06 -0.03 +0.03
0.00 -0.23 +0.21 -0.20
lution (grating) spectra of Nielsen.l° With our spectrometer in the region of interest an accuracy of better than ±0.2 cm-I should be attainable. Nielsen's spectra show many peaks well enough separated to be resolved by our spectrometer. However, as measured by our instrument, even these scatter by ±0.5 cm-1 about a
7 Downie, Magoon, Purcell, and Crawford, J. Opt. Soc. Am. 43,941 (1953).
8 D. S. McKinney and R. A. Friedel, J. Opt. Soc. Am. 38, 222 (1948).
9 Detjen, Kao, and Randall, Rev. Sci. Instr. 13, 515 (1942). 10 H. H. Nielsen, Phys. Rev. 59, 656 (1941).
1400
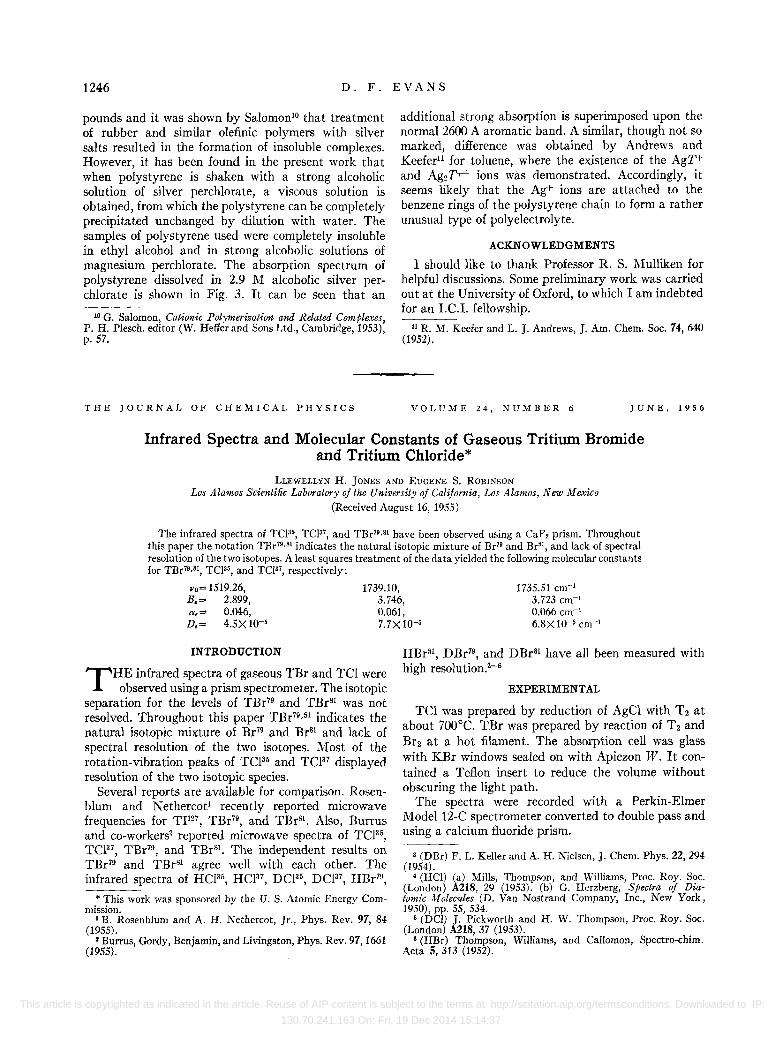
T Sr Fundamental
Pressure 30 em Hg
Path 10 em
1500 Silt;; 1 cm-'
FIG. 1. Infrared absorption spectrum of the fundamental vibration-rotation band of TBr79 ,81 (the TBr79-TBr81 splitting is not resolved).
smooth Friedel-McKinney curve. Therefore, as calibration standards we have used the CO frequencies of Plyler and co-workers,ll and DCI frequencies of Pickworth and Thompson,6 the DBr frequencies of Keller
P'17
1600em-' 1650
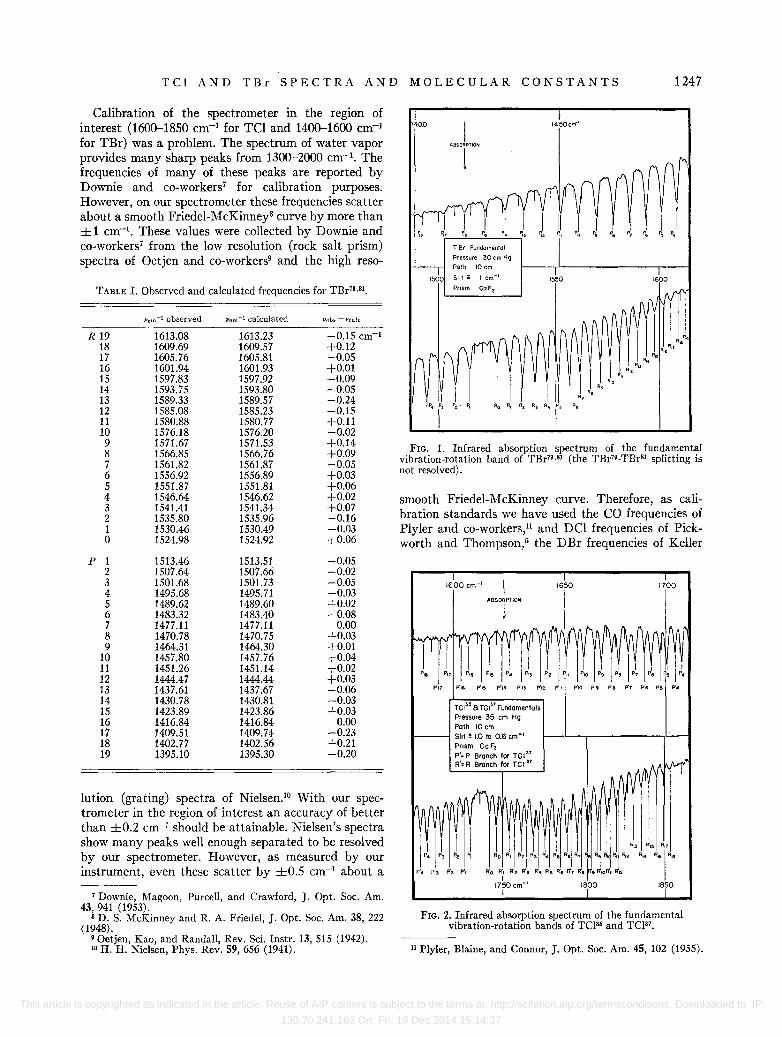
TCI35 a Tel
31 Fundamentals Pressure 35 em Hg Poth 10 em Slit' 1.0 to 0.6 em-' Prism COF2 p'. P Bronch for Tel!1 R'. R Bronch for Te ,l7
FIG. 2. Infrared absorption spectrum of the fundamental vibration-rotation bands of TCj36 and TCj37.
11 Plyler, Blaine, and Connor, J. Opt. Soc. Am. 45, 102 (1955).
This article is copyrighted as indicated in the article. Reuse of AIP content is subject to the terms at: http://scitation.aip.org/termsconditions. Downloaded to IP:
130.70.241.163 On: Fri, 19 Dec 2014 15:14:37
1248 L. H. JONES AND E. S. ROBINSON
TABLE II. Observed and calculated frequencies for TCp5. TABLE III. Observed and calculated frequencies for TCj37.
Vern -1 observed Vcm-1 calculated Vobs -Jlcaic Jicm-1 observed Vern -1 calculated Vobs -veale
R 18 1853.75 1853.63 +0.12 cm-I R13 1824.92 1824.90 +0.02 cm-I
17 1849.07 1849.08 -0.01 12 1819.63 1819.36 +0.27 16 1844.27 1844.34 -0.07 11 1813.55 1813.70 -0.15 15 1839.29 1839.41 -0.12 10 1808.02 1807.91 +0.11 14 1834.23 1834.31 -0.08 9 1801.95 1802.00 -0.05 13 1828.84 1829.04 -0.20 8 1796.06 1795.95 +0.11 12 1823.51 1823.58 -0.07 7 1789.90 1789.77 +0.13 11 1817.98 1817.97 +0.01 6 1783.58 1783.45 +0.13 10 1812.16 1812.19 -0.03 5 1777.11 1776.99 +0.12 9 1806.30 1806.26 +0.Q4 4 1770.39 1770.43 -0.04 8 1800.24 1800.23 +0.01 3 1763.63 1763.71 -0.08 7 1793.83 1793.97 -0.14 2 1756.86 1756.86 0.00 6 1787.56 1787.56 0.00 1 1749.95 1749.87 +0.08 5 1780.95 1781.04 -0.09 0 1742.71 1742.76 -0.05 4 1774.17 1774.37 -0.20 3 1767.59 1767.58 +0.01 P 1 1728.11 1728.13 -0.02 2 1760.66 1760.65 +0.01 2 1720.55 1720.62 -0.07 1 1753.60 1753.59 +0.01 3 1712.82 1712.98 -0.16 0 1746.43 1746.41 +0.02 4 1705.45 1705.22 +0.23
5 1697.53 1697.34 +0.19 P 1 1731.93 1731.67 +0.26 6 1689.26 1689.32 -0.06
2 1724.12 1724.12 0.00 7 1681.18 1681.21 -0.03 3 1716.42 1716.45 -0.03 8 1672.88 1672.97 -0.09 4 1708.53 1708.67 -0.14 9 1664.70 1664.62 +0.08 5 1700.76 1700.77 -0.01 10 1656.19 1656.16 +0.03 6 1692.71 1692.76 -0.05 11 1647.47 1647.60 -0.13 7 1684.60 1684.62 -0.02 12 1639.00 1638.94 +0.06 8 1676.43 1676.41 +0.02 13 1630.30 1630.28 +0.02 9 1668.01 1668.08 -0.07 14 1621.33 1621.33 0.00
10 1659.54 1659.56 -0.02 15 1612.19 1612.40 -0.21 11 1650.86 1650.98 -0.12 16 1603.30 1603.38 -0.08 12 1642.17 1642.28 -0.11 17 1594.22 1594.30 -0.08 13 1633.40 1633.48 -0.08 18 1584.77 1585.15 -0.38 14 1624.80 1624.57 +0.23 15 1615.53 1615.54 -0.01 16 1606.32 1606.39 -0.07 17 1596.96 1597.14 -0.18 by a Friedel-McKinney equation of the form
B
and Nielsen,3 and the CH4 frequencies of Nielsen and V2=V02+_--, (1)
Nielsen,12 In the case of the diatomic gases we used the No-N
frequencies which the investigators3•6.11 calculated from where B, vo2, and No are constants and N is the spec-the derived molecular constants rather than the indi-vidual observed frequencies. The former are derived
trometer drum reading. For the particular orientation
from the latter, but the random errors of the original of the CaF 2 prism in our spectrometer, vo2 = 47 900, B=24.95630X10⁶
, and N o=23.003. The deviations investigations are eliminated. It was possible to fit the were less than ±0.25 em-I. Therefore, the same equa-CO, DBr, and DCI calibration points from 2082 cm-I tion was used to determine the frequencies of the to 1715 em-I, and the CH4 peaks from 1310-1360 em-I, TBr79 .8t, TCp6, and TCp7 peaks.
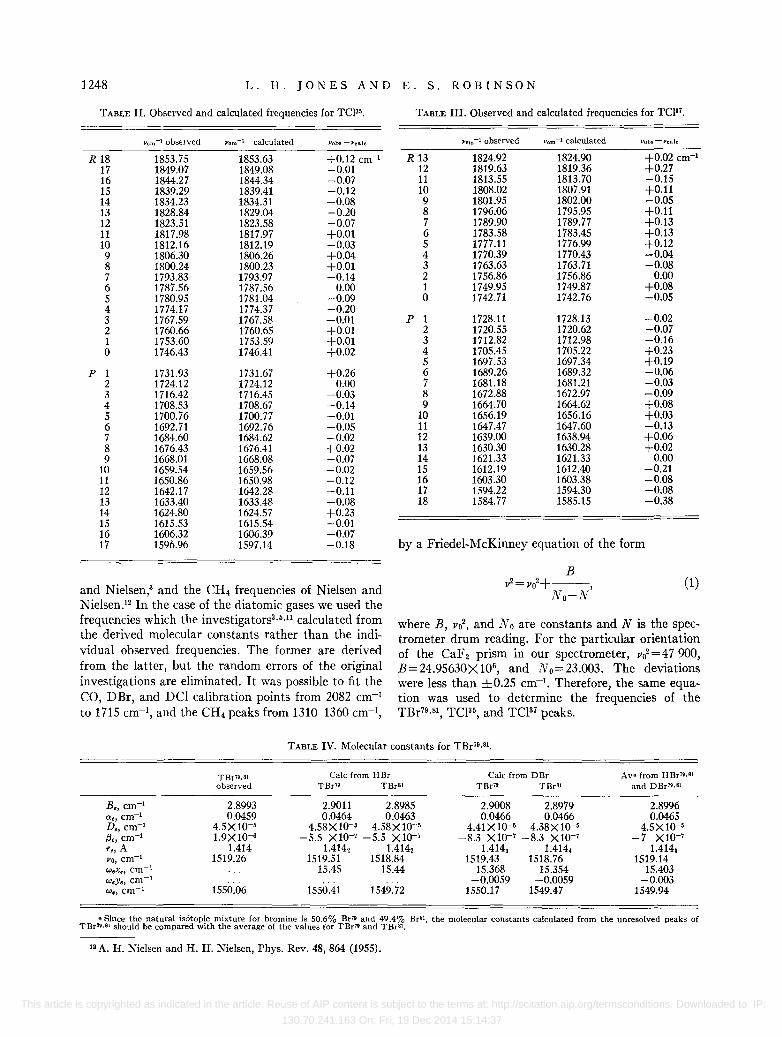
Be, cm-I
ae, cm-1
D" cm-I
{:J" cm-I
r" A vo, cm-1
WeXe, cm-1
WeYe, cm- l
We, cm- 1
TBr79 ,81
observed
2.8993 0.0459
4.5XlO-& 1.9XlO-S
1.414 1519.26
. . 1550.06
TABLE IV. Molecular constants for TBr79.81.
Calc from HBr TBr" TBr"
2.9011 2.8985 0.0464 0.0463
4.58XlO-& 4.58XlO-5
-5.5 X10⁻⁷ -5.5 XlO-7
1.4142 1.4142 1519.51 1518.84
15.45 15.44 ..
1550.41 1549.72
Calc from D Br TBr79 TBr"
2.9008 2.8979 0.0466 0.0466
4.41 X 10-& 4.38X 10-& -8.3 X 10⁻⁷ -8.3 X 10--7
1.4143 1.4144 1519.43 1518.76
15.368 15.354 -0.0059 -0.0059
1550.17 1549.47
Ava. from HBr71l • 81
and DBr 71l •81
2.8996 0.0465
4.5XlO-5
-7 X 10⁻⁷
1.4143
1519.14 15.403
-0.003 1549.94
a Since the natural isotopic mixture for bromine is 50.6% Br71l and 49.4% Br81 , the molecular constants calculated from the unresolved peaks of TBr"·" should be compared with the average of the values for TBr" and TBr".
12 A. H. Nielsen and H. H. Nielsen, Phys. Rev. 48, 864 (1955).
This article is copyrighted as indicated in the article. Reuse of AIP content is subject to the terms at: http://scitation.aip.org/termsconditions. Downloaded to IP:
130.70.241.163 On: Fri, 19 Dec 2014 15:14:37

TCI AND TBr SPECTRA AND MOLECULAR CONSTANTS 1249
RESULTS
The spectra are shown in Figs. 1 and 2. As seen in Fig. 2, the Br79, Br81 isotope splitting was not resolved.
The observed frequencies, based on the observed drum readings and Eq. (1), are listed in column 2 of Tables I, II, and III. The molecular constants were calculated to obtain a "least squares" fit of the observed frequencies. The calculated frequencies for these molecular constants are listed in column 3 of Tables I, II, and III.
To determine the rotational constants and vo, the combination relations used were
RJ-I-PJ+I= (4Bo-6Do) (I+!)-8Do(I+!)3, (2)
RJ-P J= (4B I-6DI)(J+!)-8DI(I+!)3, (3)
R J- 1+ P J= 2vo- 2aef2- 2{3ef2(I + 1)2, (4)
Bv=Be-ae(v+!), (5)
~=~+~0+U. ~
A least squares fit of the data to these equations gave the rotational constants listed in Tables IV, V, and VI. vo, ae, and {3e were determined to fit Eq. (4). Bo, B I, Do, and DI were determined from Eqs. (2) and (3). Be and De were then determined from Eqs. (5) and (6). For comparison, also given are the constants for TBr79, TBr8l , TCp5, and TCP7, calculated from the previous results3- 6 on HBr, DBr, HCI, and DCI, using the mass
TABLE V. Molecular constants for TCI'5.
Observed Calc from HCI" Calc from DCI"
B" cm-1 3.7458 3.7378 3.7367 ll:e, cm-1 0.0611 0.0637 0.0638 De, cm-1 7.7 X1O-5 6.602X1O-5 6.464XlO-5 {3" cm-1 0.84X10⁻⁵ -5.9 X 10⁻⁷ -2.4 X 10⁻⁷
r" A 1.273 1.274. 1.2746 Vo, cm-1 1739.10 1739.09 WeXe, cm-1 18.36 WeYe, cm-1 0.012 We, cm-1 1775.86 1775.85
TABLE VI. Molecular constants for TCI'7.
Observed Calc from HCI" Calc from DCI"
B" cm-1 3.7226 3.7217 3.7204 atilt Ctn-1 0.0655 0.0633 0.0634 D" cm-1 6.75X1O-5 6.56X1O-5 6.41 X 10⁻⁵ {3" cm-1 -1.15X1O-5 -5.9 X1O-7 -2.4 XlO-7 r., A 1.274 1.274. 1.2746
Jlo, cm-1 1735.51 1735.39 WeXe, cm-1 18.28 WeYt, cm-1 0.012 We, cm-1 1772.11 1771.99
TABLE VII. Comparison of observed Bo with microwave values.
Bo, infrared Bo, microwave"
TBr79 ,81
2.876 cm-1
2.876
TCI"
3.715 3.705
TCI"
3.690 3.689
• From references 1 and 2 using 2.998 XIOIO cm/sec for velocity of light.
dependence relationships described by Herzberg,13 The values for WeXe and WeYe were calculated from those of the hydrogen and deuterium compounds and the mass dependence relationships.13 Using an average of these and the observed vo, a value for We was determined.
The agreement of the observed values with those calculated from the hydrogen and deuterium isotopic species is well within the experimental accuracy. The fact that f3e appears to be positive is surprising, although within the experimental accuracy it is essentially zero. If the only error is that in reading the positions of of the peaks on the chart, the accuracy should be about ±0.1 cm-l for the TBr peaks and about ±0.15 cm-l
for the TCl peaks. The close agreement of the calculated and observed frequencies (see Tables I-III) shows that there is no significant instrumental error and that the Friedel-McKinney equation (1) is quite good from 1300-2100 cm-l with a CaF 2 prism.
The results can also be compared with the microwavel •2 values for Bo. The latter are expressed in waves per second. By dividing these values by the velocity of light (2.998X 1010 cm/sec), they are converted to waves/ cm for direct comparison with the infrared values obtained from Be and ae (Tables IV-VI) and Eq. (5). The results are given in Table VII.
Both Be and Bo are too high from our results on TC)35 (see Tables V and VII). This may be because the overlapping of some of the TCp5 peaks by those of TCP7 displaces the maximum of absorption away from the true position for TCl35. For TCP7 and TBr79 ,81 the agreement is quite good for fluorite prism resolution (see Tables IV, VI, and VII).
If we use the molecular constants of the tritium species calculated from those of the hydrogen or deuterium species (see Tables IV, V, and VI) to calculate the P J and RJ frequencies the individual deviations are not much greater than the individual least square deviations given in Tables I, II, and III.
ACKNOWLEDGMENTS
The authors are grateful to Mr. Dale Armstrong for preparation of the figures, to Mr. Keith Zeigler for the least squares treatment of the data, and to Miss Suzanne Krainock for some of the measurements and calcula tions.
13 Reference 4 (b), pp. 141-145.
This article is copyrighted as indicated in the article. Reuse of AIP content is subject to the terms at: http://scitation.aip.org/termsconditions. Downloaded to IP:
130.70.241.163 On: Fri, 19 Dec 2014 15:14:37