informing carrying capacity decision making in … · informing carrying capacity decision making...
TRANSCRIPT

75Journal of Park and Recreation Administration Volume 23, Number 1Spring 2005 pp. 75-89
Informing Carrying CapacityDecision Making in YosemiteNational Park, USA Using StatedChoice Modeling
Peter NewmanRobert ManningDonald DennisWard McKonly
EXECUTIVE SUMMARY: Recreation experiences have social, ecologi-cal, and managerial dimensions. Park and protected area managers areforced to make trade-offs among these dimensions causing management tobe more complex. This study evaluates how visitors to Yosemite NationalPark wilderness make tradeoffs among indicators of quality that representsocial, ecological and managerial dimensions of the recreation experience.It is likely that most visitors want unimpeded access to parks but also wantareas protected from excessive resource impacts, want to avoid undesirablelevels of crowding and congestion, and “heavy handed” managementrestrictions. However, these desires often conflict, and tradeoffs must bemade. Understanding visitors’ preferences and acceptable tradeoffs will aidmanagers in deciding how best to mitigate recreational impacts while nothindering, to an unacceptable degree, the freedoms and other qualitiesoften associated with experiences in parks and protected areas. The studywas conducted in the summer of 2001 and employed a paired comparisonquestionnaire in which respondents reported their preferences betweenalternative wilderness settings. Results from this study were programmedinto Excel to create a wilderness management alternative predictive modelthat enables managers to understand the relationships among various levelsof standards of quality. Results suggest signs of human use at campsites wasthe most important indicator of those used in the study. Moreover,Yosemite wilderness visitors were willing to tolerate increases in certainforms of regulation in order to obtain a high quality recreation experience.Findings can be used to help formulate standards of quality, and evaluateand predict visitor support for potential management alternatives. Theexamples in this paper illustrate how the evaluation of relative tradeoffsamong social, ecological, and managerial setting attributes provide contex-tual, multi-dimensional information for protected area management deci-sion making.
KEYWORDS: Yosemite National Park, trade-offs, wilderness experi-ences, Carrying Capacity Decision-Making, predictive models
AUTHORS: Peter Newman is an Assistant Professor, Colorado StateUniversity, 232 Forestry Building, Colorado State University, Fort CollinsCO 80523. Email: [email protected]. (970)-491-2839. Rob-ert Manning is a Professor, University of Vermont; Donald Dennis is aResearch Forester, USDA Forest Service Northeastern Research Station;and Ward McKonly is a Graduate Research Assistant, Colorado State

76
University. The authors would like to acknowledge Dr. Steven R. Lawsonat Virginia Tech University, Dr. Jan W. van Wagtendonk, at the USGSYosemite Field Station, and Laurel Boyers, and Mark Fincher, at theYosemite National Park Wilderness Office for their shared knowledge,frequent consultation and support. We would also like to thank theYosemite Fund and the Earthwatch Institute for funding this study.
Introduction
Management of national parks is replete with conflicting interests(Runte, 1997). For example, the National Park Service (NPS) is chargedwith preserving important natural and cultural resources while makingthem accessible to the public. Moreover, visitors often yearn for solitude ina pristine environment but also want the freedom from managementconstraints that is associated with the wilderness ideal. These paradoxes areat the heart of many park management decisions and force managers (andvisitors) to make trade-offs among competing values. The question thenbecomes, “What do visitors wish to trade-off in order to achieve a desirablecondition?” Answering this question could help inform difficult carryingcapacity related decisions. This paper explores these questions concerningcarrying capacity by applying a stated choice model in Yosemite NationalPark wilderness.
Carrying capacity related decision-making can be very challengingwhen trying to meet legal mandates, and the diverse tastes and preferencesof park visitors. However, the literature suggests that these challenges maybe addressed through the development of explicit management objectivesand associated indicators and standards of quality (Manning, 1999a,2001). Management objectives are broad narrative statements outlining therecreation experience to be provided and the desired condition of theresource. Indicators of quality are measurable, manageable variables reflect-ing the essence of management objectives. Standards of quality define theminimum acceptable condition of indicator variables (Manning, 1999a,1999b). Once indicators and standards of quality have been formulated,indicator variables are monitored and management action is taken to ensurethat standards of quality are maintained. This “management-by-objec-tives” approach is at the heart of contemporary protected areas manage-ment frameworks including Limits of Acceptable Change (LAC) (Stankeyet al., 1985), Visitor Impact Management (Graefe, Kuss,& Vaske, 1990)and Visitor Experience Resource Protection (VERP) (Hoff & Lime, 1997).
Research to support formulation of indicators and standards of qualityhas generally relied on normative theory and related empirical techniques(Heberlein, 1977; Jackson, 1965; Manning, 1999a; Vaske, Shelby, Graefe,& Heberlein, 1986). In this research approach, visitors are often asked torender judgments about acceptable conditions of indicator variables thatrepresent the social, ecological, and managerial components of recreationexperiences. However, this may not adequately address the potential trade-

77
offs inherent among such indicators of quality. For example, protected areavisitors may favor relatively pristine resource conditions, but also wantgenerally unimpeded access to protected areas and freedom from manage-ment control. However, all of these conditions may not be possible,especially when there is heavy demand for protected area use. A morecontextual, multi-dimensional approach to formulating indicators andstandards of quality may be warranted. Choice models provide a contextualapproach that can inform the development of indicators and standards ofquality. While this approach has inherent strengths in providing a highlycontextual approach, model estimates cannot be generalized outside of themodel parameters. That is, model estimates are only relative to the otherindicators included in that model.
Literature Review
Stated choice modeling was developed in marketing research tomeasure consumer preferences and trade-offs among product attributes(Green, Tull, & Albaum, 1988; Louviere, Hensher, & Swait, 2000). Inthese applications, alternative product choices are developed as combina-tions of product attributes. For example, a range of engine horsepower,luxury features, and prices might define hypothetical automobiles. Respon-dents are asked to express their preferences among these product choices,and data analysis reveals which attributes are most important to respon-dents and the effect of each attribute level on consumer preference. Choicemodeling has been applied to natural resources management in a variety ofstudies (Adamowicz, Bhardwaj, & Macnab, 1993; Boxall, Adamowicz,Swait, Williams, & Louviere, 1996; Bullock, Elston, & Chalmers, 1998;Dennis, 1998; Heider & Ewing, 1990; Lawson & Manning, 2002;Mackenzie, 1993; Schroeder, Dwyer, Louviere, & Anderson, 1990). Forexample, Heider & Ewing (1990) used a stated choice experiment toevaluate alternatives among Caribbean vacation destinations. Profiles com-prising the choice sets were developed from 27 possible vacation destina-tion attributes, including proximity to beaches, variables related to accom-modations and distance to airport. The results were used to create a modelof tourists’ preferences that could be used to estimate the probability oftourists selecting various vacation destinations depending on changes in thelevels of the destination’s attributes.
More recently, Lawson and Manning (2002) applied stated choicemodeling to wilderness visitors in Denali National Park. Indicators ofquality, representing alternative wilderness management conditions, wereused in lieu of “product attributes.” Potential standards of quality comprisethe range of conditions in such attributes. Alternative standards of qualityfor six indicator variables in Denali National Park and Preserve werecombined to form alternative wilderness scenarios. These scenarios werepresented to respondents (backpackers in the park) in pairs, and respon-dents were asked to indicate the scenario they preferred. Findings revealed

78
the relative importance of the six indicators of quality and helped toempirically inform the setting of standards of quality for these indicatorvariables.
This research extends the work of Lawson and Manning (2002) byincorporating a visual approach to the evaluation of resource relatedindicators of quality in the wilderness portion of Yosemite National Park.Moreover, an interactive, predictive model was developed that enableswilderness managers to better understand study data and more fully utilizethese data in wilderness management decision making.
Methods
The design for this research included assigning a range of potentialstandards of quality to six potential indicator variables for the wildernessportion of Yosemite National Park. Permutations of these variables werethen arranged into sets of paired wilderness scenarios, for example, visitorscould choose between alternatives where they would find high amounts offreedom (e.g., high likelihood of obtaining first choice permit, can camp atany location) but lower amounts of solitude (e.g., camp in sight and soundof other visitors each night, sees several parties a day on a trail) or, to thecontrary, lower amounts of freedom and higher amounts of solitude.Wilderness visitors and respondents were asked to choose their preferredscenario.
Selection of Indicators of QualityWorkshops were held in Yosemite National Park during the fall of 2000
with more than a dozen park managers and rangers. Over 30 potentialindicators of quality of the wilderness experience were discussed, coveringsocial, ecological, and managerial dimensions. Because using all thirtyindicators in a choice model would be too burdensome, researchers andmanagers decided to limit the number indicators in the model to six.Indicator selection was based on criteria used in the literature (Manning,1999a; Stankey et al., 1985). After a day of discussing long lists of potentialindicators representing resource, social, and managerial conditions ofvisitor experiences, workshop participants were asked to vote for theindicators they believed were the most salient and feasible. Based oncontinued discussion with park managers and review of the literature, sixindicators were chosen to represent the most pertinent social, ecological,and managerial conditions of Yosemite wilderness and these indicatorvariables are shown in Table 1. Three potential standards of quality (lowlevels, current levels, and high levels) were also identified for each indicatorvariable representing a realistic range of social, resource, and managerialconditions.
One of the ecological indicators— “Signs of human use at campsites”-lended itself to a visual representation. Figure 1 shows the three photos usedin this study to illustrate potential signs of human use at campsites. Therange of campsite conditions was based on the Wilderness Impact Monitor-ing System (WIMS) used in Yosemite National Park (Boyers, Fincher, &

79
Table 1Yosemite Wilderness Setting Attributes and Levels
van Wagtendonk, 1999). The campsite condition classification system forWIMS uses a scale from 1 (barely discernible) to 5 (heavily impacted). Thephotos used in this study represent conditions 1, 3 and 5 from the WIMSsystem.
Sampling
Respondents were randomly selected from visitors who received wil-derness use permits between June 26 and September 5, 2001. Sampling wasconducted in and around the wilderness permit stations in Yosemite Valley,Tuolumne, Wawona, Big Oak Flat, and Hetch-Hetchy, representing all ofthe geographic regions of the park. This sampling strategy allowed theresearch team to capture representative numbers and types of visitors to theYosemite wilderness seeking a diversity of wilderness experiences.
At the start of each sampling day, the interviewer selected the firstvisitor and asked if he/she would be willing to participate in the survey.

80
Photo 1WIMS Level 1
Photo 3WIMS Level 3
Photo 5WIMS Level 5
Figure 1The Photos Utilized in this Study Representing
Three Levels of Human Use at Wilderness Camping Sites

81
Willing respondents completed the stated choice questionnaire which wasadministered on a laptop computer. When the first visitors completed thequestionnaire, the next visitor was selected and the procedure continuedthroughout each sampling day. A total of 713 out of 864 contacted visitorsagreed to complete the computer-administered questionnaire representinga response rate of 83%. Of the 713 questionnaires completed, 35 wereincomplete and unuseable for a total n of 678. This sample represents 6102paired comparisons (678 questionnaires each with nine paired compari-sons).
Analytical ModelThis study used an orthogonal fractional factorial design. The indica-
tors and associated standards of quality were organized into four blocks ofnine paired comparisons (Green & Srinivasan, 1978; Louviere et al., 2000;Seiden, 1954). In each of the nine pairwise comparisons, respondents werepresented with two alternative Yosemite wilderness-scenarios, “A” and “B”and then asked which they preferred. A sample comparison is shown inFigure 2.
Figure 2Example of Paired Comparison Question-Scenarios
82
1 As stated earlier, the independent variables are made up of the differences between the levels(effect codes) of each attribute of the adjacent profile. Effects coding was used to representthe wilderness setting attributes in the predictive model run in Excel. Effects coding requiresthat one level of the indicator of quality (i.e., each wilderness setting attribute) be selectedas the baseline or excluded level. For this study, the first level of each scenario was selectedas the excluded level (e.g., “Encounter fewer than 5 other groups a day while hiking.” for the“Number of other groups encountered per day while hiking” attribute). As a result, eachwilderness setting attribute was represented in the statistical model by two indicator variables,one associated with the intermediate level of the attribute (e.g., “Encounter 5 –15 othergroups a day while hiking.” for the “Number of other groups encountered per day whilehiking” attribute) and one associated with the high level of the attribute (e.g., “Encountermore than 15 other groups a day while hiking.” for the “Number of other groupsencountered per day while hiking” attribute). To code for the first level of an attribute, bothindicator variables were assigned values of – 1. To code for the second or intermediate levelof the attribute, the indicator variable for the intermediate level of the attribute was coded1 and the indicator variable for the third level was coded 0. To code for the third or high levelof the attribute, the indicator variable for the intermediate level of the attribute was coded0 and the indicator variable for the third level was coded 1 (Boxall et al., 1996; Lawson &Manning, 2002). The result of effects coding is that the coefficients of the indicator variablesrepresent the ordinal utility (or disutility if the coefficient is negative) associated with thecorresponding level of the attribute. The ordinal utility (or disutility) of the first level of theattribute is equal to the negative sum of the coefficients of the indicator variables correspond-ing to the attribute. For a full description of the model see Opaluch et al. (1993) and Wichelnset al. (1993).
2 For a full description of the methods used to calculate public preference for hypotheticalwilderness management scenarios, see Opaluch et al. (1993) and Wichelns et al. (1993).
As stated above, this research design involved assigning a range ofpotential standards of quality to selected indicators of quality, then devel-oping alternative scenarios that represent permutations of such indicatorsand standards of quality. A logistic regression was then performed wherethe dependent variable was coded as 1 or 0 representing the respondents’choice (choice A = 0, choice B=1). The independent variables included thevector of differences between the effects codes1 of each attribute level(hypothetical standard of quality) of the adjacent paired comparison. Fora full description of this model, see Opaluch, Swallow, Weaver, Wesselles,and Wichelns (1993). Finally, the statistical model was programmed intoan Excel database in order to create a wilderness management scenariocalculator2. The calculator enables wilderness managers to predict visitorpreferences for hypothetical wilderness management scenarios and therelationship among alternative indicators and standards of quality.
Results
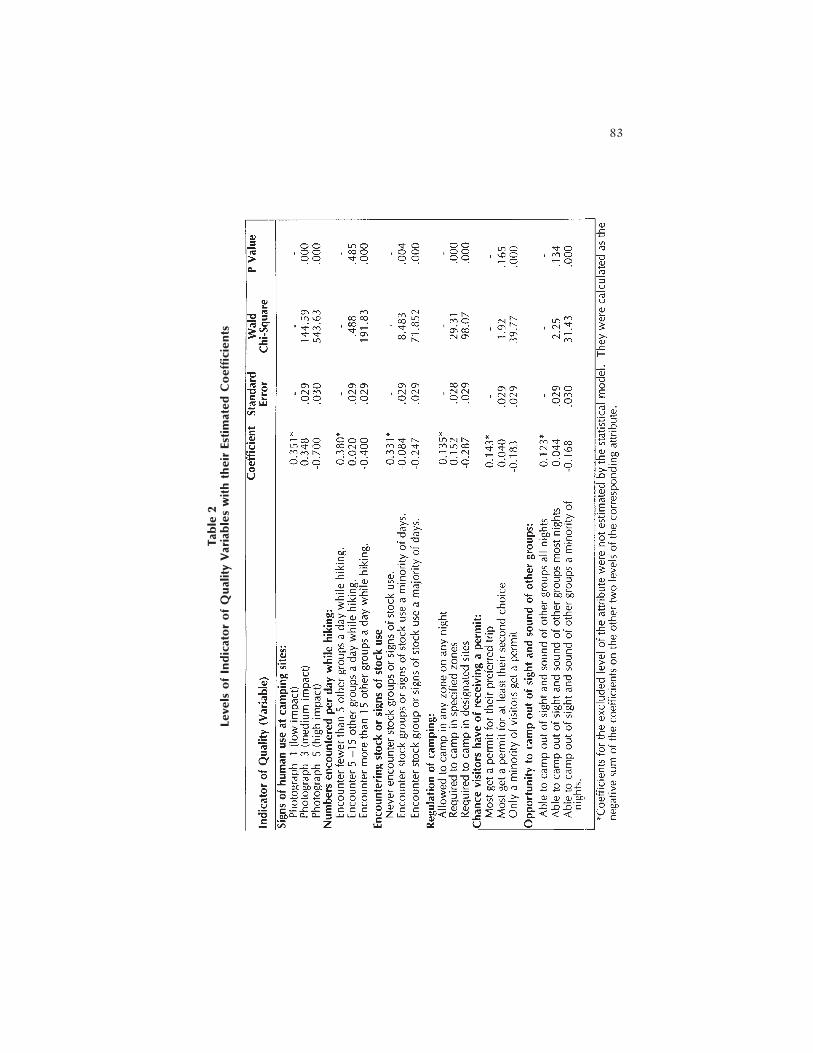
The regression coefficients and p values for each indicator variable arepresented in Table 2. All coefficients are significantly different than zero atthe <.001% level, except the coefficients associated with the following threevariables: “Encounter 5 –15 other groups a day while hiking,” “Most geta permit for at least their second choice trip” and “Able to camp out of sightand sound of other groups most nights.” The overall model is significantat the .01 level according to the model chi-square statistic (Wald c2 =18.76,p=.000) and predicted 68.5% of the responses correctly.
83
Table
2Levels
of
Indic
ato
r of
Quality
Vari
able
s w
ith t
heir
Est
imate
d C
oeff
icie
nts

84
Table 2 presents the study variables, their associated levels, and theresults of the model in order of relative importance to the Yosemitewilderness visitor. The absolute magnitude of the coefficients reflects therelative importance of the corresponding level of the attribute to wildernessvisitors. The greater the relative magnitude of a coefficient, the more it addsto or detracts from respondents’ preference for the wilderness setting. Alarger negative coefficient indicates that the corresponding level of theattribute detracts substantially from respondents’ preference associatedwith the wilderness setting. A larger positive coefficient indicates that thecorresponding level of the attribute substantially increases respondents’preference for the wilderness setting. Moreover, the absolute magnitudeamong attributes denotes the preference visitors have for those attributes.
The model indicates that “signs of human use at campsites” is the mostimportant indicator of quality. Photo number three (Figure 1), represent-ing a highly impacted campsite, has the highest associated magnitude of anyof the six variables (-.700). Both photo number 1 (.351) and photo number2 (.348), had approximately equal magnitudes, in other words, wildernessvisitors were indifferent between these two conditions (Table 2).
Discussion
The relationships among the coefficients for the attribute levels (alter-native standards of quality) offer important information. These relation-ships represent potential visitor trade-offs and suggest that lesser preferredstandards of quality of a scenario may be tolerated if that same scenario hascertain attributes with more preferred standards of quality. For example,with respect to the availability of permits that suggests that visitors mayaccept use restrictions in order to obtain a higher quality experience. Thedifference between “Most visitors are able to get a permit for their preferredtrip” (.143) and “Most visitors are able to get a permit for at least theirsecond choice trip,” (.040) is a net change of .103. These data suggest thatvisitors would accept a lower chance of receiving a permit in order to receiveimprovements in other conditions such as encountering fewer people ontrails and encountering fewer stock parties or signs of stock parties on thetrails. In other words, it would take the latter two attributes as representedby the value of the coefficients to make up for the former attribute andassociated value of the coefficient. Knowledge about these relationships caninform managers concerning the tradeoffs inherent in park and protectedarea management.
The relationships among the indicator variables provides contextualand multi-dimensional information that can inform management decisionmaking. The results suggest that Yosemite National Park wilderness visitorssupport some degree of management over where and how many visitorsmay camp and also support visitor use limits. For example, Yosemitewilderness visitors’ remained indifferent as regulations over where visitorsmay camp increased from, “Allowed to camp in any zone on any night,” to“Required to camp in specified zones” (Table 2). However, preference
85
dropped off dramatically at the most restrictive level of “Required to campin designated sites,” producing the lowest preference levels with respect tocampsite regulations.
The model coefficients can also be used to predict the overall prefer-ences of Yosemite National Park wilderness visitors for a variety of wilder-ness management scenarios that were not directly tested in the studyquestionnaire. Because this model utilized 6 attributes each with threelevels (see Table 1), there are 36 or 729 potential wilderness scenarios. Theability to explore relationships inherent among the scenarios, providesvaluable contextual information about public preferences for wildernessmanagement. Past approaches to understanding public preference relied onvisitors to render judgments about uni-dimensional components of thewilderness experience. In other words, visitors are able to choose the bestcase scenario, which is not always available. The approach used here forcedvisitors to make “trade-offs” among various wilderness conditions. Thismulti-dimensional approach creates more realistic scenarios, and asksvisitors to think more like protected area managers do on a day to day basis(i.e. balancing use and preservation by protecting resources and visitorexperiences). Testing a multitude of these scenarios may be important tomanagers seeking to understand public preferences in a multi-dimensionalcontext.
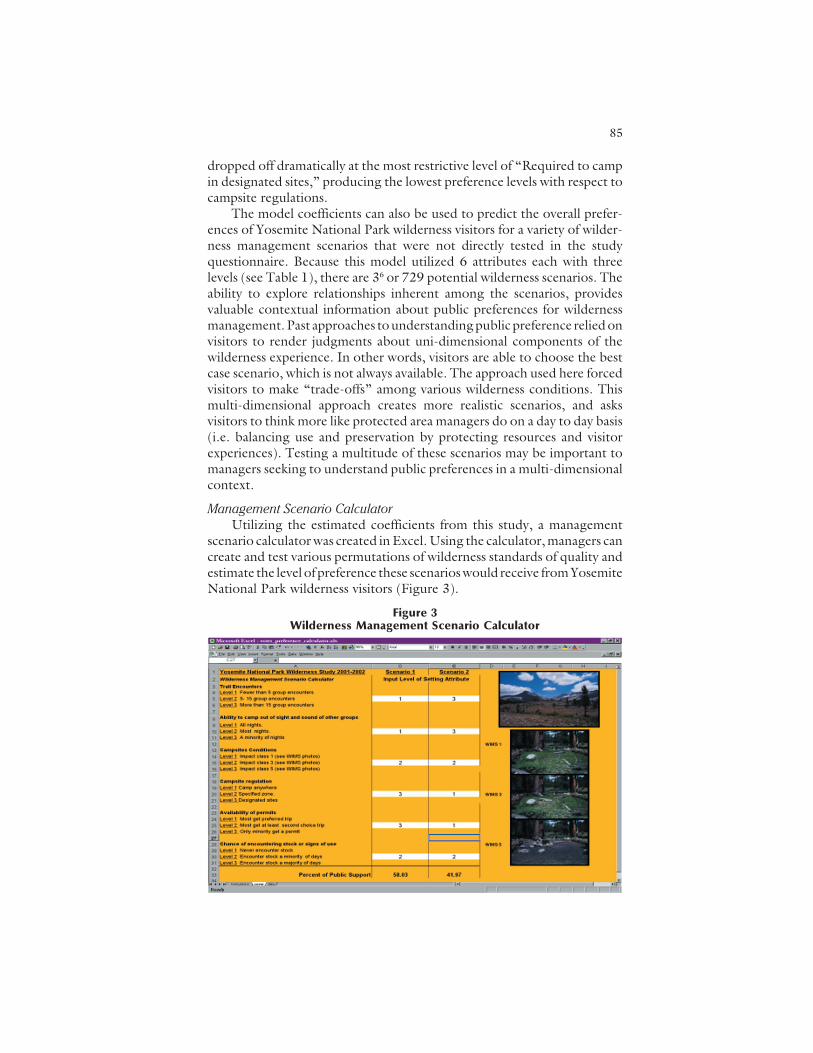
Management Scenario CalculatorUtilizing the estimated coefficients from this study, a management
scenario calculator was created in Excel. Using the calculator, managers cancreate and test various permutations of wilderness standards of quality andestimate the level of preference these scenarios would receive from YosemiteNational Park wilderness visitors (Figure 3).
Figure 3Wilderness Management Scenario Calculator

86
To illustrate the wilderness management scenario calculator, considerthe two wilderness management scenarios shown in Figure 3. Scenario 1will be referred to as the “solitude scenario” and Scenario 2 as the “freedomscenario.” The numbers in each cell represent the level (low level =1,current level =2 and high level =3) of each attribute chosen to define thescenarios. The “solitude scenario” specifies that wilderness visitors wouldencounter fewer than five groups of people per day on the trail and have theability to camp out of sight and sound of groups all nights. However,visitors are required to camp in designated campsites and only a minorityof visitors receive a wilderness permit. The “freedom scenario” specifiesthat visitors would encounter more than 15 groups per day along trails, andhave the ability to camp out of sight and sound of other groups only aminority of nights. However, visitors can camp wherever they choose, andmost visitors receive a permit for their preferred trip. In both of thesescenarios, signs of human use at campsites and the chance of encounteringstock were held at the intermediate levels. The model estimates that nearly60% of Yosemite wilderness visitors would prefer the “solitude scenario”and just over 40% would prefer the “freedom scenario.” This suggests thatthe majority of Yosemite wilderness visitors prefer to trade-off somefreedoms in order to attain a higher degree of solitude.
The wilderness management scenario calculator empowers managersto test all permutations of study variables and explore the relationshipsamong the social, ecological and managerial attributes that contribute towilderness experiences. Managers who better understand these relation-ships can make more informed decisions concerning the development ofindicators and associated standards of quality and the allocation of experi-ential zoning and most importantly, the public who uses park resources.
Conclusions
Research to support formulation of indicators and standards of qualityhas generally relied on normative theory and related empirical techniques.We used a more contextual approach by developing an understanding ofthe acceptable tradeoffs among the different standards of quality. Statedchoice analysis can be a useful way to integrate social, ecological andmanagerial indicators of quality into carrying capacity decision-making.
The results of the model have several important implications forYosemite National Park wilderness management. First, the indicatorsutilized in this study were all found to be significant components of theYosemite wilderness visitor experience. In other words, the differencesamong the levels of the attributes showed that each indicator had asubstantive impact on visitors’ preferences. Second, Yosemite wildernessvisitors are willing to tolerate increases in certain forms of regulation, inorder to obtain a high quality recreation experience and resource protec-tion. This information would not have been apparent in previous, uni-dimensional approaches to informing the formulation of indicators andstandards of quality. Moreover, results suggest that the public may under-

87
stand the trade-offs that protected area managers face on a day-to-day basisand that management is complex.
Third, as is consistent across other studies that used visual and non-visual approaches, (Lawson & Manning, 2002; Manning, 1999a; Newman& Dawson, 1996) “signs of human use at campsites,” was the mostimportant setting attribute relative to the six included in the study. Thissuggests that management should consider placing a high priority onmonitoring and improving campsite conditions and aesthetics. Fourth, theuse of a visual approach (photos of signs of human use at campsites) basedon a current monitoring system such as WIMS, allows managers tounderstand the potential effects of current campsite conditions on visitorexperiences. Fifth, the overall magnitude of the coefficients providesimportant information about setting potential standards of quality to beformulated by wilderness managers. Finally, the calculator empowersmanagers to explore the data in a user friendly, computer interface. Forexample, if managers have a choice to increase visitor use restrictions orregulations, they can proactively determine potential changes in visitorpreference. This empowers managers by allowing them to understand whatvisitors would trade-off in order to achieve a desirable condition. This toolallows managers to better understand public preferences and the cognitiverelationships among social, ecological, and managerial components of thewilderness experience. Moreover, managers can make more informedmanagement decisions in concert with park mandates that constantly forcemanagers to balance use and preservation of natural and cultural resources.These examples illustrate how the evaluation of relative tradeoffs amongsocial, ecological, and managerial setting attributes provide more contex-tual, multi-dimensional information for protected area management deci-sion making.
References
Adamowicz, W. L., Bhardwaj, V. and Macnab, B. (1993). Experiments on thedifference between willingness to pay and willingness to accept. Land Econom-ics, 69, 416-27.
Boyers, L. Fincher, M., van Wagtendonk, J, (1999). Twenty-eight years ofwilderness campsite monitoring in Yosemite National Park. In: Cole, D. N.;McCool, S. F. (2000) Proceedings: Wilderness Science in a time of ChangeProceedings. RMRS-P-000.Ogden, UT: U.S. Department of Agriculture,Forest Service, Rocky Mountain Research Station.
Boxall, P. C., Adamowicz, W., Swait, J., Williams, M. and Louviere, J. (1996) Acomparison of stated preferences for environmental valuation. EcologicalEconomics. 18(2), 243-253.
Bullock, C., Elston, D., and Chalmers, N. (1998) An application of economicchoice experiments to traditional land use—deer hunting and landscapechange in the Scottish highlands. Journal of Environmental Management, 52,335-351.
Dennis, D. (1998). Analyzing public inputs to multiple objective decisions onnational forest using conjoint analysis. Forest Science, 443, 421-429.
88
Graefe, A., Kuss, F., and Vaske, J. J. (1990) Visitor impact management: Theplanning framework. Washington DC: National Parks and ConservationAssociation.
Green, P., Tull, C., and Albaum, G. (1988). Research for marketing decisions. (5th
ed.) Englewood Cliffs, NJ: Prentice Hall.Green, P., and Srinivasan, V. (1978). Conjoint analysis in consumer research:
Issues and outlook. Journal of Consumer Research, 5, 103-123.Heider, W. & Ewing, G. (1990). A model of tourist choices of hypothetical
Caribbean destinations. Leisure Sciences, 12, 33-47.Heberlein, T., and Shelby, B. (1977). Carrying capacity, values and the satisfaction
model: A reply to Greist. Journal of Leisure Research, 9, 142-48.Hof, M. and Lime, D. (1997). Visitor experience and resources protection
framework in the national park system: Rationale, current status and futuredirection. Proceedings—Limits of Acceptable Change and Related PlanningProcesses: Progress and Future Directions. USDA Forest Service General Tech-nical Report (INT-371), 29-36.
Jackson, J. (1965). Standard Characteristics of norms. Current Studies in SocialPsychology. New York: Holt, Rinehart and Winston, 301-309.
Lawson S., and Manning R. (2002) Tradeoffs among social, resource, andmanagement attributes of the Denali wilderness experience: A contextualapproach to normative research. Leisure Sciences, 24, 297-312.
Louviere, J., Hensher, D. A., Swait, J. D. (2000). Stated choice methods. Analysisand application. Cambridge University Press, New York.
Louviere, J. and Timmermans, H. (1990) Stated preference and choice modelsapplied to recreation research: A review. Leisure Sciences, 12, 9-32.
Mackenzie, J. (1993) A comparison of contingent preference models. Journal ofAgricultural Economics, 75, 593-603.
Manning, R. (1999a). Studies in Outdoor Recreation. Corvallis: Oregon StateUniversity Press.
Manning, R. (1999b). Crowding and carrying capacity in outdoor recreation:From normative standards to standards of quality. Leisure Studies: Prospects forthe Twenty-First Century. State College, Pennsylvania: Venture Press, pp. 323-334.
Manning, R. (2001). Visitor experience and resource protection: A framework formanaging the carrying capacity of national parks. Journal of Park andRecreation Administration, 19(1), 93-108.
Newman, P. and Dawson, C. (1998). The human dimensions of the wildernessexperience in the High Peaks Wilderness Area. In: Proceedings of the 1998Northeastern Recreation Research Symposium: April 5-7; Bolton Landing, NY.General Technical Report NE-255, ed. Vogelsong, H.: Radnor, PA; USDAForest Service, Northeastern Forest Experiment Station. pp. 122-129.
Opaluch, J., Swallow, S., Weaver, T., Wesselles, C., and Wichelns, D. (1993).Evaluating impacts from noxious facilities: Including public preferences incurrent siting mechanisms. Journal of Environmental Economics and Manage-ment, 24, 41-59.
Runte, A. (1997) National parks: The American experience. Lincoln, Nebraska,University of Nebraska Press.
Seiden, E. (1954). On the problem of construction of orthogonal arrays. Annalsof Mathematical Statistics, 25, 151-156.
Schroeder, H., Dwyer, J., Louviere, J. and Anderson, D. (1990) Monetary and non-monetary trade-offs of urban forest site attributes in a logit model of recreationchoice. USDA Forest Service Technical Report RM-197, 41-51.

89
Stankey, G., Cole, D., Lucas, R., Peterson, M., Frissell, S., and Washburne, R.,(1985). The Limits of Acceptable Change (LAC) System for Wilderness Plan-ning. USDA Forest Service General Technical Report INT-176.
Vaske, J. J., Shelby, B. B., Graefe, A.R. and Heberlein, T. A. (1986). Backcountryencounter norms: Theory methods and empirical evidence. Journal of LeisureResearch, 18, 137-153.
Wichelns, D., Opaluch, James J., Swallow, S. K., Weaver, T. F., and Wessells, C.W. (1993). A landfill site evaluation model that includes public preferencesregarding natural resources and nearby communities. Waste Management andResearch, 11, 185-201.