shear carrying capacity of ultra-high performance concrete ... · shear carrying capacity of...
TRANSCRIPT

Tailor Made Concrete Structures – Walraven & Stoelhorst (eds)© 2008 Taylor & Francis Group, London, ISBN 978-0-415-47535-8
Shear carrying capacity of Ultra-High Performance Concrete beams
Josef Hegger & Guido BertramInstitute of Structural Concrete at RWTH Aachen University, Aachen, Germany
ABSTRACT: Ultra-High Performance Concrete (UHPC) is a high-tech material opening new opportunitiesespecially for slender constructions. Within the collaborative research project “Sustainable Building with UltraHigh Performance Concrete (UHPC)” supported by the German Research Foundation (DFG) design models forpretensioned beams have been developed at the Institute of Structural Concrete at RWTH Aachen University.Several tests were performed to investigate the bond anchorage and the shear carrying behavior of prestressedconcrete beams made of UHPC with or without web openings.
1 INFLUENCE OF THE ANCHORAGEBEHAVIOR ON SHEAR RESISTANCE
The prestressing force above the support is essential tocalculate the shear resistance. A decisive contributionof the shear carrying capacity arises from arch actionas presented in figure 1. When the anchorage length isshorter than the support overhang, the full prestressingforce is available to intensify arch action. The verti-cal support reaction corresponds with the prestressingand the arch action. Prestressing forces, which haveto be transferred in front of the support line, do notcontribute to the arch action.
To investigate the anchorage behavior pull-out testand small beam tests were performed. PretensionedT-beams were fabricated to test the anchorage lengthand the shear carrying capacity.
2 CONCRETE MIXTURE
All specimen were fabricated with the concrete mixpresented in table 1. Merely the fiber type and ratiowere varied.
Figure 1. Principle of arch action with correspondingprestressing force.
3 ANCHORAGE BEHAVIOR
3.1 Pull-out test
In table 2 an overview of the pull-out tests is given.A total of 72 tests were performed. The main testparameters were the fiber ratio, the specific con-crete cover, the concrete strength (age) and the stranddiameter. Because of the high bond stresses, shortembedment lengths between 25 and 50 mm were cho-sen. Each batch contains three tests with three differentlateral strain stages (0%, 50%, 100%). Figure 2 showsthe sequences of the pull-out tests. Three strands havebeen prestressed inside a testing rig. Then, the speci-mens were concreted.After a hardening period of threedays the first three tests have been conducted. After-wards, the prestressing force was decreased about 50%and further three tests were preformed. Finally, thelast tests were accomplished with full release (100%),which means full lateral strain of the strand.
Table 1. Concrete mix.
Mix/fiber ratio [% p.v.] M0 M1 M7 MRmaterial 2.5% 0.9% 1.04% w/out
Cement CEM I 650 660 660 666Silica fume 177 180 180 181Quartz powder 456 463 463 467Sand 0.125–0.5 mm 354 360 359 363Basalt 2–8 598 606 606 612Steel fiber 9.0/0.15 194 – – –Steel fiber 17.5/0.15 – 70 – –Steel fiber 13.0/0.16 – – 39 –Steel fiber 6.0/0.15 – – 42 –Water 158 161 160 162Superplasticizer 31 32 32 32
341

Table 2. Parameters of the pull-out tests (72 tests).
StrandsConcrete Cover Age Number
Test mix c/dp [d] 0.5” 0.6” [–]
PO1-3 M1 4.4 3 × 3 × 3PO4-6 M0 4.4 3 × 3 × 3PO7-9 M7 4.4 3 × 3 × 3PO10-15 M1 1.5–2.5 3 × 6 × 3PO16-18 M1 5.5 3 × 3 × 3PO19-21 M1 4.4 14 × 3 × 3PO22-24 MR 4.4 3 × 3 × 3
Figure 2. Fabrication and test sequences of pull-out tests.
The diagram in figure 3 indicates, that the fiberratio has no significant influence within the testedrange. With a compressive strength of 100 N/mm2 atan age of three days a bond strength of 30 N/mm2
was achieved with full lateral strain (100% release ofprestressing). Without presenting theses curves in thediagram, 20 N/mm2 with 50% release and about 12 to14 N/mm2 without a change of the prestressing forcewere achieved independent from the fiber ratio.
The variation of the concrete cover showed no effecton the bond strength when the prestressing remainsunchanged. A release of 50% led to a reduction of thebond stresses of about 10 to 15%. When the full lat-eral strain was preset, visible splitting cracks appearedbelow a specific concrete cover of c/dp = 2.5. Thismeans, the transferred bond stresses were reducedabout 10 to 30% according to the existing concretecover (figure 4).
3.2 Tests to investigate the transfer length
The main targets of these 10 tests were to determinethe minimum dimensions of the concrete cross sectionto avoid splitting cracks and to investigate the transferlength of the specimens which remained uncracked.Specimens with two strands were chosen to investigate
Figure 3. Influence of the fiber ratio on the bond slipbehavior of the test batches PO1 to PO9, PO22–PO24 whenprestressing was released 100%.
Figure 4. Influence of the concrete cover on the bond slipbehavior of the test batches PO10 to PO12 when prestressingwas released 100%.
the minimum concrete cover (figure 5). Four strandswere required to test the minimum spacing betweenthe strands. The concrete mix M1 with 0.9% p.v. wasused for all beams and the concrete age at the day of thetests was always three days. Further details and resultsare given in Hegger & Bertram (2008a).
Similar to the pull-out tests, the specimens were fab-ricated in a rig. The strands were already prestressedat the time of concreting. After the hardening periodthe prestressing was released in steps of 20%. At eachload stage the concrete strains were measured alongthe longitudinal axis of the specimen. This way, thetransfer of prestressing can be derived from the straindifferences. In addition, the slip at the end of the spec-imen was measured continuously with displacementtransducers.
Splitting cracks in the area of the transfer zone arehardly visible, especially when steel fibers are addedto the concrete. However, the development of splittingcracks can be spotted by a sudden slip increase. The
342

Figure 5. Test setup to determine the transfer length as wellas the minimum dimensions.
Figure 6. End slip of the strands, SE1 with cracks, SE5without visible cracks.
left diagram of figure 6 indicates, that the specimenSE1 with a specific concrete cover of c/dp = 1.5 startedcracking when 70% of the prestressing was induced.Due to the splitting crack the stress depending part(hoyer-effect) diminished leading to a higher slip. SE2with c/dp = 2.0 cracked at 95%. Only when the spe-cific concrete cover amounts at least c/dp = 2.5 thefull prestressing was feasible without visible cracksas indicated by the continuous load-slip behavior inthe right diagram of figure 6. Compared to HSC areduction of the minimum concrete cover cannot beaccomplished. Most likely, the splitting stresses arosesimultaneously due to the higher bond stresses.
Nevertheless, the transfer length is shorter com-pared to NSC or even HSC when cracks were avoidedas shown in the diagram of figure 7. In these cases themeasured transfer length amounts to 25 cm on average.The transfer length was extended when splitting cracksappeared, anyhow the strands have been anchored after40 to 50 cm (SE1).
3.3 Calculative bond model
So far, several investigations have been performedon the anchorage behavior of strands, amongst othersby den Uijl (1992), Stocker & Sozen (1969), Nitsch(2001) and Bülte (2008). Generally, the bond stressescan be divided into three parts (figure 8):
• a constant part caused by the basic friction, alsocalled the rigid-plastic bond behavior.
Figure 7. Concrete strain at the end of the test compared toHSC and NSC.
Figure 8. Schematical stress distribution along the transferlength of strands lbp.
• a stress dependent part which is based on the hoyer-effect and which increases with the transfer ofpretensioning.
• and a slip dependent part which is also independentof the prestressing. This effect can be explained bythe “lack of fit” which results from the geometry ofthe strands which is not completely uniform.
On the basis of the results from the pull-out tests astress-slip relation can be derived, which takes intoaccount the lateral strain and the slip. As demon-strated by Bülte (2008) the local bond strength canbe translated to components by using the bond dif-ferential equation system. Therefore, the differentialequation for steel bars from Nitsch (2001) has beenupgraded to a formulation for strands prestressed withpretensioning:
343

Figure 9. Comparison of theoretical and experimental trans-fer length for test SE3.
Using any stress-slip relation the stresses as wellas the slip in the transfer zone can be calculated. Theresulting theoretical transfer length can be checked bythe measured one in the beam tests. The test SE3 with-out visible cracks was used to examine the applicabilityof the bond law according to Nitsch (2001). The the-oretical transfer length was calculated by using thelocal bond stresses of the pull-out tests.The theoreticaltransfer length lbp,cal = 12.2 cm in figure 9 as well asthe theoretical slip scal = 0.37 mm (without diagram)fall below the experimental values (lbp,exp � 20 cm/sexp � 0.48 mm).
In principle, these differences may have the follow-ing reasons:
• The bond law, which was derived for normaland high strength concrete, cannot be trans-ferred to UHPC without adequate modification.Especially the proportion between compressivestrength and bond strength may have a significantinfluence.
• A damage of the specimen may have occurred, eventhough it was not visible. This means, that micro-cracks developed but the steel fibers prevented thecrack growth. Nevertheless, the stress dependentpart of the bond stresses was decreased. The cracksin the other specimen with smaller concrete coverwere hardly visible, too.
In figure 9 the results of the pull-out tests aremarked. The bond stresses are insignificantly lowerthan the theoretical values of the curve, i.e. theapproached bond law according to Nitsch (2001) leadsto results in the right range. Furthermore, the exper-imental transfer length is too long compared to highstrength concrete. Invisible crack development seemsto be the main reason. Therefore, further tests withenlarged concrete cover will be added on.
Figure 10. Test setup of T1–T4 (solid beams, T4 withoutdebonded strands and a = 1.40 m).
4 SHEAR TESTS
4.1 Parameters of the shear tests
An overview of the conducted shear test program isgiven in table 3. Due to the specific loading (Figure 10)two tests with different prestressing grades could beperformed on one beam. The first test is indicated with“a” and the second with “b”. To avoid an anchoragefailure, two stirrups Ø6 were arranged behind the sup-port. A considerable enhancement of the overhang isnot expedient because the rising arch action influencesthe shear carrying capacity more than in common prac-tice. A size of 15 cm was appointed for all shear tests.The specific concrete cover was c/dp = 2,5 accordingto the small tests. The lower chord was pretensionedwith nine 0.5” strands, each with a prestressing of125 kN (figure 11). Two of the middle strands weredebonded on one side of the beam (T1–T3). This way,two different ratios of prestressing could be realized inone beam. All other parameters as the effective depthmaintained the same. To investigate the influence ofthe shear slenderness, the forth beam was tested witha/d = 3.8 (T4a) and 4.4 (T4b).
4.2 Results of the shear tests without openings
Generally, the shear tests showed a very stiff load bear-ing behavior due to the high prestressing. In figure 12the load-deflection diagrams for three beam tests withdifferent fiber ratios are presented.
The comparison of the load deflection curves ofT1b, T2b and T3b in figure 4 as well as the ultimateshear forces in table 3 indicate the effectiveness ofthe steel fibers as shear reinforcement. Even 0.9%p.v. of steel fibers led to an increase of 80% and anamount of 2.5% p.v. even of 177% in comparison toT2b without fibers. The shear bearing capacity of T3awas even higher than the bending resistance. To pre-vent bending failure, the test was aborted. The flexuralstrength Rf of the concrete compositions with 0.9%
344

Figure 11. Cross section of T1–T4 (T4 without debondedstrands).
Table 3. Parameters of the shear tests.
Strands with openingsConcrete Slenderness
Test mix a/d Bond/total No./a1∗
T1a M1 3.8 7/9 –T1b M1 3.8 9/9 –T2a MR 3.8 7/9 –T2b MR 3.8 9/9 –T3a M0 3.8 7/9 –T3b M0 3.8 9/9 –T4a M1 3.8 9/9 –T4b M1 4.4 9/9 –T6a M1 3.8 9/9 1/0.5dT6b M1 3.8 9/9 1/1.0dT7a M1 3.8 9/9 1/1.5dT7b M1 3.8 9/9 1/2.0d
∗ a1 : distance between support and opening
fiber content (T1, T4) and 2.5% (T3) were almost inthe same range. But the flexural strength without fibers(T2) was considerably reduced. The flexural strengthwas determined with three point bending tests (prismdimension: 4 cm × 4 cm ×16 cm).
In test T1b (0.9% p.v.) first shear cracks developedat a shear load of 245 kN which led to a decreasein initial stiffness. Further cracks appeared continu-ously while loading. The ultimate shear load of 267 kNwas reached at a deflection of 9 mm. The main fail-ure cracks were declined between 20◦ and 24◦ withspacings from 2 to 3 cm. As expected, the ultimateshear force of T1b was superior to T1a due to thehigher prestressing (table 4). Two main failure cracksin T1a were declined 20◦ and 22◦. Entirely different,the second beam without steel fibers failed withoutany indication. The crack pattern of the failure crackswas similar but there was a sudden failure after thefirst crack developed. When 2.5% steel fibers were
Figure 12. Comparison of the load bearing behavior withdifferent fiber ratios.
Figure 13. Comparison of the load bearing behavior withdifferent shear slenderness, fiber ratio 0,9% p.v.
added to the concrete there was a significant increasein ultimate load. The load deflection curve indicatesfirst cracks at approximate 220 kN, however, at thistime no cracks were visible. Only at a higher loadlevel capillary cracks with a spacing of appr. 3 mmappeared. About 90% of all cracks showed a widthless than 0.05 mm and after failure these cracks werecompletely closed again and no longer visible.
The ultimate shear force of T4b with an enlargedshear slenderness of a/d = 4.4 was about 15% lowercompared toT4a with a/d = 3.8 as presented in the dia-gram of figure 13. This leads to the assumption, that ahigher arch action is still present even when a/d = 3.8.The different stiffness is not caused by the slender-ness but the different spans of the first and second testset-ups. A comparison of T1b and T4a is not possi-ble without restrictions, because they were fabricatedwith different casting methods. The fiber orientation,which is influenced by the casting method, will beinvestigated within the project.
4.3 Results of the shear tests with openings
Former shear tests from Hegger & Rauscher & Voss(2005) with multiple openings in the web showed that
345
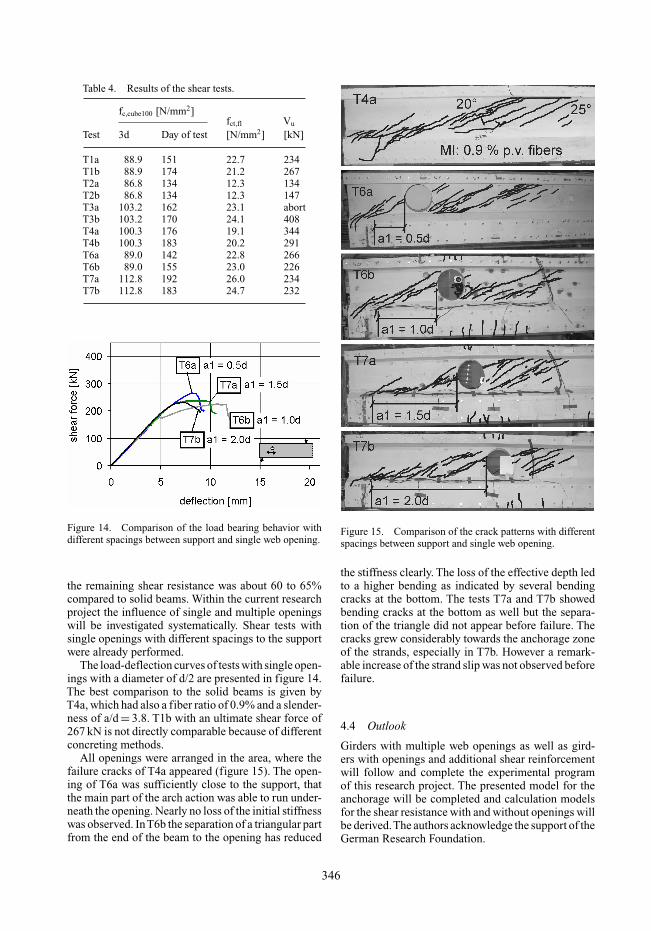
Table 4. Results of the shear tests.
fc,cube100 [N/mm2]fct,fl Vu
Test 3d Day of test [N/mm2] [kN]
T1a 88.9 151 22.7 234T1b 88.9 174 21.2 267T2a 86.8 134 12.3 134T2b 86.8 134 12.3 147T3a 103.2 162 23.1 abortT3b 103.2 170 24.1 408T4a 100.3 176 19.1 344T4b 100.3 183 20.2 291T6a 89.0 142 22.8 266T6b 89.0 155 23.0 226T7a 112.8 192 26.0 234T7b 112.8 183 24.7 232
Figure 14. Comparison of the load bearing behavior withdifferent spacings between support and single web opening.
the remaining shear resistance was about 60 to 65%compared to solid beams. Within the current researchproject the influence of single and multiple openingswill be investigated systematically. Shear tests withsingle openings with different spacings to the supportwere already performed.
The load-deflection curves of tests with single open-ings with a diameter of d/2 are presented in figure 14.The best comparison to the solid beams is given byT4a, which had also a fiber ratio of 0.9% and a slender-ness of a/d = 3.8. T1b with an ultimate shear force of267 kN is not directly comparable because of differentconcreting methods.
All openings were arranged in the area, where thefailure cracks of T4a appeared (figure 15). The open-ing of T6a was sufficiently close to the support, thatthe main part of the arch action was able to run under-neath the opening. Nearly no loss of the initial stiffnesswas observed. InT6b the separation of a triangular partfrom the end of the beam to the opening has reduced
Figure 15. Comparison of the crack patterns with differentspacings between support and single web opening.
the stiffness clearly. The loss of the effective depth ledto a higher bending as indicated by several bendingcracks at the bottom. The tests T7a and T7b showedbending cracks at the bottom as well but the separa-tion of the triangle did not appear before failure. Thecracks grew considerably towards the anchorage zoneof the strands, especially in T7b. However a remark-able increase of the strand slip was not observed beforefailure.
4.4 Outlook
Girders with multiple web openings as well as gird-ers with openings and additional shear reinforcementwill follow and complete the experimental programof this research project. The presented model for theanchorage will be completed and calculation modelsfor the shear resistance with and without openings willbe derived.The authors acknowledge the support of theGerman Research Foundation.
346

REFERENCES
Bülte, S. 2008. Zum Verbundverhalten von Spannstahllitzenunter Betriebsbeanspruchung. Institute of Structural Con-crete of Aachen University. Dissertation in progress
German Research Foundation. priority project (DFG SPP1182). Nachhaltig Bauen mit UHPC (Sustainable Con-struction with UHPC)
Görtz, S. 2004. Schubrissverhalten von Stahlbeton- undSpannbetonbauteilen aus Normal- und Hochleistungsbe-ton. Dissertation. RWTH Aachen
Hegger, J. & Bertram, G. 2008a. Anchorage behavior ofpretensioned strands in steel fiber reinforced UHPC.Proceedings, 2nd International Symposium on UHPC.Kassel. Germany
Hegger, J. & Bertram, G. 2008b. Shear carrying capac-ity of steel fiber reinforced UHPC. Proceedings, 2ndInternational Symposium on UHPC. Kassel. Germany
Hegger, J. & Rauscher, S. & Voss, S. 2005. Shear Carry-ing Capacity of Fiber-Reinforced UHPC. CCC◦ 2005.Lyon/Frankreich. pp. 1173–1180
Hegger, J. & Kommer, B. & Tuchlinski, D. 2006.Untersuchungen an Spannbetonträgern aus UHPC.Betonwerk + Fertigteil-Technik, BFT-China, pp. 3–8
Hoyer, E. 1939. Der Stahlsaitenbeton. Otto Elsner Verlags-gesellschaft. Berlin Wien Leipzig
Nitsch, A. 2001. Spannbetonfertigteile mit teilweiserVorspannung aus hochfestem Beton. Dissertation. Insti-tute of Structural Concrete of Aachen University. book13. ISBN 3-9807302-0
Stocker, M.F. & Sozen, M.A. 1969. Bond characteristicsof prestressed strand. Investigations of prestressed rein-forced concrete of Highway bridges. University Illinois.Structural Research. Series No. 344
den Uijl, J. 1992. Bond and splitting action of prestressingstrand. Proceedings. Bond in Concrete. Riga. S. 2/79-2/88
347
