information visualization for e-content david modjeska assistant professor faculty of information...
TRANSCRIPT

Information Visualizationfor E-content
David Modjeska
Assistant Professor
Faculty of Information Studies
University of Toronto
Information Highways 2002

Overview
1. Information Visualization and E-content
2. Research Project and Demo
3. Future Directions

1. Information Visualization

Online Information -Overview of Structure
• Difficult to get an overall sense of structure using textual representations. – Amount of online information increasing– Search engines provide access via queries– Directories such as Yahoo provide a
hierarchical view.

Information Visualization
• This decade, much interest in visualizing information structure. – Capitalizes on human skills for scanning visual
presentations quickly and efficiently. – Several algorithms and techniques– Little evaluative research for guidance in this
area.

Desktop 3D Environments
• Desktop 3D environments provide experience of navigating in a world on desktop computer – E.g., in a first-person action game.
– Can also represent information hierarchies, where concepts or items are represented as buildings or regions in model world.
– Potential application areas include the Web and information systems.

Interesting Research
• Info structure - spatial vs. semantic (Dillon et al.) • Info visualization (Card et al.; Chen)• IR Visualization (Chalmers et al.; Hemmje et al.) • “Focus+context” - cone tree, hyperbolic browser,
XML3D (Robertson et al., Lamping & Rao; Risden et al.)
• Wayfinding (Lynch; Passini; Darken & Sibert)• 3D info design (Waterworth; Vinson)

Document Landscape

Cone Tree (Vertical)

HyperbolicBrowswer

XML3D

Information Islands

Interesting Products
• Star Tree Viewer from Inxight
• File System Navigator from SGI
• VisualNet from Antarcti.ca

Star Tree Viewer from Inxight

•File System Navigator from SGI

VisualNet from Antarcti.ca

2. Research Project

Information SystemsDesign
UsabilityEvaluation
Software Engineering
InformationVisualization

Goals
• Develop new technique for visualizing hierarchical data in desktop 3D environments
• Investigate design trade-offs between spatial and semantic structure in visualizations
• Implement and empirically validate proposed visualization designs
• Explore prototypes’ implications for Web/intranet browsing with semantic structural overview
• Investigate value of 3rd dimension and role of spatial ability
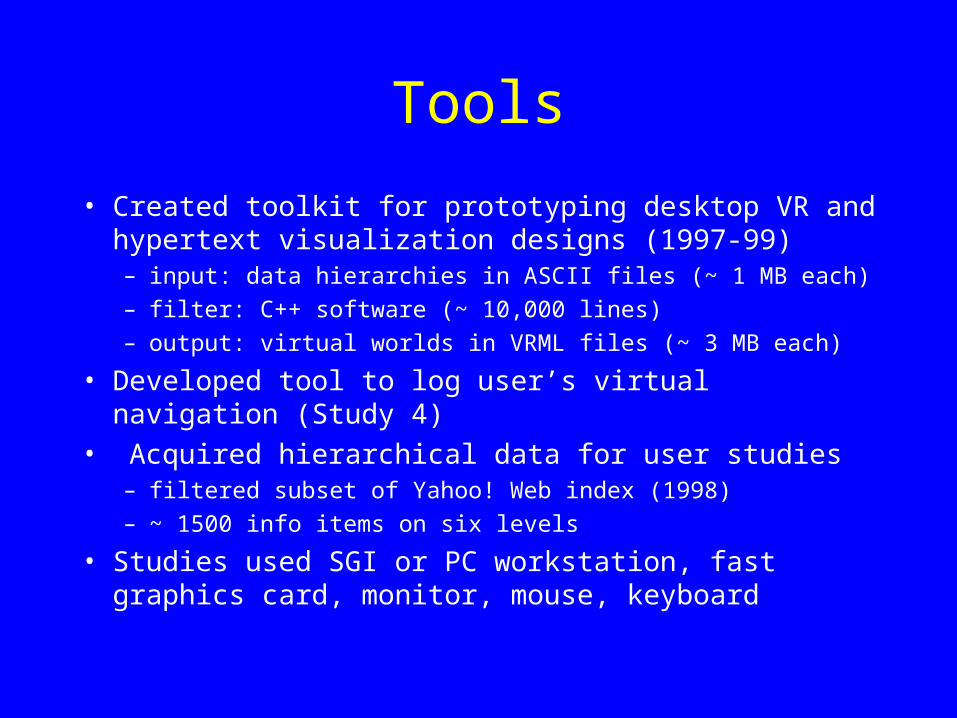
Tools
• Created toolkit for prototyping desktop VR and hypertext visualization designs (1997-99)– input: data hierarchies in ASCII files (~ 1 MB each)
– filter: C++ software (~ 10,000 lines)
– output: virtual worlds in VRML files (~ 3 MB each)
• Developed tool to log user’s virtual navigation (Study 4)
• Acquired hierarchical data for user studies– filtered subset of Yahoo! Web index (1998)
– ~ 1500 info items on six levels
• Studies used SGI or PC workstation, fast graphics card, monitor, mouse, keyboard

“Efficient” Day World

Map View of “Efficient” Day World

(Demo)

Methods
• Conducted user study with 20 participants
• Compared two visualization designs
• During each study session:1) spatial ability test (a previous day)
2) Introduction and UI training (30 minutes)
3) 2 blocks of trials (20 minutes per block)a) “Scavenger hunt” for data items (0 -30 trials)
b) After each block, test for structure-learning ability
4) Questionnaire and debriefing

Results
• World design: in map design, users ...– overall - found more targets and rated higher efficiency– per trial - traveled less, made fewer errors, and stayed
closer to target
• Spatial ability: lowest 25% of users ...– overall - found fewer targets– per trial – traveled farther, and made more errors
• Structure-learning ability: higher-ability users ...– Overall - found more targets– per trial - stayed closer to target

• Benefits of 3D UIs for some tasks do not outweigh higher cognitive requirements.
• Different designs/training may be needed to compensate people with low levels of needed cognitive abilities
• Empirical evaluation is essential
Discussion

3. Implications and Future

General Implications
• Humans inherently 2+ D creatures, except for acrobats, divers, and pilots
• These studies showed value of 2D UI for task performance, but 3D for enjoyment
• Naïve naturalism in desktop VR bad for task and system performance
• Trade-off ease of sensory representation vs. power of imaginative construction

Product Implications
• Computer graphics evolution + younger market demographics + information explosion dynamic visual interfaces, tools to manage overload, and information as entertainment
• Visualization tools promising for intranets, digital libraries, e-business (B2C)
• Possibilities for real-time, multi-user communications (e.g., chat, conferencing) to add value and/or provide services

(Scenario)
Suggested Readings
• Card, S.K., Mackinlay, J.D., and Shneiderman, B., eds. Readings in information visualization: Using vision to think. Morgan Kaufmann, 1999.
• Gibson, W., Neuromancer. Ace Books, 1995.
• Modjeska, D. Hierarchical Data Visualization in Desktop Virtual Reality. Ph.D. thesis. University of Toronto, 2000. (www.dgp.utoronto.ca/people/modjeska/Pubs/modjeska_thesis.pdf)
• Stepenson, N., Snow Crash. Bantam, 2000