information, college decisions and financial aid: …
TRANSCRIPT

INFORMATION, COLLEGE DECISIONS AND FINANCIAL AID:
EVIDENCE FROM A CLUSTER-RANDOMIZED CONTROL TRIAL IN CHINA
Prashant Loyalkaa ([email protected])
Yingquan Songa ([email protected])
Jianguo Weia ([email protected])
Scott Rozelleb ([email protected])
a China Institute for Educational Finance Research (CIEFR), Peking University
b Stanford University, Freeman-Spogli Institute for International Studies
Corresponding Author:
Prashant Loyalka
China Institute for Educational Finance Research (CIEFR)
Building 17, Peking University
#5 Summer Palace Rd.
Beijing, PRC 100871
Phone: +86-15001166847
Fax: +86-10-62756183
November 2010

1
INFORMATION, COLLEGE DECISIONS AND FINANCIAL AID:
EVIDENCE FROM A CLUSTER-RANDOMIZED CONTROL TRIAL IN CHINA
ABSTRACT
Studies find that disadvantaged students in the United States are often misinformed about
college costs and financial aid opportunities and thus may make sub-optimal decisions
regarding college. This information problem may be even more serious in developing
countries. We therefore conducted a cluster-randomized control trial to examine the effects of
providing information on college costs and financial aid to high school students in poor
regions of northwest China. We find that information increases the likelihood that students
receive some types of financial aid, but has no significant effect on specific college choices or
whether students persist to go to college.
JEL: I22, 015
Keywords and phrases: Education, financial aid, information, cluster-RCT
2
1. Introduction
Recent research underscores the effect of college costs and financial aid on
educational outcomes (Long, 2008). Increased financial aid can improve college outcomes by
lowering the price of college and loosening credit constraints (Dynarski, 2002). Empirical
studies find positive effects of merit aid (Cornwell, Mustard, and Sridhar, 2006), needs-based
aid (Kane, 1996) and educational loans (Dynarski, 2003). The effects are multidimensional;
financial aid raises college attendance (Linsenmeier, Rosen and Rouse, 2006), increases
enrollment (van der Klauuw, 2002), prolongs attendance (Bettinger, 2004) and influences
college choice (Avery and Hoxby, 2003). As the cost of college in a net sense (that is, total
cost minus the contribution of financial aid) is potentially of greatest concern to students from
disadvantaged backgrounds, a number of studies focus on the effects of financial aid on
lower-income and minority students (e.g. Linsenmeier, Rosen and Rouse, 2006).
Despite the importance of financial aid on student outcomes, students and their parents
may not have complete or correct information about the costs of college and financial aid
options (Ikenberry and Hartle, 1998; Horn, Chen, and Chapman, 2003; ACSFA, 2005). This
information problem is especially prevalent among low-income families and minorities
(McDonough and Calderone, 2006; Kane and Avery, 2004; Horn, Chen, and Chapman, 2003).
According to several studies, if students and their parents overestimate the expected net costs
of higher education (which includes underestimating the probability of receiving financial
aid), they are less likely to attend college; they may choose colleges of lower quality; and/or
they may fail to apply for all of the available sources of financial aid (Long, 2008;
Commission, 2006). As a consequence, differences in access to information about financial

3
aid and college costs among the population of potential college students may in part explain
why disadvantaged groups tend to have more difficulties attending college (Long, 2008).
To address this information problem, governments, universities and other private
organizations in developed countries provide students and their families with steadily
improving access to low-cost (or free), user-friendly materials about college costs and
financial aid (Perna, 2006). Some organizations offer comprehensive intervention packages
that include college counseling, mentoring and pre-college preparation programs (Long, 2008;
Kane and Avery, 2004). The assumption is that the information conveyed through such
materials and services helps students make better decisions. However, such assumptions are
based on perception and not evidence. In fact, we are only familiar with one concurrent study
in the United States that utilizes experimental methods to evaluate the causal effects of
providing this kind of information on college outcomes (Bettinger et al., 2009).
This paper contributes towards this gap in the literature by presenting experimental
evidence about the effects of providing college cost and financial aid information on a
student’s choices of college, their persistence to go to college, and their likelihood of
receiving aid. Specifically, in this paper we present results from a cluster-randomized control
trial conducted across poor counties in Shaanxi province in Northwest China. During the
intervention, designed and implemented by the authors, trained enumerators provided senior
high school students in 41 high schools with comprehensive, user-friendly information about
college costs and financial aid. After conducting a baseline survey and intervention in April
2008, we followed-up with students eight months later and inquired about three outcomes:
what college did they choose to apply for; did they choose to repeat the college entrance exam,

4
and did they receive financial aid. Our results indicate that college cost and financial aid
information increased the probability that students received certain types of financial aid. The
results also suggest that information had no significant impact on whether students chose to
go to (free) military college or the likelihood that students repeated the entrance exam.
The findings of this paper may be of interest to policymakers in China. In 2007 the
State Council implemented a new financial aid policy that, for the first time, provided
extensive coverage and substantial funding to eligible students. Yet descriptive evidence
indicates that a significant proportion of students in their last year of high school, especially
those of lower socioeconomic status, are not adequately familiar with the financial aid
opportunities granted by this policy or even with college costs in general (Shi et al., 2007).
According to the findings of the current paper, China’s education system should provide more
information to students so that they can take advantage of the financial aid available to them.
The rest of the paper is organized as follows. Section 2 describes the costs of attending
college in China and introduces different types of financial aid instruments that are currently
available to students. Section 3 explores how students in China are acquiring information
about college costs and financial aid. In this section we also discuss how greater access to
information may affect the college outcomes of students. Section 4 lays out the hypotheses.
Section 5 describes the intervention, the cluster-randomized research design and the analytical
models. Section 6 describes the data from the baseline and post-intervention surveys. Section
7 presents the results of the analysis and section 8 concludes.
2. College costs and financial aid opportunities in China

5
In 1999 the central government embarked on an ambitious initiative to expand higher
education. Four-year college undergraduate enrollments grew from 2.7 million in 1999 to over
10 million in 2007 (National Bureau of Statistics of China, 2008). The number and diversity
of higher education institutions (HEIs) also increased. Two years earlier, in 1997, cost-sharing
(implemented in large part to finance the expansion of the college system) and financial aid
also emerged in China’s higher education system.
Together, the new cost-sharing policies, the expansion in enrollments and greater
institutional differentiation combined to dramatically increase the public’s concerns about the
affordability of college. Scholars and educators began to discuss the challenges families faced
in affording college (Chen and Zhong, 2002). In response, China’s government began
establishing policies for controlling college costs (MOE, NDRC, MOF, 2003) and introducing
financial aid instruments that have steadily grown in scope and complexity.1
While college costs have grown everywhere, they vary systematically across the
higher education landscape (Table 1).2 College costs in China are fixed by policymakers in
different agencies at both the central and provincial levels. Policymakers control tuition
according to an institutional hierarchy that exists within the higher education system (rows 1
to 4). The two most selective university tiers, tiers one and two, are generally comprised of
four-year public universities which admit only students with the highest college entrance
exam scores. Paradoxically, college costs at these universities are relatively low compared to
those of the less competitive four-year private institutions that comprise tier three universities.
The costs of tier four colleges are similar to those of tier one and two. Tuition fees also vary

6
across different provinces and universities (columns 1 to 3). In fact, college costs can even
differ across majors within the same university (Shaanxi Admissions Committee, 2007).
While rising costs have become a reality for those pursuing a college education,
financial aid initiatives have emerged to help low-income students. In the 1990s policymakers
began to offer subsidies and grants for low-income students. Work study programs were
launched. Tuition reductions were ostensibly offered to students having trouble paying tuition
and fees. A government-subsidized student loan scheme was also piloted. In 2000, education
officials initiated the ―green channel‖ program which was designed to allow low-income
students to enroll in and begin attending university before undergoing a needs-based financial
aid assessment or having to pay any tuition fees. A national merit scholarship was also
implemented in 2004.
Even after these programs were established, however, many gaps still remained. In
2007 the State Council made several adjustments to the existing financial aid system. First, it
significantly expanded the national needs-based grant program with the goal of providing
enough funding to reach 20 percent of total college enrollment. Second, it provided a greater
number of merit-based scholarships. Third, it offered full-tuition waivers and stipends to
students who enrolled in one of six normal universities affiliated with the Ministry of
Education (MOE). Finally, the government piloted a new kind of student loan scheme in
which students could apply for loans in their hometowns through the China Development
Bank (hereafter referred to as ―home-based‖ loans).
3. Information about college costs and financial aid in China

7
Along with the rapid expansion of and continual reforms within China’s higher
education system over the last decade, students continue to perceive that the levels of tuition
and fees are a major barrier to obtaining a college education. A significant proportion of
students in our baseline survey (described below) show a limited knowledge of college costs
and financial aid. Given the complex nature of China’s university admissions process and the
fact that students are granted admission into only one university, such lack of information
may inhibit students from making optimal choices. In this section we first discuss when and
how students acquire information on college costs and financial aid. In the second part of the
section we explore the potential importance of timely and complete information.
3.1 How students access information
To gain admission into college, China’s high school students take a provincial-wide
college entrance exam at the end of their senior year. A week or two later, students fill out a
college choice form (called the zhiyuan form) and submit their top choices in each of the
different tiers of colleges to a provincial education authority. In filling out their college choice
form, students are able to choose several universities within each of the four university tiers
(described in section 2), as well as from a ―pre-tier‖ which is comprised of universities that
have special permission to offer early admissions to students (e.g. military universities, arts
and sports universities). After the college entrance exam scores of the students are tallied,
provincial educational authorities sort through the college choice forms, matching students to
universities according to their score ranking. At the end of the sorting process, each student is
assigned to only one university. Admitted students receive an admissions packet in
mid-summer and then have just one choice—attend the college to which they are assigned or

8
not attend college. If they choose to matriculate, students go to their university around late
August, pay the required tuition and fees and are then enrolled.
In lieu of a formal program or information source to help guide students through this
process, high school students rely on a mix of information sources, including their parents,
friends and teachers (Liu et al., 2008). Economically-disadvantaged students in fact often get
information from individuals who themselves never went to college and are generally not in a
position to keep up with the latest changes in educational policy (Liu et al., 2008).
Students’ only official introduction to financial aid opportunities comes in the form of
a financial aid informational booklet that is included in the admissions packet sent to students
after they have already been admitted into public universities.3 In other words, students do not
have access to the booklet, which is created by the Ministry of Education and the Ministry of
Finance, when they fill out their college choice form. In their admissions packet, students also
officially learn for the first time about the costs of going to the particular college into which
they are enrolling. Students also do not find out about whether or not they are eligible for
financial aid until—at the earliest—the middle of their first semester in university.
3.2 The importance of access to information
The problems resulting from inadequate information about college costs and financial
aid have the potential to seriously affect the choices and educational outcomes of students
everywhere. Net college prices may directly affect the educational choices of
students—especially in poorer developing countries like China. Having access to adequate
college cost and financial aid information may be particularly important for poor students
from rural areas, as the average annual tuition for a public four-year Chinese university is

9
roughly 150% of an average rural household’s yearly disposable income.4 The tuition and fees
can be many times more than the income of a family at the poverty line.
Unlike the US, where colleges usually offer financial aid packages to attract students
before they make their decision to enroll, students in China formally learn about financial aid
only once they have made their college choices and been admitted into one specific university.
This lack of timely information about costs and financial aid may cause students to make poor
college-related choices. Without having a clear idea of China’s HEI fee structure or the
financial aid opportunities that they may be eligible for, students might overestimate the cost
of attending more selective universities. Such a miscalculation could, for example, cause
students to choose lower-ranked schools or to apply for military universities or teaching
colleges (which although free, require lengthy periods of service upon graduation). At the
same time, students may underestimate the cost of college. If so, they may choose to enroll in
an institution that they cannot afford and thus have to make the difficult post-admissions
decision of whether or not to attend the college despite its high costs, reapply for college the
next year, or choose an option outside of the higher education system. In China, where
students gain admission into a single HEI and generally cannot transfer to another university
or department, the ramifications of making poorly-informed choices are serious.
Students from disadvantaged backgrounds may especially lack information. For
example, educators in poorer regions may provide lower quality information to their students
or students may not be able to acquire informational resources easily through the Internet.
This is further exacerbated by the fact that the language used in China’s financial aid policies

10
tends to be jargon-laden and difficult to understand. These types of information constraints
raise the costs of college decisions for disadvantaged students (Hastings et al., 2007).
Finally, because China’s education system tracks students at various points along their
educational careers, misinformation about net college costs could deter disadvantaged
students from aspiring or preparing for college early on (Long, 2008). Parents lacking
accurate information about college costs and financial aid may assume that they will not be
able to afford college in the future, and thus early on steer their children into non-academic
tracks or allow them to drop out of school altogether and join the unskilled labor force.
4. Hypotheses
The broad research questions of this paper are: How does access to information about
college costs and financial aid affect the choice of college? Does information affect
persistence in attempts to go to college? Can access to information increase the likelihood of
receiving financial aid? In this section we explore these questions in more detail within the
context of the present study and provide a specific hypothesis for each.
4.1 Information and College Choice
There are many dimensions of college choice in China that might be affected by
increased access to information. Given the complexity of China’s application and admissions
process (as well as the ways in which this process could interact with an information
intervention to offer diverse and competing incentives to students from different backgrounds),
we decided that it was difficult to produce unambiguous hypotheses when considering some
dimensions of college choice. Indeed, the complexity of China’s admissions matching process
11
combined with the fact that aid is allocated only after students enter college makes the value
of providing information difficult to assess for many choices.
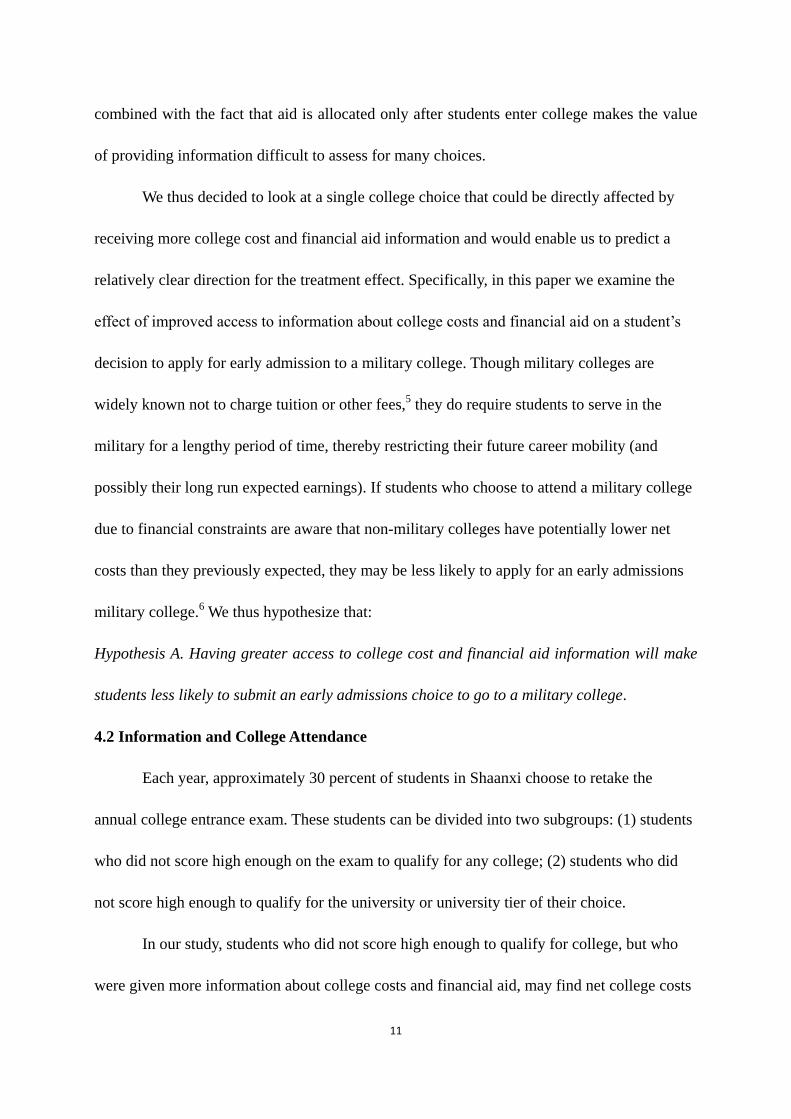
We thus decided to look at a single college choice that could be directly affected by
receiving more college cost and financial aid information and would enable us to predict a
relatively clear direction for the treatment effect. Specifically, in this paper we examine the
effect of improved access to information about college costs and financial aid on a student’s
decision to apply for early admission to a military college. Though military colleges are
widely known not to charge tuition or other fees,5 they do require students to serve in the
military for a lengthy period of time, thereby restricting their future career mobility (and
possibly their long run expected earnings). If students who choose to attend a military college
due to financial constraints are aware that non-military colleges have potentially lower net
costs than they previously expected, they may be less likely to apply for an early admissions
military college.6 We thus hypothesize that:
Hypothesis A. Having greater access to college cost and financial aid information will make
students less likely to submit an early admissions choice to go to a military college.
4.2 Information and College Attendance
Each year, approximately 30 percent of students in Shaanxi choose to retake the
annual college entrance exam. These students can be divided into two subgroups: (1) students
who did not score high enough on the exam to qualify for any college; (2) students who did
not score high enough to qualify for the university or university tier of their choice.
In our study, students who did not score high enough to qualify for college, but who
were given more information about college costs and financial aid, may find net college costs
12
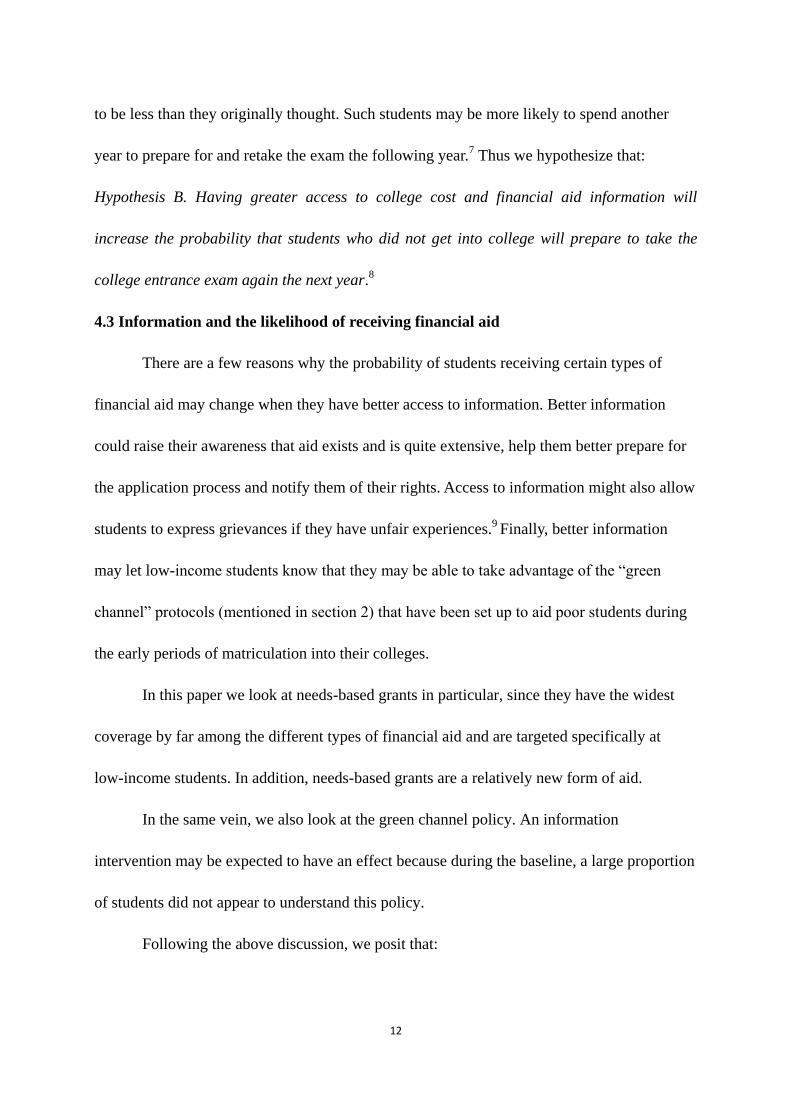
to be less than they originally thought. Such students may be more likely to spend another
year to prepare for and retake the exam the following year.7 Thus we hypothesize that:
Hypothesis B. Having greater access to college cost and financial aid information will
increase the probability that students who did not get into college will prepare to take the
college entrance exam again the next year.8
4.3 Information and the likelihood of receiving financial aid
There are a few reasons why the probability of students receiving certain types of
financial aid may change when they have better access to information. Better information
could raise their awareness that aid exists and is quite extensive, help them better prepare for
the application process and notify them of their rights. Access to information might also allow
students to express grievances if they have unfair experiences.9 Finally, better information
may let low-income students know that they may be able to take advantage of the ―green
channel‖ protocols (mentioned in section 2) that have been set up to aid poor students during
the early periods of matriculation into their colleges.
In this paper we look at needs-based grants in particular, since they have the widest
coverage by far among the different types of financial aid and are targeted specifically at
low-income students. In addition, needs-based grants are a relatively new form of aid.
In the same vein, we also look at the green channel policy. An information
intervention may be expected to have an effect because during the baseline, a large proportion
of students did not appear to understand this policy.
Following the above discussion, we posit that:

13
Hypotheses C and D. Having greater access to college cost and financial aid information will
increase the likelihood that students receive needs-based grants (C) and take advantage of the
green channel policy (D).
5. The intervention and research design
To answer the questions above, we designed and implemented a cluster-randomized
control trial (hereafter ―cluster-RCT‖) across 41 counties in Shaanxi province. This section
discusses the use of cluster-RCTs to assess information interventions, describes our particular
intervention and presents the research design and model.
5.1 Cluster-randomized control trials and information interventions
Many scholars consider well-conducted, policy-relevant randomized experiments to
be the best platform from which to draw causal inferences (Shadish and Cook, 2009). In
addition to solving the problem of selection bias which often plagues studies involving
observational data, randomized experiments further reduce publication bias (Duflo,
Glennerster and Kremer, 2007). Glewwe and Kremer (2006) also argue for the use of
randomized experiments to examine the impact of school inputs on student outcomes instead
of traditional production function approaches used pervasively in the economics of education.
In this paper, our concern is that students and their families may possess different
degrees of information about college costs and financial aid, and this is likely to be correlated
with a number of observable and unobservable factors that are in turn associated with college
outcomes. A well-designed randomized experiment may overcome this selection-bias issue
and help estimate the true impact of college cost and financial aid information.

14
Cluster-RCTs differ from individual-RCTs in that intact clusters such as schools are
assigned to treatment or control groups and yet the outcomes of individuals who are nested
within those clusters are analyzed. There are several reasons why we chose to conduct a
cluster-RCT instead of randomizing at the level of individual students. First, running a
cluster-RCT enabled us to conduct the intervention in the natural setting of the classroom. A
scaled-up intervention from government agencies would likely provide information through
schools directly. Also, the use of a cluster-RCT across 41 ―nationally-designated poor counties‖
from Shaanxi province increased the external validity of our study.10
Our sample is fairly
representative of senior students in non-fast track classes in the best high schools in poor
counties in Shaanxi. Furthermore, by sampling geographically dispersed clusters, we avoided
information spillovers that would have compromised experimental validity.
5.2 The intervention
In this study, students in randomly-selected ―treatment‖ classes were primarily given
information on college costs and financial aid through a 30-page user-friendly booklet. The
booklet contained information related to financial aid, including the target population and
explanations about the different financial aid programs supported by the central government
(including merit-based scholarships, needs-based grants, tuition waivers, various types of
subsidies, loans, work-study options, military and teaching college fee waivers and stipends
and the green channel policy). The booklet also detailed the exact process for applying for
financial aid, including an explanation of the materials students need to prepare before
arriving at university. Other sections of the booklet discussed the timing of receiving financial
aid both within and across a student’s college years; provided different government agency

15
hotline numbers for further inquiries or to report problems; and listed additional web
resources and policy documents to which students could refer. Yet another part of the booklet
was devoted to college costs. In particular, we produced tables that illustrated the price ranges
that students from Shaanxi would face if they were admitted to different tier universities.
These tables also documented the variation in tuition list prices across majors in various
provinces and in university tiers across China. Dorm fees and other costs were discussed.
In producing the booklet, we took care to make sure the information was presented in
an accessible manner. It was written in a simple, jargon free question-answer format that
covered the information in a concise yet thorough manner and designed with clear headings,
large fonts, and an attractive color cover. The booklet is posted on our website (ID INFO).11
Each treatment class also received a 17-18 minute oral presentation that covered the
main points of the booklet. The presentations were delivered by trained enumerators who
were instructed to give the presentations exactly the same way each time.12
After the
presentation, five minutes were left open for students to ask questions that might be answered
using the content of the booklet only.13
After the question-answer period, the students were
asked to fill out an anonymous five-minute feedback form regarding the booklet and
presentation. The feedback form was designed to elicit qualitative evidence about whether or
not the information intervention was helpful and to examine whether students had further
questions about the topics covered or others that were not addressed.14
Students in treatment
classes were also asked to take the booklet home and share its content with their parents.
5.3 Research design and model

16
The sample for our cluster-RCT was drawn from the best high school in each of 41
nationally-designated poor counties in Shaanxi Province and was chosen in a four step
process. The first step involved generating a list of the 41 counties from which we chose the
highest-ranking high school in each county.15
The second step involved randomly assigning
20 schools to receive an information treatment intervention and 21 schools to receive no
intervention.16
The third step involved visiting each school and randomly choosing one
non-fast track class of third-year students (seniors) from ―science track‖ classes and one from
―humanities track‖ classes.17
Students in the science track classes were given the information
intervention (if they were in a treatment school). Students in the humanities track classes did
not receive the intervention (even if they were in a treatment school). This enabled us not only
to examine the differences in college-related outcomes between treated and untreated students
from science classes to find the main effects of the information intervention, but also allowed
us to look at the differences in outcomes between students from humanities classes in
treatment and control schools to test for the existence of spillovers from the intervention.
We were concerned that information given to the treatment group might in some way
make its way to students in the control schools. We thus tried to minimize the existence of
uncontrolled information spillovers and other types of unintended externalities when
constructing the research design. For example, we decided to randomize at the level of
counties to minimize the sharing of information between students in treatment and control
groups, as this would likely bias the treatment estimates. Furthermore, as mentioned in section
2, as it seemed possible that the information intervention could interact with China’s complex
college and application process (especially since students compete for a limited number of

17
university and major spots), we decided to target the intervention to only one class per
treatment school. In this way we avoided creating general equilibrium effects in which the
college and major choices of some students could crowd out the choices of students who did
not receive the intervention. Similarly, we wanted to avoid the situation in which application
for financial aid of the treated students could crowd out the efforts of other students to obtain
aid. We assumed that students in treatment classes would not likely share the information with
their peers in other classes so as to affect their college decisions and thus create these general
equilibrium effects. Given our decision to survey both a science track and humanities track
class in each school, we were able to test for this type of externality.
Model. Cluster RCTs with binary outcomes are often evaluated using a random effects
(RE) logit model in the fields of public health and education (Hayes and Moulton, 2009;
Raudenbush and Bryk, 2002). A simplified model in the context of our study would be:
(1) logit{E(Yij|T)+ = logit*P(Yij = 1|T) = logit(pij) = α0 + α1T0j + u0j
where there are j = {1, …, 41} classes and i = {1,…𝑛𝑗} individuals in each class j. In the
above model, 𝑌𝑖𝑗 represents the individual-level binary outcome of interest, 𝑝𝑖𝑗 represents
the probability of success for the ith student in the jth cluster, α0 is the average in log odds of
success across clusters, 𝑇0𝑗 is a cluster-level indicator that equals 1/2 for treatment schools
and -1/2 otherwise, 𝑢0𝑗 represents other random unobserved cluster-level factors which are
again uncorrelated with 𝑇𝑗 but which may affect the log odds of success in a cluster, and α1
is the difference between treatment and control clusters holding constant the value of the
random effect and is the effect of interest. In the standard setup, 𝑢0𝑗 is assumed to be
normally distributed with mean zero and constant variance.

18
Analyses in cluster-RCTs with binary outcomes also may use generalized estimating
equations (GEE) models (Raudenbush and Bryk, 2002). The GEE model adjusts the
correlation matrix used in the estimation of the treatment effect instead of including a
cluster-level error term as in model (1) (Liang and Zeger, 1986). More importantly, the GEE
model estimates the average effect of the intervention across the population rather than a
cluster-specific intervention effect as in an RE logit model (Raudenbush and Bryk, 2002).
We present results from ordinary least squares (OLS) with robust, school/county-level
clustered errors, which is standard in the economics literature (e.g. see Jensen, 2010). Since
all of our outcomes are binary variables, however, we also run logit models using school
-level clustered errors to test for sensitivity to model specification. We also present results
from GEE models (with robust SEs).
Other Statistical Issues: We paid close attention to statistical power. We tried to
minimize across-cluster variation by focusing on poor counties within the same province and
choosing the best school in each county. We also chose non fast-track classes.
In cluster-RCTs with continuous outcomes, using covariate adjustments can greatly
increase power, especially if baseline covariates can be found that are strongly correlated with
the outcome of interest (which may be the case in higher levels of schooling) (Bloom et al.,
2007). In cluster-RCTs with binary outcomes, however, the repercussions of adjusting for
baseline covariates are less clear (Zhang et al., 2008). We thus decided to use an unadjusted
model and a model adjusted for individual and cluster-level covariates.
In the rest of the paper, we incorporate the following baseline covariates in the
―adjusted‖ model for each outcome: age, gender, parents’ highest education level, number of

19
siblings, urban/rural residence, a dummy for father’s occupational status (1 = high status, 0 =
low status), and a dummy for whether a student had a minimum goal of attending at least a
second-tier university (―student aspiration‖). We also include a dummy variable that notes
whether or not a county was affected by the earthquake in May 200818
, as well as the
classroom teacher’s estimate of what percentage of students would attend a first or second-tier
university (―teacher estimate‖). For the financial aid receipt outcomes, we add an indicator
that equaled 1 if students felt they could receive that type of aid.
6. Data
Our field experiment took place in Shaanxi province in northwest China. Shaanxi is
one of China’s poorest provinces. It ranks 26th
out of 31 among provinces in terms of average
per capita disposable income for urban dwellers and 28th
for rural residents.19
Shaanxi has 107
counties, but in our study we surveyed only the 41 that are officially designated as poor
counties. Altogether we collected baseline survey data in April 2008 on 2,508 science
students and 2,478 humanities students. Research teams first asked students in all science and
humanities classes to fill out a short baseline questionnaire.20
Enumerators also collected
baseline information from teachers and principals about classroom and school characteristics.
Data from the baseline survey shows that the randomization across schools resulted in
treatment and control groups which were reasonably identical in baseline characteristics
(Table 2). Average class characteristics are similar between treatment and control groups in
the case of both science and humanities-tracks with the possible exception of gender and the
teacher’s expectation about the percentage of students that would be admitted to a first or
second tier university; we control for these covariates in our later analyses.

20
We followed up with students in December 2008 via both telephone and Internet,
locating 93.3% (2341) of science-track students and 90.6% (2245) of humanities-track
students.21
We asked students about their educational or occupational status, their score on the
college entrance exam, the choices they made on the college choice form, and whether they
applied for and received each of the main types of financial aid. Briefly, we found that over
99% of students in the sample took the entrance exam, 57% attended college, and 31% chose
to repeat their last year of high school to retake the college entrance exam.
7. Results and Discussion
Our main analysis in the first subsection below looks at the effects of the information
intervention on college-related outcomes between students in treatment and control
science-track classes. The analysis focuses on explaining four binary outcomes: a) the
probability of applying for early admission into a military college; b) the probability of
repeating the college entrance exam (for students in roughly the lower half of the
socioeconomic status (SES) distribution as measured by father’s education level); c) the
likelihood of receiving needs-based grants; and d) the likelihood of qualifying for the green
channel policy. To look at the spillover effects, in subsection 7.2 we examine the differences
in college-related outcomes between students in humanities-track treatment classes (who did
not receive the information intervention, but who were in the schools in which the
science-track classes received the information intervention) and students in humanities-track
control classes. We also perform robustness checks for missing data for both the main and
spillover analyses in subsection 7.3 to examine if our results are affected by the (relatively

21
mild) attrition in our post-intervention data. Finally, in 7.4 we explore student feedback (from
students in science-track treatment classes) about the intervention.
7.1 Results from the Main Analysis
Table 3A-C presents the treatment effect estimates for students in science-track classes
using six analytical approaches in total: there are three sets of estimated coefficients from
three alternative estimators—from the OLS analysis (Table 3A); the logit analysis (Table 3B)
and the generalized estimating equations (GEE) (Table 3C). For each of the estimators, we
report the coefficients from two alternative specifications—a model that is unadjusted (left
half of table 3, first column) and a model that is adjusted for covariates (left half of table 3,
second column). Estimates that are reported as marginal effects for OLS and logit models and
as odds-ratios for the GEE models; p-values are given in parentheses.22
The results from our model allow us to test our hypotheses. In regards to Hypothesis A,
we are unable to reject the null hypothesis that the intervention does not have a significant
impact on the choice of early admission to a military college (Tables 3A, 3B and 3C). The
estimates are small in magnitude and have large p-values for each of the specifications: the
OLS model unadjusted for covariates (Table 3A, row 1, column 1), the logit model unadjusted
for covariates (Table 3B, row 1, column 1), and the generalized estimating equations model
unadjusted for covariates (Table 3C, row 1, column 1). Furthermore, the estimates are also
small in magnitude and insignificant in the covariate-adjusted OLS model (Table 3A, row 1,
column 2), the covariate-adjusted logit model (Table 3B, row 1, column 2), and the
covariate-adjusted GEE model (Table 3C, row 1, column 2). In other words, we find little
evidence that the intervention affected the decision to apply to a military college.
22
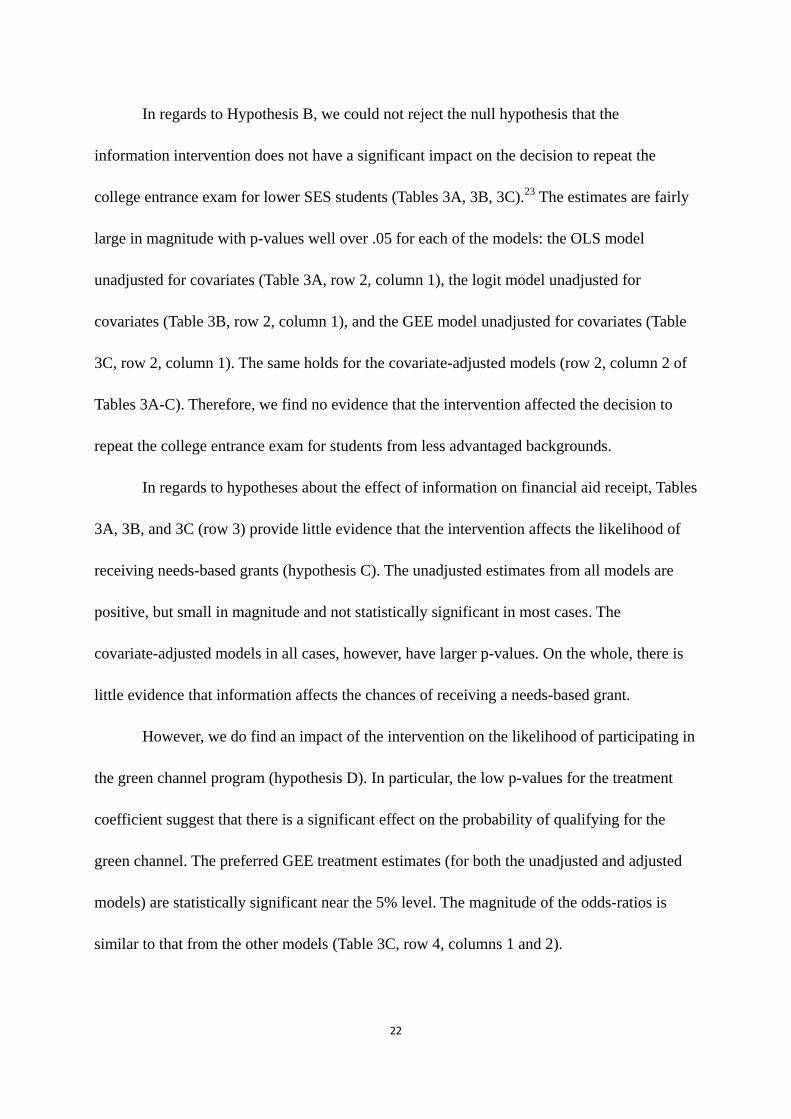
In regards to Hypothesis B, we could not reject the null hypothesis that the
information intervention does not have a significant impact on the decision to repeat the
college entrance exam for lower SES students (Tables 3A, 3B, 3C).23
The estimates are fairly
large in magnitude with p-values well over .05 for each of the models: the OLS model
unadjusted for covariates (Table 3A, row 2, column 1), the logit model unadjusted for
covariates (Table 3B, row 2, column 1), and the GEE model unadjusted for covariates (Table
3C, row 2, column 1). The same holds for the covariate-adjusted models (row 2, column 2 of
Tables 3A-C). Therefore, we find no evidence that the intervention affected the decision to
repeat the college entrance exam for students from less advantaged backgrounds.
In regards to hypotheses about the effect of information on financial aid receipt, Tables
3A, 3B, and 3C (row 3) provide little evidence that the intervention affects the likelihood of
receiving needs-based grants (hypothesis C). The unadjusted estimates from all models are
positive, but small in magnitude and not statistically significant in most cases. The
covariate-adjusted models in all cases, however, have larger p-values. On the whole, there is
little evidence that information affects the chances of receiving a needs-based grant.
However, we do find an impact of the intervention on the likelihood of participating in
the green channel program (hypothesis D). In particular, the low p-values for the treatment
coefficient suggest that there is a significant effect on the probability of qualifying for the
green channel. The preferred GEE treatment estimates (for both the unadjusted and adjusted
models) are statistically significant near the 5% level. The magnitude of the odds-ratios is
similar to that from the other models (Table 3C, row 4, columns 1 and 2).

23
We also explore the effect of the information intervention on other forms of financial
aid (Tables 4A and 4B): the receipt of nationally supported, home-based loans (column 3), the
receipt of nationally supported, school-based loans (column 4) and access to special subsidies
for poor students (column 5).24
Our analysis indicates that information may positively affect
the likelihood of a student being able to obtain a home-based loan (row 1, column 3).
There are several possible reasons why the information intervention had no effect on
the choice of military college or repeating the college entrance exam. Outcomes are perhaps
influenced more by factors besides information on college costs and financial aid. Specifically,
elements such as: a) the returns to different colleges and majors; b) personal preferences for
different institutions and future careers; c) the influence of family, teachers and peers in
making college-related decisions (informed or not); d) family background; and e)
performance on the entrance exam may have greater influence on college-related decisions.
Furthermore, it could be that the intervention was not powerful enough because current policy
does not reduce fees sufficiently to influence the decisions of students. It is also possible that
the information was not presented over a long enough time or in the proper manner. Finally, it
is possible that students in the midst of high-pressure preparations for the college entrance
exam could not absorb the information from the intervention. Future research might test if
earlier interventions affect college choices and repeat exam decisions.
Our analysis suggests that information does increase the likelihood that students will
receive certain types of financial aid, notably the green-channel policy and home-based loans.
On our baseline survey, a large proportion of students stated that they were unfamiliar with
the green channel policy. Home-based loans were also a relatively new policy that students

24
may not be familiar with. Moreover, it is important to note that home-based loans are best
applied for and used prior to the matriculation of students into university. This would also
partially explain why our intervention affected this type of aid more than others.
7.2 Results from the Spillovers Analysis
We conducted a robustness test for spillovers by examining the differences between
treatment and control humanities-track classes; we found no evidence of information
spillovers on student college choice, attendance, or the receipt of financial aid (Tables 5A, 5B,
and 5C). Regarding the six specifications – OLS, logit, GEE (unadjusted and adjusted for
covariates) – the estimates are small in magnitude with large p-values. The results are thus
consistent with the interpretation that treated science-track students did not share information
with their classmates within the same school (albeit of a different track) so as to influence
their college-related outcomes. It is thus highly unlikely that students in our treatment schools
shared information with students in other (non-treatment) schools, much less across counties.
7.3 Accounting for Missing Observations
As mentioned in section 6, in the follow-up evaluation survey in December 2008, we
were able to locate 93.3% and 90.6% of the students in science-track and humanities-track
classes respectively. While balance in observable characteristics is maintained across
treatment and control groups for both types of classes among the students we located, we
nonetheless seek to account for missing data in several ways. First, in the basic models, we
run the analyses without making missing data adjustments—this is the ―listwise deletion‖
approach which is only viable under the missing completely at random assumption (Schafer
and Graham, 2002). However, the students that we could not find may be missing

25
non-randomly because of certain factors that also affect the relationship between access to
information and one of the college outcomes. As such, we test the robustness of our results by
using multiple imputation for the missing data (see the results in the right half of Tables 3A,
3B, 3C, third and fourth columns). Specifically, we impute the missing outcome values across
clusters within treatment and control groups separately. Multiple imputation makes findings
robust under a more general missing at random assumption (Schafer and Graham, 2002).
7.4 Feedback Form Results
The feedback portion of the intervention was intended to learn about students’
subjective impressions about whether they found the intervention helpful. Approximately 90%
of the treated science-track class students said they found the financial aid information
intervention helpful (50%) or very helpful (40%). These same students gave reasons for why
the information was helpful. While more than half of the reasons were limited to general
statements such as ―I learned more about the university financial aid system and related
policies‖, students also indicated that they learned more about specific types of financial aid
such as grants (7%), the green channel (3%), loans (14%), scholarships (9%), work-study (4%)
as well as the costs of college (7%). In addition, 94% of all treatment science-track students
also said their parents would find the financial aid information booklet helpful (66%) or very
helpful (28%). These positive reactions to the intervention support the idea that information
may have an impact on the chances that students receive financial aid.
Students provided still further feedback about ways in which the booklet and
presentation could be improved, as well as whether or not the information would affect their
college choices and how. Out of the one-third of the treated science-track students who said
26
the intervention could be improved: about 27% wanted still more detailed information about
college costs and financial aid, while about 2% asked that the style and/or quality of the
presentation and booklet be improved. Finally, about 25% of the treated science-track students
said that the intervention would affect their college choices. Out of these students, about 41%
said that they would now choose a college only after further considering aid and expenses
(but they did not state specifically how their choices would change), about 20% of them said
that knowing about these financial aid policies would allow them to choose a higher-quality
college without having to worry about finances, another 11% said they would choose a
less-expensive college. Altogether, we find that a significant proportion of students felt
information would affect their college choices, albeit in different ways.
8. Conclusion
This study conducted a cluster randomized control trial in poor counties in northwest
China to evaluate the effects of providing college cost and financial aid information on senior
high school students' future college outcomes. The results of the study indicate that such
information has little impact on the decision to apply for early admission at a military
university or the likelihood that students of lower socioeconomic status choose to retake the
college entrance exam. Information does however increase the likelihood that students receive
certain types of financial aid. This latter result may be especially relevant for low-income
students in China, who are often targeted to receive specific types of aid.
The results differ somewhat from those of Bettinger et al. (2009) who find that a
financial-aid ―information-only‖ intervention does not have a significant effect on aid receipt
for students in the United States. Reasons for the difference in findings between the two
studies may be due to the fact that students from poor areas in low and middle-income

27
countries lack informational resources to a greater extent or that the financial aid process is
orders of magnitude more complex in the United States than in China.
Based on the results of the current paper, policymakers who design financial aid
instruments may consider improving the way their programs are publicized. In particular,
efforts could better target lower-income students. Such efforts are, in fact, being pursued in
other countries outside of China. For example, a 2005 report to the United States government
presented 8 out of 10 relatively costless recommendations to increase access to such
information (ACSFA, 2005). The main goal of such efforts is to increase the educational
aspirations and efforts of students concerned about the burden of college costs. Similarly,
policymakers in China may want to provide greater access to user-friendly information online;
provide cost calculators to help students and their families determine eligibility; and provide
standardized curriculum to introduce college cost and aid information in earlier grades.
One limitation of our study was that we only provided information to students in their
last semester of high school, when they were busy preparing for the college entrance exam,
and at which point they may have already solidified their college choices. Subsequent
research could therefore look at the effect of such an information intervention in earlier grades
and also examine a broader set of college choices. The concern about college cost and
financial aid information is actually part of a broader issue concerning the lack of formal
school counseling in pre-tertiary levels in China. Overall there may be considerable room to
help students and their families become better informed about their educational choices. We
hope this study stimulates exploration into these issues in China and elsewhere.
Notes
1 ―Costs‖ in this paper refers to tuition fees and other direct college expenditures (e.g.
dormitory fees) from the perspective of students and families.
2 In this section we discuss tuition fees. Other college fees have been capped by government

28
policies. For example, dormitory fees across all university types cannot exceed 1200 RMB
(about 180 US dollars) per year (MOE, NDRC and MOF, 2003).
3 The content of this booklet is similar to the one used in our intervention, but it does not
include information on general college costs, contains fewer details about the process by
which students apply for financial aid and their basic rights, and also includes less detail about
certain types of aid, including home-based loans.
4 This figure was obtained by dividing the average rural household income in Shaanxi in 2007
(Shaanxi Statistical Yearbook, 2008), by the list tuition prices for Shaanxi four-year public
universities found in Table 1. By comparison, the annual list price for four year college in the
US is $32,307, about half of the annual income of the median US family (Long, 2008).
5 This phenomenon is widely known among the general population in China since
early-admission into military colleges has historically always been cost-free.
6 Also, the early admissions college choice takes precedence over other first, second, third,
and fourth tier college choices. Thus, if qualified students choose an early admissions military
college, they will not have other college choices.
7 However, contrary to our hypothesis, it could also be that some students now perceive the
absolute cost of college to be too high, and therefore decide not to try to take the college
entrance exam again. Given the high rate of return to college in China (Heckman and Li,
2003), as well as the existence of loans and other types of financial aid which loosen students’
credit constraints, we think this may not be as important a consideration, however.
8 Our actual test of this hypothesis (see section 6) uses the sample of students who are from
families of lower socioeconomic status (roughly the bottom 50% of students as measured by

29
father’s education level: specifically we limited the science-track sample to 55% and the
humanities-track sample to 50% of the original sample respectively by looking at students
whose father’s had a completed junior high school education or below).
9 We examine the outcome ―received aid‖ rather than ―applied for aid‖ because our
intervention focuses on helping students prepare well for the entire application process—that
is, it informs them about how policymakers intend to target aid, individual student rights, as
well as where students can express grievances.
10 In 1994, the State Council of China identified 50 ―national poor counties‖ in Shaanxi
Province which contained over 5 million people under the national poverty line.
11 The authors exerted great efforts to ensure the quality of the information intervention (e.g.
circulating draft booklets among policymakers/researchers, piloting in other poor counties,
and extensive training of enumerators to ensure a highly-standardized presentation).
12 The enumerators spent numerous sessions together standardizing the delivery of the
intervention under the supervision of the authors and according to a detailed outline. We
further conducted two pilots in which the delivery of all enumerators was observed to ensure
that the content and delivery was identical. Variation in individual enumerator presentation
styles does not likely have much of an effect on student outcomes.
13 The presenters were asked not to answer questions outside of the content of the booklet to
keep the treatment uniform across classes.
14 Note that students in the treatment classes were not told that they would receive any type
of intervention until after they finished their baseline questionnaire.
15 We did not go to all 50 poor counties in Shaanxi, as high schools in 8 counties were subject

30
to another intervention, and 1 county served as a pre-intervention pilot. Regardless, our power
calculations indicated that 41 counties would be enough to detect meaningful effects.
16 There were numerous barriers to acquiring adequate information about the characteristics of
these high schools before randomization. We were thus unable to use randomization
techniques that might have increased power (e.g. pair-matching, see Imai et al., 2009)
17 These two types of classes separately prepare students for the science and humanities tracks
of the provincially-based college entrance exam.
18 Two counties in our sample were affected by the earthquake and students from these
counties were given additional financial aid assistance by universities.
19 From China’s 2007 National Economic and Social Development Statistical Bulletin.
20 In the science track treatment classes only, after all the questionnaires were handed in,
research assistants distributed the information booklet and then began the oral presentation.
21 We compared baseline characteristics of students in attrition and non-attrition groups within
each track separately. For the science track, groups were similar on observable variables (e.g.
age, gender, urban, test scores, and parent education level). For the humanities track, students
in the attrition group were of slightly lower SES (rural vs. urban and parents' education level).
22 The right half of table 3 presents the same six analytical approaches, using data whose
missing observations were estimated with multiple imputation (discussed in section 7.3).
23 We also limited the sample to those who did not directly qualify for fourth tier universities
(see section 4.2 for a discussion) and found similar results.
24 These analyses are exploratory as testing multiple hypotheses reduces statistical power
(Schochet, 2008), and we thus refrain from drawing strong conclusions from them.

31
References
Advisory Committee on Student Financial Assistance (ACSFA). (2005). The student aid
gauntlet: Making access to college simple and certain. Final report of the Special
Study of Simplification of Need Analysis and Application for Title IV Aid. Washington
DC: Department of Education.
Avery, C. & Hoxby, C.M. (2003). Do and should financial aid packages affect students’
college choices? NBER Working Paper 9482.
Bettinger, E. (2004). How financial aid affects persistence. In C. Hoxby (Ed.), College
choices: The economics of which college, when college, and how to pay for it (pp.
207-238). Chicago: University of Chicago Press and NBER.
Bettinger, E., Long, B.T., Oreopoulos, P. & Sanbonmatsu, L. (2009). The role of
simplification and information in college decisions: Results from the H&R Block
FAFSA experiment. NBER Working Papers 15361.
Bloom, H.S., Richburg-Hayes, L. & Black, A.R. (2007). Using covariates to improve
precision for studies that randomize schools to evaluate educational interventions.
Educational Evaluation and Policy Analysis, 29(1), 30-59.
Chen G.S., & Zhong, Y.P. (2002). Theory and empirical analysis of higher education costs
and returns. Beijing: Beijing Normal University Press.
Commission on the Future of Higher Education. (2006). A test of leadership: Charting the
future of U.S. higher education. Washington, DC: U.S. Department of Education.

32
Cornwell, C., Mustard, D. & Sridhar, D. (2006). The enrollment effects of merit-based
financial aid: Evidence from Georgia’s HOPE scholarship. Journal of Labor Economic,
24(4), 761-786.
Duflo, E., Glennerster, R. & Kremer, M. (2006). Using randomization in development
economics research: A toolkit. In T.P. Schultz & J. Strauss (Eds.), Handbook of
development economics (pp. 3895-3962). North Holland: Elsevier Science Ltd.
Dynarski, S. (2002). The behavioral and distributional implications of subsidies for college.
American Economic Review, 92 (2), 279-85.
Dynarski, S. (2003). Loans, liquidity, and schooling decisions. John F. Kennedy School of
Government Faculty Research Working Paper, Harvard University.
Glewwe, P., & Kremer, M. (2006). Schools, teachers, and education outcomes in developing
countries. In E. Hanushek & F. Welch (Eds.), Handbook of the economics of education,
2(16), 945-1017.
Hastings, J., Van Weelden, R. & Weinstein, J. (2007). Preferences, information, and parental
choice behavior in public school choice. NBER Working Paper No. 12995.
Hayes, R. J., & Moulton, L.H. (2009). Cluster randomized trials. Boca Raton, Florida:
Chapman & Hall/CRC.
Heckman, J.J. & Li, X.S. (2003). Selection bias, comparative advantage and heterogeneous
returns to education. NBER Working Paper 9877.
Horn, L.J., Chen, X.L. & Chapman, C. (2003). Getting ready to pay for college: What
students and their parents know about the cost of college tuition and what they are

33
doing to find out. Washington, DC: U.S. Department of Education, National Center for
Education Statistics.
Ikenberry, S.O., & Hartle, T.W. (1998). Too little knowledge is a dangerous thing: What the
public thinks about paying for college. Washington, DC: American Council on
Education.
Imai, K., King, G. & Nall, C. (2009). The essential role of pair matching in
cluster-randomized experiments, with application to the mexican universal health
insurance evaluation. Statistical Science, 24, 29–53.
Jensen, R. (2010). The perceived returns to education and the demand for schooling.
Quarterly Journal of Economics, 125(2), 515-548.
Kane, T.J. (1996). Lessons from the largest school voucher program ever: Two decades of
experience with pell grants. In B. Fuller, R. Elmore, & G. Orfield (Eds.), Who chooses?
Who loses? Culture, institutions and the unequal effects of school choice. New York:
Teachers College Press.
Kane, T. J., & Avery, C. (2004). Student perceptions of college opportunities: The Boston
COACH program. In C. Hoxby (Ed.), College decisions: The new economics of
choosing, attending and completing college. Chicago: University of Chicago Press and
the National Bureau of Economic Research.
Liang, K.Y. & Zeger, S.L. (1986). Longitudinal data analysis using generalized linear models.
Biometrika, 73 (1), 13-22.

34
Linsenmeier, D. M., Rosen, H.S. & Rouse, C.E. (2006). Financial aid packages and college
enrollment decisions: An econometric case study. The Review of Economics and
Statistics, 88 (1), 126-145.
Liu, C.F., Zhang, L.X., Luo, R.F., Rozelle, S., Sharbono, B., & Shi, Y.J. (2008). Development
challenges, tuition barriers and high school education in China. Asia Pacific Journal of
Education, 29 (4), 503 – 520.
Long, B.T. (2008). What is known about the impact of financial aid? Implications for policy.
National Center for Postsecondary Research Working Paper.
McDonough, P.M. & Calderone, S. (2006). The meaning of money: Perceptual differences
between college counselors and low-income families about college costs and financial
aid. American Behavioral Scientist, 49 (12), 1703-1718.
Ministry of Education and Ministry of Finance. (2007). Guidelines concerning the
determination of financial need for low-income university students. China.
Ministry of Education, National Development and Reform Commission, and Ministry of
Finance. (2003). Notice on School Tuition Issues. China.
National Bureau of Statistics. (2008). China Educational Statistics Yearbook. Beijing: China
Statistics Press.
Perna, L.W. (2006). Understanding the relationship between information about college prices
and financial aid and students’ college-related behaviors. American Behavioral
Scientist, 49(12), 1620-1635.
Raudenbush, S.W. & Bryk, A.S. (2002). Hierarchical linear models, 2nd edition. Thousand
Oaks, CA: Sage.
35
Schafer, J.L. & Graham, J.W. (2002). Missing data: Our view of the state of the art.
Psychological Methods, 7(2), 147–177.
Schochet, P. Z. (2008). Statistical power for random assignment evaluations of education
programs. Journal of Educational and Behavioral Statistics, 33(1), 62-87.
Shaanxi Statistical Yearbook. (2008).
Shaanxi Admissions Committee. (2007). 2006 Higher Education Institution Student
Recruitment Plan. Northwest University Press.
Shadish, W.R., & Cook, T.D. (2009). The renaissance of field experimentation in evaluating
interventions. Annual Review of Psychology, 60, 607-629.
Shi, Y.J, Zhang, L.X., Bai, Y.Y., Luo, R.F., Sylvia, S., Sharbono, B., & Rozelle, S. (2007).
Taking the next step: Are information and finances holding poor rural students back?
NSDRC Working Paper WP-07-E4.
State Council of China. (2007). Opinions on Establishing and Improving the Policies for
Subsidizing College Students of Regular Undergraduate Education, Post-secondary
and Secondary Vocational Schools for Families with Financial Difficulties.
Van der Klauuw, W. (2002). Estimating the effects of financial aid offers on college
enrollment: A regression discontinuity approach. International Economic Review, 43
(4), 1249-1287.
Zhang, M., Tsiatis, A.A., & Davidian, M. (2008). Improving efficiency of inferences in
randomized clinical trials using auxiliary covariates. Biometrics, 64, 707-715.

36
TABLE 1: 2009 TUITION LIST PRICES (RMB) FOR DIFFERENT UNIVERSITY
TIERS ACROSS CHINA
Beijing/Shanghai Shaanxi Other Regions
First and second tier
universities
(public four year)
4200-10000 3500-4500 2500-5500
Third tier universities
(private four-year) 11500-18000 8500-10000 6000-18000
Fourth tier public colleges
(three-year vocational) 6000-7500 4500-6100 1200-7000
Source: Shaanxi Admissions Committee (2007)
Notes: (1) China’s State Council (2007) fixed list tuition prices at 2006 levels for five years.
(2) Tuition prices across tiers and across provinces are somewhat higher for more competitive
majors.
TABLE 2: BASELINE CHARACTERISTICS FOR TREATMENT AND CONTROL
GROUPS (Averages of county means with SDs in parentheses)
SCIENCE TRACK HUMANITIES TRACK
VARIABLE Treat
ment Control
Difference
(p-value) Treatment Control
Difference
(p-value)
Female .41 (.11) .34 (.11) .07 .72 (.10) .69 (.07) .19
Height 1.68 (.02) 1.68 (.016) .63 1.64 (.02) 1.64 (.01) .30
Parent’s edu level 6.08 (.64) 5.89 (.58) .31 6.33 (.8) 6.28 (.72) .86
No. of siblings 1.74 (.51) 1.64 (.54) .78 1.68 (.57) 1.56 (.57) .88
Urban .21 (.11) .18 (.09) .38 .28 (.13) .27 (.14) .88
Expect can receive
needs-based
grants
.62 (.09) .60 (.11) .70 .58 (.09) .56 (.13) .78
Teacher estimate
of % students
who will go to
1st, 2
nd tier
university
.23 (.27) .13 (.14) .19 .09 (.13) .13 (.18) .38
Class Size 61.6 60.5 --- 60.3 60.8 ---
# earthquake
counties 1 1 --- 1 1 ---
N = 2486-2503 for science track. N = 2449-2482 for humanities track.

37
TABLE 3: TREATMENT EFFECT ESTIMATES FOR IMPACT OF INFORMATION
INTERVENTION ON COLLEGE CHOICE AND FINANCIAL AID OUTCOMES FOR
SCIENCE TRACK STUDENTS:
Unadjusted and Adjusted for Covariates (see Section 5.3 for a list of covariates)
A. OLS REGRESSION ESTIMATES (county/school-level clustered errors)
Listwise Deletion Multiple Imputation
OUTCOME UNADJ ADJ UNADJ ADJ
Chose Military University (Y/N) .02 (.43) .01 (.51) .02 (.51) .01 (.66)
Repeat College Entrance Exam (Y/N)
(students of lower SES)
.03 (.47) .03 (.35) .03 (.53) .02 (.52)
Received Needs-based Grant .04* (.08) .03 (.15) .04 (.21) .03 (.24)
Received Green Channel Support .03* (.07) .02* (.06) .04* (.10) .03* (.09)
B. LOGIT REGRESSION ESTIMATES (county/school-level clustered errors)
Listwise Deletion Multiple Imputation
OUTCOME UNADJ ADJ UNADJ ADJ
Chose Military University (Y/N) .02 (.43) .01 (.58) .02 (.51) .01 (.73)
Repeat College Entrance Exam (Y/N)
(students of lower SES)
.03 (.46) .03 (.35) .03 (.51) .02 (.50)
Received Needs-based Grant .04* (.07) .03 (.15) .04 (.17) .03 (.21)
Received Green Channel Support .03* (.06) .02** (.05) .04* (.09) .03* (.08)
C. GENERALIZED ESTIMATING EQUATIONS ESTIMATES (robust SEs)
Listwise Deletion Multiple Imputation
OUTCOME UNADJ ADJ UNADJ ADJ
Chose Military University (Y/N) 1.20 (.50) 1.07 (.75) 1.15 (.57) 1.05 (.81)
Repeat College Entrance Exam (Y/N)
(students of lower SES)
1.20 (.45) 1.21 (.34) 1.17 (.50) 1.12 (.55)
Received Needs-based Grant 1.38* (.07) 1.26 (.16) 1.26 (.18) 1.18 (.25)
Received Green Channel Support 2.14** (.03) 1.88** (.03) 1.98** (.04) 1.87** (.04)
Notes: 1) Effects reported as marginal effects; p-values in parentheses 2) **significant at the 5%
level; *significant at the 10% level 3) Under listwise deletion, the number of observations
used in the regressions with choosing military university, received needs-based grant and
received green-channel support as outcomes are between 2219-2251 and between 2300-2335
(with and without covariates respectively). The number of observations used in the repeat
exam regressions with and without covariates are 1226 and 1268 (respectively).

38
TABLE 4A: GEE TREATMENT EFFECT ESTIMATES FOR VARIOUS FINANCIAL
AID OUTCOMES (SCIENCE TRACK STUDENTS)
(Without Covariate Adjustments, using Multiple Imputed Data)
Needs-Based
Grants
Green
Channel
Home-based
Loans
National
Loans
Poverty
Subsidy
Treatment
1.37**
(.20)
[.04]
2.11**
(.70)
[.03]
2.72**
(.81)
[.00]
.66
(.30)
[.35]
.91
(.22)
[.70]
Notes: 1) Effects reported as odd-ratios, robust standard errors in parentheses, p values in
brackets 2) **significant at the 5% level; *significant at the 10% level. 3) number of
observations = 2331.

39
TABLE 4B. GEE TREATMENT EFFECT ESTIMATES FOR VARIOUS FINANCIAL
AID OUTCOMES (SCIENCE TRACK STUDENTS)
(With Covariate Adjustments, using Multiple Imputed Data)
Needs-Based
Grants
Green
Channel
Home-
based
Loans
National
Loans
Poverty
Subsidy
Treatment
1.29*
(.17)
[.06]
1.94**
(.56)
[.02]
2.36**
(.67)
[.00]
.60
(.27)
[.26]
.93
(.24)
[.80]
Expect aid***
1.41**
(.16)
[.00]
.99
(.28)
[.99]
----
----
----
Earthquake counties
1.60**
(.25)
[.00]
1.07
(.29)
[.79]
.21
(.25)
[.20]
.49
(.38)
[.35]
1.13
(.48)
[.77]
Age
1.10
(.08)
[.20]
.91
(.14)
[.54]
1.09
(.14)
[.49]
1.40
(.25)
[.06]
1.25*
(.17)
[.10]
Female
1.24*
(.16)
[.09]
.99
(.23)
[.96]
1.12
(.16)
[.42]
1.57
(.66)
[.29]
.75
(.14)
[.13]
Urban
.66**
(.14)
[.05]
.68
(.27)
[.32]
.38
(.11)
[.00]
.48
(.29)
[.22]
.58**
(.16)
[.05]
Parents education
.86
(.12)
[.28]
.94
(.22)
[.80]
1.13
(.16)
[.41]
.75
(.32)
[.49]
1.07
(.31)
[.81]
Father’s occupation
.87
(.13)
[.37]
.44**
(.17)
[.04]
.81
(.17)
[.30]
1.44
(.54)
[0.32]
.80
(.19)
[.34]
Siblings
1.10
(.07)
[.15]
1.18*
(.11)
[.08]
1.04
(.09)
[.64]
.70*
(.14)
[.07]
.99
(.10)
[.91]
Student aspiration
.84
(.12)
[.23]
1.42
(.44)
[.26]
1.84**
(.36)
[.00]
1.09
(.28)
[.73]
1.17
(.27)
[.49]
Teacher estimate
2.50**
(.83)
[.00]
2.72
(1.92)
[.16]
3.07*
(1.81)
[.06]
3.94*
(3.27)
[.10]
1.74
(.90)
[.28]
Notes: 1) Effects reported as odds ratios, robust standard errors in parentheses, p-values in
brackets 2) **significant at the 5% level; *significant at the 10% level 3) number of
observations = 2331

40
TABLE 5: TREATMENT EFFECT ESTIMATES FOR HUMANITIES STUDENTS
Unadjusted and Adjusted for Covariates (see Section 5.3 for a list of covariates)
A. OLS REGRESSION ESTIMATES (county/school-level clustered errors)
Listwise Deletion Multiple Imputation
OUTCOME UNADJ ADJ UNADJ ADJ
Chose Military University (Y/N) .01 (.58) .01 (.44) .01 (.68) .01 (.50)
Repeat College Entrance Exam (Y/N)
(students of lower SES)
-.04 (.34)
-.02 (.51) -.04 (.33) -.03 (.33)
Received Needs-based Grant -.01 (.68) -.02 (.32) -.01 (.71) -.02 (.46)
Received Green Channel Support .01(.41) .01 (.28) .01 (.39) .01 (.29)
B. LOGIT REGRESSION ESTIMATES (county/school-level clustered errors)
Listwise Deletion Multiple Imputation
OUTCOME UNADJ ADJ UNADJ ADJ
Chose Military University (Y/N) .01 (.58) .01 (.40) .01 (.65) .01 (.45)
Repeat College Entrance Exam (Y/N)
(students of lower SES)
-.04 (.33) -.02 (.53) -.04 (.32) -.03 (.36)
Received Needs-based Grant -.01 (.68) -.02 (.34) -.01 (.70) -.02 (.43)
Received Green Channel Support .01 (.41) .01 (.22) .01 (.38) .01 (.24)
C. GENERALIZED ESTIMATING EQUATIONS (GEE) ESTIMATES (robust SEs)
Listwise Deletion Multiple Imputation
OUTCOME UNADJ ADJ UNADJ ADJ
Chose Military University (Y/N) 1.14 (.64) 1.32 (.35) 1.10 (.72) 1.27 (.38)
Repeat College Entrance Exam (Y/N)
(students of lower SES)
.84 (.51) .91 (.66) .84 (.49) .86* (.46)
Received Needs-based Grant .92 (.67) .86 (.36) .89 (.56) .80 (.18)
Received Green Channel Support 1.36 (.49) 1.69 (.27) 1.25 (.59) 1.47 (.35)
Notes: 1) OLS and logit estimates are marginal effects, GEE estimates are odds-ratios;
p-values in parentheses 2) **significant at the 5% level; *significant at the 10% level 3)
Under listwise deletion, the number of observations used in the regressions with choosing
military university, received needs-based grant and received green-channel support as
outcomes are between 2134-2174 and between 2239-2257 (with and without covariates
respectively). The number of observations used in the repeat exam regressions with and
without covariates are 1085 and 1119 (respectively).