· · 2015-05-11filing information: april 2010, idc #222605, volume: 1 enterprise servers:...
TRANSCRIPT

Filing Information: April 2010, IDC #222605, Volume: 1Enterprise Servers: Technology Markets: Market Analysis
M A R K E T A N A L Y S I S
W o r l d w i d e a n d R e g i o n a l S e r v e r 2 0 1 0 – 2 0 1 4 F o r e c a s tLloyd Cohen Daniel HarringtonStefania Lorenz Nathaniel MartinezJed Scaramella Mathew EastwoodRajnish Arora Lidice FernandezThomas Meyer Roman MaceškaJason Bremer Giorgio NebuloniHiroyuki-Tsuzuki Juan pablo SeminaraTarun Bhasin Satoshi FukutomiKazuhiko Hayashi
I D C O P I N I O NThe worldwide server market saw a sharp downturn in 2009, as the economic downturn pushed revenue down by double digits compared with CY08 and unit shipments dipped below the 8-million-unit record set in 2008. IDC believes that the server market will see single-digit growth in 2010 and overall stabilization of demand for new servers. And yet, there will be a new "normal" whose shape has not yet been seen. New factors in the mix are increased virtualization of physical servers, more powerful microprocessors, and new types of servers designed to meet new use-case requirements. From a geographic perspective, pockets of faster growth may emerge in some areas of Asia/Pacific in 2010, but most geographic regions will see moderate improvements in revenue and unit shipments compared with 2009. Key highlights:
Currently, the x86 market is driven over volume. Most x86 servers are shipped with two or four sockets as rack optimized or blade servers and are outfitted with quad-core processors. IDC expects a bifurcation of the volume-driven x86 market, with microservers at the low end and scalable and multicore servers at the high end. Over the long term, IDC sees the x86 market being pulled in two directions.
Worldwide customer revenue declined 3.9% year over year to $13.8 billion in the fourth quarter of 2009. This is the sixth consecutive quarter of year-over-year revenue decline, but the percentage decline was relatively quite small this quarter. Sequentially, customer revenue grew 24.0%. This increase was driven by growth in mostly by strong growth in the United States (24.0%) and in Western Europe (32.0%). Combined, these two geographic regions account for 60.1% of the server customer revenue.
IDC expects a recovery to take place in 2010 as IT budgets begin to free up, and aging systems are retired and replaced with more powerful and cost-efficient servers. The long-term forecast for the worldwide market has been increased in 2013 by 317,515 units and $2.4 billion from the previous forecast. This new IDC forecast is extended now to include 2014.
Glo
bal H
eadq
uart
ers:
5 S
peen
Str
eet
Fram
ingh
am, M
A 0
1701
USA
P
.508
.872
.820
0
F.50
8.93
5.40
15
ww
w.id
c.co
m

#222605 ©2010 IDC
T A B L E O F C O N T E N T S
P
In This Study 1
Methodology ............................................................................................................................................. 1
Situat ion Overview 12
Future Out look 14
Forecast and Assumptions ....................................................................................................................... 14Market Context ......................................................................................................................................... 135
Essential Guidance 139
Learn More 140
Related Research..................................................................................................................................... 140Methodology ............................................................................................................................................. 141

©2010 IDC #222605
L I S T O F T A B L E S
P
1 Worldwide Server Customer Revenue by Operating System, 2008–2014................................... 15
2 Worldwide Server Shipments by Operating System, 2008–2014................................................. 16
3 Americas Server Customer Revenue by Operating System, 2008–2014..................................... 17
4 Americas Server Shipments by Operating System, 2008–2014................................................... 18
5 EMEA Server Customer Revenue by Operating System, 2008–2014 ......................................... 19
6 EMEA Server Shipments by Operating System, 2008–2014 ....................................................... 20
7 Asia/Pacific Server Customer Revenue by Operating System, 2008–2014 ................................. 21
8 Asia/Pacific Server Shipments by Operating System, 2008–2014 ............................................... 22
9 Worldwide Server Customer Revenue by Chip and Operating System, 2008–2014.................... 23
10 Worldwide Server Shipments by Chip and Operating System, 2008–2014 ................................. 24
11 Americas Server Customer Revenue by Chip and Operating System, 2008–2014 ..................... 26
12 Americas Server Shipments by Chip and Operating System, 2008–2014 ................................... 27
13 EMEA Server Customer Revenue by Chip and Operating System, 2008–2014 .......................... 29
14 EMEA Server Shipments by Chip and Operating System, 2008–2014 ........................................ 30
15 Asia/Pacific Server Customer Revenue by Chip and Operating System, 2008–2014.................. 32
16 Asia/Pacific Server Shipments by Chip and Operating System, 2008–2014................................ 33
17 Worldwide Server Customer Revenue by Price Band, 2008–2014 .............................................. 35
18 Worldwide Server Shipments by Price Band, 2008–2014............................................................ 36
19 Americas Server Customer Revenue by Price Band, 2008–2014................................................ 37
20 Americas Server Shipments by Price Band, 2008–2014.............................................................. 38
21 EMEA Server Customer Revenue by Price Band, 2008–2014..................................................... 39
22 EMEA Server Shipments by Price Band, 2008–2014 .................................................................. 40
23 Asia/Pacific Server Customer Revenue by Price Band, 2008–2014 ............................................ 41
24 Asia/Pacific Server Shipments by Price Band, 2008–2014 .......................................................... 42
25 Worldwide Server Customer Revenue by Operating System and IDC Class, 2008–2014........... 43
26 Worldwide Server Shipments by Operating System and IDC Class, 2008–2014......................... 45
27 Americas Server Customer Revenue by Operating System and IDC Class, 2008–2014............. 47
28 Americas Server Shipments by Operating System and IDC Class, 2008–2014........................... 49
29 EMEA Server Customer Revenue by Operating System and IDC Class, 2008–2014 ................. 51
30 EMEA Server Shipments by Operating System and IDC Class, 2008–2014 ............................... 53
31 Asia/Pacific Server Customer Revenue by Operating System and IDC Class, 2008–2014 ......... 54
32 Asia/Pacific Server Shipments by Operating System and IDC Class, 2008–2014 ....................... 56
33 Key Forecast Assumptions for the Worldwide, U.S., Western Europe, Japan, Asia/Pacific, Canada, and Rest of World Server Markets, 2010–2014............................................................. 59
34 Worldwide Server Customer Revenue by Region 2007–2014: Comparison of December 2009 and March 2010 Forecasts.................................................................................................. 136

#222605 ©2010 IDC
L I S T O F T A B L E S — C o n t i n u e d
P
35 Worldwide Server Shipments by Region, 2007–2014: Comparison of December 2009 and March 2010 Forecasts ................................................................................................................. 137
36 Exchange Rates, 2003–2009 ....................................................................................................... 142

©2010 IDC #222605
L I S T O F F I G U R E S
P
1 Worldwide Server Customer Revenue by Chip Technology, 2002–2014..................................... 57
2 Worldwide Server Customer Revenue by Operating System, 2002–2014................................... 58
3 Worldwide Server Customer Revenue, 2005–2013: Comparison of December 2009 and March 2010 Forecasts ................................................................................................................. 138
4 Worldwide Server Shipments, 2005–2013: Comparison of December 2009 and March 2010 Forecasts ..................................................................................................................................... 139


©2010 IDC #222605 1
I N T H I S S T U D Y
This study presents clients of IDC's Enterprise Servers Technology: Markets service with the foundation of market and technology assumptions that our regional analysts used to generate our current expectations for server market growth and directions. In a market as broad and complex as the enterprise server market, not all assumptions that lead to specific technology or product segment growth predictions can be listed in a concise document. Nevertheless, this document is intended to provide clients with some of the fundamental drivers for the server market course. IDC clients are encouraged to contact our worldwide or regional analysts if they have specific inquiries regarding our forecasts to get more detail on specific category or segment trends.
M e t h o d o l o g y
Server Taxonomy
IDC categorizes servers into two main groups:
Servers. This category comprises all server hardware sales for all purposes, applications, and industries, including volume, midrange enterprise, and high-end enterprise servers; server blades; and technical servers. Primary server segmentations are based on server class/price band, chip type, and operating system (OS).
Technical servers. Technical servers (also referred to as high-performance computers [HPCs]) represent a specialized view of the server market. Technical servers are designed, sold, and used to support scientific research, engineering development, and other numerically intensive applications (i.e., technical computing) in government, industry, and academia. Technical computing segmentations are based on a number of parameters (i.e., price bands, architectures, and application workloads).
A typical server configuration consists of processors, memory, disk storage, and any bundled operating system, database, and networking software. IDC defines a server as having two primary characteristics:
Multiuser device. A server is a computer device that accesses services via the network. Servers and the applications that run on them are typically shared by multiple users.
No user interface. Unlike a client device, a server does not have a user interface that is intended for human-machine interaction.
Servers
S e r v e r M a r k e t S e g m e n t a t i o n
IDC's server market definitions and taxonomy include the following server segmentations:

2 #222605 ©2010 IDC
Server type. IDC categorizes all server hardware as x86 or non-x86. The x86 servers are Intel- or AMD-based instruction set of architecture, while non-x86 include all CISC, RISC, and EPIC servers. Following the increasing use of x86 servers, IDC further segments the market by end-user segments and channels.
Central processing unit (CPU) type. To account for products that represent 64-bit extensions to existing 32-bit processor technology, IDC utilizes a CPU-type category. IDC illustrates processor product families (such as SPARC, Pentium, and PowerPC) as a subcategory in our research taxonomy.
Server class/price band. To represent the reality of price erosion among server systems and the increased capabilities of servers with lower price points, IDC has redefined the categories that represent the volume server market and midrange and high-end enterprise servers.
The server market is further segmented by operating system and geographic region. In addition, following is a discussion on how IDC currently addresses the multicore and multithreaded server environment. This is followed by general market definitions and IDC's methodology for server blades.
C P U T y p e
IDC categorizes the server market according to the design of the CPU and the software programming model. The actual metadata (i.e., data about data) for CPU designs is CISC, RISC, EPIC (the Itanium-based 64-bit Intel architecture), and x86 (the current Intel architecture CISC design, which includes AMD's Athlon and Opteron):
Complex instruction set computer (CISC). This design is the traditional type of computer processor. CISCs have large instruction sets with simple and complex instructions of variable lengths. Although x86 chip types (such as those produced by Intel and AMD) are CISC processor designs, they are separated into their own chip-type categories because of their high volume. In IDC's server taxonomy, CISC-based systems refer to proprietary systems, such as those produced by IBM for its zSeries servers.
Reduced instruction set computer (RISC). This processor design is produced by IBM, HP, Sun Microsystems, and others. RISCs have smaller instruction sets, and each instruction is usually of limited function with fixed-length formats. RISC servers typically support Unix and other (e.g., NonStop) platform software. Sun's SPARC, HP's PA-RISC, and IBM's POWER processors are all examples of RISC architecture.
Explicitly Parallel Instruction Computing (EPIC). This processor design is produced by Intel and represents its 64-bit Itanium processor family (codeveloped by Intel and HP). Several server OEMs have products that utilize the 64-bit Itanium processor.

©2010 IDC #222605 3
x86. What was once referred to as the Standard Intel Architecture Server (SIAS) market will now encompass all x86(32)- and x86(64)-based systems and will be referred to as the x86 server market in IDC publications and databases. The x86 server market includes all systems that fit IDC chip-type definitions, regardless of form factor (such as blades) and price band or CPU capacity (i.e., systems with price points above $25,000 and/or containing more than eight processors will still be in the x86 server category as long as they meet chip-type definitions):
x86(64). This processor design refers to x86 architecture systems that have 64-bit extensions. x86(64) processor designs enable 64-bit computing while remaining compatible with existing x86 software infrastructure. AMD's Opteron processor and Intel's EM64T are examples of x86(64) processors.
x86(32). x86(32) refers to volume 32-bit CISC processors developed and produced by companies such as Intel and AMD. Intel's Pentium and XEON processor families and AMD's Athlon processors are examples of this architecture. x86(32)-based systems run Microsoft Windows, Novell NetWare, Linux, Unix, and other operating system environments.
S e r v e r C l a s s / P r i c e B a n d
IDC has reclassified and made adjustments to the price bands that fall into the various size classed this year. IDC's server class taxonomy segments the server market into three server classes: the volume server market (consisting of all systems with an average selling value [ASV] below $25,000), the midrange enterprise server market (consisting of all systems with an ASV from $25,000 to $249,999), and the high-end enterprise server market (consisting of all systems with an ASV of $250,000 and above).
The midrange enterprise and high-end enterprise markets will be referred to collectively as the enterprise server market. IDC's 23 price bands will remain unchanged from our historical taxonomy to provide clients with a seamless transition to the new terminology. Therefore, the price bands included in the three new server classes are as follows:
Volume server market:
Price band 1: $0–499 ASV
Price band 2: $500–999 ASV
Price band 3: $1,000–1,499 ASV
Price band 4: $1,500–1,999 ASV
Price band 5: $2,000–2,499 ASV
Price band 6: $2,500–2,999 ASV
Price band 7: $3,000–3,999 ASV

4 #222605 ©2010 IDC
Price band 8: $4,000–4,999 ASV
Price band 9: $5,000–5,999 ASV
Price band 10: $6,000–6,999 ASV
Price band 11: $7,000–7,999 ASV
Price band 12: $8,000–8,999 ASV
Price band 13: $9,000–9,999 ASV
Price band 14: $10,000–14,999 ASV
Price band 15: $15,000–19,999 ASV
Price band 16: $20,000–24,999 ASV
Midrange enterprise server market:
Price band 17: $25,000–49,999 ASV
Price band 18: $50,000–99,999 ASV
Price band 19: $100,000–249,999 ASV
High-end enterprise server market:
Price band 20: $250,000–499,999 ASV
Price band 21: $500,000–999,999 ASV
Price band 22: $1 million to $2.99 million ASV
Price band 23: $3+ million ASV
O p e r a t i n g S y s t e m
IDC assumes that all servers are shipped with an operating system. A portion of the operating system license fee that is shipped with the server is included in the factory-revenue figures. This operating system portion ranges from 5% to 20% of the average selling value, depending on the type of system; it is associated only with new operating systems' licenses and not with installed base licenses.
According to our current methodology, primary operating systems and operating systems that run within a partition of a scalable system are not currently counted. Only the primary, or booting, operating system is identified in our server data. IDC continues to use its knowledge of system software environments as a key factor in developing these hardware forecasts. The following operating systems are covered:
Novell NetWare
Windows

©2010 IDC #222605 5
Unix
Linux
i5/OS
z/OS
Other
M u l t i c o r e a n d M u l t i t h r e a d S e r v e r S y s t e m s
Several chip makers are looking to dual-core designs as a way to increase the performance of next-generation processors without the constraints imposed by rising levels of power consumption in single-core processors. Two common methods of improving the performance of a single-core chip are increasing clock speed or adding cache memory, both of which require more power.
A dual-core chip is two separate processors on a single chip. These two processors can often outperform single-core processors on most multithreaded applications while running at lower clock speeds and consuming less power.
An application with multiple software threads will run faster on a dual-core processor because the operating system can assign an individual thread to its own processor core. Multithreaded applications running on a single-core processor must wait for one thread to finish before another thread can be processed.
Servers with chip architectures that expand on their processing capabilities based on the number of processor sockets are tracked in IDC's server taxonomy using the number of processor sockets as the cornerstone. In addition, the number of processing cores that are on the socket will be equally important. Finally, the product of the number of sockets and cores will represent the new server capability. IDC will eventually add two new fields (socket count and core count) into its tracker and forecast products to count the cores and sockets. The server capability will be used to forecast the size of the future server market, while market segmentation can be performed using the socket count and core count fields.
To this end, the following are examples of how IDC will interpret the new server and chip platforms:
The number of processor sockets within a server will be used to determine the n-way factor of that server. For example, a server with one processor socket will be classified as a 1-way server, and a server with two processor sockets will be a 2-way server.
A single socket may have one or more cores on that socket. It may have two or more physical cores on its socket. For example, a server with a single socket and dual cores (two processors) will have its socket count at 1, core count at 2, and server capability set to 2.
IDC will not define the type of server (i.e., n-way) by the number of threads that are used in the server packaging to assist performance or throughput.

6 #222605 ©2010 IDC
IDC believes that IT executives will continue to view the size of the server based on the number of processor sockets and therefore exert pressure on the independent software vendors (ISVs) to price accordingly.
Multicore, multithread, and socket layouts are designed to improve the overall performance and throughput of the system. IDC believes this will allow system vendors to differentiate themselves from their competitors in the volume server market via the benchmarking and workload processing capabilities.
O t h e r S e r v e r D e f i n i t i o n s
The following are definitions of terms and methodology approaches used in IDC's ongoing research process:
Average selling value. ASV is the value of an initial server shipment (ISS) unit configured as it is typically sold. The ASV will include the base configuration plus any add-ons or upgrades typically sold when the system or server is first delivered to a customer. It can be stated at both factory- and customer-installed levels.
Customer revenue. Customer revenue represents the amount of money paid by end users for products. IDC uses customer revenue to illustrate its server forecasts because many of its clients find spending to be a more useful concept than vendor revenue in market plans. Customer, or end-user, revenue (spending) represents those dollars ultimately spent by the end customer for the following embedded server components:
Frame or cabinet and all cables
Processors
Memory
Storage
Communications boards
Operating system software
Other bundled software
Initial internal and external disk shipments, either from the manufacturer or from the channel
To a large degree, most of the aforementioned components are sold today as a server bundle, with the possible exception of the OS software. IDC's revenue figures are based on street (i.e., realistic) pricing for the average model as it is assembled when the user plugs it in. OS software is included only when it is bundled with the server sale and when it represents the base number of users supported by that initial license.

©2010 IDC #222605 7
IDC does not explicitly attempt to uplift server ASVs to accommodate an additional number of users. No other peripherals (e.g., printers and modems), except initial disk shipments, are included in our revenue data.
Direct shipment. A direct shipment is any unit sold from a system vendor's own sales force or through direct Internet sales to the end customer. Server vendors realize all revenue from these sales.
Factory revenue. Factory revenue represents the amount of money recognized by the vendor for the sale of products. Factory revenue represents those dollars recognized by multiuser system and server vendors for ISS and upgrade units sold through direct and indirect channels. In IDC's server research, factory revenue refers to the sums associated with server hardware. Factory revenue is used by IDC to calculate vendor market shares because it excludes channel margin and channel-added peripherals that are not part of a vendor's own finances.
High-end enterprise server. High-end enterprise server markets consist of all systems with an average selling value of $250,000 and above.
Installed base. Installed base is composite shipments and ISS shipments plus upgrades minus retirements. If a vendor was acquired in 1999, the total installed base is credited to the new vendor regardless of which quarter the acquisition took place in. In this document, the customer price band is set annually, not quarterly, and as a result, shipments by price band and installed base by price band will not always match up.
Note: If a vendor was acquired during the year, all of the vendor's shipments and installed base were credited to the new vendor. Sequent is listed under IBM; Digital and Compaq are listed under HP; Fujitsu Siemens is listed under Fujitsu; NEC CI, NEC, and NEC/Groupe Bull are listed under NEC.
Installed price. Installed price equals worldwide ISS customer revenue divided by ISS units.
Initial server shipment. ISS characterizes the first sale of a server (previously referred to as a "new footprint"). An ISS server unit consists of processors, memory, disk storage, and any bundled operating system, database, and networking software that would typically be configured when it leaves the OEM's factory floor. Guidance for these average configurations is normally received from server vendors. For this study only, if a vendor was acquired in 1999, ISS shipments are credited to the new vendor regardless of which quarter the acquisition took place in. ISS prices are net prices, meaning that IDC subtracts the value of a trade-in server from the price for a new system. The use of net pricing was necessitated by the data-reporting abilities of server vendors. Much of the guidance that we receive does not account for trade-ins and discounting.
List price. This is the non-discounted direct price for a server model. List prices are typically found in vendor pricing books.

8 #222605 ©2010 IDC
Midrange enterprise server. Midrange enterprise server markets consist of all systems with an average selling value of $25,000–249,999.
Price band. A price band is a range of server values with an upper and lower bound. It is based on the end-user price of a server. Typically, the lower bound will be the round number and the upper bound will end with a 9. We have defined the following 23 distinct bands for dividing our market shares and platform forecasts:
Price band 1: $0–499 (volume server)
Price band 2: $500–999 (volume server)
Price band 3: $1,000–1,499 (volume server)
Price band 4: $1,500–1,999 (volume server)
Price band 5: $2,000–2,499 (volume server)
Price band 6: $2,500–2,999 (volume server)
Price band 7: $3,000–3,999 (volume server)
Price band 8: $4,000–4,999 (volume server)
Price band 9: $5,000–5,999 (volume server)
Price band 10: $6,000–6,999 (volume server)
Price band 11: $7,000–7,999 (volume server)
Price band 12: $8,000–8,999 (volume server)
Price band 13: $9,000–9,999 (volume server)
Price band 14: $10,000–14,999 (volume server)
Price band 15: $15,000–19,999 (volume server)
Price band 16: $20,000–24,999 (volume server)
Price band 17: $25,000–49,999 (midrange enterprise server)
Price band 18: $50,000–99,999 (midrange enterprise server)
Price band 19: $100,000–249,999 (midrange enterprise server)
Price band 20: $250,000–499,999 (high-end enterprise server)
Price band 21: $500,000–999,999 (high-end enterprise server)
Price band 22: $1 million to $2.99 million (high-end enterprise server)

©2010 IDC #222605 9
Price band 23: $3+ million (high-end enterprise server)
Processor designs. IDC categorized the server market according to the design of the chip and the software programming model. The actual metadata — data about data — for chip designs is CISC, RISC, x86(32), x86(64) (the current AMD and Intel architecture CISC design), and EPIC (the Itanium-based 64-bit Intel architecture).
Rackmounted server. Rackmounted servers are those that are specifically designed to fit into 19in. racks. They have been used for a number of products in industries such as manufacturing, telecommunications, and defense. They are growing in importance for servers, allowing multiple machines to be clustered (or at least managed) in a single location. The height of rackmounted servers is measured in the number of standard rack units and expressed as 1U, 2U, and so on. Often, rackmounted servers include only limited amounts of disk capacity; additional storage is frequently provided in other rack units. Non-rack-optimized servers, on the other hand, are servers expressed as zero rack units. Rack-optimized, non-rack-optimized, and blade server categories are reported under the "rack factor" field in the tracker.
Rackable servers. Since the second half of 2009, IDC also tracks with more granularity all models that can, but not necessarily will, be used within a 19in. rack, and they include rack-optimized models, as well as some non-rack-optimized models, that nevertheless allow users to store them in a rack in horizontal position. Within the "form factor" field, IDC will thus report the category "rackable," as opposed to "tower" and "blade," to define all servers that can potentially be stored in a rack, even if they are not specifically designed to do so. This additional field does not influence the "rack factor" field, as defined previously.
Revenue. IDC's server research includes the amount recognized by the hardware vendor (the factory revenue items), the channel margin (when a product is sold through a third-party sales organization), and any peripherals added to a system in the channel before shipping to end users that do not originate with the named server hardware manufacturer. IDC presents data in factory revenue to determine market share position. IDC also presents data in customer or end-user spending revenue to better represent the total amount of spending in the server market for forecasting purposes.
The formula for calculating revenue is as follows:
Factory revenue = ISS revenue + upgrade revenue
Customer revenue (i.e., end-user spending) = factory revenue + channel revenue

10 #222605 ©2010 IDC
Server blades. To provide clients with a clear definition of server blades — and to permit a framework for following the modular computing market as it evolves — IDC has further defined the server blade segment. IDC began to track a new form factor, server blades, beginning in 1Q02. The definition of a server blade is as follows: A server blade is an inclusive computing system that includes processor, memory, network connections, and associated electronics on a single motherboard. The server blade is also known as a single-board computer and is typically associated with an enclosure system that allows multiple blades to be housed in a standard server "chassis" or enclosure that shares resources such as power supplies and cooling fans. Blades are easily accessible, are typically found in a sub-U form factor, and may be associated with content blades and network blades that contain the storage capacity and networking capabilities, respectively. The server blade architecture is designed primarily for computing density, along with a universal modular architecture that ensures flexibility and scalability, as well as easier deployment and manageability.
For the purposes of IDC market sizing and forecasting, we currently count each blade as a server unit, with multiple blades or units in a single chassis. The cost of the chassis, as well as network and storage blades in the chassis, will be distributed across the average number of server blades in a chassis to calculate the average selling value of a server blade.
Therefore, the average selling value of a server blade will be calculated as follows: cost of individual blade + (cost of chassis [including power supplies and other shared subsystems] + cost of network blades + cost of storage blades)/average number of blades in a chassis.
Today, the prevailing line of thought in the industry is that a server blade or a "modular server" is a server in its own right and competes directly with rack-optimized server products for market share (i.e., largely, the industry views the server blade as a unit). The disaggregation of servers into processing, I/O, and storage modules, however, may mean that we will view a server "unit" as something very different in the near future. A "server" may be a number of processor, I/O, and storage modules sharing multiple chassis that together deliver a service to an application or a business unit. This is largely the view the industry takes with large service provider (SP) RISC-based Unix servers and modular midrange and high-end systems in the market today. IBM's x440 eServer is an example of a system that straddles these competing views of what a server unit is. Is the x440 one 16-way system built upon four 4-way nodes, or is it four 4-way blades that fit within two to three processor and I/O chassis?
IDC recognizes this inconsistency in our definition of a server unit. Indeed, as the hardware infrastructure becomes even more virtual and modular, this inconsistency may become unsustainable. Currently, however, the industry as a whole views server blades very differently from large symmetric multiprocessing (SMP) systems built using modular building block processor and I/O nodes —even though, increasingly, the definition of what separates server blades from large SMP nodes is becoming very blurred.

©2010 IDC #222605 11
For this reason, in addition to server blades, IDC will track shipments of server blade chassis, I/O blades, and storage blades in the server market. If the disaggregation of server resources and the virtualization of services deployed on server hardware continue, IDC will be prepared to view and account for market dynamics accordingly.
Unit. Unit shipment figures represent the number of products of a given type delivered to customers within a specific period. In IDC's server data, we differentiate between an ISS and an upgrade shipment. The former represents the delivery of a new server, while the latter involves the upgrading of the processor through either replacement or addition of extra CPUs.
Upgrade. An upgrade is the opposite of an ISS, but not all equipment additions qualify as upgrades. IDC recognizes a server upgrade unit only if it results in a model name or number change to an installed ISS unit. Server upgrades normally entail the addition of another processor to an SMP unit through a board addition or swap. Along with the processor, more memory is typically added, and possibly more disk storage. In most cases, upgrades don't change the serial number of the system unit. For this document only, if a vendor was acquired in 1999, upgrade shipments are credited to the new vendor regardless of which quarter the acquisition took place in.
Volume server. Volume servers consist of all systems with an average selling value below $25,000.
White-box server. A white-box server is primarily assembled by resellers. The following are attributes of typical white boxes:
No global or nationwide presence
Rebranded, assembled products/supplies
Lack of branded support products
Server revenue of less than $50 million
Products valued under $25,000

12 #222605 ©2010 IDC
S I T U A T I O N O V E R V I E W
IDC's forecast for the server market was slightly adjusted upward from the previously published forecast in Worldwide and Regional Server 2009–2013 Forecast Update(IDC #221439, December 2009). The significant global recession caused massive volatility to the hardware market throughout the end of 2008 and during 2009. IDC sees a return to normalcy in seasonal patterns toward the end of 2010. The expectation for worldwide spending on server customer revenue in 2010 year-on-year change is positive, 6.8%, to $49.3 billion. IDC expects the volume server segment to continue to be the driver of growth through the forecast period fuelled by rackable servers. IDC had anticipated a "U" type of recession, but results in 3Q09 suggest it may be more of a "V" shape, and data from 4Q09 shows as starting up on the right side of the "V".IDC expects the market in the first quarter of 2010 to be seasonably down compared with 4Q09, but less than one would normally expect with customer revenue in totaling $12.0 billion with 1,770,720 units.
Shipments in the x86 market invariably drive the server market growth or decline as the market controlled 96.3% of the server market in 2009. In 4Q09, the x86 market grew 14.9% sequentially in terms of units and 24.0% in revenue. Average selling prices remained above $7,000 overall but are expected to slightly decline over the forecast period. IDC believes it is prudent to look at sequential results more closely throughout 2010 as we come out of the recession rather than just looking at year-over-year results. One should not simply assume quarterly results are a result of seasonality.
As forecast previously, IDC expected growth in the x86 segment in all geographic regions and this did come to fruition. All regions experienced strong double-digit growth, except Japan which had a sequential unit shipment increase of 2.4%. Year-over-year results for the x86 segment in 4Q09 show that units increased 3.8%, while revenue was up an impressive 12.4%.
Worldwide competition remains strong, yet average x86 server prices continue to increase year over year and the average system price increased 8.2% to $4,233 while sequentially they grew 4.8%. One-socket systems lost a small amount of share worldwide, as the more popular two-socket configurations gained in popularity. x86 blades continue to control a fair share of the server market and are forecast to grow as a percentage of the total server market. The converged nature of the blade platform and the high rate of virtualization on blade servers are two key drivers of theblade market. Given the increased pressure on IT budgets, IT organizations are leveraging the operational benefits of the blade platform. IDC's analysis, coupled with end-user research, indicates that migrating from a complex, heterogeneous legacy server environment to a managed blade environment wil l optimize the IT infrastructure by reducing IT costs while developing a more flexible and agile infrastructure to support business opportunities.
©2010 IDC #222605 13
In 3Q09, IDC changed the size class definitions to reflect changing market dynamics. Entry-level systems are still priced less than $25,000. Midrange enterprise servers are now reclassified to include systems priced at $25,000 to less than $500,000 and high-end enterprise systems are classified as being priced at greater than $500,000. Readers are cautioned in making comparisons with previously published documents that have size class data comparisons.
Worldwide spending for midrange enterprise servers declined in 4Q09, dropping 5.1% to $2.1 billion in year-over-year comparisons. However, sequentially, spending increased 41.9%. With the new size class price bands, IDC now expects spending in the midrange enterprise segment to grow at a 6.7% CAGR through 2014 to about $9.2 billion.
Spending for high-end enterprise servers continues to decline as users continue to migrate to lower-cost modular systems. Year over year, the high-end enterprise segment fell 21.1% in terms of customer revenue but improved -12.1% sequentially. This represented a disappointing fourth-quarter year-end for IBM which usually relies on strong results for its high-end devices. We believe the longer-term trend will show a slow but steady decline in high-end enterprise spending as customers move select workloads to smaller form factors. This is one of the reasons the midrange enterprise segment will see a small compound growth increase. The forecast for high-end enterprise server spending is expected to decline at a 5.6% CAGR from $13.2 billion in 2009 to $9.9 billion in 2014.
Tables 1–32 present regional forecast information from 2008 to 2014.
14 #222605 ©2010 IDC
F U T U R E O U T L O O K
F o r e c a s t a n d A s s u m p t i o n s
IDC is forecasting the worldwide server market to increase over the forecast horizon with revenue of $52.6 billion by 2014, which represents a five-year CAGR of 2.6%. Just as there was a wave with the recession starting in the United states and then moving over seas, the recovery is expected to have a similar trend across the globe with all regions feeling some level of economic recovery. The United States has begun to show some signs of improvement with the compound growth rate between 2009 and 2014 to be 2.6%. Western Europe, on the other hand, has been hard hit by the recession and will be slower to recover. IDC is forecasting Western Europe to have a -2.8% compound growth decline over the five-year forecast period. Even though the international markets will be slower to recover, there could still be pockets of positive server hardware spending in the short term for individual technologies or countries where the necessity to build out infrastructure has either been underway or where financial commitments to the incoming capacity is under contract. This is especially true in areas, such as India and China, which are major factors toward APEJ growth. As pointed out in the Market Context section of this document, year-over-year comparisons suggest the server market is worse off than it really was, and readers should pay closer attention to sequential results.
While the severity of this crisis has thrown the world economy into uncharted waters, IDC does see light at the end of the tunnel and expects to see more predictability in results over the forecast period.
We still believe the decision-making process for purchasing server hardware will be driven by many of the same underlying elements that we have identified in the past. Therefore, IDC expects customer spending on server systems to be significantly influenced by form factors, energy specifications, and virtualization technologies. Customers will continue to deploy highly dense servers, including blades, based on space constraints and the flexibility inherent to the blade chassis. The shift toward high density, combined with rising energy costs, will result in power and cooling system requirements being just as important as performance and price in terms of purchasing criteria. Finally, virtualization and multicore technologies will enable customers to migrate higher-end enterprise workloads from Unix and mainframes to x86 server platforms. The combination of these x86 technologies will keep x86 growth rates above the overall market rate over the forecast period. IDC sees a built-up demand for new servers and expects an increase in the number of servers being retired in 2010.

©2010 IDC #222605 15
T A B L E 1
W o r l d w i d e S e r v e r C u s t o m e r R e v e n u e b y O p e r a t i n g S y s t e m , 2 0 0 8 – 2 0 1 4
2008 2009 2010 2011 2012 2013 20142009–2014 CAGR (%)
Revenue ($M)
Windows 22,078.7 18,830.6 20,572.3 21,117.3 22,126.2 22,771.2 23,290.7 4.3
Unix 18,035.8 13,965.7 15,551.9 15,994.0 15,681.1 15,711.9 15,593.9 2.2
Linux 7,801.1 6,660.2 6,973.4 7,239.2 7,787.7 8,353.9 8,639.5 5.3
z/OS 5,332.5 3,800.2 3,689.7 3,787.4 3,436.9 3,249.4 3,139.4 -3.7
i5/OS 1,075.5 729.3 655.5 597.2 513.2 438.8 351.8 -13.6
NetWare 261.7 76.3 81.5 53.5 29.7 27.6 26.2 -19.2
Other 2,403.2 2,103.1 1,803.3 1,726.3 1,697.4 1,601.4 1,560.7 -5.8
Total 56,988.5 46,165.3 49,327.5 50,515.0 51,272.2 52,154.1 52,602.2 2.6
Growth (%) NA -19.0 6.8 2.4 1.5 1.7 0.9
Share (%)
Windows 38.7 40.8 41.7 41.8 43.2 43.7 44.3
Unix 31.6 30.3 31.5 31.7 30.6 30.1 29.6
Linux 13.7 14.4 14.1 14.3 15.2 16.0 16.4
z/OS 9.4 8.2 7.5 7.5 6.7 6.2 6.0
i5/OS 1.9 1.6 1.3 1.2 1.0 0.8 0.7
NetWare 0.5 0.2 0.2 0.1 0.1 0.1 0.0
Other 4.2 4.6 3.7 3.4 3.3 3.1 3.0
Note: See Table 33 for key forecast assumptions.
Source: IDC, 2010

16 #222605 ©2010 IDC
T A B L E 2
W o r l d w i d e S e r v e r S h i p m e n t s b y O p e r a t i n g S y s t e m , 2 0 0 8 – 2 0 1 4
2008 2009 2010 2011 2012 2013 20142009–2014 CAGR (%)
Shipments
Windows 5,761,454 4,834,288 5,299,913 5,649,139 6,018,727 6,292,767 6,536,168 6.2
Unix 504,164 322,862 353,426 362,630 359,467 369,739 377,239 3.2
Linux 1,766,833 1,412,585 1,593,552 1,735,532 1,923,864 2,114,654 2,234,248 9.6
z/OS 2,387 1,244 1,157 1,208 1,203 1,209 1,204 -0.7
i5/OS 7,158 6,279 7,037 7,176 6,741 6,366 5,914 -1.2
NetWare 74,524 24,559 26,534 17,728 11,135 10,933 10,997 -14.8
Other 17,903 15,886 10,922 8,592 4,818 5,377 6,204 -17.1
Total 8,134,423 6,617,703 7,292,542 7,782,006 8,325,955 8,801,045 9,171,974 6.7
Growth (%) NA -18.6 10.2 6.7 7.0 5.7 4.2
Share (%)
Windows 70.8 73.1 72.7 72.6 72.3 71.5 71.3
Unix 6.2 4.9 4.8 4.7 4.3 4.2 4.1
Linux 21.7 21.3 21.9 22.3 23.1 24.0 24.4
z/OS 0.0 0.0 0.0 0.0 0.0 0.0 0.0
i5/OS 0.1 0.1 0.1 0.1 0.1 0.1 0.1
NetWare 0.9 0.4 0.4 0.2 0.1 0.1 0.1
Other 0.2 0.2 0.1 0.1 0.1 0.1 0.1
Note: See Table 33 for key forecast assumptions.
Source: IDC, 2010

©2010 IDC #222605 17
T A B L E 3
A m e r i c a s S e r v e r C u s t o m e r R e v e n u e b y O p e r a t i n g S y s t e m , 2 0 0 8 – 2 0 1 4
2008 2009 2010 2011 2012 2013 20142009–2014 CAGR (%)
Revenue ($M)
Windows 9,687.1 8,476.5 9,443.6 9,476.7 10,168.9 10,495.4 10,864.6 5.1
Unix 7,220.4 5,817.2 6,767.4 6,920.5 6,748.3 6,577.2 6,424.0 2.0
Linux 3,386.3 2,754.6 3,103.1 3,159.0 3,396.8 3,762.3 3,920.6 7.3
z/OS 2,786.7 1,895.6 1,874.4 1,978.6 1,750.5 1,670.9 1,666.7 -2.5
i5/OS 414.5 256.5 376.5 334.4 273.8 212.1 140.3 -11.4
NetWare 113.0 20.9 5.5 0.7 0.7 0.7 0.6 -51.6
Other 490.0 396.0 432.5 371.5 331.7 332.5 336.3 -3.2
Total 24,097.9 19,617.4 22,003.0 22,241.4 22,670.7 23,051.2 23,353.0 3.5
Growth (%) NA -18.6 12.2 1.1 1.9 1.7 1.3
Share (%)
Windows 40.2 43.2 42.9 42.6 44.9 45.5 46.5
Unix 30.0 29.7 30.8 31.1 29.8 28.5 27.5
Linux 14.1 14.0 14.1 14.2 15.0 16.3 16.8
z/OS 11.6 9.7 8.5 8.9 7.7 7.2 7.1
i5/OS 1.7 1.3 1.7 1.5 1.2 0.9 0.6
NetWare 0.5 0.1 0.0 0.0 0.0 0.0 0.0
Other 2.0 2.0 2.0 1.7 1.5 1.4 1.4
Note: See Table 33 for key forecast assumptions.
Source: IDC, 2010

18 #222605 ©2010 IDC
T A B L E 4
A m e r i c a s S e r v e r S h i p m e n t s b y O p e r a t i n g S y s t e m , 2 0 0 8 – 2 0 1 4
2008 2009 2010 2011 2012 2013 20142009–2014 CAGR (%)
Shipments
Windows 2,342,146 1,936,295 2,185,197 2,302,235 2,469,205 2,561,428 2,656,466 6.5
Unix 218,757 140,861 143,195 159,486 168,215 175,966 182,529 5.3
Linux 781,657 580,865 664,603 708,961 764,006 855,819 892,630 9.0
z/OS 1,076 338 359 416 396 410 425 4.7
i5/OS 2,683 2,721 4,950 5,158 4,897 4,585 4,185 9.0
NetWare 26,514 6,422 2,154 175 185 162 171 -51.6
Other 11,158 6,568 7,340 5,247 1,692 2,325 3,226 -13.3
Total 3,383,990 2,674,071 3,007,798 3,181,678 3,408,596 3,600,695 3,739,633 6.9
Growth (%) NA -21.0 12.5 5.8 7.1 5.6 3.9
Share (%)
Windows 69.2 72.4 72.7 72.4 72.4 71.1 71.0
Unix 6.5 5.3 4.8 5.0 4.9 4.9 4.9
Linux 23.1 21.7 22.1 22.3 22.4 23.8 23.9
z/OS 0.0 0.0 0.0 0.0 0.0 0.0 0.0
i5/OS 0.1 0.1 0.2 0.2 0.1 0.1 0.1
NetWare 0.8 0.2 0.1 0.0 0.0 0.0 0.0
Other 0.3 0.2 0.2 0.2 0.0 0.1 0.1
Note: See Table 33 for key forecast assumptions.
Source: IDC, 2010

©2010 IDC #222605 19
T A B L E 5
E M E A S e r v e r C u s t o m e r R e v e n u e b y O p e r a t i n g S y s t e m , 2 0 0 8 – 2 0 1 4
2008 2009 2010 2011 2012 2013 20142009–2014 CAGR (%)
Revenue ($M)
Windows 7,092.4 5,587.3 5,923.4 6,090.0 6,127.3 6,164.8 6,281.6 2.4
Unix 5,802.9 3,907.5 4,396.3 4,514.2 4,275.9 4,225.3 4,170.8 1.3
Linux 2,657.4 2,197.5 1,969.9 1,990.9 2,008.9 1,972.0 1,959.2 -2.3
z/OS 1,729.5 1,066.9 1,003.0 1,022.6 902.1 856.5 801.0 -5.6
i5/OS 374.9 282.3 92.6 84.3 66.3 60.6 60.2 -26.6
NetWare 82.3 29.0 75.0 51.8 28.1 26.0 24.8 -3.1
Other 627.8 467.0 396.9 442.1 504.8 463.1 451.5 -0.7
Total 18,367.3 13,537.5 13,857.0 14,195.9 13,913.4 13,768.2 13,749.0 0.3
Growth (%) NA -26.3 2.4 2.4 -2.0 -1.0 -0.1
Share (%)
Windows 38.6 41.3 42.7 42.9 44.0 44.8 45.7
Unix 31.6 28.9 31.7 31.8 30.7 30.7 30.3
Linux 14.5 16.2 14.2 14.0 14.4 14.3 14.2
z/OS 9.4 7.9 7.2 7.2 6.5 6.2 5.8
i5/OS 2.0 2.1 0.7 0.6 0.5 0.4 0.4
NetWare 0.4 0.2 0.5 0.4 0.2 0.2 0.2
Other 3.4 3.4 2.9 3.1 3.6 3.4 3.3
Note: See Table 33 for key forecast assumptions.
Source: IDC, 2010

20 #222605 ©2010 IDC
T A B L E 6
E M E A S e r v e r S h i p m e n t s b y O p e r a t i n g S y s t e m , 2 0 0 8 – 2 0 1 4
2008 2009 2010 2011 2012 2013 20142009–2014 CAGR (%)
Shipments
Windows 1,930,076 1,523,152 1,617,468 1,729,152 1,821,400 1,882,916 1,974,687 5.3
Unix 149,658 87,603 108,535 97,966 83,980 83,217 82,369 -1.2
Linux 566,396 418,340 453,308 476,980 506,902 516,917 534,654 5.0
z/OS 1,038 652 577 561 550 551 538 -3.8
i5/OS 2,812 2,240 850 829 712 675 677 -21.3
NetWare 26,702 9,848 24,051 17,232 10,634 10,460 10,517 1.3
Other 4,079 7,198 1,766 1,657 1,508 1,513 1,513 -26.8
Total 2,680,761 2,049,033 2,206,556 2,324,377 2,425,686 2,496,250 2,604,955 4.9
Growth (%) NA -23.6 7.7 5.3 4.4 2.9 4.4
Share (%)
Windows 72.0 74.3 73.3 74.4 75.1 75.4 75.8
Unix 5.6 4.3 4.9 4.2 3.5 3.3 3.2
Linux 21.1 20.4 20.5 20.5 20.9 20.7 20.5
z/OS 0.0 0.0 0.0 0.0 0.0 0.0 0.0
i5/OS 0.1 0.1 0.0 0.0 0.0 0.0 0.0
NetWare 1.0 0.5 1.1 0.7 0.4 0.4 0.4
Other 0.2 0.4 0.1 0.1 0.1 0.1 0.1
Note: See Table 33 for key forecast assumptions.
Source: IDC, 2010

©2010 IDC #222605 21
T A B L E 7
A s i a / P a c i f i c S e r v e r C u s t o m e r R e v e n u e b y O p e r a t i n g S y s t e m , 2 0 0 8 – 2 0 1 4
2008 2009 2010 2011 2012 2013 20142009–2014 CAGR (%)
Revenue ($M)
Windows 5,299.2 4,766.8 5,205.2 5,550.7 5,830.0 6,110.9 6,144.6 5.2
Unix 5,012.6 4,241.0 4,388.2 4,559.4 4,657.0 4,909.4 4,999.2 3.3
Linux 1,757.5 1,708.0 1,900.3 2,089.3 2,382.0 2,619.6 2,759.6 10.1
z/OS 816.3 837.6 812.3 786.3 784.4 722.0 671.7 -4.3
i5/OS 286.0 190.5 186.4 178.5 173.0 166.1 151.3 -4.5
NetWare 66.4 26.4 1.0 0.9 0.9 0.9 0.9 -49.4
Other 1,285.3 1,240.1 973.9 912.7 860.8 805.8 772.9 -9.0
Total 14,523.4 13,010.4 13,467.4 14,077.7 14,688.1 15,334.7 15,500.2 3.6
Growth (%) NA -10.4 3.5 4.5 4.3 4.4 1.1
Share (%)
Windows 36.5 36.6 38.7 39.4 39.7 39.9 39.6
Unix 34.5 32.6 32.6 32.4 31.7 32.0 32.3
Linux 12.1 13.1 14.1 14.8 16.2 17.1 17.8
z/OS 5.6 6.4 6.0 5.6 5.3 4.7 4.3
i5/OS 2.0 1.5 1.4 1.3 1.2 1.1 1.0
NetWare 0.5 0.2 0.0 0.0 0.0 0.0 0.0
Other 8.8 9.5 7.2 6.5 5.9 5.3 5.0
Note: See Table 33 for key forecast assumptions.
Source: IDC, 2010

22 #222605 ©2010 IDC
T A B L E 8
A s i a / P a c i f i c S e r v e r S h i p m e n t s b y O p e r a t i n g S y s t e m , 2 0 0 8 – 2 0 1 4
2008 2009 2010 2011 2012 2013 20142009–2014 CAGR (%)
Shipments
Windows 1,489,233 1,374,841 1,497,248 1,617,752 1,728,122 1,848,423 1,905,015 6.7
Unix 135,749 94,398 101,695 105,179 107,272 110,556 112,340 3.5
Linux 418,780 413,380 475,641 549,592 652,956 741,918 806,964 14.3
z/OS 273 254 221 230 256 247 241 -1.0
i5/OS 1,663 1,318 1,236 1,189 1,133 1,106 1,052 -4.4
NetWare 21,308 8,289 330 322 316 311 309 -48.2
Other 2,666 2,120 1,816 1,688 1,618 1,539 1,465 -7.1
Total 2,069,672 1,894,599 2,078,188 2,275,951 2,491,673 2,704,100 2,827,386 8.3
Growth (%) NA -8.5 9.7 9.5 9.5 8.5 4.6
Share (%)
Windows 72.0 72.6 72.0 71.1 69.4 68.4 67.4
Unix 6.6 5.0 4.9 4.6 4.3 4.1 4.0
Linux 20.2 21.8 22.9 24.1 26.2 27.4 28.5
z/OS 0.0 0.0 0.0 0.0 0.0 0.0 0.0
i5/OS 0.1 0.1 0.1 0.1 0.0 0.0 0.0
NetWare 1.0 0.4 0.0 0.0 0.0 0.0 0.0
Other 0.1 0.1 0.1 0.1 0.1 0.1 0.1
Note: See Table 33 for key forecast assumptions.
Source: IDC, 2010

©2010 IDC #222605 23
T A B L E 9
W o r l d w i d e S e r v e r C u s t o m e r R e v e n u e b y C h i p a n d O p e r a t i n g S y s t e m , 2 0 0 8 – 2 0 1 4 ( $ M )
2008 2009 2010 2011 2012 2013 20142009–2014 CAGR (%)
CISC
Unix 83.0 177.0 74.5 66.3 63.8 140.0 76.4 -15.5
z/OS 5,332.5 3,800.2 3,689.7 3,787.4 3,436.9 3,249.4 3,139.4 -3.7
Other 1,109.5 1,187.9 962.5 968.4 935.1 840.1 789.3 -7.9
Subtotal 6,525.0 5,165.1 4,726.7 4,822.1 4,435.8 4,229.5 4,005.0 -5.0
Growth (%) NA -20.8 -8.5 2.0 -8.0 -4.7 -5.3
EPIC
Windows 274.5 123.4 145.5 157.7 171.0 196.8 226.5 12.9
Unix 3,699.6 3,271.9 3,696.2 3,838.7 3,963.7 4,187.9 4,330.9 5.8
Linux 432.7 291.1 276.0 301.8 338.8 362.3 391.5 6.1
Other 777.6 537.7 493.0 477.8 518.8 521.0 531.4 -0.2
Subtotal 5,184.3 4,224.1 4,610.9 4,776.2 4,992.5 5,268.2 5,480.3 5.3
Growth (%) NA -18.5 9.2 3.6 4.5 5.5 4.0
RISC
Unix 13,478.6 9,934.4 11,053.5 11,432.2 11,036.7 10,759.1 10,561.4 1.2
Linux 236.1 265.7 148.4 196.3 230.9 260.0 285.7 1.5
i5/OS 1,075.5 729.3 655.5 597.2 513.2 438.8 351.8 -13.6
Other 309.2 152.2 163.7 152.9 160.3 162.0 163.2 1.4
Subtotal 15,099.4 11,081.7 12,021.1 12,378.7 11,941.1 11,619.8 11,362.1 0.5
Growth (%) NA -26.6 8.5 3.0 -3.5 -2.7 -2.2
x86
Windows 21,804.2 18,707.2 20,426.8 20,959.6 21,955.2 22,574.3 23,064.2 4.3
Unix 774.6 582.4 727.6 656.7 616.9 624.9 625.2 1.4
Linux 7,132.4 6,103.4 6,549.0 6,741.1 7,217.9 7,731.6 7,962.3 5.5

24 #222605 ©2010 IDC
T A B L E 9
W o r l d w i d e S e r v e r C u s t o m e r R e v e n u e b y C h i p a n d O p e r a t i n g S y s t e m , 2 0 0 8 – 2 0 1 4 ( $ M )
2008 2009 2010 2011 2012 2013 20142009–2014 CAGR (%)
NetWare 261.7 76.2 81.3 53.3 29.5 27.4 26.1 -19.3
Other 206.9 225.2 184.2 127.2 83.2 78.3 76.8 -19.4
Subtotal 30,179.8 25,694.5 27,968.9 28,538.0 29,902.9 31,036.6 31,754.6 4.3
Growth (%) NA -14.9 8.9 2.0 4.8 3.8 2.3
Total 56,988.5 46,165.3 49,327.5 50,515.0 51,272.2 52,154.1 52,602.2 2.6
Growth (%) NA -19.0 6.8 2.4 1.5 1.7 0.9
Note: See Table 33 for key forecast assumptions.
Source: IDC, 2010
T A B L E 1 0
W o r l d w i d e S e r v e r S h i p m e n t s b y C h i p a n d O p e r a t i n g S y s t e m , 2 0 0 8 – 2 0 1 4
2008 2009 2010 2011 2012 2013 20142009–2014 CAGR (%)
CISC
Unix 91 201 71 55 54 118 67 -19.7
z/OS 2,387 1,244 1,157 1,208 1,203 1,209 1,204 -0.7
Other 1,110 527 500 529 506 494 475 -2.1
Subtotal 3,588 1,972 1,728 1,791 1,763 1,821 1,746 -2.4
Growth (%) NA -45.0 -12.4 3.7 -1.6 3.3 -4.1
EPIC
Windows 4,574 2,294 3,066 3,133 3,608 4,345 5,327 18.4
Unix 41,408 34,812 37,722 40,431 43,182 47,372 51,067 8.0
Linux 9,544 4,957 5,234 5,459 5,965 6,960 8,644 11.8
Other 2,894 2,051 2,053 2,187 2,392 2,865 3,627 12.1
Subtotal 58,420 44,115 48,074 51,209 55,148 61,541 68,665 9.3
Growth (%) NA -24.5 9.0 6.5 7.7 11.6 11.6

©2010 IDC #222605 25
T A B L E 1 0
W o r l d w i d e S e r v e r S h i p m e n t s b y C h i p a n d O p e r a t i n g S y s t e m , 2 0 0 8 – 2 0 1 4
2008 2009 2010 2011 2012 2013 20142009–2014 CAGR (%)
RISC
Windows 1 1 – – – – – NA
Unix 304,740 184,556 189,186 199,757 197,193 195,671 193,891 1.0
Linux 7,877 8,333 8,527 11,664 13,289 14,722 15,158 12.7
i5/OS 7,158 6,279 7,037 7,176 6,741 6,366 5,914 -1.2
NetWare 1 – – – – – – NA
Other 866 367 561 621 716 825 917 20.1
Subtotal 320,642 199,536 205,311 219,218 217,939 217,584 215,880 1.6
Growth (%) NA -37.8 2.9 6.8 -0.6 -0.2 -0.8
x86
Windows 5,756,880 4,831,993 5,296,848 5,646,007 6,015,119 6,288,423 6,530,841 6.2
Unix 157,925 103,292 126,447 122,387 119,038 126,578 132,214 5.1
Linux 1,749,412 1,399,295 1,579,791 1,718,409 1,904,610 2,092,972 2,210,446 9.6
NetWare 74,523 24,559 26,534 17,728 11,135 10,933 10,997 -14.8
Other 13,034 12,940 7,810 5,256 1,204 1,193 1,185 -38.0
Subtotal 7,751,773 6,372,080 7,037,430 7,509,787 8,051,105 8,520,099 8,885,683 6.9
Growth (%) NA -17.8 10.4 6.7 7.2 5.8 4.3
Total 8,134,423 6,617,703 7,292,542 7,782,006 8,325,955 8,801,045 9,171,974 6.7
Growth (%) NA -18.6 10.2 6.7 7.0 5.7 4.2
Note: See Table 33 for key forecast assumptions.
Source: IDC, 2010

26 #222605 ©2010 IDC
T A B L E 1 1
A m e r i c a s S e r v e r C u s t o m e r R e v e n u e b y C h i p a n d O p e r a t i n g S y s t e m , 2 0 0 8 – 2 0 1 4 ( $ M )
2008 2009 2010 2011 2012 2013 20142009–2014 CAGR (%)
CISC
z/OS 2,786.7 1,895.6 1,874.4 1,978.6 1,750.5 1,670.9 1,666.7 -2.5
Other 113.8 118.7 99.7 89.9 65.8 50.1 36.7 -20.9
Subtotal 2,900.5 2,014.3 1,974.1 2,068.5 1,816.3 1,721.0 1,703.3 -3.3
Growth (%) NA -30.6 -2.0 4.8 -12.2 -5.2 -1.0
EPIC
Windows 130.0 66.0 75.4 81.3 94.0 110.7 135.0 15.4
Unix 1,142.2 1,083.6 1,114.9 1,121.9 1,220.9 1,311.3 1,390.5 5.1
Linux 108.5 62.4 86.4 97.3 113.2 130.6 152.0 19.5
NetWare – 0.0 0.1 0.2 0.2 0.2 0.1 22.5
Other 226.1 144.8 224.7 215.4 229.0 241.4 253.7 11.9
Subtotal 1,606.9 1,356.8 1,501.5 1,516.2 1,657.4 1,794.3 1,931.3 7.3
Growth (%) NA -15.6 10.7 1.0 9.3 8.3 7.6
RISC
Unix 5,640.2 4,348.8 5,237.0 5,392.9 5,100.6 4,825.4 4,586.6 1.1
Linux 88.6 107.9 113.5 152.5 173.9 194.7 221.8 15.5
i5/OS 414.5 256.5 376.5 334.4 273.8 212.1 140.3 -11.4
Other 71.6 26.0 25.0 32.3 36.9 41.0 45.9 12.1
Subtotal 6,214.9 4,739.1 5,752.1 5,912.1 5,585.2 5,273.3 4,994.6 1.1
Growth (%) NA -23.7 21.4 2.8 -5.5 -5.6 -5.3

©2010 IDC #222605 27
T A B L E 1 1
A m e r i c a s S e r v e r C u s t o m e r R e v e n u e b y C h i p a n d O p e r a t i n g S y s t e m , 2 0 0 8 – 2 0 1 4 ( $ M )
2008 2009 2010 2011 2012 2013 20142009–2014 CAGR (%)
x86
Windows 9,557.0 8,410.5 9,368.2 9,395.3 10,074.9 10,384.7 10,729.5 5.0
Unix 438.0 384.8 415.5 405.6 426.7 440.5 446.9 3.0
Linux 3,189.2 2,584.3 2,903.2 2,909.2 3,109.7 3,436.9 3,546.9 6.5
NetWare 112.9 20.9 5.4 0.5 0.5 0.5 0.5 -52.8
Other 78.5 106.6 83.0 34.0 – – – NA
Subtotal 13,375.6 11,507.1 12,775.3 12,744.6 13,611.8 14,262.7 14,723.8 5.1
Growth (%) NA -14.0 11.0 -0.2 6.8 4.8 3.2
Total 24,097.9 19,617.4 22,003.0 22,241.4 22,670.7 23,051.2 23,353.0 3.5
Growth (%) NA -18.6 12.2 1.1 1.9 1.7 1.3
Note: See Table 33 for key forecast assumptions.
Source: IDC, 2010
T A B L E 1 2
A m e r i c a s S e r v e r S h i p m e n t s b y C h i p a n d O p e r a t i n g S y s t e m , 2 0 0 8 – 2 0 1 4
2008 2009 2010 2011 2012 2013 20142009–2014 CAGR (%)
CISC
z/OS 1,076 338 359 416 396 410 425 4.7
Other 75 87 76 82 70 64 55 -8.7
Subtotal 1,151 425 435 498 466 474 480 2.4
Growth (%) NA -63.0 2.4 14.5 -6.6 1.8 1.2
EPIC
Windows 2,045 1,218 1,792 1,920 2,349 2,989 3,846 25.9
Unix 11,752 10,421 11,548 12,802 15,159 17,645 20,137 14.1

28 #222605 ©2010 IDC
T A B L E 1 2
A m e r i c a s S e r v e r S h i p m e n t s b y C h i p a n d O p e r a t i n g S y s t e m , 2 0 0 8 – 2 0 1 4
2008 2009 2010 2011 2012 2013 20142009–2014 CAGR (%)
Linux 3,444 1,100 1,796 2,229 2,954 3,979 5,563 38.3
Other 1,184 719 929 1,004 1,308 1,851 2,655 29.9
Subtotal 18,425 13,459 16,065 17,955 21,770 26,463 32,202 19.1
Growth (%) NA -27.0 19.4 11.8 21.2 21.6 21.7
RISC
Windows 1 1 – – – – – NA
Unix 130,384 74,219 74,051 82,594 80,878 78,847 77,224 0.8
Linux 6,077 6,553 5,714 8,146 9,519 10,625 11,184 11.3
i5/OS 2,683 2,721 4,950 5,158 4,897 4,585 4,185 9.0
NetWare 1 – – – – – – NA
Other 177 56 137 225 315 410 516 55.8
Subtotal 139,322 83,550 84,852 96,122 95,609 94,467 93,108 2.2
Growth (%) NA -40.0 1.6 13.3 -0.5 -1.2 -1.4
x86
Windows 2,340,100 1,935,077 2,183,405 2,300,316 2,466,856 2,558,440 2,652,620 6.5
Unix 76,621 56,220 57,597 64,091 72,178 79,474 85,168 8.7
Linux 772,136 573,212 657,093 698,586 751,532 841,215 875,882 8.8
NetWare 26,513 6,422 2,154 175 185 162 171 -51.6
Other 9,723 5,706 6,198 3,936 – – – NA
Subtotal 3,225,092 2,576,637 2,906,446 3,067,103 3,290,751 3,479,291 3,613,843 7.0
Growth (%) NA -20.1 12.8 5.5 7.3 5.7 3.9
Total 3,383,990 2,674,071 3,007,798 3,181,678 3,408,596 3,600,695 3,739,633 6.9
Growth (%) NA -21.0 12.5 5.8 7.1 5.6 3.9
Note: See Table 33 for key forecast assumptions.
Source: IDC, 2010

©2010 IDC #222605 29
T A B L E 1 3
E M E A S e r v e r C u s t o m e r R e v e n u e b y C h i p a n d O p e r a t i n g S y s t e m , 2 0 0 8 – 2 0 1 4 ( $ M )
2008 2009 2010 2011 2012 2013 20142009–2014 CAGR (%)
CISC
Unix 22.3 12.7 12.5 12.9 13.2 14.8 13.8 1.7
z/OS 1,729.5 1,066.9 1,003.0 1,022.6 902.1 856.5 801.0 -5.6
Other 297.1 270.7 265.0 316.1 343.4 307.1 289.4 1.4
Subtotal 2,049.0 1,350.2 1,280.5 1,351.6 1,258.7 1,178.4 1,104.2 -3.9
Growth (%) NA -34.1 -5.2 5.5 -6.9 -6.4 -6.3
EPIC
Windows 79.7 38.4 48.0 53.4 50.0 56.9 59.9 9.3
Unix 1,270.9 924.7 1,250.0 1,288.3 1,234.1 1,274.1 1,304.4 7.1
Linux 222.4 151.6 123.9 138.3 158.6 164.1 171.7 2.5
Other 203.5 125.5 95.4 92.3 127.3 123.1 130.2 0.7
Subtotal 1,776.5 1,240.2 1,517.4 1,572.3 1,570.1 1,618.2 1,666.2 6.1
Growth (%) NA -30.2 22.4 3.6 -0.1 3.1 3.0
RISC
Unix 4,308.4 2,850.4 2,907.1 3,049.5 2,929.6 2,845.7 2,765.2 -0.6
Linux 146.1 152.5 34.3 42.8 55.8 63.9 62.6 -16.3
i5/OS 374.9 282.3 92.6 84.3 66.3 60.6 60.2 -26.6
Other 112.4 46.3 34.6 32.7 33.5 32.2 31.2 -7.6
Subtotal 4,941.9 3,331.5 3,068.6 3,209.3 3,085.2 3,002.4 2,919.1 -2.6
Growth (%) NA -32.6 -7.9 4.6 -3.9 -2.7 -2.8

30 #222605 ©2010 IDC
T A B L E 1 3
E M E A S e r v e r C u s t o m e r R e v e n u e b y C h i p a n d O p e r a t i n g S y s t e m , 2 0 0 8 – 2 0 1 4 ( $ M )
2008 2009 2010 2011 2012 2013 20142009–2014 CAGR (%)
x86
Windows 7,012.7 5,548.9 5,875.4 6,036.5 6,077.3 6,107.9 6,221.7 2.3
Unix 201.2 119.7 226.6 163.5 99.0 90.7 87.4 -6.1
Linux 2,288.9 1,893.4 1,811.7 1,809.9 1,794.4 1,743.9 1,724.9 -1.8
NetWare 82.3 29.0 75.0 51.8 28.1 26.0 24.8 -3.1
Other 14.8 24.6 1.8 1.0 0.6 0.7 0.7 -50.8
Subtotal 9,599.9 7,615.6 7,990.5 8,062.7 7,999.5 7,969.2 8,059.5 1.1
Growth (%) NA 66.3 -92.6 -46.2 -35.1 2.6 8.5
Total 18,367.3 13,537.5 13,857.0 14,195.9 13,913.4 13,768.2 13,749.0 0.3
Growth (%) NA -26.3 2.4 2.4 -2.0 -1.0 -0.1
Note: See Table 33 for key forecast assumptions.
Source: IDC, 2010
T A B L E 1 4
E M E A S e r v e r S h i p m e n t s b y C h i p a n d O p e r a t i n g S y s t e m , 2 0 0 8 – 2 0 1 4
2008 2009 2010 2011 2012 2013 20142009–2014 CAGR (%)
CISC
Unix 49 29 28 15 14 18 17 -10.0
z/OS 1,038 652 577 561 550 551 538 -3.8
Other 117 66 138 189 192 200 198 24.5
Subtotal 1,204 747 743 766 756 769 753 0.2
Growth (%) NA -38.0 -0.6 3.1 -1.3 1.7 -2.0

©2010 IDC #222605 31
T A B L E 1 4
E M E A S e r v e r S h i p m e n t s b y C h i p a n d O p e r a t i n g S y s t e m , 2 0 0 8 – 2 0 1 4
2008 2009 2010 2011 2012 2013 20142009–2014 CAGR (%)
EPIC
Windows 1,366 633 795 762 735 782 873 6.6
Unix 12,875 7,938 8,801 8,909 8,175 8,420 9,013 2.6
Linux 5,005 2,871 2,693 2,317 2,044 2,000 2,074 -6.3
Other 1,211 931 718 785 706 666 654 -6.8
Subtotal 20,457 12,373 13,007 12,773 11,659 11,868 12,615 0.4
Growth (%) NA -39.5 5.1 -1.8 -8.7 1.8 6.3
RISC
Unix 89,177 52,281 52,860 53,810 53,441 52,839 51,104 -0.5
Linux 1,644 1,720 2,765 3,451 3,695 4,017 3,892 17.7
i5/OS 2,812 2,240 850 829 712 675 677 -21.3
Other 460 220 343 346 344 362 351 9.8
Subtotal 94,093 56,461 56,818 58,436 58,192 57,893 56,024 -0.2
Growth (%) NA -40.0 0.6 2.8 -0.4 -0.5 -3.2
x86
Windows 1,928,710 1,522,519 1,616,673 1,728,391 1,820,666 1,882,134 1,973,813 5.3
Unix 47,557 27,355 46,846 35,231 22,350 21,940 22,235 -4.1
Linux 559,747 413,749 447,851 471,211 501,163 510,899 528,688 5.0
NetWare 26,702 9,848 24,051 17,232 10,634 10,460 10,517 1.3
Other 2,291 5,981 567 337 267 285 310 -44.7
Subtotal 2,565,007 1,979,452 2,135,989 2,252,402 2,355,080 2,425,719 2,535,563 5.1
Growth (%) NA -22.8 7.9 5.5 4.6 3.0 4.5
Total 2,680,761 2,049,033 2,206,556 2,324,377 2,425,686 2,496,250 2,604,955 4.9
Growth (%) NA -23.6 7.7 5.3 4.4 2.9 4.4
Note: See Table 33 for key forecast assumptions.
Source: IDC, 2010

32 #222605 ©2010 IDC
T A B L E 1 5
A s i a / P a c i f i c S e r v e r C u s t o m e r R e v e n u e b y C h i p a n d O p e r a t i n g S y s t e m , 2 0 0 8 – 2 0 1 4 ( $ M )
2008 2009 2010 2011 2012 2013 20142009–2014 CAGR (%)
CISC
Unix 60.7 164.3 62.0 53.4 50.6 125.2 62.6 -17.6
z/OS 816.3 837.6 812.3 786.3 784.4 722.0 671.7 -4.3
Other 698.5 798.6 597.7 562.4 525.8 482.9 463.2 -10.3
Subtotal 1,575.5 1,800.5 1,472.1 1,402.0 1,360.8 1,330.1 1,197.5 -7.8
Growth (%) NA 14.3 -18.2 -4.8 -2.9 -2.3 -10.0
EPIC
Windows 64.7 19.0 22.0 22.9 27.0 29.2 31.6 10.7
Unix 1,286.4 1,263.6 1,331.3 1,428.5 1,508.7 1,602.5 1,635.9 5.3
Linux 101.8 77.1 65.8 66.2 67.0 67.5 67.8 -2.5
Other 348.0 267.4 172.8 170.1 162.5 156.5 147.6 -11.2
Subtotal 1,801.0 1,627.0 1,591.9 1,687.7 1,765.1 1,855.7 1,883.0 3.0
Growth (%) NA -9.7 -2.2 6.0 4.6 5.1 1.5
RISC
Unix 3,530.1 2,735.3 2,909.3 2,989.8 3,006.5 3,088.0 3,209.6 3.3
Linux 1.4 5.2 0.5 1.0 1.2 1.3 1.4 -23.4
i5/OS 286.0 190.5 186.4 178.5 173.0 166.1 151.3 -4.5
Other 125.1 80.0 104.1 87.9 89.9 88.8 86.1 1.5
Subtotal 3,942.6 3,011.1 3,200.3 3,257.2 3,270.7 3,344.2 3,448.4 2.7
Growth (%) NA -23.6 6.3 1.8 0.4 2.2 3.1
x86
Windows 5,234.5 4,747.8 5,183.2 5,527.8 5,803.0 6,081.7 6,112.9 5.2
Unix 135.4 77.9 85.5 87.6 91.2 93.7 91.0 3.2

©2010 IDC #222605 33
T A B L E 1 5
A s i a / P a c i f i c S e r v e r C u s t o m e r R e v e n u e b y C h i p a n d O p e r a t i n g S y s t e m , 2 0 0 8 – 2 0 1 4 ( $ M )
2008 2009 2010 2011 2012 2013 20142009–2014 CAGR (%)
Linux 1,654.4 1,625.7 1,834.0 2,022.1 2,313.9 2,550.8 2,690.4 10.6
NetWare 66.4 26.4 1.0 0.9 0.9 0.9 0.9 -49.4
Other 113.6 94.0 99.3 92.2 82.6 77.7 76.1 -4.1
Subtotal 7,204.3 6,571.8 7,203.1 7,730.7 8,291.6 8,804.8 8,971.4 6.4
Growth (%) NA -8.8 9.6 7.3 7.3 6.2 1.9
Total 14,523.4 13,010.4 13,467.4 14,077.7 14,688.1 15,334.7 15,500.2 3.6
Growth (%) NA -10.4 3.5 4.5 4.3 4.4 1.1
Note: See Table 33 for key forecast assumptions.
Source: IDC, 2010
T A B L E 1 6
A s i a / P a c i f i c S e r v e r S h i p m e n t s b y C h i p a n d O p e r a t i n g S y s t e m , 2 0 0 8 – 2 0 1 4 ( $ M )
2008 2009 2010 2011 2012 2013 20142009–2014 CAGR (%)
CISC
Unix 42 172 43 40 40 100 50 -21.9
z/OS 273 254 221 230 256 247 241 -1.0
Other 918 374 285 257 245 230 222 -9.9
Subtotal 1,233 800 550 527 541 578 513 -8.5
Growth (%) NA -35.1 -31.3 -4.1 2.7 6.8 -11.2
EPIC
Windows 1,163 443 479 451 525 574 608 6.5
Unix 16,781 16,453 17,374 18,720 19,849 21,308 21,916 5.9
Linux 1,095 986 745 913 967 981 1,006 0.4

34 #222605 ©2010 IDC
T A B L E 1 6
A s i a / P a c i f i c S e r v e r S h i p m e n t s b y C h i p a n d O p e r a t i n g S y s t e m , 2 0 0 8 – 2 0 1 4 ( $ M )
2008 2009 2010 2011 2012 2013 20142009–2014 CAGR (%)
Other 499 401 405 398 379 348 317 -4.6
Subtotal 19,538 18,283 19,003 20,481 21,719 23,210 23,848 5.5
Growth (%) NA -6.4 3.9 7.8 6.0 6.9 2.7
RISC
Unix 85,179 58,056 62,275 63,353 62,873 63,984 65,563 2.5
Linux 156 60 48 67 74 80 82 6.5
i5/OS 1,663 1,318 1,236 1,189 1,133 1,106 1,052 -4.4
Other 229 91 81 50 58 53 51 -11.0
Subtotal 87,227 59,525 63,640 64,660 64,138 65,223 66,748 2.3
Growth (%) NA -31.8 6.9 1.6 -0.8 1.7 2.3
x86
Windows 1,488,070 1,374,398 1,496,770 1,617,301 1,727,597 1,847,849 1,904,407 6.7
Unix 33,747 19,717 22,003 23,065 24,509 25,164 24,811 4.7
Linux 417,529 412,334 474,847 548,612 651,915 740,857 805,876 14.3
NetWare 21,308 8,289 330 322 316 311 309 -48.2
Other 1,020 1,254 1,045 983 937 908 875 -6.9
Subtotal 1,961,674 1,815,991 1,994,995 2,190,282 2,405,275 2,615,089 2,736,277 8.5
Growth (%) NA -7.4 9.9 9.8 9.8 8.7 4.6
Total 2,069,672 1,894,599 2,078,188 2,275,951 2,491,673 2,704,100 2,827,386 8.3
Growth (%) NA -8.5 9.7 9.5 9.5 8.5 4.6
Note: See Table 33 for key forecast assumptions.
Source: IDC, 2010

©2010 IDC #222605 35
T A B L E 1 7
W o r l d w i d e S e r v e r C u s t o m e r R e v e n u e b y P r i c e B a n d , 2 0 0 8 – 2 0 1 4
2008 2009 2010 2011 2012 2013 20142009–2014 CAGR (%)
Revenue ($M)
$0–2,999 6,338.3 4,755.8 7,208.6 7,398.4 7,620.2 8,759.7 9,465.1 14.8
$3,000–5,999 15,625.2 12,825.6 13,398.5 13,435.6 14,116.2 13,778.6 13,701.2 1.3
$6,000–9,999 3,481.7 3,363.0 2,928.8 3,476.2 3,994.5 5,040.2 5,605.9 10.8
$10,000–24,999 6,156.3 5,336.8 5,273.8 5,566.0 5,701.5 5,071.5 4,674.6 -2.6
$25,000–49,999 2,756.8 2,488.8 2,915.9 2,930.8 2,917.9 3,065.5 2,901.6 3.1
$50,000–99,999 3,025.7 2,228.7 2,651.7 2,688.7 2,621.7 2,565.5 3,087.9 6.7
$100,000–249,999 2,887.1 1,972.1 3,352.8 3,416.8 3,361.1 3,456.3 3,253.8 10.5
$250,000–499,999 3,583.5 2,576.6 2,608.6 2,625.7 2,537.6 2,434.3 2,539.8 -0.3
$500,000–999,999 3,643.6 3,106.4 2,491.5 2,701.2 2,757.2 2,830.2 2,583.8 -3.6
$1M–2.9M 4,478.9 3,558.3 3,147.4 3,101.1 3,004.7 2,727.1 2,385.7 -7.7
$3M+ 5,011.4 3,953.2 3,350.0 3,174.4 2,639.8 2,425.1 2,402.7 -9.5
Total 56,988.5 46,165.3 49,327.5 50,515.0 51,272.2 52,154.1 52,602.2 2.6
Share (%)
$0–2,999 11.1 10.3 14.6 14.6 14.9 16.8 18.0
$3,000–5,999 27.4 27.8 27.2 26.6 27.5 26.4 26.0
$6,000–9,999 6.1 7.3 5.9 6.9 7.8 9.7 10.7
$10,000–24,999 10.8 11.6 10.7 11.0 11.1 9.7 8.9
$25,000–49,999 4.8 5.4 5.9 5.8 5.7 5.9 5.5
$50,000–99,999 5.3 4.8 5.4 5.3 5.1 4.9 5.9
$100,000–249,999 5.1 4.3 6.8 6.8 6.6 6.6 6.2
$250,000–499,999 6.3 5.6 5.3 5.2 4.9 4.7 4.8
$500,000–999,999 6.4 6.7 5.1 5.3 5.4 5.4 4.9
$1M–2.9M 7.9 7.7 6.4 6.1 5.9 5.2 4.5
$3M+ 8.8 8.6 6.8 6.3 5.1 4.6 4.6
Note: See Table 33 for key forecast assumptions.
Source: IDC, 2010

36 #222605 ©2010 IDC
T A B L E 1 8
W o r l d w i d e S e r v e r S h i p m e n t s b y P r i c e B a n d , 2 0 0 8 – 2 0 1 4
2008 2009 2010 2011 2012 2013 20142009–2014 CAGR (%)
Shipments
$0–2,999 3,347,123 2,636,529 3,408,414 3,637,530 3,825,865 4,313,600 4,654,908 12.0
$3,000–5,999 3,766,756 3,045,429 3,020,807 3,186,403 3,450,771 3,377,107 3,377,295 2.1
$6,000–9,999 450,184 440,513 370,735 444,605 518,779 637,525 702,732 9.8
$10,000–24,999 412,651 367,518 352,998 371,221 387,160 325,749 286,674 -4.8
$25,000–49,999 80,895 71,791 77,625 78,216 78,414 82,092 78,180 1.7
$50,000–99,999 40,586 29,605 32,242 32,511 31,965 31,189 40,778 6.6
$100,000–249,999 18,507 12,842 16,830 18,343 19,380 20,280 18,154 7.2
$250,000–499,999 9,701 6,958 7,297 7,376 7,552 7,447 7,606 1.8
$500,000–999,999 4,812 4,103 3,527 3,678 3,963 4,043 3,774 -1.7
$1M–2.9M 2,725 1,967 1,721 1,785 1,817 1,736 1,576 -4.3
$3M+ 484 448 348 338 288 279 296 -8.0
Total 8,134,423 6,617,703 7,292,542 7,782,006 8,325,955 8,801,045 9,171,974 6.7
Share (%)
$0–2,999 41.1 39.8 46.7 46.7 46.0 49.0 50.8
$3,000–5,999 46.3 46.0 41.4 40.9 41.4 38.4 36.8
$6,000–9,999 5.5 6.7 5.1 5.7 6.2 7.2 7.7
$10,000–24,999 5.1 5.6 4.8 4.8 4.7 3.7 3.1
$25,000–49,999 1.0 1.1 1.1 1.0 0.9 0.9 0.9
$50,000–99,999 0.5 0.4 0.4 0.4 0.4 0.4 0.4
$100,000–249,999 0.2 0.2 0.2 0.2 0.2 0.2 0.2
$250,000–499,999 0.1 0.1 0.1 0.1 0.1 0.1 0.1
$500,000–999,999 0.1 0.1 0.0 0.0 0.0 0.0 0.0
$1M–2.9M 0.0 0.0 0.0 0.0 0.0 0.0 0.0
$3M+ 0.0 0.0 0.0 0.0 0.0 0.0 0.0
Note: See Table 33 for key forecast assumptions.
Source: IDC, 2010

©2010 IDC #222605 37
T A B L E 1 9
A m e r i c a s S e r v e r C u s t o m e r R e v e n u e b y P r i c e B a n d , 2 0 0 8 – 2 0 1 4
2008 2009 2010 2011 2012 2013 20142009–2014 CAGR (%)
Revenue ($M)
$0–2,999 2,189.2 1,393.9 2,228.1 2,349.3 2,519.4 2,655.8 2,767.8 14.7
$3,000–5,999 8,184.6 6,877.0 7,905.1 7,841.5 8,355.0 8,750.2 9,021.6 5.6
$6,000–9,999 993.2 1,085.6 842.3 822.9 985.6 1,197.1 1,442.1 5.8
$10,000–24,999 2,648.8 2,299.7 1,940.3 2,068.2 2,151.3 2,129.1 2,034.5 -2.4
$25,000–49,999 936.4 1,041.9 1,323.1 1,371.3 1,392.5 1,383.9 1,337.4 5.1
$50,000–99,999 1,191.1 660.6 1,089.5 1,120.0 1,079.9 1,035.0 950.2 7.5
$100,000–249,999 865.3 571.4 1,128.3 1,147.0 1,172.6 1,221.3 1,370.2 19.1
$250,000–499,999 1,500.2 888.1 1,020.5 1,109.1 1,044.9 1,013.3 981.6 2.0
$500,000–999,999 1,214.5 1,245.8 1,055.7 1,000.7 1,000.6 986.3 957.5 -5.1
$1M–2.9M 1,923.7 1,780.6 1,596.4 1,580.9 1,417.9 1,248.0 1,050.7 -10.0
$3M+ 2,450.9 1,772.7 1,873.7 1,830.3 1,551.1 1,431.2 1,439.2 -4.1
Total 24,097.9 19,617.4 22,003.0 22,241.4 22,670.7 23,051.2 23,353.0 3.5
Share (%)
$0–2,999 9.1 7.1 10.1 10.6 11.1 11.5 11.9
$3,000–5,999 34.0 35.1 35.9 35.3 36.9 38.0 38.6
$6,000–9,999 4.1 5.5 3.8 3.7 4.3 5.2 6.2
$10,000–24,999 11.0 11.7 8.8 9.3 9.5 9.2 8.7
$25,000–49,999 3.9 5.3 6.0 6.2 6.1 6.0 5.7
$50,000–99,999 4.9 3.4 5.0 5.0 4.8 4.5 4.1
$100,000–249,999 3.6 2.9 5.1 5.2 5.2 5.3 5.9
$250,000–499,999 6.2 4.5 4.6 5.0 4.6 4.4 4.2
$500,000–999,999 5.0 6.4 4.8 4.5 4.4 4.3 4.1
$1M–2.9M 8.0 9.1 7.3 7.1 6.3 5.4 4.5
$3M+ 10.2 9.0 8.5 8.2 6.8 6.2 6.2
Note: See Table 33 for key forecast assumptions.
Source: IDC, 2010

38 #222605 ©2010 IDC
T A B L E 2 0
A m e r i c a s S e r v e r S h i p m e n t s b y P r i c e B a n d , 2 0 0 8 – 2 0 1 4
2008 2009 2010 2011 2012 2013 20142009–2014 CAGR (%)
Shipments
$0–2,999 1,021,547 685,670 939,697 1,027,908 1,103,903 1,170,234 1,222,069 12.3
$3,000–5,999 1,997,888 1,642,365 1,759,612 1,824,584 1,945,123 2,050,336 2,119,445 5.2
$6,000–9,999 127,275 141,092 113,475 116,189 139,086 165,623 196,254 6.8
$10,000–24,999 183,052 157,891 133,573 149,480 158,064 153,639 142,321 -2.1
$25,000–49,999 27,264 29,561 37,848 39,443 39,568 38,756 37,199 4.7
$50,000–99,999 14,969 8,465 11,426 11,614 10,831 10,293 10,130 3.7
$100,000–249,999 5,063 3,811 6,523 6,542 6,370 6,356 6,928 12.7
$250,000–499,999 4,013 2,383 3,107 3,443 3,252 3,161 3,097 5.4
$500,000–999,999 1,513 1,735 1,489 1,397 1,425 1,408 1,363 -4.7
$1M–2.9M 1,197 924 851 874 806 725 645 -6.9
$3M+ 209 172 195 203 168 164 182 1.1
Total 3,383,990 2,674,071 3,007,798 3,181,678 3,408,596 3,600,695 3,739,633 6.9
Share (%)
$0–2,999 30.2 25.6 31.2 32.3 32.4 32.5 32.7
$3,000–5,999 59.0 61.4 58.5 57.3 57.1 56.9 56.7
$6,000–9,999 3.8 5.3 3.8 3.7 4.1 4.6 5.2
$10,000–24,999 5.4 5.9 4.4 4.7 4.6 4.3 3.8
$25,000–49,999 0.8 1.1 1.3 1.2 1.2 1.1 1.0
$50,000–99,999 0.4 0.3 0.4 0.4 0.3 0.3 0.3
$100,000–249,999 0.1 0.1 0.2 0.2 0.2 0.2 0.2
$250,000–499,999 0.1 0.1 0.1 0.1 0.1 0.1 0.1
$500,000–999,999 0.0 0.1 0.0 0.0 0.0 0.0 0.0
$1M–2.9M 0.0 0.0 0.0 0.0 0.0 0.0 0.0
$3M+ 0.0 0.0 0.0 0.0 0.0 0.0 0.0
Note: See Table 33 for key forecast assumptions.
Source: IDC, 2010

©2010 IDC #222605 39
T A B L E 2 1
E M E A S e r v e r C u s t o m e r R e v e n u e b y P r i c e B a n d , 2 0 0 8 – 2 0 1 4 ( $ M )
2008 2009 2010 2011 2012 2013 20142009–2014 CAGR (%)
Revenue ($M)
$0–2,999 2,076.2 1,381.1 1,878.5 1,957.7 2,061.4 2,128.5 2,181.3 9.6
$3,000–5,999 5,244.2 4,191.4 4,262.3 4,259.8 4,139.9 4,070.2 4,076.4 -0.6
$6,000–9,999 691.6 755.2 432.8 544.5 632.6 670.6 713.9 -1.1
$10,000–24,999 1,925.1 1,434.8 1,678.6 1,809.4 1,805.9 1,756.2 1,779.4 4.4
$25,000–49,999 1,051.4 824.2 837.2 791.6 762.6 835.1 872.1 1.1
$50,000–99,999 908.8 538.8 624.4 545.9 489.4 491.5 486.5 -2.0
$100,000–249,999 1,000.2 700.2 1,491.4 1,505.4 1,369.5 1,358.0 1,311.6 13.4
$250,000–499,999 1,176.6 944.7 753.1 743.4 769.4 708.9 689.5 -6.1
$500,000–999,999 1,342.5 816.3 686.2 896.7 835.6 817.0 773.6 -1.1
$1M–2.9M 1,383.5 982.2 548.0 480.1 479.9 416.2 389.5 -16.9
$3M+ 1,567.0 968.7 664.4 661.5 567.2 516.0 475.3 -13.3
Total 18,367.3 13,537.5 13,857.0 14,195.9 13,913.4 13,768.2 13,749.0 0.3
Share (%)
$0–2,999 11.3 10.2 13.6 13.8 14.8 15.5 15.9
$3,000–5,999 28.6 31.0 30.8 30.0 29.8 29.6 29.6
$6,000–9,999 3.8 5.6 3.1 3.8 4.5 4.9 5.2
$10,000–24,999 10.5 10.6 12.1 12.7 13.0 12.8 12.9
$25,000–49,999 5.7 6.1 6.0 5.6 5.5 6.1 6.3
$50,000–99,999 4.9 4.0 4.5 3.8 3.5 3.6 3.5
$100,000–249,999 5.4 5.2 10.8 10.6 9.8 9.9 9.5
$250,000–499,999 6.4 7.0 5.4 5.2 5.5 5.1 5.0
$500,000–999,999 7.3 6.0 5.0 6.3 6.0 5.9 5.6
$1M–2.9M 7.5 7.3 4.0 3.4 3.4 3.0 2.8
$3M+ 8.5 7.2 4.8 4.7 4.1 3.7 3.5
Note: See Table 33 for key forecast assumptions.
Source: IDC, 2010

40 #222605 ©2010 IDC
T A B L E 2 2
E M E A S e r v e r S h i p m e n t s b y P r i c e B a n d , 2 0 0 8 – 2 0 1 4
2008 2009 2010 2011 2012 2013 20142009–2014 CAGR (%)
Shipments
$0–2,999 1,158,664 822,050 1,061,723 1,128,372 1,187,491 1,227,094 1,285,876 9.4
$3,000–5,999 1,248,642 988,749 968,836 1,008,459 1,042,514 1,068,280 1,112,028 2.4
$6,000–9,999 95,324 104,008 45,724 57,485 66,436 71,264 75,034 -6.3
$10,000–24,999 121,602 92,820 92,675 92,920 91,790 89,903 91,914 -0.2
$25,000–49,999 31,210 24,798 19,378 18,682 18,549 20,753 21,585 -2.7
$50,000–99,999 12,607 7,764 8,405 7,620 7,073 7,172 7,089 -1.8
$100,000–249,999 6,610 4,479 6,517 7,234 7,578 7,574 7,357 10.4
$250,000–499,999 3,351 2,686 2,068 2,085 2,588 2,536 2,463 -1.7
$500,000–999,999 1,758 980 905 1,141 1,225 1,240 1,194 4.0
$1M–2.9M 865 602 306 369 415 405 389 -8.4
$3M+ 128 97 19 11 27 28 28 -22.1
Total 2,680,761 2,049,033 2,206,556 2,324,377 2,425,686 2,496,250 2,604,955 4.9
Share (%)
$0–2,999 43.2 40.1 48.1 48.5 49.0 49.2 49.4
$3,000–5,999 46.6 48.3 43.9 43.4 43.0 42.8 42.7
$6,000–9,999 3.6 5.1 2.1 2.5 2.7 2.9 2.9
$10,000–24,999 4.5 4.5 4.2 4.0 3.8 3.6 3.5
$25,000–49,999 1.2 1.2 0.9 0.8 0.8 0.8 0.8
$50,000–99,999 0.5 0.4 0.4 0.3 0.3 0.3 0.3
$100,000–249,999 0.2 0.2 0.3 0.3 0.3 0.3 0.3
$250,000–499,999 0.1 0.1 0.1 0.1 0.1 0.1 0.1
$500,000–999,999 0.1 0.0 0.0 0.0 0.1 0.0 0.0
$1M–2.9M 0.0 0.0 0.0 0.0 0.0 0.0 0.0
$3M+ 0.0 0.0 0.0 0.0 0.0 0.0 0.0
Note: See Table 33 for key forecast assumptions.
Source: IDC, 2010

©2010 IDC #222605 41
T A B L E 2 3
A s i a / P a c i f i c S e r v e r C u s t o m e r R e v e n u e b y P r i c e B a n d , 2 0 0 8 – 2 0 1 4
2008 2009 2010 2011 2012 2013 20142009–2014 CAGR (%)
Revenue ($M)
$0–2,999 2,072.9 1,980.8 3,101.9 3,091.4 3,039.5 3,975.4 4,516.1 17.9
$3,000–5,999 2,196.4 1,757.1 1,231.1 1,334.4 1,621.3 958.2 603.2 -19.3
$6,000–9,999 1,797.0 1,522.2 1,653.6 2,108.8 2,376.4 3,172.5 3,449.9 17.8
$10,000–24,999 1,582.4 1,602.4 1,654.9 1,688.4 1,744.3 1,186.2 860.6 -11.7
$25,000–49,999 769.0 622.8 755.6 767.9 762.8 846.6 692.1 2.1
$50,000–99,999 925.8 1,029.3 937.7 1,022.8 1,052.3 1,039.0 1,651.2 9.9
$100,000–249,999 1,021.5 700.6 733.1 764.4 819.0 877.0 572.0 -4.0
$250,000–499,999 906.7 743.8 835.0 773.1 723.3 712.1 868.7 3.2
$500,000–999,999 1,086.6 1,044.2 749.6 803.8 921.0 1,026.9 852.7 -4.0
$1M–2.9M 1,171.7 795.5 1,003.0 1,040.1 1,106.8 1,062.8 945.5 3.5
$3M+ 993.4 1,211.7 811.9 682.6 521.5 478.0 488.2 -16.6
Total 14,523.4 13,010.4 13,467.4 14,077.7 14,688.1 15,334.7 15,500.2 3.6
Share (%)
$0–2,999 14.3 15.2 23.0 22.0 20.7 25.9 29.1
$3,000–5,999 15.1 13.5 9.1 9.5 11.0 6.2 3.9
$6,000–9,999 12.4 11.7 12.3 15.0 16.2 20.7 22.3
$10,000–24,999 10.9 12.3 12.3 12.0 11.9 7.7 5.6
$25,000–49,999 5.3 4.8 5.6 5.5 5.2 5.5 4.5
$50,000–99,999 6.4 7.9 7.0 7.3 7.2 6.8 10.7
$100,000–249,999 7.0 5.4 5.4 5.4 5.6 5.7 3.7
$250,000–499,999 6.2 5.7 6.2 5.5 4.9 4.6 5.6
$500,000–999,999 7.5 8.0 5.6 5.7 6.3 6.7 5.5
$1M–2.9M 8.1 6.1 7.4 7.4 7.5 6.9 6.1
$3M+ 6.8 9.3 6.0 4.8 3.6 3.1 3.1
Note: See Table 33 for key forecast assumptions.
Source: IDC, 2010

42 #222605 ©2010 IDC
T A B L E 2 4
A s i a / P a c i f i c S e r v e r S h i p m e n t s b y P r i c e B a n d , 2 0 0 8 – 2 0 1 4
2008 2009 2010 2011 2012 2013 20142009–2014 CAGR (%)
Shipments
$0–2,999 1,166,912 1,128,808 1,406,993 1,481,250 1,534,471 1,916,272 2,146,963 13.7
$3,000–5,999 520,226 414,315 292,359 353,359 463,133 258,491 145,823 -18.8
$6,000–9,999 227,585 195,412 211,535 270,931 313,257 400,637 431,444 17.2
$10,000–24,999 107,996 116,807 126,749 128,821 137,305 82,206 52,439 -14.8
$25,000–49,999 22,421 17,432 20,399 20,090 20,298 22,583 19,396 2.2
$50,000–99,999 13,010 13,376 12,411 13,277 14,061 13,724 23,559 12.0
$100,000–249,999 6,834 4,552 3,790 4,568 5,432 6,349 3,870 -3.2
$250,000–499,999 2,337 1,889 2,121 1,848 1,712 1,750 2,047 1.6
$500,000–999,999 1,541 1,388 1,133 1,140 1,313 1,395 1,217 -2.6
$1M–2.9M 663 441 564 542 597 606 542 4.2
$3M+ 147 179 134 124 94 87 86 -13.6
Total 2,069,672 1,894,599 2,078,188 2,275,951 2,491,673 2,704,100 2,827,386 8.3
Share (%)
$0–2,999 56.4 59.6 67.7 65.1 61.6 70.9 75.9
$3,000–5,999 25.1 21.9 14.1 15.5 18.6 9.6 5.2
$6,000–9,999 11.0 10.3 10.2 11.9 12.6 14.8 15.3
$10,000–24,999 5.2 6.2 6.1 5.7 5.5 3.0 1.9
$25,000–49,999 1.1 0.9 1.0 0.9 0.8 0.8 0.7
$50,000–99,999 0.6 0.7 0.6 0.6 0.6 0.5 0.8
$100,000–249,999 0.3 0.2 0.2 0.2 0.2 0.2 0.1
$250,000–499,999 0.1 0.1 0.1 0.1 0.1 0.1 0.1
$500,000–999,999 0.1 0.1 0.1 0.1 0.1 0.1 0.0
$1M–2.9M 0.0 0.0 0.0 0.0 0.0 0.0 0.0
$3M+ 0.0 0.0 0.0 0.0 0.0 0.0 0.0
Note: See Table 33 for key forecast assumptions.
Source: IDC, 2010

©2010 IDC #222605 43
T A B L E 2 5
W o r l d w i d e S e r v e r C u s t o m e r R e v e n u e b y O p e r a t i n g S y s t e m a n d I D C C l a s s , 2 0 0 8 – 2 0 1 4 ( $ M )
2008 2009 2010 2011 2012 2013 20142009–2014 CAGR (%)
Windows
Volume 21,056.4 17,908.9 19,914.2 20,474.3 21,462.5 22,031.2 22,494.9 4.7
Midrange enterprise 792.8 818.9 563.9 558.3 586.1 649.4 681.9 -3.6
High-end enterprise 229.5 102.8 94.2 84.7 77.5 90.6 114.0 2.1
Subtotal 22,078.7 18,830.6 20,572.3 21,117.3 22,126.2 22,771.2 23,290.7 4.3
Unix
Volume 3,363.3 2,415.7 2,396.1 2,633.2 2,644.5 2,721.8 2,745.4 2.6
Midrange enterprise 6,763.2 4,942.3 7,241.7 7,444.5 7,320.5 7,455.5 7,557.6 8.9
High-end enterprise 7,909.4 6,607.7 5,914.0 5,916.3 5,716.1 5,534.6 5,290.9 -4.3
Subtotal 18,035.8 13,965.7 15,551.9 15,994.0 15,681.1 15,711.9 15,593.9 2.2
Linux
Volume 6,817.9 5,775.7 6,309.6 6,601.1 7,165.8 7,717.9 7,977.2 6.7
Midrange enterprise 487.1 449.2 469.9 462.0 458.4 484.1 530.3 3.4
High-end enterprise 496.1 435.3 193.8 176.1 163.5 151.8 132.0 -21.2
Subtotal 7,801.1 6,660.2 6,973.4 7,239.2 7,787.7 8,353.9 8,639.5 5.3
Z/OS
Volume 1.0 0.1 – – – – 25.2 NA
Midrange enterprise 88.6 37.2 57.7 54.0 56.2 63.6 64.3 11.6
High-end enterprise 5,242.9 3,762.9 3,631.9 3,733.5 3,380.8 3,185.8 3,049.9 -4.1
Subtotal 5,332.5 3,800.2 3,689.7 3,787.4 3,436.9 3,249.4 3,139.4 -3.7
i5/OS
Volume 23.7 30.4 34.1 39.8 45.6 53.0 54.8 12.5
Midrange enterprise 376.4 339.6 375.7 344.8 297.3 241.7 188.6 -11.1
High-end enterprise 675.3 359.3 245.7 212.6 170.3 144.1 108.4 -21.3
Subtotal 1,075.5 729.3 655.5 597.2 513.2 438.8 351.8 -13.6

44 #222605 ©2010 IDC
T A B L E 2 5
W o r l d w i d e S e r v e r C u s t o m e r R e v e n u e b y O p e r a t i n g S y s t e m a n d I D C C l a s s , 2 0 0 8 – 2 0 1 4 ( $ M )
2008 2009 2010 2011 2012 2013 20142009–2014 CAGR (%)
NetWare
Volume 257.7 76.1 78.8 51.8 29.1 27.0 25.7 -19.5
Midrange enterprise 4.1 0.2 2.5 1.5 0.5 0.4 0.4 15.2
High-end enterprise – – 0.1 0.2 0.2 0.2 0.0
Subtotal 261.7 76.3 81.5 53.5 29.7 27.6 26.2 -19.2
Other
Volume 81.6 74.4 76.9 76.1 84.8 99.2 123.7 10.7
Midrange enterprise 157.4 102.3 208.8 171.1 181.7 192.6 220.3 16.6
High-end enterprise 2,164.2 1,926.3 1,517.6 1,479.1 1,430.9 1,309.6 1,216.7 -8.8
Other Subtotal 2,403.2 2,103.1 1,803.3 1,726.3 1,697.4 1,601.4 1,560.7 -5.8
Total 56,988.5 46,165.3 49,327.5 50,515.0 51,272.2 52,154.1 52,602.2 2.6
Notes:See Table 33 for key forecast assumptions.IDC reclassified the price bands into new size classes. See the Methodology section in the In This Study section of this document.
Source: IDC, 2010

©2010 IDC #222605 45
T A B L E 2 6
W o r l d w i d e S e r v e r S h i p m e n t s b y O p e r a t i n g S y s t e m a n d I D C C l a s s , 2 0 0 8 – 2 0 1 4
2008 2009 2010 2011 2012 2013 20142009–2014 CAGR (%)
Windows
Volume 5,742,067 4,813,608 5,286,512 5,635,198 6,003,233 6,275,375 6,518,424 6.3
Midrange enterprise 19,008 20,517 13,285 13,825 15,364 17,228 17,515 -3.1
High-end enterprise 380 163 116 115 129 164 228 7.0
Subtotal 5,761,454 4,834,288 5,299,913 5,649,139 6,018,727 6,292,767 6,536,168 6.2
Unix
Volume 388,101 234,449 247,877 254,289 249,901 257,970 262,173 2.3
Midrange enterprise 103,699 78,599 95,380 97,918 98,627 100,897 104,351 5.8
High-end enterprise 12,363 9,814 10,169 10,423 10,939 10,872 10,714 1.8
Subtotal 504,164 322,862 353,426 362,630 359,467 369,739 377,239 3.2
Linux
Volume 1,756,904 1,402,906 1,582,576 1,724,442 1,913,449 2,103,934 2,223,167 9.6
Midrange enterprise 9,419 9,162 10,744 10,844 10,161 10,456 10,826 3.4
High-end enterprise 510 517 233 247 254 264 254 -13.2
Subtotal 1,766,833 1,412,585 1,593,552 1,735,532 1,923,864 2,114,654 2,234,248 9.6
Z/OS
Volume 46 7 – – – – – NA
Midrange enterprise 629 223 202 181 180 194 206 -1.5
High-end enterprise 1,712 1,014 956 1,027 1,022 1,015 998 -0.3
Subtotal 2,387 1,244 1,157 1,208 1,203 1,209 1,204 -0.7
i5/OS
Volume 1,250 1,368 1,571 2,188 2,618 3,056 3,487 20.6
Midrange enterprise 4,849 4,230 5,087 4,646 3,851 3,075 2,245 -11.9

46 #222605 ©2010 IDC
T A B L E 2 6
W o r l d w i d e S e r v e r S h i p m e n t s b y O p e r a t i n g S y s t e m a n d I D C C l a s s , 2 0 0 8 – 2 0 1 4
2008 2009 2010 2011 2012 2013 20142009–2014 CAGR (%)
High-end enterprise 1,059 681 379 342 273 235 182 -23.2
Subtotal 7,158 6,279 7,037 7,176 6,741 6,366 5,914 -1.2
NetWare
Volume 74,434 24,553 26,501 17,707 11,126 10,925 10,989 -14.9
Midrange enterprise 90 6 33 21 9 8 8 7.6
Subtotal 74,524 24,559 26,534 17,728 11,135 10,933 10,997 -14.8
Other
Volume 13,911 13,097 7,916 5,935 2,248 2,720 3,368 -23.8
Midrange enterprise 2,294 1,502 1,967 1,635 1,568 1,702 1,961 5.5
High-end enterprise 1,698 1,287 1,039 1,022 1,003 954 875 -7.4
Subtotal 17,903 15,886 10,922 8,592 4,818 5,377 6,204 -17.1
Total 8,134,423 6,617,703 7,292,542 7,782,006 8,325,955 8,801,045 9,171,974 6.7
Notes:See Table 33 for key forecast assumptions.IDC reclassified the price bands into new size classes. See the Methodology section in the In This Study section of this document.
Source: IDC, 2010

©2010 IDC #222605 47
T A B L E 2 7
A m e r i c a s S e r v e r C u s t o m e r R e v e n u e b y O p e r a t i n g S y s t e m a n d I D C C l a s s , 2 0 0 8 – 2 0 1 4 ( $ M )
2008 2009 2010 2011 2012 2013 20142009–2014 CAGR (%)
Windows
Volume 9,335.1 8,067.3 9,176.6 9,190.6 9,843.9 10,140.6 10,481.3 5.4
Midrange enterprise 251.2 356.8 233.8 249.6 278.7 295.9 300.0 -3.4
High-end enterprise 100.8 52.4 33.3 36.5 46.3 59.0 83.3 9.7
Subtotal 9,687.1 8,476.5 9,443.6 9,476.7 10,168.9 10,495.4 10,864.6 5.1
Unix
Volume 1,520.7 1,121.1 871.7 986.3 1,049.0 1,114.2 1,161.1 0.7
Midrange enterprise 2,348.2 1,608.2 2,825.1 2,945.5 2,941.3 2,903.8 2,887.0 12.4
High-end enterprise 3,351.5 3,088.0 3,070.5 2,988.7 2,758.0 2,559.2 2,375.9 -5.1
Subtotal 7,220.4 5,817.2 6,767.4 6,920.5 6,748.3 6,577.2 6,424.0 2.0
Linux
Volume 2,988.2 2,391.8 2,798.3 2,842.2 3,059.7 3,402.2 3,531.7 8.1
Midrange enterprise 167.3 182.3 170.0 198.0 229.8 268.3 314.2 11.5
High-end enterprise 230.7 180.5 134.8 118.8 107.4 91.7 74.8 -16.2
Subtotal 3,386.3 2,754.6 3,103.1 3,159.0 3,396.8 3,762.3 3,920.6 7.3
z/OS
Volume 0.8 – – – – – – NA
Midrange enterprise 42.5 0.6 1.1 2.4 3.6 5.7 7.4 63.1
High-end enterprise 2,743.4 1,895.0 1,873.2 1,976.2 1,746.9 1,665.2 1,659.3 -2.6
Subtotal 2,786.7 1,895.6 1,874.4 1,978.6 1,750.5 1,670.9 1,666.7 -2.5
i5/OS
Volume 9.2 19.7 29.5 36.4 42.5 50.0 51.9 21.4
Midrange enterprise 137.1 113.1 222.0 189.8 146.0 99.3 49.1 -15.4
High-end enterprise 268.3 123.7 125.1 108.3 85.2 62.8 39.3 -20.5
Subtotal 414.5 256.5 376.5 334.4 273.8 212.1 140.3 -11.4

48 #222605 ©2010 IDC
T A B L E 2 7
A m e r i c a s S e r v e r C u s t o m e r R e v e n u e b y O p e r a t i n g S y s t e m a n d I D C C l a s s , 2 0 0 8 – 2 0 1 4 ( $ M )
2008 2009 2010 2011 2012 2013 20142009–2014 CAGR (%)
NetWare
Volume 110.7 20.9 5.4 0.5 0.5 0.5 0.5 -52.8
Midrange enterprise 2.3 0.0 0.0 0.0 0.0 0.0 0.0 -3.8
Subtotal 113.0 20.9 5.4 0.5 0.5 0.5 0.5 -52.4
Other
Volume 51.1 35.5 34.5 26.0 15.5 24.7 39.6 2.2
Midrange enterprise 44.3 12.8 89.0 53.0 45.6 67.0 100.2 50.9
High-end enterprise 394.7 347.7 309.0 292.5 270.6 240.8 196.5 -10.8
Subtotal 490.0 396.0 432.5 371.5 331.7 332.5 336.3 -3.2
Total 24,097.9 19,617.4 22,003.0 22,241.4 22,670.7 23,051.2 23,353.0 3.5
Notes:See Table 33 for key forecast assumptions.IDC reclassified the price bands into new size classes. See the Methodology section in the In This Study section of this document.
Source: IDC, 2010

©2010 IDC #222605 49
T A B L E 2 8
A m e r i c a s S e r v e r S h i p m e n t s b y O p e r a t i n g S y s t e m a n d I D C C l a s s , 2 0 0 8 – 2 0 1 4
2008 2009 2010 2011 2012 2013 20142009–2014 CAGR (%)
Windows
Volume 2,337,224 1,927,836 2,179,363 2,296,082 2,462,591 2,554,713 2,650,312 6.6
Midrange enterprise 4,755 8,374 5,782 6,089 6,523 6,592 5,969 -6.5
High-end enterprise 166 85 52 64 91 123 186 16.9
Subtotal 2,342,146 1,936,295 2,185,197 2,302,235 2,469,205 2,561,428 2,656,466 6.5
Unix
Volume 176,925 109,398 97,373 112,256 122,471 131,839 138,847 4.9
Midrange enterprise 36,719 27,455 41,217 42,394 41,133 39,676 39,381 7.5
High-end enterprise 5,112 4,007 4,605 4,836 4,611 4,452 4,300 1.4
Subtotal 218,757 140,861 143,195 159,486 168,215 175,966 182,529 5.3
Linux
Volume 778,365 576,405 659,974 703,326 757,608 848,861 885,399 9.0
Midrange enterprise 3,185 4,354 4,531 5,531 6,288 6,857 7,136 10.4
High-end enterprise 107 106 98 104 110 100 95 -2.2
Subtotal 781,657 580,865 664,603 708,961 764,006 855,819 892,630 9.0
z/OS
Volume 39 – – – – – – NA
Midrange enterprise 335 – 6 10 15 21 27 NA
High-end enterprise 702 338 353 406 381 389 397 3.3
Subtotal 1,076 338 359 416 396 410 425 4.7
i5/OS
Volume 512 893 1,365 1,951 2,400 2,835 3,269 29.6
Midrange enterprise 1,771 1,541 3,382 3,026 2,361 1,652 852 -11.2
High-end enterprise 400 287 203 180 137 98 65 -25.7
Subtotal 2,683 2,721 4,950 5,158 4,897 4,585 4,185 9.0

50 #222605 ©2010 IDC
T A B L E 2 8
A m e r i c a s S e r v e r S h i p m e n t s b y O p e r a t i n g S y s t e m a n d I D C C l a s s , 2 0 0 8 – 2 0 1 4
2008 2009 2010 2011 2012 2013 20142009–2014 CAGR (%)
NetWare
Volume 26,481 6,422 2,154 175 185 162 171 -51.6
Midrange enterprise 33 – – – – – – NA
Subtotal 26,514 6,422 2,154 175 185 162 171 -51.6
Other
Volume 10,216 6,063 6,129 4,370 922 1,423 2,090 -19.2
Midrange enterprise 497 114 879 548 449 607 892 50.9
High-end enterprise 445 391 332 329 321 295 244 -9.0
Subtotal 11,158 6,568 7,340 5,247 1,692 2,325 3,226 -13.3
Total 3,383,990 2,674,071 3,007,798 3,181,678 3,408,596 3,600,695 3,739,633 6.9
Notes:See Table 33 for key forecast assumptions.IDC reclassified the price bands into new size classes. See the Methodology section in the In This Study section of this document.
Source: IDC, 2010

©2010 IDC #222605 51
T A B L E 2 9
E M E A S e r v e r C u s t o m e r R e v e n u e b y O p e r a t i n g S y s t e m a n d I D C C l a s s , 2 0 0 8 – 2 0 1 4 ( $ M )
2008 2009 2010 2011 2012 2013 20142009–2014 CAGR (%)
Windows
Volume 6,688.8 5,270.4 5,631.1 5,833.5 5,878.5 5,872.7 5,973.8 2.5
Midrange enterprise 312.0 279.2 234.5 212.1 223.2 267.1 284.2 0.4
High-end enterprise 91.6 37.8 57.8 44.4 25.6 24.9 23.6 -9.0
Subtotal 7,092.4 5,587.3 5,923.4 6,090.0 6,127.3 6,164.8 6,281.6 2.4
Unix
Volume 862.7 558.5 781.3 855.7 832.3 850.7 876.9 9.4
Midrange enterprise 2,223.0 1,449.7 2,351.3 2,306.4 2,091.6 2,127.9 2,101.3 7.7
High-end enterprise 2,717.1 1,899.3 1,263.6 1,352.1 1,352.0 1,246.6 1,192.6 -8.9
Subtotal 5,802.9 3,907.5 4,396.3 4,514.2 4,275.9 4,225.3 4,170.8 1.3
Linux
Volume 2,270.8 1,865.2 1,728.7 1,784.5 1,834.9 1,804.8 1,794.4 -0.8
Midrange enterprise 211.8 152.0 219.4 183.8 150.9 140.5 138.8 -1.8
High-end enterprise 174.8 180.3 21.9 22.6 23.1 26.7 25.9 -32.1
Subtotal 2,657.4 2,197.5 1,969.9 1,990.9 2,008.9 1,972.0 1,959.2 -2.3
z/OS
Midrange enterprise 45.0 35.2 54.2 48.7 45.4 49.9 48.8 6.7
High-end enterprise 1,684.3 1,031.6 948.8 973.9 856.7 806.5 752.2 -6.1
Subtotal 1,729.5 1,066.9 1,003.0 1,022.6 902.1 856.5 801.0 -5.6
i5/OS
Volume 10.8 10.2 2.0 2.6 2.3 2.2 2.3 -25.8
Midrange enterprise 123.1 111.4 42.8 42.1 39.0 35.3 34.9 -20.7
High-end enterprise 241.1 160.7 47.7 39.7 25.0 23.1 23.0 -32.2
Subtotal 374.9 282.3 92.6 84.3 66.3 60.6 60.2 -26.6

52 #222605 ©2010 IDC
T A B L E 2 9
E M E A S e r v e r C u s t o m e r R e v e n u e b y O p e r a t i n g S y s t e m a n d I D C C l a s s , 2 0 0 8 – 2 0 1 4 ( $ M )
2008 2009 2010 2011 2012 2013 20142009–2014 CAGR (%)
NetWare
Volume 81.8 29.0 72.5 50.3 27.7 25.6 24.4 -3.4
Midrange enterprise 0.5 – 2.5 1.5 0.4 0.4 0.4 NA
Subtotal 82.3 29.0 75.0 51.8 28.1 26.0 24.8 -3.1
Other
Volume 22.0 29.1 36.7 44.7 64.2 69.5 79.2 22.1
Midrange enterprise 45.1 35.6 48.3 48.2 71.0 63.4 61.8 11.7
High-end enterprise 560.8 402.3 311.9 349.2 369.7 330.2 310.5 -5.1
Subtotal 627.8 467.0 396.9 442.1 504.8 463.1 451.5 -0.7
Total 18,367.3 13,537.5 13,857.0 14,195.9 13,913.4 13,768.2 13,749.0 0.3
Notes:See Table 33 for key forecast assumptions.IDC reclassified the price bands into new size classes. See the Methodology section in the In This Study section of this document.
Source: IDC, 2010

©2010 IDC #222605 53
T A B L E 3 0
E M E A S e r v e r S h i p m e n t s b y O p e r a t i n g S y s t e m a n d I D C C l a s s , 2 0 0 8 – 2 0 1 4
2008 2009 2010 2011 2012 2013 20142009–2014 CAGR (%)
Windows
Volume 1,921,367 1,515,570 1,612,436 1,723,799 1,814,787 1,874,615 1,965,848 5.3
Midrange enterprise 8,567 7,524 4,974 5,311 6,589 8,278 8,814 3.2
High-end enterprise 142 58 58 42 25 23 24 -16.0
Subtotal 1,930,076 1,523,152 1,617,468 1,729,152 1,821,400 1,882,916 1,974,687 5.3
Unix
Volume 110,853 60,602 82,952 72,274 57,753 56,169 55,548 -1.7
Midrange enterprise 34,740 23,952 23,017 22,873 22,734 23,616 23,512 -0.4
High-end enterprise 4,065 3,049 2,567 2,818 3,493 3,432 3,309 1.6
Subtotal 149,658 87,603 108,535 97,966 83,980 83,217 82,369 -1.2
Linux
Volume 561,753 414,767 447,937 472,521 503,878 514,123 531,772 5.1
Midrange enterprise 4,415 3,295 5,323 4,397 2,960 2,711 2,800 -3.2
High-end enterprise 228 278 49 62 64 83 82 -21.7
Subtotal 566,396 418,340 453,308 476,980 506,902 516,917 534,654 5.0
z/OS
Volume 7 7 – – – – – NA
Midrange enterprise 293 220 190 158 135 140 138 -9.0
High-end enterprise 738 425 387 403 415 411 401 -1.2
Subtotal 1,038 652 577 561 550 551 538 -3.8
i5/OS
Volume 542 449 163 194 176 180 182 -16.6
Midrange enterprise 1,789 1,494 607 561 484 445 445 -21.5
High-end enterprise 481 297 81 74 51 49 51 -29.7
Subtotal 2,812 2,240 850 829 712 675 677 -21.3

54 #222605 ©2010 IDC
T A B L E 3 0
E M E A S e r v e r S h i p m e n t s b y O p e r a t i n g S y s t e m a n d I D C C l a s s , 2 0 0 8 – 2 0 1 4
2008 2009 2010 2011 2012 2013 20142009–2014 CAGR (%)
NetWare
Volume 26,687 9,848 24,018 17,211 10,625 10,452 10,509 1.3
Midrange enterprise 15 – 33 21 9 8 8 NA
Subtotal 26,702 9,848 24,051 17,232 10,634 10,460 10,517 1.3
Other
Volume 3,023 6,384 1,452 1,237 1,012 1,002 992 -31.1
Midrange enterprise 608 556 157 214 290 301 314 -10.8
High-end enterprise 448 258 157 206 207 210 207 -4.3
Subtotal 4,079 7,198 1,766 1,657 1,508 1,513 1,513 -26.8
Total 2,680,761 2,049,033 2,206,556 2,324,377 2,425,686 2,496,250 2,604,955 4.9
Notes:See Table 33 for key forecast assumptions.IDC reclassified the price bands into new size classes. See the Methodology in the In This Study section of this document.
Source: IDC, 2010
T A B L E 3 1
A s i a / P a c i f i c S e r v e r C u s t o m e r R e v e n u e b y O p e r a t i n g S y s t e m a n d I D C C l a s s , 2 0 0 8 – 2 0 1 4 ( $ M )
2008 2009 2010 2011 2012 2013 20142009–2014 CAGR (%)
Windows
Volume 5,032.5 4,571.3 5,106.5 5,450.3 5,740.1 6,017.9 6,039.7 5.7
Midrange enterprise 229.6 182.9 95.6 96.6 84.3 86.4 97.7 -11.8
High-end enterprise 37.1 12.6 3.1 3.8 5.6 6.7 7.1 -10.9
Subtotal 5,299.2 4,766.8 5,205.2 5,550.7 5,830.0 6,110.9 6,144.6 5.2
Unix
Volume 979.9 736.1 743.1 791.2 763.3 756.8 707.5 -0.8
Midrange enterprise 2,191.9 1,884.4 2,065.3 2,192.6 2,287.6 2,423.7 2,569.3 6.4
High-end enterprise 1,840.8 1,620.5 1,579.8 1,575.5 1,606.2 1,728.8 1,722.4 1.2
Subtotal 5,012.6 4,241.0 4,388.2 4,559.4 4,657.0 4,909.4 4,999.2 3.3

©2010 IDC #222605 55
T A B L E 3 1
A s i a / P a c i f i c S e r v e r C u s t o m e r R e v e n u e b y O p e r a t i n g S y s t e m a n d I D C C l a s s , 2 0 0 8 – 2 0 1 4 ( $ M )
2008 2009 2010 2011 2012 2013 20142009–2014 CAGR (%)
Linux
Volume 1,558.9 1,518.7 1,782.7 1,974.4 2,271.3 2,510.9 2,651.1 11.8
Midrange enterprise 107.9 114.8 80.6 80.2 77.7 75.3 77.3 -7.6
High-end enterprise 90.6 74.6 37.1 34.7 33.1 33.4 31.3 -16.0
Subtotal 1,757.5 1,708.0 1,900.3 2,089.3 2,382.0 2,619.6 2,759.6 10.1
z/OS
Volume – – – – – – 25.2 NA
Midrange enterprise 1.2 1.3 2.4 2.8 7.2 7.9 8.1 43.6
High-end enterprise 815.2 836.3 809.9 783.4 777.2 714.1 638.4 -5.3
Subtotal 816.3 837.6 812.3 786.3 784.4 722.0 671.7 -4.3
i5/OS
Volume 3.8 0.6 2.6 0.8 0.8 0.7 0.6 1.8
Midrange enterprise 116.2 115.1 110.9 113.0 112.3 107.1 104.6 -1.9
High-end enterprise 166.0 74.9 72.9 64.7 60.0 58.3 46.1 -9.3
Subtotal 286.0 190.5 186.4 178.5 173.0 166.1 151.3 -4.5
NetWare
Volume 65.1 26.2 1.0 0.9 0.9 0.9 0.9 -49.3
Midrange enterprise 1.3 0.2 – – – – – NA
Subtotal 66.4 26.4 1.0 0.9 0.9 0.9 0.9 -49.4
Other
Volume 8.5 9.7 5.7 5.4 5.1 5.0 4.8 -13.1
Midrange enterprise 68.1 54.0 71.5 69.9 65.1 62.2 58.3 1.6
High-end enterprise 1,208.7 1,176.4 896.7 837.4 790.6 738.6 709.8 -9.6
Subtotal 1,285.3 1,240.1 973.9 912.7 860.8 805.8 772.9 -9.0
Total 14,523.4 13,010.4 13,467.4 14,077.7 14,688.1 15,334.7 15,500.2 3.6
Notes:See Table 33 for key forecast assumptions.IDC reclassified the price bands into new size classes. See the Methodology in the In This Study section of this document.
Source: IDC, 2010

56 #222605 ©2010 IDC
T A B L E 3 2
A s i a / P a c i f i c S e r v e r S h i p m e n t s b y O p e r a t i n g S y s t e m a n d I D C C l a s s , 2 0 0 8 – 2 0 1 4
2008 2009 2010 2011 2012 2013 20142009–2014 CAGR (%)
Windows
Volume 1,483,475 1,370,201 1,494,713 1,615,317 1,725,855 1,846,047 1,902,264 6.8
Midrange enterprise 5,686 4,619 2,529 2,426 2,253 2,358 2,732 -10.0
High-end enterprise 72 20 7 9 14 18 18 -1.6
Subtotal 1,489,233 1,374,841 1,497,248 1,617,752 1,728,122 1,848,423 1,905,015 6.7
Unix
Volume 100,323 64,448 67,552 69,758 69,677 69,962 67,778 1.0
Midrange enterprise 32,240 27,192 31,146 32,651 34,760 37,605 41,457 8.8
High-end enterprise 3,186 2,758 2,998 2,769 2,835 2,989 3,105 2.4
Subtotal 135,749 94,398 101,695 105,179 107,272 110,556 112,340 3.5
Linux
Volume 416,786 411,734 474,666 548,595 651,963 740,950 805,996 14.4
Midrange enterprise 1,818 1,513 890 915 913 888 890 -10.1
High-end enterprise 175 133 86 82 80 81 78 -10.2
Subtotal 418,780 413,380 475,641 549,592 652,956 741,918 806,964 14.3
Z/OS
Midrange enterprise 1 3 6 12 30 33 41 69.0
High-end enterprise 272 251 215 218 226 214 200 -4.4
Subtotal 273 254 221 230 256 247 241 -1.0
i5/OS
Volume 196 26 43 43 42 42 37 7.0
Midrange enterprise 1,289 1,195 1,098 1,058 1,006 977 949 -4.5
High-end enterprise 178 97 95 88 85 87 66 -7.3
i5/OS Total 1,663 1,318 1,236 1,189 1,133 1,106 1,052 -4.4
NetWare
Volume 21,266 8,283 330 322 316 311 309 -48.2
Midrange enterprise 42 6 – – – – – NA
Subtotal 21,308 8,289 330 322 316 311 309 -48.2

©2010 IDC #222605 57
T A B L E 3 2
A s i a / P a c i f i c S e r v e r S h i p m e n t s b y O p e r a t i n g S y s t e m a n d I D C C l a s s , 2 0 0 8 – 2 0 1 4
2008 2009 2010 2011 2012 2013 20142009–2014 CAGR (%)
Other
Volume 672 650 334 327 315 295 286 -15.1
Midrange enterprise 1,189 832 932 873 829 795 755 -1.9
High-end enterprise 805 638 551 487 475 449 424 -7.9
Subtotal 2,666 2,120 1,816 1,688 1,618 1,539 1,465 -7.1
Total 2,069,672 1,894,599 2,078,188 2,275,951 2,491,673 2,704,100 2,827,386 8.3
Notes:See Table 33 for key forecast assumptions.IDC reclassified the price bands into new size classes. See the Methodology section in the In This Study section of this document.
Source: IDC, 2010
Figure 1 presents the worldwide server market customer revenue by CPU type. Figure 2 shows the same revenue forecast by operating environment.
F I G U R E 1
W o r l d w i d e S e r v e r C u s t o m e r R e v e n u e b y C h i p T e c h n o l o g y , 2 0 0 2 – 2 0 1 4
Source: IDC, 2010
010203040506070
2002 2003 2004 2005 2006 2007 2008 2009 2010 2011 2012 2013 2014
($B
)
CISCx86EPICRISC

58 #222605 ©2010 IDC
F I G U R E 2
W o r l d w i d e S e r v e r C u s t o m e r R e v e n u e b y O p e r a t i n g S y s t e m , 2 0 0 2 – 2 0 1 4
Source: IDC, 2010
Table 33 presents the key forecast assumptions underlying the forecast. The assumptions information is divided into regional components including the United States, Western Europe, Japan, Asia/Pacific, Canada, the rest of the world (ROW), and worldwide. The ROW assumptions include information from Central and Eastern Europe (CEE), the Middle East and Africa (MEA), and Latin America.
0
1020
3040
5060
70
2002 2003 2004 2005 2006 2007 2008 2009 2010 2011 2012 2013 2014
($B
)
NetWareWindowsUnixLinuxi5/OSz/OSOther

©2010 IDC #222605 59
T A B L E 3 3
K e y F o r e c a s t A s s u m p t i o n s f o r t h e W o r l d w i d e , U . S . , W e s t e r n E u r o p e , J a p a n , A s i a / P a c i f i c , C a n a d a , a n d R e s t o f W o r l d S e r v e r M a r k e t s , 2 0 1 0 – 2 0 1 4
Country or Region/Market Force IDC Assumption Impact
Accelerator/ Inhibitor/ Neutral
Certainty of Assumption
Worldwide and United States
Macroeconomics and political assumptions
Economy Worldwide economic growth will be rebound to 3% in 2010 and at least that in 2011. Through the last half of 2009 and first quarter of 2010, forecasts for 2010 and 2011 have remained stable or improved slightly. IDC will continue to take a mild downside view of GDP forecasts from Consensus Economics. Assumptions for 2010 are the United States 3.0%, Western Europe 1.1%, and Japan 1.8%.
Moderate. A down economy affects business and consumer confidence, availability of credit and private investment, and internal funding. A rising economy does the opposite.
Fiscal stimulus packages
The economic stimulus plans enacted globally seem to have stemmed the panic and economic freefall of 4Q08 and 1Q09, but now, in 2010, spending is beginning to be felt in major economies. China's plan was especially impressive, essentially swapping domestic and government demand for exports. Globally, however, there is little immediate impact on employment.
Moderate. The stimulus packages and bailouts seemed to have averted disaster, but there is no obvious major impact to most country economies beyond improved confidence. We believe the GDP forecasts have accounted for these government actions.
Crisis duration/recovery
IDC is assuming that the economic turnaround is well under way in early 2010 and that there will not be a double-dip recession.
Moderate. The long duration of the global recession will create pent-up demand for IT products and services, but its severity will create an air of caution on the part of buyers.

60 #222605 ©2010 IDC
T A B L E 3 3
K e y F o r e c a s t A s s u m p t i o n s f o r t h e W o r l d w i d e , U . S . , W e s t e r n E u r o p e , J a p a n , A s i a / P a c i f i c , C a n a d a , a n d R e s t o f W o r l d S e r v e r M a r k e t s , 2 0 1 0 – 2 0 1 4
Country or Region/Market Force IDC Assumption Impact
Accelerator/ Inhibitor/ Neutral
Certainty of Assumption
Oil prices IDC assumes oil prices will slowly rise (perhaps back to $100 per barrel through 2010 and 2011) as a result of rising demand as the global economy picks up.
Moderate. While lower oil prices help spur lagging consumer spending, higher prices signal that demand is rising.
Policy IDC assumes that new regulation of financial markets, regardless of whether it solves the banking situation or not, will pass in 2010 but will not require wholesale revamping of IT systems as with Basel II or Sarbanes-Oxley.
Moderate. Compliance spending seems to be funding itself through better-run business operations and, in fact, is spurring other IT initiatives.
Profits Consensus Economics'estimates of U.S. profit growth will hit 16% in 2010 and 8% in 2011.
High. A traditional two-quarter lag from positive profit growth to investment in ICT is expected.
Iraq/Afghanistan/other conflicts
The conflict in both countries will continue to be messy throughout 2010, but the chance of economic disruptions is minimal. For now, IDC assumes that there will be no activities or initiatives sufficient to affect ICT market forecasts.
Low. There is little reason for economic uncertainty over Iraq to impact ICT spending.
U.S. fiscal policy, deficits, and trade imbalance
These areas affect the long-term economic outlook for the world; however, their short-term impact is muted. IDC assumes these areas will not affect short-term ICT forecasts.
Low. These areas affect the long-term economic outlook for the world; however, their short-term impact is muted. IDC assumes these areas will not affect short-term ICT forecasts.
U.S. fiscal policy, deficits, and trade imbalance
These areas affect the long-term economic outlook for the world; however, their short-term impact is muted. IDC assumes these areas will not affect short-term ICT forecasts.
High. A crash of the dollar or the use of economic power to drive U.S. political decisions could affect the world economy.

©2010 IDC #222605 61
T A B L E 3 3
K e y F o r e c a s t A s s u m p t i o n s f o r t h e W o r l d w i d e , U . S . , W e s t e r n E u r o p e , J a p a n , A s i a / P a c i f i c , C a n a d a , a n d R e s t o f W o r l d S e r v e r M a r k e t s , 2 0 1 0 – 2 0 1 4
Country or Region/Market Force IDC Assumption Impact
Accelerator/ Inhibitor/ Neutral
Certainty of Assumption
Inflation Inflation driven by higher oil and commodity prices has been taken off the table. At the same time, worries about deflation have abated.
Moderate. Low inflation keeps interest rates low and leads to more capital spending, including spending on ICT.
U.S. housing demand
IDC assumes that the U.S. housing market should turn around by 2010 as credit begins to flow to the market. U.S. housing prices may already have hit bottom, although the tax credit for new home buyers may have skewed demand. we see little change on government impact on ICT spending.
Moderate. Consumer spending is over two-thirds of the U.S. economy and a major driver of exports in other countries. Stable or rising home prices increase the "wealth effect" felt by consumers which, in turn, affects their willingness to spend.
Unemployment/job creation
Unemployment worldwide will creep up through 2010 but top out under 10% (last seen in the 1982 recession). According to EIU forecasts, North America unemployment should crest early in 2010 under 10%, and Western Europe should peak in 2010 at 10%. But most regions will see very slow declines in the rate over the next several years.
Moderate. More employment drives more need for ICT infrastructure and is a lagging indicator of economic recovery, job creation should be accompanied by a willingness to invest in other areas.
Exchange rates The financial crisis has caused gyrations in dollar exchange rates, which went up and down in 2009. For the moment, the dollar seems to be holding its own, although over the long term it is expected to drop. For the purposes of IT forecasts, IDC assumes no major impact on overall demand. There will be a difference in demand growth, however, and "as reported" vendor revenue.
Low. A stable, or even steadily falling, dollar makes it easier for vendors to manage supply lines and stabilizes the prices of imports and exports.

62 #222605 ©2010 IDC
T A B L E 3 3
K e y F o r e c a s t A s s u m p t i o n s f o r t h e W o r l d w i d e , U . S . , W e s t e r n E u r o p e , J a p a n , A s i a / P a c i f i c , C a n a d a , a n d R e s t o f W o r l d S e r v e r M a r k e t s , 2 0 1 0 – 2 0 1 4
Country or Region/Market Force IDC Assumption Impact
Accelerator/ Inhibitor/ Neutral
Certainty of Assumption
Wild cards We are assuming that there will be wild-card events, but we are predicting no single one. As one scientist has put it, there is a high probability of a low-probability event taking place.
Low. General uncertainty and political malaise could lead to a fall in business and consumer confidence, which could affect ICT spending.
H1N1 flu Although worldwide the spread of H1N1 is being called a pandemic, because the flu is, for most populations, short lived and not terribly virulent, IDC assumes the impact on the economic recovery will be minimal and the impact on ICT spending even more so.
Low. Uncertainty and knee-jerk reactions can slow travel and leisure at a time when many economies depend on it. Shrinking private consumption and business interruption (as in Mexico City) will have a bigger impact than lost tourism revenue.
Technology/service developments
Cloud services Cloud services is IDC's name for what we believe will become a new paradigm of computing over the next several decades — the logical evolution of what we have called "dynamic IT" for years. It entails shared access to virtualized resources over the Internet. A detailed definition and research about cloud services can be found at idc.com. IDC predicts that cloud services (public cloud) will increase 35% in 2010 to nearly $25 billion, or about 1.6% of IT spending. That percentage should increase to 2.6% by 2013.
High. The key advantage to cloud services should be the ability of IT organizations to shift IT resources from maintenance to new initiatives. This, in turn, could lead to new business revenue and competitiveness.

©2010 IDC #222605 63
T A B L E 3 3
K e y F o r e c a s t A s s u m p t i o n s f o r t h e W o r l d w i d e , U . S . , W e s t e r n E u r o p e , J a p a n , A s i a / P a c i f i c , C a n a d a , a n d R e s t o f W o r l d S e r v e r M a r k e t s , 2 0 1 0 – 2 0 1 4
Country or Region/Market Force IDC Assumption Impact
Accelerator/ Inhibitor/ Neutral
Certainty of Assumption
Convergence Convergence is a complex phenomenon working at many levels — convergence of the telephone network and the Internet; communications and IT technologies; consumer and enterprise technologies; and even storage, routing, and processing in the datacenter. Of these, perhaps the most overarching is the convergence of voice, video, and data communications. IDC assumes that this convergence is a permanent phenomenon and that it will pick up pace as the decade wears on. One measure is that IDC expects 1.9 billion users on the Internet and 3 billion users of the phone network by 2012. The overlap will be significant.
High. Convergence will drive new competitive dynamics, offer new applications and functions to customers, and strain the legal and regulatory systems. It will also drive increased ICT spending.
Software industry transformation
The software industry is going through a major transformation, from basic architecture (service-oriented architecture [SOA]) and the way software is written (composite applications) to the way software is delivered (software as a service) and even funded (advertising based). IDC assumes that this transformation will take a decade but that it will, when done, allow for much faster and more dynamic delivery of software functionality.
Moderate. The new software creation and delivery models should allow for a quantum increase in the ability to deliver and integrate new software functionality to ICT systems. This should increase overall spending, even as it lowers costs.

64 #222605 ©2010 IDC
T A B L E 3 3
K e y F o r e c a s t A s s u m p t i o n s f o r t h e W o r l d w i d e , U . S . , W e s t e r n E u r o p e , J a p a n , A s i a / P a c i f i c , C a n a d a , a n d R e s t o f W o r l d S e r v e r M a r k e t s , 2 0 1 0 – 2 0 1 4
Country or Region/Market Force IDC Assumption Impact
Accelerator/ Inhibitor/ Neutral
Certainty of Assumption
The digital marketplace
The impact of the new digital marketplace can be seen in software as a service, integration of Internet and enterprise search and other functionality, the concept of "cloud computing," and competition for ad revenue among Microsoft, Google, and Disney. The digital marketplace will affect content delivery, commerce, datacenter architectures, advertising, marketing, telecommunications, and social interactions. It also may accelerate the consumption of ICT in emerging geographies, where more and more online populations reside. The economic downturn will accelerate the growth of the digital marketplace.
Low. Look for faster development of the software-as-a-service model, more development of composite applications, and more directly competitive products (e.g., desktop search). Also look for rapid growth of Internet advertising revenue in emerging geographies.
Service industry transformation
This is a long, slow process involving the rise of offshore IT services, the increased integration of IT services inside business services, and the advent of new service delivery models. Most firms have developed a multishoring capability and blended pricing model and are now working on ways to standardize on technologies and methodologies, deliver services online or in new form factors, invest in datacenters, and expand into business services. Despite the race to automate service creation and delivery, there is a looming talent shortage. The economic crisis will be good for outsourcing markets but bad for project-based services.
Moderate. These trends portend new competitive dynamics in the industry —software and online services competing with traditional IT services — as well as new thresholds for delivery. Online delivery models and operational standardization, from new technologies to remote infrastructure services, will allow faster and more efficient translation of service labor to client deliverable.

©2010 IDC #222605 65
T A B L E 3 3
K e y F o r e c a s t A s s u m p t i o n s f o r t h e W o r l d w i d e , U . S . , W e s t e r n E u r o p e , J a p a n , A s i a / P a c i f i c , C a n a d a , a n d R e s t o f W o r l d S e r v e r M a r k e t s , 2 0 1 0 – 2 0 1 4
Country or Region/Market Force IDC Assumption Impact
Accelerator/ Inhibitor/ Neutral
Certainty of Assumption
The changing IT domain
The IT domain that was once the care and feeding of mainframes has evolved over the years to include the management of enterprise applications, deployment of software and applications to the workforce, and desktop automation. Now it is evolving again to take on responsibility for the phones, building automation, sensors and RFID, and sometimes even physical security as proprietary systems migrate to TCP/IP networks. Other new applications, such as Web 2.0 and real-time business analytics, are driving IT-based applications to the point of customer or employee contact and becoming mission critical along the way. This could increase the need for IT to be so close to the business units that it becomes part of them rather than merely a service organization.
Moderate. This migration will generate new staffing and skill set demands on IT organizations, which will create challenges but also create more ultimate demand for ICT.

66 #222605 ©2010 IDC
T A B L E 3 3
K e y F o r e c a s t A s s u m p t i o n s f o r t h e W o r l d w i d e , U . S . , W e s t e r n E u r o p e , J a p a n , A s i a / P a c i f i c , C a n a d a , a n d R e s t o f W o r l d S e r v e r M a r k e t s , 2 0 1 0 – 2 0 1 4
Country or Region/Market Force IDC Assumption Impact
Accelerator/ Inhibitor/ Neutral
Certainty of Assumption
Embedded computing, Internet of things
This term refers to the proliferation of client devices and end-user or end-use devices at the network edge. Of 7 billion things connected to the Internet in 2010, 5 billion will not be computers. These other devices range from Internet-enabled cell phones and networked entertainment and gaming devices to automobiles, building automation systems, smart meters and thermostats, medical electronics, and industrial controllers. This doesn't even count RFID tags and sensors. IDC assumes that communicating client devices will proliferate at 5–10 times the rate of PCs installed. Devices will both converge (cell phones with more functionality) and diverge (single-use devices, such as RFID readers).
Moderate. The addition of billions of devices to the network edge will drive the need for more enterprise systems to deploy, manage, and make use of them. It will also shift the prevailing traffic from the center of the network outward to edge inward, which will affect computing and communications architectures.
Green IT This term refers to a basket of technologies and practices designed to minimize power costs, carbon output, or hazardous waste. IDC's coverage of green IT can be found in numerous documents. The major impact of green IT will be on technology choices based on low power, more attention to asset disposal, and some change in vendor selection. Depending on the country, voluntary adherence to green IT principles could become law. The search for sustainability in areas outside IT will lead to opportunity for IT vendors.
Moderate. The adoption of green IT products and practices should increase demand for new IT products and services.

©2010 IDC #222605 67
T A B L E 3 3
K e y F o r e c a s t A s s u m p t i o n s f o r t h e W o r l d w i d e , U . S . , W e s t e r n E u r o p e , J a p a n , A s i a / P a c i f i c , C a n a d a , a n d R e s t o f W o r l d S e r v e r M a r k e t s , 2 0 1 0 – 2 0 1 4
Country or Region/Market Force IDC Assumption Impact
Accelerator/ Inhibitor/ Neutral
Certainty of Assumption
Demographics The aging of the workforce in the developed world and the growth of the workforce in lower-cost geographies will affect both the supply of and the demand for IT. These may be long-term trends, but they are already manifest in the globalization of the workforce and the slow ICT market growth in places such as Western Europe. IDC assumes that the center of ICT supply will migrate toward Asia and Eastern Europe but, in general, will also diversify. IDC also expects renewed FDI and venture capital (VC) funding for emerging markets such as China and India. ICT consumption will migrate to large population geographies as the center of gravity for IT shifts from the PC to the mobile phone.
Moderate. We expect the continued rise of offshore IT services and business services suppliers, the diversification of services supply points to "blended" models, and both increased diversification of the entire ICT supply chain and risks from potential political or economic disruption.
Form factor changes
Vendors will continue to expand their blade product portfolios as customers embrace this form factor in ever-increasing numbers.
High. The ongoing enhancement and introduction of different types of blade server products by tier 1 and tier 2 vendors is expected to continue as customers further integrate this form factor into their IT infrastructures. Advances in power efficiency and virtualization capabilities are growing by the day providing ample reason for users to adopt the platform.

68 #222605 ©2010 IDC
T A B L E 3 3
K e y F o r e c a s t A s s u m p t i o n s f o r t h e W o r l d w i d e , U . S . , W e s t e r n E u r o p e , J a p a n , A s i a / P a c i f i c , C a n a d a , a n d R e s t o f W o r l d S e r v e r M a r k e t s , 2 0 1 0 – 2 0 1 4
Country or Region/Market Force IDC Assumption Impact
Accelerator/ Inhibitor/ Neutral
Certainty of Assumption
Form factor changes
From a unit perspective, blade adoption is expected to continue its share gains in 4Q09 to 15.6% share of worldwide shipments.
High. With recent advances in CPU technology through the release of Intel's Nehalem and AMD's Istanbul platforms, IDC believes blades will be the first to show signs of growth. This is due to the virtualization advantages provided by both Nehalem and the blade form factor.
Form factor changes
Volume in the blade space will shift primarily to two-socket and four-socket systems.
Moderate. Customer usage scenarios in the blade market favor two-socket configurations.
Chip or CPU type dynamics — x86
x86 processor–based server unit shipments are expected to grow 10.4% during 2010.
Moderate. This is a positive scenario compared with the 2009 drop of 17.8%. IDC expects unit shipments to regain steam throughout 2010 as capital budgets are freed up, credit becomes available, and install bases are refreshed.
Chip or CPU type dynamics —RISC
The RISC server market continued the revenue declines experienced over the past 15 quarters with a 4Q09 decrease of 7.3%. However, unit shipments increased 8.7% during 4Q09.
Moderate. We believe RISC-based server revenue will continue a slow decline ascustomers opt to migrate workloads to lower-cost alternatives.
Chip type and operating system developments —CISC
Worldwide, IDC believes servers based on CISC processors will lose revenue share throughout the forecast, declining from 11.4% in 2008 to 7.6% in 2014. The majority of these systems are mainframes capable of running the IBM zOS operating systems.
Moderate. Many top-tier vendors have programs in place to attempt to attract customers from existing CISC-based mainframes to alternative platforms.

©2010 IDC #222605 69
T A B L E 3 3
K e y F o r e c a s t A s s u m p t i o n s f o r t h e W o r l d w i d e , U . S . , W e s t e r n E u r o p e , J a p a n , A s i a / P a c i f i c , C a n a d a , a n d R e s t o f W o r l d S e r v e r M a r k e t s , 2 0 1 0 – 2 0 1 4
Country or Region/Market Force IDC Assumption Impact
Accelerator/ Inhibitor/ Neutral
Certainty of Assumption
Chip type RISC/Unix has seen a lot of pressure, and this has been very noticeable in 2008 and 2009. The polarization between low-end value and high-end big-iron machines will continue. Revenue and margins at the low end will be tough to maintain.
High. Unix servers have shown great longevity in the installed base, but IDC believes that a period of rationalization, upgrades, and replacement is in store for 2010–2014. These systems are expected to be replaced by Linux and, in some cases, will move to systems running Microsoft Windows.
Operating systems
Midrange and high-end enterprise Unix revenue will be under pressure.
Moderate. This has a negative impact on average sales price.
Operating systems
There is a slowdown in low-end Unix offerings at lower prices.
Moderate. Linux is gaining ground in low-end sales versus entry Unix servers.
Operating systems
The "product mix" of Unix servers continues to change over time. Increased competition from the Linux and x86 space resulted in midtier Unix servers being "squeezed"between low-priced volume servers and high-end enterprise servers.
Moderate. Unix shipments are likely to see a decrease, although that alone will not result in any substantial decrease of revenue.
Operating systems
Microsoft Windows 2008 R2 will enable midrange systems to take on some workloads formerly running on Unix servers, especially in the database-serving and application-serving areas; those servers will likely be based on Intel Xeon or AMD Opteron CPUs.
Moderate. There will likely be an increase in midrange Windows shipments with four to eight sockets in the 2010–2014 time frame.
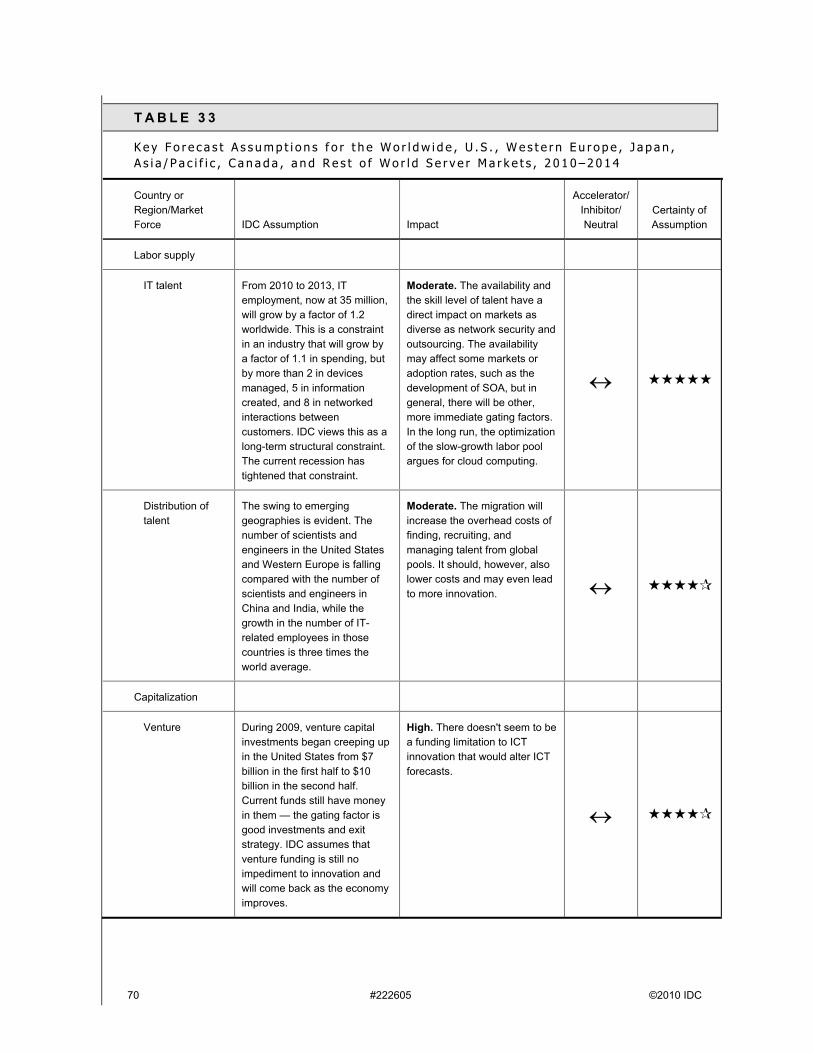
70 #222605 ©2010 IDC
T A B L E 3 3
K e y F o r e c a s t A s s u m p t i o n s f o r t h e W o r l d w i d e , U . S . , W e s t e r n E u r o p e , J a p a n , A s i a / P a c i f i c , C a n a d a , a n d R e s t o f W o r l d S e r v e r M a r k e t s , 2 0 1 0 – 2 0 1 4
Country or Region/Market Force IDC Assumption Impact
Accelerator/ Inhibitor/ Neutral
Certainty of Assumption
Labor supply
IT talent From 2010 to 2013, IT employment, now at 35 million, will grow by a factor of 1.2 worldwide. This is a constraint in an industry that will grow by a factor of 1.1 in spending, but by more than 2 in devices managed, 5 in information created, and 8 in networked interactions between customers. IDC views this as a long-term structural constraint. The current recession has tightened that constraint.
Moderate. The availability and the skill level of talent have a direct impact on markets as diverse as network security and outsourcing. The availability may affect some markets or adoption rates, such as the development of SOA, but in general, there will be other, more immediate gating factors. In the long run, the optimization of the slow-growth labor pool argues for cloud computing.
Distribution of talent
The swing to emerging geographies is evident. The number of scientists and engineers in the United States and Western Europe is falling compared with the number of scientists and engineers in China and India, while the growth in the number of IT-related employees in those countries is three times the world average.
Moderate. The migration will increase the overhead costs of finding, recruiting, and managing talent from global pools. It should, however, also lower costs and may even lead to more innovation.
Capitalization
Venture During 2009, venture capital investments began creeping up in the United States from $7 billion in the first half to $10 billion in the second half. Current funds still have money in them — the gating factor is good investments and exit strategy. IDC assumes that venture funding is still no impediment to innovation and will come back as the economy improves.
High. There doesn't seem to be a funding limitation to ICT innovation that would alter ICT forecasts.

©2010 IDC #222605 71
T A B L E 3 3
K e y F o r e c a s t A s s u m p t i o n s f o r t h e W o r l d w i d e , U . S . , W e s t e r n E u r o p e , J a p a n , A s i a / P a c i f i c , C a n a d a , a n d R e s t o f W o r l d S e r v e r M a r k e t s , 2 0 1 0 – 2 0 1 4
Country or Region/Market Force IDC Assumption Impact
Accelerator/ Inhibitor/ Neutral
Certainty of Assumption
Stocks During 2008, the stock market (S&P 500) dropped 40%, most of that in the last three months of the year. In 2009, it rose 21%. IDC assumes the stock market plunge has done its damage, and the rising market is now helping increase consumer and business confidence.
Moderate. Rising stock prices increase business confidence; falling prices can drive lower economic expectations.
Market characteristics
Hardware Hardware markets, down 9% in 2009, should rebound to spending growth closer to 5% in 2010 and 7% in 2011. The rebound will be dominated by PC spending and, to a lesser extent, telecom equipment and smartphones.
Moderate. Hardware spending, about 40% of total IT spending, drives spending in software and services as well.
Software Software markets, down to -1% growth in 2009, should rebound to growth closer to 3% in 2010 and 5% in 2011. The rebound will be strongest in infrastructure software, in part because of growth in operating systems (Windows 7), but more because of growth in security software.
Moderate. Software spending, about 20% of total IT spending, can drive spending in both hardware and IT and business services.
Services Services markets, down to -2% growth in 2009, should rebound to growth of 2% in 2010 and 4% in 2011. The rebound will be strongest in operations management in 2009 and 2010 (outsourcing, etc.), but spending on implementation services will kick in the most new money in 2011 as new projects come online.
Moderate. IT services spending can affect the rate of overall solution adoption as well as the migration to dynamic IT. It accounts for about 40% of IT spending.

72 #222605 ©2010 IDC
T A B L E 3 3
K e y F o r e c a s t A s s u m p t i o n s f o r t h e W o r l d w i d e , U . S . , W e s t e r n E u r o p e , J a p a n , A s i a / P a c i f i c , C a n a d a , a n d R e s t o f W o r l d S e r v e r M a r k e t s , 2 0 1 0 – 2 0 1 4
Country or Region/Market Force IDC Assumption Impact
Accelerator/ Inhibitor/ Neutral
Certainty of Assumption
Telecom The telecom industry, in its size and utility, is somewhat insulated from sudden economic swings, or at least it has significant inertia. But IDC expects worldwide telecom services growth in 2010 to be lower (2.7%) than in 2009 (3.8%). The fall is related to market saturation and the long-term impact of depressed capital spending.
Moderate. The IT industry has already factored the telecom industry spending into its internal forecasts; the key is the pace at which convergence takes place.
Market ecosystem
Channels The credit crisis has had a lesser effect on channel players than one might have expected, as IT acquisitions represent a "flight to quality." Because of changes in the channel subsequent to the 2002 downturn, IDC does not expect wholesale pruning of ecosystems by IT vendors.
Moderate. Vendors do not have a good track record of dealing logically with channel partners during sudden downturns; disruption and change will impact IT delivery and billings.

©2010 IDC #222605 73
T A B L E 3 3
K e y F o r e c a s t A s s u m p t i o n s f o r t h e W o r l d w i d e , U . S . , W e s t e r n E u r o p e , J a p a n , A s i a / P a c i f i c , C a n a d a , a n d R e s t o f W o r l d S e r v e r M a r k e t s , 2 0 1 0 – 2 0 1 4
Country or Region/Market Force IDC Assumption Impact
Accelerator/ Inhibitor/ Neutral
Certainty of Assumption
Consumption
Saturation The concept of saturation is a tricky one in the context of ICT. Markets that seem saturated (e.g., PC shipments in the United States) can be "unsaturated" by new price thresholds or new functionalities (e.g., DVD playback) that spur faster replacement or bring new users into the market (e.g., seniors). Thus, IDC assumes that while all markets have a fixed number of potential adopters (people or companies), there is usually a price, feature, or solution that can drive additional spending. Also, with IT generally less than 3% of an enterprise's expenses (or a country's GDP), there is tremendous opportunity to turn internal spending on staff or business processes into external spending on ICT products and services. IDC assumes that market "saturation" will be a moving target that varies by submarket but, in almost all cases, can be countered.
Moderate. There will be a general increase in the amount of research and marketing devoted to segmentation. There will also be potential organizational disruption as vendors realign to better approach these segments.

74 #222605 ©2010 IDC
T A B L E 3 3
K e y F o r e c a s t A s s u m p t i o n s f o r t h e W o r l d w i d e , U . S . , W e s t e r n E u r o p e , J a p a n , A s i a / P a c i f i c , C a n a d a , a n d R e s t o f W o r l d S e r v e r M a r k e t s , 2 0 1 0 – 2 0 1 4
Country or Region/Market Force IDC Assumption Impact
Accelerator/ Inhibitor/ Neutral
Certainty of Assumption
Buying sentiment In October 2009, U.S. IT buyer sentiment turned positive, as evidenced by IDC's November 2009 FutureScan Survey. It has since remained above 0% expected budget growth for the next 12 months. IDC believes it is natural for buying expectations to lag behind macroeconomic trends as they are rooted in company-specific plans and recent negative experiences during the downturn.
High. Buyer sentiment has long-term consequences for the approval of IT projects.
Western Europe
Macroeconomics
GDP growth and IT spending
In 4Q09, there was continued pressure underlining the fragility of the recovery across Western Europe and EMEA. The 16-nation euro area rose 0.1% from the third quarter, when it gained 0.4%; the euro area stagnation reflects current difficulties after the recession in Greece deepened, with GDP down 0.8% in 4Q09. Although economists still forecast expansion for the whole euro area in 1Q10, there continue to be difficulties in southern Europe and other countries. For the full year, euro area GDP decreased 4%.
Moderate. IDC forecasts partial recovery in the hardware market in EMEA because enterprise customers have started server refreshments again after overstretching the life cycles of their IT infrastructure. However, server revenue annual declines in 4Q09 continued to be in the double digits, and the market will not reverse to the conditions seen prior to the recession for a long time yet. Quarter on quarter, revenue was up by 33.9%, an indication that a gradual recovery is on its way.

©2010 IDC #222605 75
T A B L E 3 3
K e y F o r e c a s t A s s u m p t i o n s f o r t h e W o r l d w i d e , U . S . , W e s t e r n E u r o p e , J a p a n , A s i a / P a c i f i c , C a n a d a , a n d R e s t o f W o r l d S e r v e r M a r k e t s , 2 0 1 0 – 2 0 1 4
Country or Region/Market Force IDC Assumption Impact
Accelerator/ Inhibitor/ Neutral
Certainty of Assumption
European countries
Germany GDP unexpectedly stagnated in 4Q09 at 0.0% growth, while France GDP strongly rebounded by 0.6% in 4Q09. Italy's economy unexpectedly shrank by 0.2% in 4Q09. U.K. GDP increased by 0.3% in 4Q09, the first quarter of positive output after many quarters of negative growth. On a yearly basis, U.K. GDP was 3.3% lower than in 4Q08. Business investment declined 24% in the fourth quarter compared with 4Q08 in the United Kingdom. GDP only improved very marginally because the previous quarters were revised downward further. In addition, fear of rising inflation and looming election in the United Kingdom will put most of the investment projects on hold in the coming quarters in the United Kingdom.
High. While the technology drivers and needs remain unchanged by the macroeconomic conditions, the balance sheet streamlining taking place in most organizations has produced a shrink in IT budgets, leading to postponement or downsizing of non-urgent IT investments, especially on the system refreshment side.
Business confidence
The persistent credit freeze has made it harder to obtain liquidity to investment in new or established businesses. IT spending continues to be affected by the credit freeze, particularly in the SMB segment. Rising volatility in sovereign CDS spreads or yields has increased among European countries, as investors increasingly differentiate across countries with regard to government deficits and debt. Despite this, IDC's Quarterly EMEA Server Forecast has been adjusted upward in areas such as x86 systems and racks.
High. Companies ponder more carefully over IT investments and have noticeably reduced large innovation projects.

76 #222605 ©2010 IDC
T A B L E 3 3
K e y F o r e c a s t A s s u m p t i o n s f o r t h e W o r l d w i d e , U . S . , W e s t e r n E u r o p e , J a p a n , A s i a / P a c i f i c , C a n a d a , a n d R e s t o f W o r l d S e r v e r M a r k e t s , 2 0 1 0 – 2 0 1 4
Country or Region/Market Force IDC Assumption Impact
Accelerator/ Inhibitor/ Neutral
Certainty of Assumption
Public spending European governments are being forced to drastically reduce public spending in the wake of the Greece crisis.
High. Companies are pondering more carefully over IT investments and have noticeably reduced large innovation projects.
Western Europe IT spending outlook
According to IDC's Worldwide Black Book, 1Q10, Western Europe's IT spending will grow by 0.2% in 2010. The new Black Book data published in March 2010 revised the overall Western European IT spending growth for 2010 downward, from 1.2 % year over year to 0.2%, after a slump of -4.1% in 2009, revised also downward, from the -3.9% estimated previously.
High. Software and services will provide much of the growth in 2009, with server hardware (high end, midrange, and volume servers) spending forecast shrinking by around 21.6% year over year in Western Europe for 2009 and 6.4% in 2010.
IT spending growth in France
IT spending growth in France is anticipated to dip by 3.3% year over year in 2009 and grow in 2010 by 0.1%.
Moderate. Like other countries in Western Europe, France will also be focusing on software and services, while hardware investments will decline, especially in the high-end server area.
IT spending growth in Germany
IDC anticipates total IT spending in Germany will be down 4.1% in 2009 and down 0.3% in 2010.
Moderate. A similar pattern will be seen in Germany as in France, with cuts in hardware spending.
IT spending growth in Italy
IDC anticipates total IT spending in Italy to shrink by 4.2% in 2009 and grow by 0.2% in 2010.
Moderate. A decline in software and services will follow hardware cuts in 2009.
IT spending growth in the United Kingdom
IT spending in the United Kingdom is anticipated to decline by 4.5% in 2009 and by 1.0% in 2010.
Moderate. A similar pattern will be seen in the United Kingdom as in France and Germany, but at a larger scale.
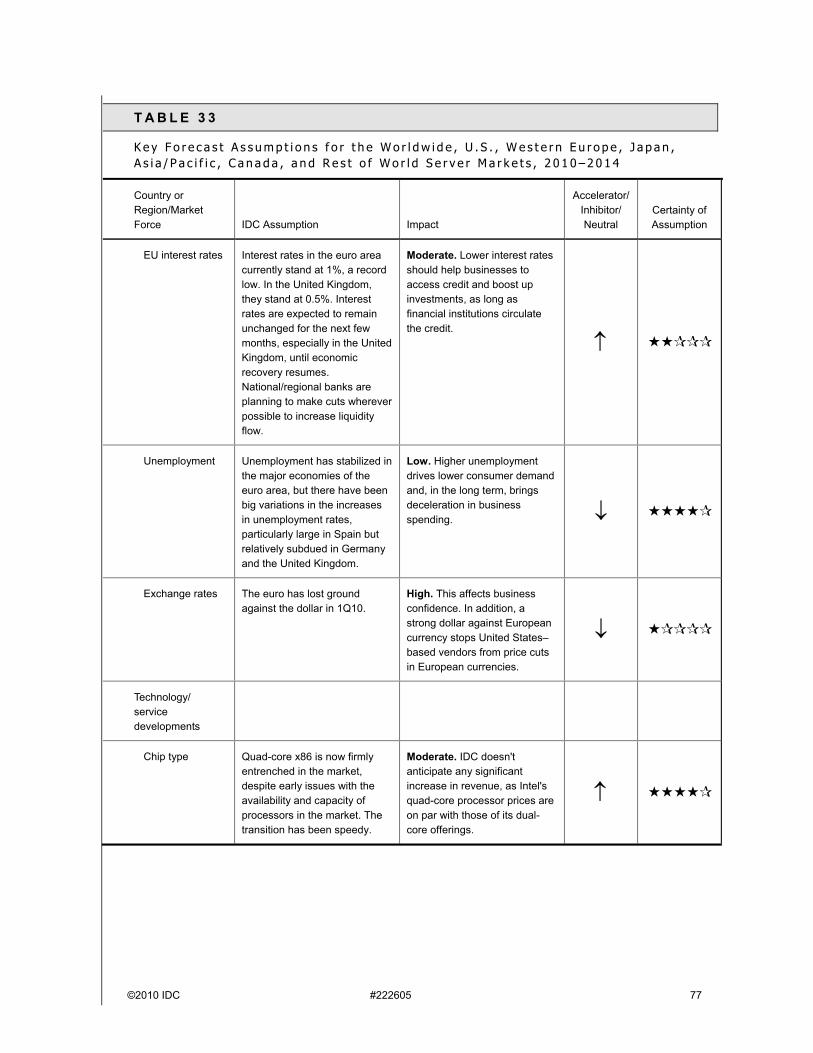
©2010 IDC #222605 77
T A B L E 3 3
K e y F o r e c a s t A s s u m p t i o n s f o r t h e W o r l d w i d e , U . S . , W e s t e r n E u r o p e , J a p a n , A s i a / P a c i f i c , C a n a d a , a n d R e s t o f W o r l d S e r v e r M a r k e t s , 2 0 1 0 – 2 0 1 4
Country or Region/Market Force IDC Assumption Impact
Accelerator/ Inhibitor/ Neutral
Certainty of Assumption
EU interest rates Interest rates in the euro area currently stand at 1%, a record low. In the United Kingdom, they stand at 0.5%. Interest rates are expected to remain unchanged for the next few months, especially in the United Kingdom, until economic recovery resumes. National/regional banks are planning to make cuts wherever possible to increase liquidity flow.
Moderate. Lower interest rates should help businesses to access credit and boost up investments, as long as financial institutions circulate the credit.
Unemployment Unemployment has stabilized in the major economies of the euro area, but there have been big variations in the increases in unemployment rates, particularly large in Spain but relatively subdued in Germany and the United Kingdom.
Low. Higher unemployment drives lower consumer demand and, in the long term, brings deceleration in business spending.
Exchange rates The euro has lost ground against the dollar in 1Q10.
High. This affects business confidence. In addition, a strong dollar against European currency stops United States–based vendors from price cuts in European currencies.
Technology/service developments
Chip type Quad-core x86 is now firmly entrenched in the market, despite early issues with the availability and capacity of processors in the market. The transition has been speedy.
Moderate. IDC doesn't anticipate any significant increase in revenue, as Intel's quad-core processor prices are on par with those of its dual-core offerings.

78 #222605 ©2010 IDC
T A B L E 3 3
K e y F o r e c a s t A s s u m p t i o n s f o r t h e W o r l d w i d e , U . S . , W e s t e r n E u r o p e , J a p a n , A s i a / P a c i f i c , C a n a d a , a n d R e s t o f W o r l d S e r v e r M a r k e t s , 2 0 1 0 – 2 0 1 4
Country or Region/Market Force IDC Assumption Impact
Accelerator/ Inhibitor/ Neutral
Certainty of Assumption
Chip type The recent technology developments in x86 microprocessors helped drive demand in 4Q09, and 2010 will be a promising year in that area.
Moderate. IDC regards positively the launch of Dunnington, which is competing against non-x86 midrange platforms.
Chip type Intel's launch of Nehalem-EX, an eight-core design, to be released in March 2010, will introduce significant improvements, and the 32nm Westmere processor, set for release later in 2010, is socket compatible with Xeon 5500 processors. AMD's Magny Cours is also raising customer and OEM expectations.
Moderate. While the new technology does not increase IT budgets, a fairly large share of end users will gradually shift to the new micro-architecture.
Chip type AMD could regain momentum now that the transfer of manufacturing to the Foundry Company has allowed the company more breathing space, perhaps facilitating a more timely delivery of its semiconductor processes in the future. The chipmaker will be focusing on the two-socket space in the future.
Moderate. Aggressive pricing will again fuel the Intel-AMD debate. With more AMD-based entry server launches, this debate is reaching market segments hitherto unchartered.

©2010 IDC #222605 79
T A B L E 3 3
K e y F o r e c a s t A s s u m p t i o n s f o r t h e W o r l d w i d e , U . S . , W e s t e r n E u r o p e , J a p a n , A s i a / P a c i f i c , C a n a d a , a n d R e s t o f W o r l d S e r v e r M a r k e t s , 2 0 1 0 – 2 0 1 4
Country or Region/Market Force IDC Assumption Impact
Accelerator/ Inhibitor/ Neutral
Certainty of Assumption
Chip type The acquisition of Sun by Oracle was completed in 1Q10, and the impact on product plans will have wide repercussion on both the hardware and the software layers. Oracle plans to invest in Sun's Solaris and SPARC technologies to assure customers and "revitalize"Sun's hardware portfolio, as Sun's new announcements had slowed in 2008–2009. Servers will carry the Sun-Oracle brand and include both "scale-up" and "scale-out" systems. On the scale-up side will be scalable systems, such as the M-Series of midrange and high-end servers, based on the SPARC64 processor and Solaris. On the scale-out side would be a range of smaller SPARC CMT and x86 servers.
Low. The future for Solaris/Java will depend on Oracle's plans to integrate the platforms with its own software products.
Chip type x86 multicore processing technologies apply genuine pressure in the traditional midmarket RISC server platform space, especially after the release of Nehalem EX in 1Q10 and forthcoming Magny Cours.
Moderate. Price/performance is no longer the main competitive differentiator. Support for a large number of commercial workloads will be increasingly more important as well as support for reliability, availability, and security (RAS) features.
Chip type Multicore as well as virtualization will have a negative impact on server units in the x86 market but a positive impact on ASVs.
High. There will be low single-digit growth for the x86 unit market.

80 #222605 ©2010 IDC
T A B L E 3 3
K e y F o r e c a s t A s s u m p t i o n s f o r t h e W o r l d w i d e , U . S . , W e s t e r n E u r o p e , J a p a n , A s i a / P a c i f i c , C a n a d a , a n d R e s t o f W o r l d S e r v e r M a r k e t s , 2 0 1 0 – 2 0 1 4
Country or Region/Market Force IDC Assumption Impact
Accelerator/ Inhibitor/ Neutral
Certainty of Assumption
Chip type The growth of multicore will place higher levels of compute power in the hands of end users, and it means they will buy less as they get more sophisticated at optimizing theinfrastructure.
High. The vast majority of x86 machines shipped are equipped with either dual-core or quad-core processors. Quad cores are now penetrating the market; users need to purchase fewer systems to manage existing compute requirements.
Chip type The latest generations of RISC Unix servers by IBM on POWER7 processors were released in 1Q10 and are in direct competition against EPIC servers on Intel's Itanium chips, most of which are sold by HP, among other vendors. This will intensify competitive pressures on the non-x86 space, in addition to the forthcoming release of Nehalem EX and with AMD's Magny Cours to follow.
Moderate. EPIC will likely move more to the higher end, competing with RISC rather than x86.
Chip type RISC/Unix has seen a lot of pressure, which has been very noticeable in 4Q09. This quarter has marked the definitive turn to industry-standard technologies, and corporate clients that were typically customers of enterprise servers are now turning to infrastructure projects based on x86 technologies. By now, most RISC vendors have provided their customers with alternative road maps and confirmed existing ones and are working on migration tools whether or not RISC appears in the product portfolio.
High. Unix servers are dominated by a strong level of upgrade and replacement activity. There is some migration of installed ERP. Large accounts tend to stick to their existing environments (SAP or Oracle) and only invest to add some BI or CRM modules or to support new users. All ERP vendors (SAP, Oracle, etc.) target the midmarket for pockets of growth but have mixed success.

©2010 IDC #222605 81
T A B L E 3 3
K e y F o r e c a s t A s s u m p t i o n s f o r t h e W o r l d w i d e , U . S . , W e s t e r n E u r o p e , J a p a n , A s i a / P a c i f i c , C a n a d a , a n d R e s t o f W o r l d S e r v e r M a r k e t s , 2 0 1 0 – 2 0 1 4
Country or Region/Market Force IDC Assumption Impact
Accelerator/ Inhibitor/ Neutral
Certainty of Assumption
Chip type The launch of new mainframe generation systems, such as IBM z10, new PRIMEPOWER, and Unisys Libra mainframes, offering increased performance and greater software functionality, took some mainframe customers to replace their existing systems. However, CISC performance was weaker than expected in 4Q09, a quarter traditionally stronger than other quarters for this type of architecture. IDC anticipates the CISC market share to decline over the forecast period.
Low. New workloads are available on mainframes, as these systems are now gaining support for Internet-based workloads, Linux and Java will convince part of the mainframe installed base to replace their existing mainframe technology. While there are some scenarios that indicate a long lifetime for these systems, the drive to improve TCO will lead customers to evaluate more cost-effective alternatives for select applications.
Chip type Chip vendors focus on reducing overall processor power ratings for processors and introducing "throttle back" technologies such as SpeedStep from Intel and CoolCore from AMD.
Low. Power savings made on processors will not counterbalance increased server densities.
Chip type Performance per watt per square meter will become a key metric in benchmarking processor performance through 2010 and beyond.
Moderate. The discussion of how to count which part of the system or datacenter continues and is not expected to come to a close soon. In the end, it will enable customers to better understand powered distribution across datacenter and manage increasing energy costs reducing overall datacenter opex.
Form factor The blade market is anticipated to be the main driving factor for the server market in 2010 through further development of blade-specific solutions and reference architectures and a much higher revenue potential.
High. Blades will grab over a 20% shipment share of all servers in 2009, representing 14% of overall revenue share.

82 #222605 ©2010 IDC
T A B L E 3 3
K e y F o r e c a s t A s s u m p t i o n s f o r t h e W o r l d w i d e , U . S . , W e s t e r n E u r o p e , J a p a n , A s i a / P a c i f i c , C a n a d a , a n d R e s t o f W o r l d S e r v e r M a r k e t s , 2 0 1 0 – 2 0 1 4
Country or Region/Market Force IDC Assumption Impact
Accelerator/ Inhibitor/ Neutral
Certainty of Assumption
Form factor Vendors will look to push blades into SMBs through low-spec solution sales. Midsize companies are now starting to look at blades, and vendor positioning of blade solutions for this market segment is improving.
Moderate. Medium-sized companies are moving closer to benefiting from blades —datacenter in a box, for example. Hurdles, especially on the capex side, remain.
Form factor Business process automation becomes reality in the server blade market.
High. Beyond physical savings, the compelling blade value proposition is the ability to automate management processes; currently, this is not possible and as such seriously affects ROI assessments.
Form factor Vendors will look to differentiate blade products from current rack-optimized products through the introduction of new technologies such as virtualized connectivity or embedded virtualization.
High. Virtualized connectivity significantly simplifies the deployment and manageability of blade infrastructure further augmenting the blade value proposition and differentiating blades from rack-optimized systems.
Form factor For SMBs as well as corporate investment comeback, there is a trend toward smaller, racked form factors; modular computing is becoming a reality faster.
High. Blades are taking off in datacenter and PC arrays, as a consolidation and infrastructure extension tool.
Form factor X86 one-socket and two-socket pedestals and racks are performing well — aimed at SMBs.
High. They provide more for less money, reaching new customers.

©2010 IDC #222605 83
T A B L E 3 3
K e y F o r e c a s t A s s u m p t i o n s f o r t h e W o r l d w i d e , U . S . , W e s t e r n E u r o p e , J a p a n , A s i a / P a c i f i c , C a n a d a , a n d R e s t o f W o r l d S e r v e r M a r k e t s , 2 0 1 0 – 2 0 1 4
Country or Region/Market Force IDC Assumption Impact
Accelerator/ Inhibitor/ Neutral
Certainty of Assumption
Form factor There is a strong focus by vendors on systems management to deliver and educate the market on the potential of blades with regard to automation. However, they are still facing difficulties removing the traditional one-server, one-app mindset of IT managers and convincing them of the viability and benefits of blades.
Moderate. Strong blade server growth is anticipated.
Socket capability The low end of the x86 market continues to be hot as attested by vendor launches and steady sales. This heightened IT adoption in smaller companies has been a driver, and the currently created installed base will be a major target in two to four years.
High. SMBs are typically under penetrated when considering network-based computing, and the rate of current purchases is creating an opportunity. Price wars in the entry-level x86 segment may be put on hold, though, as vendors try to focus on profitability.
Socket capability The trend toward servers with fewer CPUs as a feature/functionality moves downstream. Dual/multicore implementations in the x86 arena will speed this development up. That said, IDC expects the impact on the number of systems sold into the market to be limited, as customer needs increase and pricing remains compelling.
Moderate. As compute power per CPU increases, fewer CPUs are required and core numbers are expected to grow.
Socket capability Operating system migration is becoming a more serious concern, pushing smaller servers and some high-end ones; there are long sales cycles for these project-based initiatives, but a number of them are coming to the finish now.
Moderate. This trend is strongly connected to infrastructure consolidation and increased budgets and will shift and ultimately reduce spending but increase units.

84 #222605 ©2010 IDC
T A B L E 3 3
K e y F o r e c a s t A s s u m p t i o n s f o r t h e W o r l d w i d e , U . S . , W e s t e r n E u r o p e , J a p a n , A s i a / P a c i f i c , C a n a d a , a n d R e s t o f W o r l d S e r v e r M a r k e t s , 2 0 1 0 – 2 0 1 4
Country or Region/Market Force IDC Assumption Impact
Accelerator/ Inhibitor/ Neutral
Certainty of Assumption
Operating systems
Windows is expected to depose Unix as the main operating system. Microsoft will increase its penetration of the virtualization market through partnerships with hardware vendors, as the forced transition from Windows Server 2000 and Windows Server 2003 to Windows Server 2008 leads to a bigger share for Hyper V.
Moderate. Windows will continue to grow its market share at the expense of Unix.
Operating systems
The enterprise versions of Linux (SUSE and Red Hat Enterprise) are strengthening their high-availability functionality, allowing more workloads to migrate from Unix servers to Linux servers (or to Linux VMs running on x86 physical servers or scalable host servers, such as mainframes, supporting Red Hat or Novell Linux distributions).
Moderate. Support from mainstream suppliers continues to boost the number of organizations considering Linux, including finance, government, telco, and manufacturing.
Operating systems
IDC's Quarterly EMEA Server Forecast expects the CAGRs for 2009–2013 for Unix to be 4% for shipments and 1.7% for revenue. The number of servers shipped porting this operating system is forecast to fall from 94,359 in 2009 to 80,299 in 2013.
Moderate. Unix footprint is decreasing slowly but steadily, which will eventually lead to its demise over the longer term.

©2010 IDC #222605 85
T A B L E 3 3
K e y F o r e c a s t A s s u m p t i o n s f o r t h e W o r l d w i d e , U . S . , W e s t e r n E u r o p e , J a p a n , A s i a / P a c i f i c , C a n a d a , a n d R e s t o f W o r l d S e r v e r M a r k e t s , 2 0 1 0 – 2 0 1 4
Country or Region/Market Force IDC Assumption Impact
Accelerator/ Inhibitor/ Neutral
Certainty of Assumption
Operating systems
Porting of Solaris 10 on x86 is offering a better market for Solaris — at least for a transition period — and certainly puts pressure on the traditional Solaris players. The boost from the agreement between HP and Sun lets HP market and provide technical support for Sun Solaris 10 on HP ProLiant and BladeSystem platforms.
Moderate. The future of the Solaris platform is now under scrutiny as it becomes part of the Oracle brand.
Operating systems
The "product mix" of Unix servers continues to change over time. Increased competition from the Linux and x86 space has forced vendors to dramatically reduce prices of Unix entry models, resulting in midtier Unix servers being "squeezed" between low-priced volume servers and high-end enterprise servers.
High. Unix shipments are likely to see an increase, although it will not result in any substantial increase of revenue.
Life cycles Two-socket server blades will take advantage of renewal cycles as companies shift toward modular computing concepts.
Moderate. There is timing advantage in synchronization with renewal cycles, but overall market impact is lessened through cannibalization of other form factors.
Web services and SOA
Wider adoption, although still at a slower pace than Web services and SOA, particularly in the financial and manufacturing sectors, will forge new deployments of IT infrastructure.
High. This will forge new deployments of IT infrastructure.

86 #222605 ©2010 IDC
T A B L E 3 3
K e y F o r e c a s t A s s u m p t i o n s f o r t h e W o r l d w i d e , U . S . , W e s t e r n E u r o p e , J a p a n , A s i a / P a c i f i c , C a n a d a , a n d R e s t o f W o r l d S e r v e r M a r k e t s , 2 0 1 0 – 2 0 1 4
Country or Region/Market Force IDC Assumption Impact
Accelerator/ Inhibitor/ Neutral
Certainty of Assumption
Virtualization and system managementsoftware
Virtualization will be used to increase server utilization. The "virtualization effect" will produce a gradual slowdown in overall unit growth rates; however, ASVs will increase as systems are shipped more richly configured. Virtualization could see a boost following datacenter consolidation projects and the gradual penetration of hyper-V.
High. A large number of large enterprises already use virtualization, impacting around a quarter of the installed base. In this segment, upward of 50% of servers are expected to be virtualized over this year.
Virtualization and system management software
More virtualization and system management software products will be introduced to coordinate and pool together hardware resources, with the objective ofmaking IT resources as flexible and changeable as possible.
High. This will accelerate server consolidation trends in the midterm.
Virtualization and system management software
Virtualization will drive sales of new and more richly configured server systems. The bundling of server, storage, network, operating system, hypervisors, and management resources has become the new battleground of the war to gain market share in the enterprise market. The bigger margins obtained by vendors, which can also sell management and integration services alongside the hardware layer, and the relative simplicity of a single, complete infrastructure model for customers, will continue to push the converged infrastructure as a defining feature of the market in 2010.
High. Systems need richer specifications to achieve the projected ROI benefits of virtualization from a consolidation and utilization standpoint.

©2010 IDC #222605 87
T A B L E 3 3
K e y F o r e c a s t A s s u m p t i o n s f o r t h e W o r l d w i d e , U . S . , W e s t e r n E u r o p e , J a p a n , A s i a / P a c i f i c , C a n a d a , a n d R e s t o f W o r l d S e r v e r M a r k e t s , 2 0 1 0 – 2 0 1 4
Country or Region/Market Force IDC Assumption Impact
Accelerator/ Inhibitor/ Neutral
Certainty of Assumption
Virtualization and system management software
Reporting functionality within systems management tools will become a key differentiator for vendor offerings.
Moderate. As more information is collected (through additional sensors being deployed in the datacenter), administrators will need powerful tools for interpretation and the fulfillment of educated assumptions on how to reduce overall TCO.
Datacenter thermodynamics
Power wastage in the datacenter has a significant impact on overall "power capacity." Green IT will be a major theme — though business elements and constraints will drive the agenda rather than environmental concerns.
High. Power wastage comes from both unutilized servers and over-provisioning of cooling; this is being addressed by virtualization to increase utilization and the following of datacenter best practices together with dynamic cooling solutions. In doing so, facilities managers will free up power capacity. Today, the lack of power capacity and over-provisioning of cooling capabilities act as an inhibitor; however, looking forward, best practice and virtualization require little investment. Dynamic cooling solutions require more planning and higher investment.
Datacenter thermodynamics
Server footprints will continue to shrink (i.e., increased penetration of blades), placing pressure on power and cooling capacity of datacenter facilities.
Moderate. While penetration of blades is low at present, it is expected to rapidly increase through the forecast period which, if current trends continue, will see power and cooling capacity exceeded.
Datacenter thermodynamics
Existing power infrastructurecontinues to lag behind datacenter requirements. Vendor strategies focus on increasing ROI associated with power investment at all levels.
Moderate. Power capacity acts as the glass ceiling, denoting how many systems can be housed within the datacenter.

88 #222605 ©2010 IDC
T A B L E 3 3
K e y F o r e c a s t A s s u m p t i o n s f o r t h e W o r l d w i d e , U . S . , W e s t e r n E u r o p e , J a p a n , A s i a / P a c i f i c , C a n a d a , a n d R e s t o f W o r l d S e r v e r M a r k e t s , 2 0 1 0 – 2 0 1 4
Country or Region/Market Force IDC Assumption Impact
Accelerator/ Inhibitor/ Neutral
Certainty of Assumption
Datacenter thermodynamics
Datacenter power and cooling infrastructure exceeds capacity as a result of increasing server density.
Moderate. The high cost of upgrading power and cooling infrastructure will impact other areas of IT budget. This will be felt strongest in the SMB sector, where to date the issue is not widely recognized.
Datacenter thermodynamics
The impact of power consumption is an issue solely from an economic perspective. As management costs are streamlined, energy costs increase as a percentage of datacenter spend; this is compounded by increasing energy costs.
Moderate. Users will look toward more power-efficient systems as a vessel to decrease the cost of power. Users will look toward virtualization, which will require new, more highly configured systems to achieve higher utilization rates. However, this varies by IT maturity and geography.
Corporate and social responsibility
Purchasing process will be impacted by environmental concerns.
Low. Green computing is a "nice to have," which can be used for marketing purposes. There remains a perceived cost in being green, and therefore, the impact will not be felt until legislation is put in place forcing the issue.
Capitalization
Market players There will be investments in new products but reluctance to buy out market share and focus back on profitability.
High. Server market revenue is not negatively impacted by vendor consolidation.
Market players The market is experiencing polarization: Vendors must balance unit shares and profit margin versus players going for unit market share and short-term revenue hit. The first category is becoming more prominent.
Moderate. There will be reduction/more focused pricing initiatives and some volume reduction.

©2010 IDC #222605 89
T A B L E 3 3
K e y F o r e c a s t A s s u m p t i o n s f o r t h e W o r l d w i d e , U . S . , W e s t e r n E u r o p e , J a p a n , A s i a / P a c i f i c , C a n a d a , a n d R e s t o f W o r l d S e r v e r M a r k e t s , 2 0 1 0 – 2 0 1 4
Country or Region/Market Force IDC Assumption Impact
Accelerator/ Inhibitor/ Neutral
Certainty of Assumption
R&D Chip development needs economies of scale; most standard components are outsourced — with less and less being done at the OEM level.
High. Customized components are more and more expensive to develop and lead to less choice for the customer.
Market characteristics
IT purchasing cycles — volume space
IDC recognizes that x86 hardware replacement has been put on hold after the postcrisis budget freeze. While this may last for some quarters, refreshments will have to take place in 2010 for sheer hardware consumption reasons. Also, the gradual penetration of Windows Server 2008 over 2009 may partially relieve this by encouraging server refresh. Enhanced virtualization and system management functionality —key for the mass-market adoption of blade technology —will help on the server ASV and server revenue side.
Moderate. The volume server segment, the main engine behind server market growth in the recent years, will display contraction over 2009 and will start to recover only in 2010.
IT purchasing cycles —midrange and high-end space
While there are still large consolidation, migration, and replacement opportunities in the midrange and high-end segments, sales cycles remain lengthy for projects, which often involve careful handling of mission-critical applications. General economic perspectives are forcing most Western European IT organizations to be extremely cautious in evaluating any changes in their core IT infrastructure.
Moderate. Midrange and high-end server segments may face difficulties in the renewal process.

90 #222605 ©2010 IDC
T A B L E 3 3
K e y F o r e c a s t A s s u m p t i o n s f o r t h e W o r l d w i d e , U . S . , W e s t e r n E u r o p e , J a p a n , A s i a / P a c i f i c , C a n a d a , a n d R e s t o f W o r l d S e r v e r M a r k e t s , 2 0 1 0 – 2 0 1 4
Country or Region/Market Force IDC Assumption Impact
Accelerator/ Inhibitor/ Neutral
Certainty of Assumption
Vendor push Vendors are continuing investment in new technology and increasing focus on solution-based offerings to facilitate transition to more strategic sales, including power and cooling solutions.
High. This development has a long-term effect on price and margin levels.
Vendor push The importance of SMBs to vendors has not lessened with the increase in enterprise spending patterns. Vendors increasingly focus on developing their channel relationship and, at the same time, on developing complete solutions, which encompass hardware, software, and services.
High. SMB programs continue to ramp up with country-level success being replicated across regions. Being a solutions company is an aim for all major players.
CXO confidence CXO confidence is in steep decline. Facing profit and revenue dips, executives may put on hold all noncritical IT projects.
Moderate. The effect is beginning to materialize for significant numbers of large projects.
CIO confidence There will be increased associated risk with new technology versus value propositions such as blades (ROI, TCO, systems management, physical savings, etc.)
Moderate. This extends sales cycle and proof of concept.
Corporate There will be both replacement and solution sales/strategic purchases.
Moderate. IT consolidation, virtualization, and ERP implementation drive server sales.

©2010 IDC #222605 91
T A B L E 3 3
K e y F o r e c a s t A s s u m p t i o n s f o r t h e W o r l d w i d e , U . S . , W e s t e r n E u r o p e , J a p a n , A s i a / P a c i f i c , C a n a d a , a n d R e s t o f W o r l d S e r v e r M a r k e t s , 2 0 1 0 – 2 0 1 4
Country or Region/Market Force IDC Assumption Impact
Accelerator/ Inhibitor/ Neutral
Certainty of Assumption
Corporate The corporate sector remained strong in terms of both renewals and resumption. IDC anticipates CIO spending patterns will remain positive, with a strong focus on manageability, automation of business processes, and server utilization.
High. A larger proportion of CXO IT budget will be dedicated to new strategic IT investment projects.
Large business There will be a decrease in mega deals, as budgets shrink and risk aversion kicks in.
Moderate. There will be less high-profile deals with guaranteed income over a period.
SMBs SMBs are increasingly relying on IT to streamline and extend value chains.
High. This erodes ASVs and results in higher cost per sale and margin erosion.
SMBs SMBs will remain a focus and represent a significant opportunity; channel focus and direct marketing investments and programs are linked to success.
High. This erodes ASVs and results in higher cost per sale and margin erosion despite more reach.
SMBs Vendors will realign sales channels to incorporate larger midsize businesses and, in doing so, extend the high-margin customer segment.
High. Increased vendor contact will result in greater take-up of major vendor holistic concepts.
Large business IT will become tightly integrated with business process.
Moderate. This will improve TCO and value proposition versus greater standardization. Virtualization on x86 boxes will grow, but with longer sales cycles.
Public sector Although not the biggest vertical, the public sector is very stable in investment terms and will remain a focus and significant opportunity, driven in part by the government.
Moderate. This segment is small but growing and stable.

92 #222605 ©2010 IDC
T A B L E 3 3
K e y F o r e c a s t A s s u m p t i o n s f o r t h e W o r l d w i d e , U . S . , W e s t e r n E u r o p e , J a p a n , A s i a / P a c i f i c , C a n a d a , a n d R e s t o f W o r l d S e r v e r M a r k e t s , 2 0 1 0 – 2 0 1 4
Country or Region/Market Force IDC Assumption Impact
Accelerator/ Inhibitor/ Neutral
Certainty of Assumption
Public sector The public sector, currently developing a Linux bias is estimated to draw in local government as well as SMBs, which could have a significant effect.
High. If the draw is realized, the impact could be high.
Public sector Increased automation and digitization of processes in public sector verticals will drive demand for servers. Examples in healthcare include the digitization and consolidation of patients' clinical files and healthcare administrative documents and the growth of electronic transactions (e.g., ebooking and eprescribing). In education, the adoption of student management systems (to enable the management of all student administrative information in digital format) and elearning platforms that encourage the sharing of learning experiences will generate the need for higher storage capacity.
Moderate. National IT modernization plans in the United Kingdom, regional initiatives in Italy and Spain, and medium-term investment in the French hospital system will drive demand for servers in the public sector.
Public sector Governments in Western Europe will continue promoting the use of Linux and open source software.
Moderate. It will prompt many other organizations to consider Linux for their IT infrastructure.
Telco Renewals for traditional businesses are important, but investments in 3G and IP telephony are the most prominent.
Moderate. Delays in the uptake of 3G technology have limited the amount of dollar investments to the support infrastructure.
Finance Following two quarters of consolidation and nationalization in the financial market due to the meltdown in 2008, the outlook for the sector is uncertain for 2009.
Moderate. The financial sector's dependency on IT and server technology is very high, but spending could shift from hardware to software to meet regulatory compliances and increase risk management systems.

©2010 IDC #222605 93
T A B L E 3 3
K e y F o r e c a s t A s s u m p t i o n s f o r t h e W o r l d w i d e , U . S . , W e s t e r n E u r o p e , J a p a n , A s i a / P a c i f i c , C a n a d a , a n d R e s t o f W o r l d S e r v e r M a r k e t s , 2 0 1 0 – 2 0 1 4
Country or Region/Market Force IDC Assumption Impact
Accelerator/ Inhibitor/ Neutral
Certainty of Assumption
Telco Linux operating systems, both carrier grade and enterprise class, are emerging as a fundamental part of the latest wireless and wireline telecommunications infrastructure.
High. New market dynamics in the telecom sector dictate carriers, which have traditionally deployed servers running proprietary software that was developed by the telcos ― or some variant of the Unix operating system (Sun Solaris, HP-UX, and IBM AIX, among others) to drastically reduce both capital costs and operation costs of operational support systems/businesssupport systems (OSSs/BSSs).
Commercial sector
In an uncertain economic environment, pressure on the IT department to reduce cost remains.
High. There is increased demand for Linux-based servers due to apparent cost advantage.
Labor supply All major server vendors have strengthened their Linux business, and Unix engineers will switch to Linux.
Moderate. This trend will promote the shift in demand from Unix servers to Linux x86 servers.
Market ecosystem
Application availability
32-bit and 64-bit versions of major database products, including Oracle and IBM DB2, are available, allowing Linux servers to take on stronger roles as database engines for multitiered computing infrastructure.
Moderate. This will take time toestablish.
Application availability
There is strong support from enterprise middleware players for the Linux server platform, including Oracle, BEA Software, and IBM WebSphere.
Moderate. This will accelerate the Linux adoption trend.

94 #222605 ©2010 IDC
T A B L E 3 3
K e y F o r e c a s t A s s u m p t i o n s f o r t h e W o r l d w i d e , U . S . , W e s t e r n E u r o p e , J a p a n , A s i a / P a c i f i c , C a n a d a , a n d R e s t o f W o r l d S e r v e r M a r k e t s , 2 0 1 0 – 2 0 1 4
Country or Region/Market Force IDC Assumption Impact
Accelerator/ Inhibitor/ Neutral
Certainty of Assumption
Application availability
ISVs lag behind in developing multithread applications to take advantage of multicore processors.
Moderate. While multicore is proving beneficial in combination with virtualization, few true multithread commercial applications are available.
Application availability
Most applications in the x86 space remain 32-bit today, with around 60% (declining trend) of applications being either in-house built or customized packages. This will change with increasingly standardized packages.
Moderate. Users are not yet taking advantage of processing leap to 64-bit; however, 64-bit has become the de facto standard in the x86 space. In the next 12 months, this will shift more considerably.
Application pricing
Multicore and virtualization are partly dependent on licensing issues. Recent indications and vendor moves lead to the conclusion that solutions are in sight.
High. This will make the cost and efficiency reasons stronger and increase the attractiveness of the combined value proposition.
High-performance computing
HPC acceptance fuels the blade, multiprocessor x86, and Linux markets.
Low. This is a small market segment with limited sales potential but high market visibility.
Major changes
Unit and revenue adjustment
Revenue and unit growth are constantly updated by IDC for 2010 based on the impact of the economic recovery.
Low. IDC's Quarterly EMEA Server Forecast has been adjusted upward in areas such as x86 systems and racks. There are question marks regarding the extent of the economic recovery, but IDC believes that server investments will be slowly picking up over the course of 2010. Also, virtualization combined with long overdue server refresh could prompt further momentum on server shipments.

©2010 IDC #222605 95
T A B L E 3 3
K e y F o r e c a s t A s s u m p t i o n s f o r t h e W o r l d w i d e , U . S . , W e s t e r n E u r o p e , J a p a n , A s i a / P a c i f i c , C a n a d a , a n d R e s t o f W o r l d S e r v e r M a r k e t s , 2 0 1 0 – 2 0 1 4
Country or Region/Market Force IDC Assumption Impact
Accelerator/ Inhibitor/ Neutral
Certainty of Assumption
Japan
Macroeconomics and political assumptions
Economic growth — 2010
While many of listed companies have changed to a profitable structure by cost reduction, demands from emerging countries and others have grown. So their performances have improved in a marked fashion; their pretax profit for the fiscal year ending in March 2010 will become positive against the previous year's result. While the non-manufacturing industry, which suffer from deflation, expect declining profit, manufacturing industry, of which automotive industry and electronics industry are main driving force, expect increased profit and will fill the gap. Though it could not be denied that the recovery of world economy would fall into a sluggish pace by China's attitude on financial restraint and Toyota's recall issue would affect the sale of Japanese automotives, the Japanese economy will grow in positive by around 1% and a half in 2010.
Moderate. Server investment will be restrained further more.

96 #222605 ©2010 IDC
T A B L E 3 3
K e y F o r e c a s t A s s u m p t i o n s f o r t h e W o r l d w i d e , U . S . , W e s t e r n E u r o p e , J a p a n , A s i a / P a c i f i c , C a n a d a , a n d R e s t o f W o r l d S e r v e r M a r k e t s , 2 0 1 0 – 2 0 1 4
Country or Region/Market Force IDC Assumption Impact
Accelerator/ Inhibitor/ Neutral
Certainty of Assumption
Economic growth— 2011 or later
The Japanese government has drawn up the new growth strategy, which would stimulate the Japanese economy, defining environment, energy, healthcare, and Asia partnership as new growth areas. However, its effectiveness will be limited because there are significant issues involving public finance and the population. The growth engine of the world economy that surrounds Japan has shifted from the advanced countries to the emerging countries. And because the world economy has shifted to the status that is referred to as "new normal" and grows gradually as a whole, the Japanese foreign demands will stay in lower level than the past. Though the Japanese economy's growth rate against the previous year will be plus, it will be around 1% and in a lower level than the rate before the world economy crisis.
Moderate. The Japan server market will indicate a small growth until 2013. In 2014, it will have negative growth because of the server replacement timing from 2009.
New IT innovation strategy
IT investment related to the "New IT Innovation Strategy"project will be carried out.
Moderate. Server demand will be expanded by investment in the electronic government initiative by central government organs.

©2010 IDC #222605 97
T A B L E 3 3
K e y F o r e c a s t A s s u m p t i o n s f o r t h e W o r l d w i d e , U . S . , W e s t e r n E u r o p e , J a p a n , A s i a / P a c i f i c , C a n a d a , a n d R e s t o f W o r l d S e r v e r M a r k e t s , 2 0 1 0 – 2 0 1 4
Country or Region/Market Force IDC Assumption Impact
Accelerator/ Inhibitor/ Neutral
Certainty of Assumption
R&D investment by government
The Japanese government will actively make R&D investment.
Low. The R&D investment by national universities and research institutes will generate new demand for servers.
Technology developments
Improvement of processor performance
The processors for servers will continue to improve performance at the same pace as before. As a result, the cost performance of servers will be improved.
High. For most Japanese users, the pace at which processor performance improves is faster than the pace at which the workload of their servers increases. Therefore, they tend to reduce server investments when replacing existing servers.
x86 processor The x86 processor will continue to strengthen. The price performance of x86 servers will be improved continuously.
High. The demand shift to x86 servers from RISC-based servers will be promoted, and the server investment of users will decrease. Moreover, the demand for EPIC-based servers also will be limited.
x86 cluster system
The x86 cluster system will be adopted by HPC customers.
Low. New demand for x86 servers will be generated in the HPC segment. At the same time, the demand shift to x86 cluster systems from high-end RISC-based servers will be promoted, and the server investment of users will decrease.
Server virtualization
The server virtualization technology for x86/EPIC platforms will mature and be accepted.
Low. Server consolidation of Windows and Linux systems will be accelerated. This will make user investment smaller.

98 #222605 ©2010 IDC
T A B L E 3 3
K e y F o r e c a s t A s s u m p t i o n s f o r t h e W o r l d w i d e , U . S . , W e s t e r n E u r o p e , J a p a n , A s i a / P a c i f i c , C a n a d a , a n d R e s t o f W o r l d S e r v e r M a r k e t s , 2 0 1 0 – 2 0 1 4
Country or Region/Market Force IDC Assumption Impact
Accelerator/ Inhibitor/ Neutral
Certainty of Assumption
Acceptance of Linux for mission-critical systems
The high-availability feature of Linux will improve, and vendors will offer more rich support for Linux. Then, Linux will cover a wider range of workloads including mission-critical enterprise systems.
Low. Server investments of users will decrease due to the shift in demand from RISC Unix servers to x86/EPIC Linux servers.
Market characteristics
Escalation of competition
Competition among server vendors will intensify.
High. The price competition will intensify, and the price of server products will decrease.
Market domination by total vendors
The Japanese server market is dominated by "total vendors,"which have full product lineups from mainframe to x86 — such as Fujitsu, IBM, Hitachi, and NEC. That is why the concept of "proprietary system vendor versus open system vendor,"which is a natural concept overseas, does not exist. As a result, the market structure makes it difficult for open systems to compete directly with proprietary systems, and the transition to open systems is slower than in other regions. This market structure will remain unchanged in the future.
Moderate. The shift to open systems from proprietary systems such as mainframe will be limited, and server investments by users will remain high.
Persistent demand for mainframe
The demand for mainframe is strong in Japan, and the situation will remain the same for a while.
Moderate. The shift to open systems from proprietary systems such as mainframe will be limited, and server investments by users will remain high.
Consumption
Need to reduce costs
Japanese companies are increasingly feeling the need to restrain IT investment, and this trend will continue.
High. Server investments will decrease due to the shift in demand for lower-priced servers.

©2010 IDC #222605 99
T A B L E 3 3
K e y F o r e c a s t A s s u m p t i o n s f o r t h e W o r l d w i d e , U . S . , W e s t e r n E u r o p e , J a p a n , A s i a / P a c i f i c , C a n a d a , a n d R e s t o f W o r l d S e r v e r M a r k e t s , 2 0 1 0 – 2 0 1 4
Country or Region/Market Force IDC Assumption Impact
Accelerator/ Inhibitor/ Neutral
Certainty of Assumption
Replacement of existing systems
The replacement timing of existing systems will be changed by the economic slowdown in 2009.
High. There will be negative growth in 2014. Because it's the replacement cycle for many servers that sent out in 2009.
Replacement timing shift
In 2009, some replacement demand will shift to 2010 or later due to the economic slowdown.
High. The replacement demand for x86 servers in 2009 will be shifted to 2010 or later.
Installed x86 server units decreasing
Installed x86 server units will decrease due to the economic slowdown.
High. The replacement demand for x86 servers after 2009 will be decreased.
Spread of broadband network
Infrastructure for broadband networks will improve. Service for broadband customers will increase.
Moderate. Carriers and service providers will increase server investments.
SMB The economic slowdown will have a negative impact on the IT investments of SMBs.
Moderate. The demand for servers will be restrained in the SMB segment in 2010.
Server consolidation
Server consolidation will continue and be made more widely.
Moderate. Server consolidation will make users' investments smaller.
RFID and IC tags Traceability systems using RFID or IC tags will be developed.
Low. New demand for servers will be created.

100 #222605 ©2010 IDC
T A B L E 3 3
K e y F o r e c a s t A s s u m p t i o n s f o r t h e W o r l d w i d e , U . S . , W e s t e r n E u r o p e , J a p a n , A s i a / P a c i f i c , C a n a d a , a n d R e s t o f W o r l d S e r v e r M a r k e t s , 2 0 1 0 – 2 0 1 4
Country or Region/Market Force IDC Assumption Impact
Accelerator/ Inhibitor/ Neutral
Certainty of Assumption
Asia/Pacific (excluding Japan)
Macroeconomics and political assumptions
Economic growth The economic growth outlook for 2010 for Asia/Pacific countries has improved significantly, underpinned by stronger-than-expected GDP growth in 2H09.
High. IDC believes server spending recovery that started in 4Q09 should sustain well underpinned by healthy economic growth projections for 2010 for most countries across the region. Spending should be fairly broad based, although enterprises and public sector customers should be slightly more bullish with their investment decisions.
Economic growth China's GDP is expected to sustain more than 9%+ growth in 20010–2012, albeit at a much slower pace compared with the double-digit growth since the mid-2000s. The Chinese government's US$500+ billion stimulus plan to pump prime the economy will continue to have a positive impact on catalyzing the domestic demand to propel the economy.
High. IDC believes the Chinese government's economic stimulus plan will have a positive impact on server demand across verticals —government, education, utilities, health, and transportation segments. The stimulus package will have a much stronger impact in 2010
Economic growth The export-driven economies of Singapore, Hong Kong, Korea, and Taiwan, which suffered sharp declines in GDP since late 2008, are experiencing a strong recovery fuelled by healthy growth in external demand for manufactured products.
Moderate. IDC expects the spending to rebound the fastestin the financial services segment. Manufacturing segment spending may not completely rebound until 2Q20–3Q10.

©2010 IDC #222605 101
T A B L E 3 3
K e y F o r e c a s t A s s u m p t i o n s f o r t h e W o r l d w i d e , U . S . , W e s t e r n E u r o p e , J a p a n , A s i a / P a c i f i c , C a n a d a , a n d R e s t o f W o r l d S e r v e r M a r k e t s , 2 0 1 0 – 2 0 1 4
Country or Region/Market Force IDC Assumption Impact
Accelerator/ Inhibitor/ Neutral
Certainty of Assumption
Global economic recovery and demand for electronics and IT products
Although global demand for semiconductor and consumer electronic products is on the rebound, consumer sentiment in the OECD countries has shown only a modest improvement which means that demand levels may not reach the 2007–2008 peak until the latter half of 2010.
High. High-tech manufacturing segment IT spending maybe slow to recover with modest growth in countries such as Korea and Taiwan in 1H10. IT spending rebound will be led by LCD manufacturers due to the strong demand for flat-panel TVs and the increased adoption of LCD displays in a myriad of consumer and industrial devices.
Technology developments
Form factor changes
x86 blade server adoption will accelerate in 2010 due to the growing need for infrastructure simplification and the increased adoption of virtualization to use as a means for operational cost reduction.
High. Blades will witness strong growth across vertical segments, especially from the financial services, telecom, and government segments. The compelling cost savings will help drive increased adoption even among the SMB/midmarket customers in 2010.
Processor performance improvements
Introduction of next-generation multicore CPUs such as Nehalem EX/Westmere from Intel and AMD's Magny Cour processor should help catalyze x86 technology refresh cycles in 2Q10 that should extend well into 2011.
Moderate. The introduction of 8+ core x86 server processors, the ability to have more dense memory feature set, and the growing interest in virtualization will help accelerate the demand for four/eight-socket x86 servers. Windows server 2008 refresh will provide additional impetus.

102 #222605 ©2010 IDC
T A B L E 3 3
K e y F o r e c a s t A s s u m p t i o n s f o r t h e W o r l d w i d e , U . S . , W e s t e r n E u r o p e , J a p a n , A s i a / P a c i f i c , C a n a d a , a n d R e s t o f W o r l d S e r v e r M a r k e t s , 2 0 1 0 – 2 0 1 4
Country or Region/Market Force IDC Assumption Impact
Accelerator/ Inhibitor/ Neutral
Certainty of Assumption
Chip or CPU type dynamics —RISC
RISC and EPIC server platforms running legacy applications will be under intense pressure at the low end as companies look to pare costs by deploying multicore x86 servers and growing the number of traditional Unix applications available for Windows and Linux.
Moderate. Strong demand for Unix for mission-critical workloads, especially vertical applications across the telecom and finance segments, will help sustain the mid- to long-term demand for RISC processor–based systems. IDC expects mobile telecom operators to maintain their Unix environments to run BSS and OSS systems.
Chip or CPU type dynamics —RISC
IDC expects IBM and Oracle/Sun will continue to vigorously defend their market positions in the RISC/Unix by offering even more competitively priced RISC/Unixservers while continuing to raise the performance bar.
Moderate. IDC expects some customers/workloads to migrate over to x86 servers, especially those running on low-end Unix systems. However, the large installed base is expected to maintain their Unix server investments in the mid- to long term.
Chip or CPU type dynamics — Intel
The overall Itanium shipment numbers will continue to grow in 2010 underpinned by the introduction of Intel's next-generation quad-core Tukwila — Itanium 9300 processor.
Moderate. IDC has tempered the overall outlook for EPIC servers in Asia/Pacific due to lackluster customer response to EPIC servers for running workloads on non-Unix OS such as Windows and Linux.
Chip or CPU type dynamics —CISC
IBM's zSeries is the biggest proponent of CISC-based systems in Asia/Pacific, and its market will be largely restricted to the finance segment, although opportunities exist in the insurance, public sector, transportation and telecom segments, especially in large untapped markets of China, India and Vietnam.
Moderate. IDC believes that System z will continue to sustain its installed base well through the forecast period, although it will lose some ground to Unix, especially in instances where customers are not seeing a significant business value in maintaining their investments in mainframe infrastructure or cost of support/maintenance is prohibitive.

©2010 IDC #222605 103
T A B L E 3 3
K e y F o r e c a s t A s s u m p t i o n s f o r t h e W o r l d w i d e , U . S . , W e s t e r n E u r o p e , J a p a n , A s i a / P a c i f i c , C a n a d a , a n d R e s t o f W o r l d S e r v e r M a r k e t s , 2 0 1 0 – 2 0 1 4
Country or Region/Market Force IDC Assumption Impact
Accelerator/ Inhibitor/ Neutral
Certainty of Assumption
Software development
Local software development in PRC, India, Australia, and Vietnam, among other markets, will help drive increased adoption of enterprise applications in the midmarket space.
High. More and more vendors are partnering with local ISVs to leverage them for selling into the SMB segment.
Chip type and operating system developments —Intel
Windows continues to loom large in the x86 server market, with Linux picking up momentum in niche segments such as the HPC and business workloads. Linux penetration for commercial workloads remains moderate due to lack of ISV support, apart from ongoing maintenance and support issues.
Moderate. Acceptability of Linux as a mainstream server OS platform continues to improve. In addition, Linux will gain traction in segments such as finance, government, and retail/distribution where servers may need to be deployed in a distributed environment.
Market characteristics
Market dynamics — long-term Asia/Pacific
IDC believes the Asia/Pacific server market will suffer the least negative impact of the global financial and economic crisis due to large nascent IT spending opportunities in India and the PRC that have huge upside potential for investment across the various vertical markets.
High. With PRC leading the growth, we expect a strong possibility for spending across Asia/Pacific countries to rebound quickly, driven by infrastructure and collaborative workloads, telecom and wireless, core banking and multichannel delivery of banking services, e-enablement, BI, production, oil exploration, and life sciences that will be among the major drivers of growth in the region.

104 #222605 ©2010 IDC
T A B L E 3 3
K e y F o r e c a s t A s s u m p t i o n s f o r t h e W o r l d w i d e , U . S . , W e s t e r n E u r o p e , J a p a n , A s i a / P a c i f i c , C a n a d a , a n d R e s t o f W o r l d S e r v e r M a r k e t s , 2 0 1 0 – 2 0 1 4
Country or Region/Market Force IDC Assumption Impact
Accelerator/ Inhibitor/ Neutral
Certainty of Assumption
Consumption The telecom segment will remain strong through the forecast period due to low penetration of mobile telecom services in large markets such as China, India, Indonesia, Thailand, and Vietnam. Banks will continue to invest in z/OSand i5/OS for upgrade and replacement of core banking infrastructure to support the growing retail and corporate banking businesses. Credit card services, smart cards, channel integration, business intelligence, and CRM applications will be key drivers of demand in Korea, Hong Kong, Singapore, and Australia in the midterm.
Moderate. IDC expects spending potential across the financial services and telecom segments across most markets in Asia/Pacific to remain strong. In the short term, telecom service providers may pull back their spending on BSS/OSS workloads since they are not necessarily revenue-generating initiatives, but long-term potential remains strong.

©2010 IDC #222605 105
T A B L E 3 3
K e y F o r e c a s t A s s u m p t i o n s f o r t h e W o r l d w i d e , U . S . , W e s t e r n E u r o p e , J a p a n , A s i a / P a c i f i c , C a n a d a , a n d R e s t o f W o r l d S e r v e r M a r k e t s , 2 0 1 0 – 2 0 1 4
Country or Region/Market Force IDC Assumption Impact
Accelerator/ Inhibitor/ Neutral
Certainty of Assumption
Canada
Macroeconomics
World economy The August survey of economists by Consensus Economics predicts worldwide real GDP will decline by 2.5% in 2009 after growing by 2.0% in 2008. Real GDP growth for 2010 is expected to be 2.3%, which will match the growth in 2008.
High. Global economic growth is decelerating quickly, and expectations have been rapidly revised downward over the past few months. According to an August poll of economists by Consensus Economics, worldwide real GDP is expected to decline by 2.5% in 2009, a significant downward revision from the expected growth rate of 2.6% last November. Most of the mature economies are seeing a greater decline and will experience negative real GDP growth in 2009. Emerging economies are expected to have continued growth, albeit at a lower rate. While there is not a complete decoupling of the U.S. and other world economies, there is less of a direct correlation than in the past. This is a positive development overall as, even though we see negative growth in mature markets, the moderating effect of this balance will help keep some level of positive growth for multinational corporations, including those that are headquartered in the United States and Canada.

106 #222605 ©2010 IDC
T A B L E 3 3
K e y F o r e c a s t A s s u m p t i o n s f o r t h e W o r l d w i d e , U . S . , W e s t e r n E u r o p e , J a p a n , A s i a / P a c i f i c , C a n a d a , a n d R e s t o f W o r l d S e r v e r M a r k e t s , 2 0 1 0 – 2 0 1 4
Country or Region/Market Force IDC Assumption Impact
Accelerator/ Inhibitor/ Neutral
Certainty of Assumption
GDP According to Consensus Economics, as of February 2010, GDP growth for 2010 and 2011, respectively, is as follows: Canada — 2.7% and 3.2%; United States — 3.1% and 3.0%.
High. The Canadian economy has been in recession since fourth quarter of 2008. GDP was down 2.5% in 2009 and is expected to be positive growth in 2010. There is considerable debate about the strength of the recovery in 2010, with the forecast ranging from 2.5% to 4.0%, against a consensus of 2.7%.
Inflation According to Consensus Economics, as of February 2010, the inflation rates for 2010 and 2011, respectively, are as follows: Canada — 1.8% and 2.2%; United States —2.3% and 2.0%.
Moderate. The Consensus Economics estimate for inflation (measured by the change in consumer price index [CPI]) for 2009 is 0.3%, which is below the 1–3% band targeted by the Bank of Canada. However, a large part of the decline in CPI can be attributed to falling energy prices. Core CPI is expected to remain more stable. The higher U.S. dollar is increasing costs of imports and driving up inflation; however, the slower domestic demand will have a moderating effect on inflation compared with a year ago. With the slowdown, there is less concern with inflation than there was even six months ago.

©2010 IDC #222605 107
T A B L E 3 3
K e y F o r e c a s t A s s u m p t i o n s f o r t h e W o r l d w i d e , U . S . , W e s t e r n E u r o p e , J a p a n , A s i a / P a c i f i c , C a n a d a , a n d R e s t o f W o r l d S e r v e r M a r k e t s , 2 0 1 0 – 2 0 1 4
Country or Region/Market Force IDC Assumption Impact
Accelerator/ Inhibitor/ Neutral
Certainty of Assumption
Interest rates According to Consensus Economics, as of February 2010, interest rates for the end of May 2010 and the end of February 2011, respectively, are as follows: three-month treasury bills — 0.4% and 1.5%; 10-year government bonds — 3.7% and 4.1%.
Moderate. The last interest rate cut by the Bank of Canada brought the target for the overnight rate down to 0.25%, a significant drop from the 4% target set in January 2008. The November consensus poll of economists also showed that most economists expect interest rates to remain at this level until March 2010. While fears of inflation remain low, this will provide an economic stimulus that will help the economy recover.
Foreign exchange
The Canadian currency is in a period of wild fluctuations as the world economy seeks to, on the one hand, unwind and write off the bad debt on the books of the United States and other global financial institutions —mostly held in U.S. dollars —and, on the other hand, tries to protect the massive amounts of U.S. dollar–based investments made by the emerging (China) and commodity-based (OPEC) countries. We expect to see big changes up and down in currency — that is about as much as we can predict. The only other anchor is that when the loonie was in the high $0.90 range, it was likely too high to be sustainable, and in the $0.70 range, it is too low. Purchasing power parity for the Canadian dollar is like in the mid-$0.80 range.
Low. Export-oriented sectors, especially the auto and forest industries (which account for 25% of exports), were notably weak in 2009. While the currency is in this state of fluctuation, the impact to the ICT sector is not likely to be great. Not until there is some stability to the exchange rate will it perhaps be a factor in decision making for ICT investments, but at this point there are far greater issues to deal with regarding consumer confidence, global demand, and global commodity prices.

108 #222605 ©2010 IDC
T A B L E 3 3
K e y F o r e c a s t A s s u m p t i o n s f o r t h e W o r l d w i d e , U . S . , W e s t e r n E u r o p e , J a p a n , A s i a / P a c i f i c , C a n a d a , a n d R e s t o f W o r l d S e r v e r M a r k e t s , 2 0 1 0 – 2 0 1 4
Country or Region/Market Force IDC Assumption Impact
Accelerator/ Inhibitor/ Neutral
Certainty of Assumption
Consumer confidence
The Conference Board of Canada's consumer confidence survey showed consumer confidence rose in August; this marks the sixth consecutive monthly survey in which consumer confidence has risen. It is now at it highest level since April 2008.
High. Consumer spending represents over 60% of total GDP. When there is a decline in consumer confidence, purchases are delayed, which has an immediate impact on the economy. A consumer's first reaction may be to save instead of spending, which has a sudden impact on business results and business confidence. A prolonged cycle of declining consumer confidence will drive a prolonged decline in business confidence. The resulting outcome is that not only will there be less economic activity, but also the resulting business declines will impact the unemployment rate, which will further impact spending. In that scenario, there will not be a savings component to the consumer decline, which could have a greater impact on the longer-term recovery of the economy.

©2010 IDC #222605 109
T A B L E 3 3
K e y F o r e c a s t A s s u m p t i o n s f o r t h e W o r l d w i d e , U . S . , W e s t e r n E u r o p e , J a p a n , A s i a / P a c i f i c , C a n a d a , a n d R e s t o f W o r l d S e r v e r M a r k e t s , 2 0 1 0 – 2 0 1 4
Country or Region/Market Force IDC Assumption Impact
Accelerator/ Inhibitor/ Neutral
Certainty of Assumption
Housing demand The housing market is slowing. Consensus Economics forecasts 173,000 housing starts in 2010 and 177,000 in 2011, down from 211,000 in 2008 but up from 149,000 in 2009. Most forecasts are predicting that housing prices will decline in 2009, although there are differing opinions on the size of the decline.
Moderate. Housing demand will be very dependent on employment. With unemployment rates expected to increase in 2010, housing starts will be impacted. Further declines in consumer confidence, and the decrease in home prices, will delay even those buyers who could afford to buy a home as they wait for the prices to go down further. This hesitancy to purchase homes will affect new housing demands as the number of new buyers entering the market declines, therefore impacting the overall cycle driving new home purchases. There is spirited debate among economists about whether Canada will follow the U.S. housing market path with a two-year time lag. The IDC forecast assumptions follow the more moderate economic view as Canadian homeowners are less leveraged than U.S. homeowners. Any significant drop in housing prices will impact negatively on consumer confidence.
Technology/service developments
x86 chip type Improvements in features and functionality of x86 multicore servers will give buyers additional choice in midrange servers.
High. There will be further x86 adoption in segments and workloads that were traditionally the domain of RISC-based servers.

110 #222605 ©2010 IDC
T A B L E 3 3
K e y F o r e c a s t A s s u m p t i o n s f o r t h e W o r l d w i d e , U . S . , W e s t e r n E u r o p e , J a p a n , A s i a / P a c i f i c , C a n a d a , a n d R e s t o f W o r l d S e r v e r M a r k e t s , 2 0 1 0 – 2 0 1 4
Country or Region/Market Force IDC Assumption Impact
Accelerator/ Inhibitor/ Neutral
Certainty of Assumption
Form factor —blade server
Large customers continue to adopt blades. SMB adoption will continue as SMBs start seeing the benefits of blades due to market education and lower price points, but vendors will still need to overcome the perceived price premium associated with blades.
Moderate. Vendors may need to fine-tune their positioning for this segment to speed adoption and allocate additional resources to channel partners as SMBs tend to purchase from them.
Power and cooling
Energy costs associated with computing infrastructure will become a more important consideration for server purchase.
Moderate. Buyers look to server models that offer lower energy cost.
EPIC servers EPIC will continue to be supported by HP, Intel, and ISVs, with over 11,000 applications now available for EPIC.
Moderate. The continued support and investment by the IT community will help mitigate any fears that users have about moving to a new platform.
Market characteristics
Server life cycle The tightening credit availability and the general decline in business confidence may lead to an increase in life cycle of servers.
Moderate. This will have a negative impact on replacement server shipments.

©2010 IDC #222605 111
T A B L E 3 3
K e y F o r e c a s t A s s u m p t i o n s f o r t h e W o r l d w i d e , U . S . , W e s t e r n E u r o p e , J a p a n , A s i a / P a c i f i c , C a n a d a , a n d R e s t o f W o r l d S e r v e r M a r k e t s , 2 0 1 0 – 2 0 1 4
Country or Region/Market Force IDC Assumption Impact
Accelerator/ Inhibitor/ Neutral
Certainty of Assumption
Virtualization and multicore
Virtualization and multicore servers continue to gain momentum in the market. As the value proposition moves beyond consolidation, they will gain increasing penetration in the SMB segment.
Moderate. Virtualization will be a significant factor in enabling organizations to reduce the number of servers required. Along with consolidation initiatives, the market will slowly migrate to more richly configured servers running multiple platforms and/or applications. The result will be muted shipment growth. But this change is not expected to lead to significant increase in average selling price for these servers because of increased competitive pressures and lower pricing for components.
ROW — Latin America
Macroeconomics and political assumptions
Economy: Argentina
Budgets postponed in 2009, it must necessarily be executed.
High. Delayed investment projects will be done during 2010.
Economy: Argentina
Government has trouble raising money.
Moderate. Unstable markets behave.
Economy: Argentina
Government budget has been increased.
High. Decision makers may create new investment projects.
Economy: Argentina
Although there will be little room for policy stimulus, GDP growth should recover gradually in 2010–2011, assuming that strong demand from Argentina's main markets, Brazil and China, supports export-oriented activity.
High. Export-oriented industries may show signs of recovery during 2010.

112 #222605 ©2010 IDC
T A B L E 3 3
K e y F o r e c a s t A s s u m p t i o n s f o r t h e W o r l d w i d e , U . S . , W e s t e r n E u r o p e , J a p a n , A s i a / P a c i f i c , C a n a d a , a n d R e s t o f W o r l d S e r v e r M a r k e t s , 2 0 1 0 – 2 0 1 4
Country or Region/Market Force IDC Assumption Impact
Accelerator/ Inhibitor/ Neutral
Certainty of Assumption
Economy: Argentina
Weak capital inflows and a rise in the import bill will produce further peso depreciation in 2010–2011, but the pace of depreciation is expected to slow from 2009 levels. There are, however, risks of capital flight and peso overshooting.
High. Imported goods will show an increase of prices in local currency because of the depreciation.
Economy: Argentina
The upward trend in prices is a reflection of recent currency depreciation, still-strong public expenditure, and rising commodity prices. Combined with strong base effects, we expect these factors to push inflation up to 7.6% at year-end.
High. High inflation undermines the external investment and affects the local demand.
Economy: Brazil The foreign investments that increased in the last quarter has impacted the exchange rates.
High. The strengthen of real currency is allowing the purchase of imported equipment at lower prices.
Economy: Brazil Public enterprises will increase their investment on infrastructure about 37% between 2010 and 2013 (compared with 2005–2008).
High. The utilities segment will increase IT investments. (electricity and telecommunications mostly)
Economy: Brazil Important laboratories plan to have heavy investments in Brazil in 2010.
Moderate. The segment of generic drugs has received special attention of large multinational companies. There are opportunities for IT.
Economy: Brazil A main retail store will invest important amount in Brazil in 2010. The plan includes the opening up of 100–110 new stores in the country.
High. The server market will benefit because they will need to increase IT infrastructure investments.
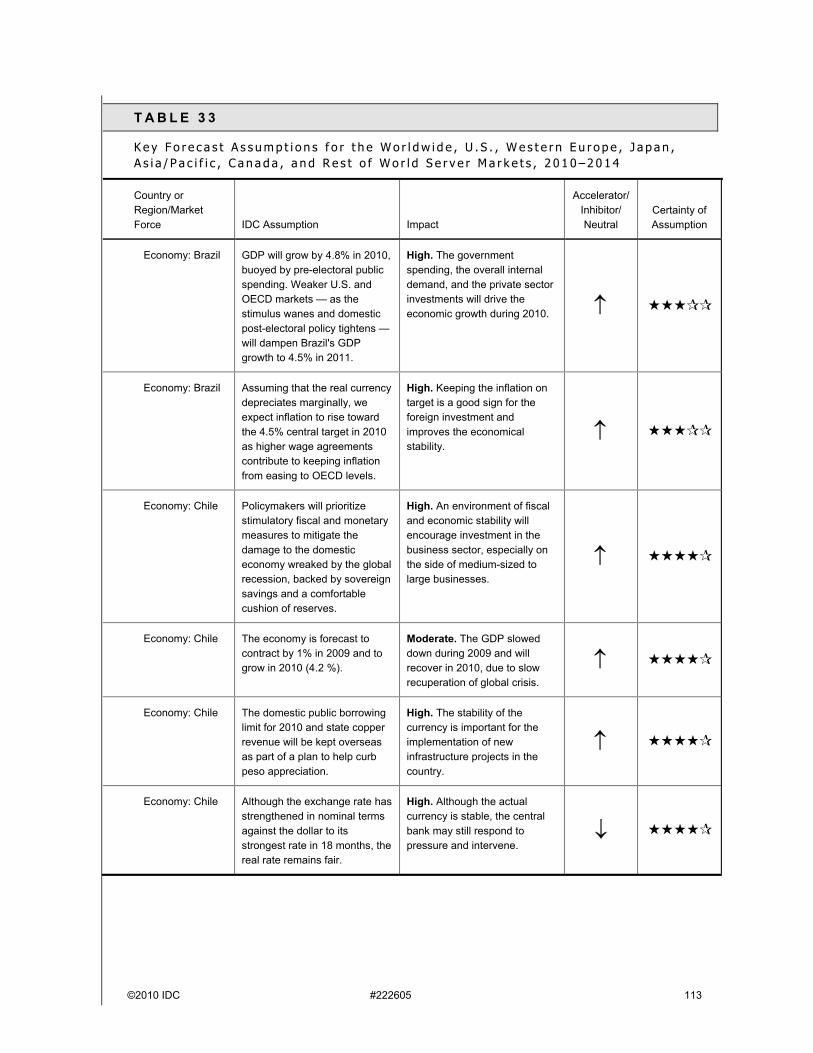
©2010 IDC #222605 113
T A B L E 3 3
K e y F o r e c a s t A s s u m p t i o n s f o r t h e W o r l d w i d e , U . S . , W e s t e r n E u r o p e , J a p a n , A s i a / P a c i f i c , C a n a d a , a n d R e s t o f W o r l d S e r v e r M a r k e t s , 2 0 1 0 – 2 0 1 4
Country or Region/Market Force IDC Assumption Impact
Accelerator/ Inhibitor/ Neutral
Certainty of Assumption
Economy: Brazil GDP will grow by 4.8% in 2010, buoyed by pre-electoral public spending. Weaker U.S. and OECD markets — as the stimulus wanes and domestic post-electoral policy tightens —will dampen Brazil's GDP growth to 4.5% in 2011.
High. The government spending, the overall internal demand, and the private sector investments will drive the economic growth during 2010.
Economy: Brazil Assuming that the real currency depreciates marginally, we expect inflation to rise toward the 4.5% central target in 2010 as higher wage agreements contribute to keeping inflation from easing to OECD levels.
High. Keeping the inflation on target is a good sign for the foreign investment and improves the economical stability.
Economy: Chile Policymakers will prioritize stimulatory fiscal and monetary measures to mitigate the damage to the domestic economy wreaked by the global recession, backed by sovereign savings and a comfortable cushion of reserves.
High. An environment of fiscal and economic stability will encourage investment in the business sector, especially on the side of medium-sized to large businesses.
Economy: Chile The economy is forecast to contract by 1% in 2009 and to grow in 2010 (4.2 %).
Moderate. The GDP slowed down during 2009 and will recover in 2010, due to slow recuperation of global crisis.
Economy: Chile The domestic public borrowing limit for 2010 and state copper revenue will be kept overseas as part of a plan to help curb peso appreciation.
High. The stability of the currency is important for the implementation of new infrastructure projects in the country.
Economy: Chile Although the exchange rate has strengthened in nominal terms against the dollar to its strongest rate in 18 months, the real rate remains fair.
High. Although the actual currency is stable, the central bank may still respond to pressure and intervene.

114 #222605 ©2010 IDC
T A B L E 3 3
K e y F o r e c a s t A s s u m p t i o n s f o r t h e W o r l d w i d e , U . S . , W e s t e r n E u r o p e , J a p a n , A s i a / P a c i f i c , C a n a d a , a n d R e s t o f W o r l d S e r v e r M a r k e t s , 2 0 1 0 – 2 0 1 4
Country or Region/Market Force IDC Assumption Impact
Accelerator/ Inhibitor/ Neutral
Certainty of Assumption
Economy: Colombia
The local economy is showing a recovery in exports and a good flow of foreign investment into the oil sector. In late 2009, it became apparent that a slight recovery in the industrial sector caused an increase in the level of consumer confidence.
High. There will be a higher level of investment.
Economy: Colombia
After an above-average performance in 2009. GDP will grow by 2.5% in 2010 and 3.5% in 2011.
Low. The economic recovery will be moderate in 2010–2011, although this recovery will be limited by a slow consumer demand and exports.
Economy: Colombia
After a relatively volatile 2009, the exchange rate should depreciate slightly during the outlook period to Ps2,053:US$1 by year-end 2011.
High. The stability of the currency benefits importers and attracts private investment; on the other hand, the exporters will be affected as they will have less money and theircosts are in local currency.
Economy: Colombia
The free trade agreement (FTA) with the United States should come into force; if not, the Andean Trade-Promotion and Drug-Eradication Act will be extended. Colombia should also make some gains diversifying its export markets to Central America, Europe, and Asia.
High. If the free trade agreement with the United States is not ratified, it would be mitigated diversifying its export markets to Central America, Europe, and Asia.
Economy: Colombia
Level of violence and organized crime associated with the internal conflict and drug trafficking has decreased, although it remains high by international standards.
Moderate. The insecurity within the country always has a negative effect on the foreign investment.
Economy: Mexico
Because of the weak tax reform, optimal conditions for investment are not been generated.
Moderate. There is lower spending in communications infrastructure by increasing taxes and a decrease in consumer confidence.
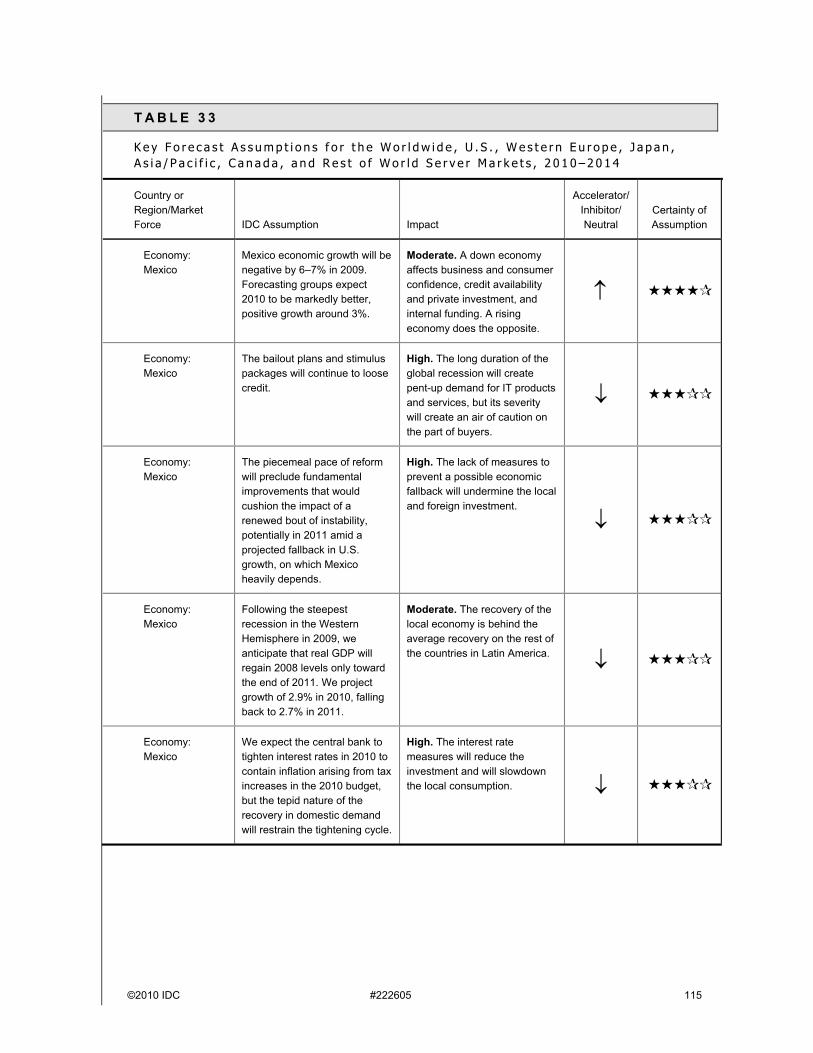
©2010 IDC #222605 115
T A B L E 3 3
K e y F o r e c a s t A s s u m p t i o n s f o r t h e W o r l d w i d e , U . S . , W e s t e r n E u r o p e , J a p a n , A s i a / P a c i f i c , C a n a d a , a n d R e s t o f W o r l d S e r v e r M a r k e t s , 2 0 1 0 – 2 0 1 4
Country or Region/Market Force IDC Assumption Impact
Accelerator/ Inhibitor/ Neutral
Certainty of Assumption
Economy: Mexico
Mexico economic growth will be negative by 6–7% in 2009. Forecasting groups expect 2010 to be markedly better, positive growth around 3%.
Moderate. A down economy affects business and consumer confidence, credit availability and private investment, and internal funding. A rising economy does the opposite.
Economy: Mexico
The bailout plans and stimulus packages will continue to loose credit.
High. The long duration of the global recession will create pent-up demand for IT products and services, but its severity will create an air of caution on the part of buyers.
Economy: Mexico
The piecemeal pace of reform will preclude fundamental improvements that would cushion the impact of a renewed bout of instability, potentially in 2011 amid a projected fallback in U.S. growth, on which Mexico heavily depends.
High. The lack of measures to prevent a possible economic fallback will undermine the local and foreign investment.
Economy: Mexico
Following the steepest recession in the Western Hemisphere in 2009, we anticipate that real GDP will regain 2008 levels only toward the end of 2011. We project growth of 2.9% in 2010, falling back to 2.7% in 2011.
Moderate. The recovery of the local economy is behind the average recovery on the rest of the countries in Latin America.
Economy: Mexico
We expect the central bank to tighten interest rates in 2010 to contain inflation arising from tax increases in the 2010 budget, but the tepid nature of the recovery in domestic demand will restrain the tightening cycle.
High. The interest rate measures will reduce the investment and will slowdown the local consumption.

116 #222605 ©2010 IDC
T A B L E 3 3
K e y F o r e c a s t A s s u m p t i o n s f o r t h e W o r l d w i d e , U . S . , W e s t e r n E u r o p e , J a p a n , A s i a / P a c i f i c , C a n a d a , a n d R e s t o f W o r l d S e r v e r M a r k e t s , 2 0 1 0 – 2 0 1 4
Country or Region/Market Force IDC Assumption Impact
Accelerator/ Inhibitor/ Neutral
Certainty of Assumption
Economy: Mexico
We expect the Mexican peso to weaken from its current value of Ps12.9:US$1 to Ps13.9:US$1 at year-end 2010. The pace of depreciation will be more marked in 2011, reflecting heightened risk perception, ending the year at Ps14:US$1.
High. The export-oriented industries will suffer from the depreciation of the local currency.
Economy: Mexico
We expect the current account deficit to widen from an estimated 0.6% of GDP in 2009 to 1.8% of GDP in 2010 and 2.7% of GDP in 2011.
High. The export-oriented industries are likely to have a slower recovery than the rest of the economic segments.
Economy: Peru Peru has implemented a comprehensive free trade agreement with China.
High. FTA with China will help support trade and investment flows, coupled with the current free trade agreements.
Economy: Peru Domestic demand is strengthened in the third quarter, allowing GDP to rise by a seasonally adjusted 1.8% quarter on quarter. Employment indicators have also improved, indicative of the recovery from the international crisis.
High. The local economy has been showing signs of recovery since the third quarter of 2009, and the recovery is expected to maintain its pace.
Economy: Peru Growth in mining export earnings has strengthened the trade surplus, contributing (along with continued falls in import spending) to a current account surplus.
High. Government and mining sectors will be willing to increase their infrastructure investment during the forecast year.
Economy: Venezuela
The government may be forced to use international reserves to maintain the same level of spending.
High. A decrease of international reserves may have an impact in local currency, increasing the exchange rates.

©2010 IDC #222605 117
T A B L E 3 3
K e y F o r e c a s t A s s u m p t i o n s f o r t h e W o r l d w i d e , U . S . , W e s t e r n E u r o p e , J a p a n , A s i a / P a c i f i c , C a n a d a , a n d R e s t o f W o r l d S e r v e r M a r k e t s , 2 0 1 0 – 2 0 1 4
Country or Region/Market Force IDC Assumption Impact
Accelerator/ Inhibitor/ Neutral
Certainty of Assumption
Economy: Venezuela
Following concerns about water shortages and power outages, the Ministry of Electricity has announced electricity rationing for businesses, heavy industry, housing complexes, and shopping malls, with fines for noncompliance.
High. Electricity rationing will undermine the investment situation of Venezuela.
Economy: Venezuela
Venezuela is implementing an expansionary monetary policy strategy: devaluing the currency and controlling and using different exchange rates according to business sectors.
High. Although there was more money injected in the economy, this measure caused panic among the consumers and forced them into buying any goods to prevent the further devaluation of the local currency.
Economy: Ecuador
Global oil prices will be higher. Moderate. While the recent rise in global oil prices is likely to have helped some sectors in 2Q09, falling business confidence outlined in the central bank's July survey suggests higher oil prices are not benefiting everyone.
Economy: Bolivia President Evo Morales's nationalization drive, in an attempt to increase state revenue from the country's abundant natural resources, may have undermined demand from the country's main export markets.
Moderate. The construction of two new LNG terminals in Brazil are testament to the risks facing Bolivia's key industry from Morales's policies. The recovery of water levels for hydroelectric dams in Brazil has also played a part in reducing demand for Bolivian gas.
Economy: Puerto Rico
Starting in 2010, it is looking to implement projects worth US$6.2 billion, focusing on new water infrastructure, power plants, ports, and roads.
High. It could pave the way for a much-needed boost to Puerto Rico's infrastructure, which has long been suffering from low levels of investment and has traditionally acted as a significant drag on the commonwealth's business environment.

118 #222605 ©2010 IDC
T A B L E 3 3
K e y F o r e c a s t A s s u m p t i o n s f o r t h e W o r l d w i d e , U . S . , W e s t e r n E u r o p e , J a p a n , A s i a / P a c i f i c , C a n a d a , a n d R e s t o f W o r l d S e r v e r M a r k e t s , 2 0 1 0 – 2 0 1 4
Country or Region/Market Force IDC Assumption Impact
Accelerator/ Inhibitor/ Neutral
Certainty of Assumption
Economy: Trinidad and Tobago
British major BP has started production at the Savonette gas field off the coast of Trinidad. The field is expected to produce 6.2 billion cubic meters (bcm) of gas per annum plus an unspecified amount of condensate.
High. Although new large-scale projects such as Savonette demonstrate Trinidad and Tobago (T&T)'s significant output upside potential, the country's security of demand, is threatened by slumping US gas import requirements.
Economy: Panama
While Panama's economy is benefiting from robust canal-related activity, other sectors are suffering from lower global demand and restrained access to credit.
High. The canal expansion project should continue lending impetus to headline growth, but failure to address slumping activity in agriculture and manufacturing risks creating a two tier economy, which could severely hurt growth after expansion completion in 2014.
Politics: Argentina
With opposition parties taking up their legislative majority in December 2009, the stage is set for a rise in political tension and legislative gridlock until the presidential poll in 2011. The risk of social unrest will remain high.
Moderate. The political stability may affect negatively the private investment.
Politics: Brazil Whichever candidate wins, broad macroeconomic policy continuity will prevail.
Moderate. Macroeconomic policy continuity is always appreciated by the foreign investors and private sector.
Politics: Chile The presidential elections were established on January 17, 2010, resulting winner Sebastian Piñera, by the coalition for change.
Moderate. Policy continuity generates stability with the same fiscal and economic policy, attracting domestic and foreign investment.
Politics: Mexico Notwithstanding ambitious reform proposals, the PRI (the main opposition party) will be unwilling to facilitate major legislative advances for the PAN government ahead of a presidential election in 2012.
Moderate. The political instability may affect negatively the private investment.

©2010 IDC #222605 119
T A B L E 3 3
K e y F o r e c a s t A s s u m p t i o n s f o r t h e W o r l d w i d e , U . S . , W e s t e r n E u r o p e , J a p a n , A s i a / P a c i f i c , C a n a d a , a n d R e s t o f W o r l d S e r v e r M a r k e t s , 2 0 1 0 – 2 0 1 4
Country or Region/Market Force IDC Assumption Impact
Accelerator/ Inhibitor/ Neutral
Certainty of Assumption
Politics: Peru After undershooting the target of 2% (plus or minus 1 percentage point) until the second quarter of 2010 owing to continued subdued domestic demand, we expect inflation to return to target, ending 2011 at 2.2%.
Moderate. The low inflation rates show a stable economic environment for local and foreign investments.
Politics: Venezuela
The state takeover of eight inadequately capitalized banks in late 2009 seems likely to augur an even more interventionist role by the government in the banking system, although a wholesale nationalization of the sector is unlikely.
High. Any forced intervention of the government in private-owned companies will scare the foreign investments and will promote the flight of capitals.
Technology/service developments
Market ecosystem: Argentina
2011 will be the electoral year, and there's no clear presidential successor.
High. The second- and third-quarter shipments will be affected.
Market Ecosystem: Brazil
Soccer World Cup in 2014 and the Olympic Games in 2016 (both happening in Brazil) will strongly boost infrastructure, commerce, and services investments in Brazil as well as encourage new foreign investments.
High. Both events will be particularly positive for IT Infrastructure/services companies, since they will execute most of the projects that will take place over the next years.
Market Ecosystem: Brazil
IT budget scrutiny and monitoring has increased in Brazilian companies. Global multinationals (especially the United States) with local presence also postponed their IT spending in 2009.
High. The volume of investments in IT will suffer a slowdown over the next two years.

120 #222605 ©2010 IDC
T A B L E 3 3
K e y F o r e c a s t A s s u m p t i o n s f o r t h e W o r l d w i d e , U . S . , W e s t e r n E u r o p e , J a p a n , A s i a / P a c i f i c , C a n a d a , a n d R e s t o f W o r l d S e r v e r M a r k e t s , 2 0 1 0 – 2 0 1 4
Country or Region/Market Force IDC Assumption Impact
Accelerator/ Inhibitor/ Neutral
Certainty of Assumption
Market Ecosystem: Brazil
A good portion of the IT spending in medium-sized, large, and enterprise Brazilian companies is no longer discretionary. Even bankrupt firms need to "keep the lights on" and run computer systems that support business processes.
High. IT investments will keep the market moving and showing positive growth.
Market Ecosystem: Brazil
Brazilian companies are turning to IT as a way to improve processes efficiency, product, and quality services, to meet international quality standards and keep their exportation healthy.
High. IT investments might become a high priority for most of the companies that assumed this strategic path, benefiting the Brazilian market and competitiveness on the long term.
Market Ecosystem: Brazil
The decrease on the IT budget of Brazilian companies will lead to a faster migration to some new technologies and services offerings such as virtualization, SaaS, IP-based telecom, enterprise Web 2.0 applications, and hosting infrastructure.
High. IT vendors and channels that quickly respond to this new market scenario, focusing on "cost reduction," will benefit of it.
Market Ecosystem: Venezuela
The expropriation of private enterprises will restrict investments of private banks.
High. Vendors focused on this sector will be affected.
Market Ecosystem: Venezuela
Due to the political-economic environment, private sector will invest only on the priority technological projects.
High. Investments horizon are very short due to restrictions. This inhibits large companies'projects.
Market Ecosystem: Venezuela
IT budget of the government might be approved by the vice president.
Moderate. Delays in approvals is provoking a delay over IT investments.
Market Ecosystem: Venezuela
The Bolivar devaluation is affecting private sector.
High. This will increase ASVs.

©2010 IDC #222605 121
T A B L E 3 3
K e y F o r e c a s t A s s u m p t i o n s f o r t h e W o r l d w i d e , U . S . , W e s t e r n E u r o p e , J a p a n , A s i a / P a c i f i c , C a n a d a , a n d R e s t o f W o r l d S e r v e r M a r k e t s , 2 0 1 0 – 2 0 1 4
Country or Region/Market Force IDC Assumption Impact
Accelerator/ Inhibitor/ Neutral
Certainty of Assumption
Market Ecosystem: Venezuela
CANTV will implement subscription television, the development of 3G network, and will offer broadband Internet with multiple technologies.
Moderate.Telecommunications investments will increase.
Market Ecosystem: Venezuela
PDVSA will approve IT pending projects due to a bigger budget.
Moderate. There will be recovery for sellers whose main customer is this company, which has been delaying their IT investments recently.
Specific market trends
Market dynamics — all Latin American countries
More players are increasing their presence in the blade market space.
High. Competitiveness will increase in blades and help increase the market value.
Market dynamics — all Latin American countries
An important vendor acquisition has been confirmed.
High. The final acquisition could help ease market pressure over the old brand, helping the CIO to make clear decisions around systems infrastructure.
Market dynamics — all Latin American countries
A new vendor is starting to offer servers in the region.
High. Competitiveness will increase in the higher segment of volume market. Unit shipment might be favored but value could be impacted.
Market dynamics — all Latin American countries
There will be an increase of datacenter infrastructure for 2010.
Moderate. There will be an increase of EPIC and RISC units for consolidation and services outsourcing.

122 #222605 ©2010 IDC
T A B L E 3 3
K e y F o r e c a s t A s s u m p t i o n s f o r t h e W o r l d w i d e , U . S . , W e s t e r n E u r o p e , J a p a n , A s i a / P a c i f i c , C a n a d a , a n d R e s t o f W o r l d S e r v e r M a r k e t s , 2 0 1 0 – 2 0 1 4
Country or Region/Market Force IDC Assumption Impact
Accelerator/ Inhibitor/ Neutral
Certainty of Assumption
Market dynamics — all Latin American countries
The major impact of green IT will be on technology choices based on low power, more attention to asset disposal, and some change in vendor selection. Depending on the country, voluntary adherence to green IT principles could become law.
High. The search for sustainability in areas outside IT will lead to opportunity for vendors. The adoption of green IT products and practices should increase demand for new IT products and services.
Market dynamics — all Latin American countries
Cloud services is becoming the next step of vendor's strategy.
High. The key advantage should be the ability of IT organizations to shift IT resources from maintenance to new initiatives. This could lead to the consolidation of the worldwide server installed base, which in turn would reduce the server energy expense.
Market dynamics — all Latin American countries
There are many processor and product announcement in 2010.
High. In 2010, the competitiveness in the market will be harder; this will push unit shipments.
Market dynamics — all Latin American countries
There are many processor and product announcement in 2010.
High. In 2010, the competitiveness in the market will be harder; this will put pressure over system prices (ASV).
Market dynamics — all Latin American countries
Virtualization trends are expanding toward more companies.
Moderate. The expansion over midsize companies will boost demand at first.
Market dynamics — all Latin American countries
Virtualization trends are expanding toward more companies.
Moderate. In long term, consolidation might affect shipment growth.
Market dynamics: Argentina
SMB companies are still immature in terms of IT infrastructure investment.
Moderate. SMB companies recovery will drive units shipments growth.
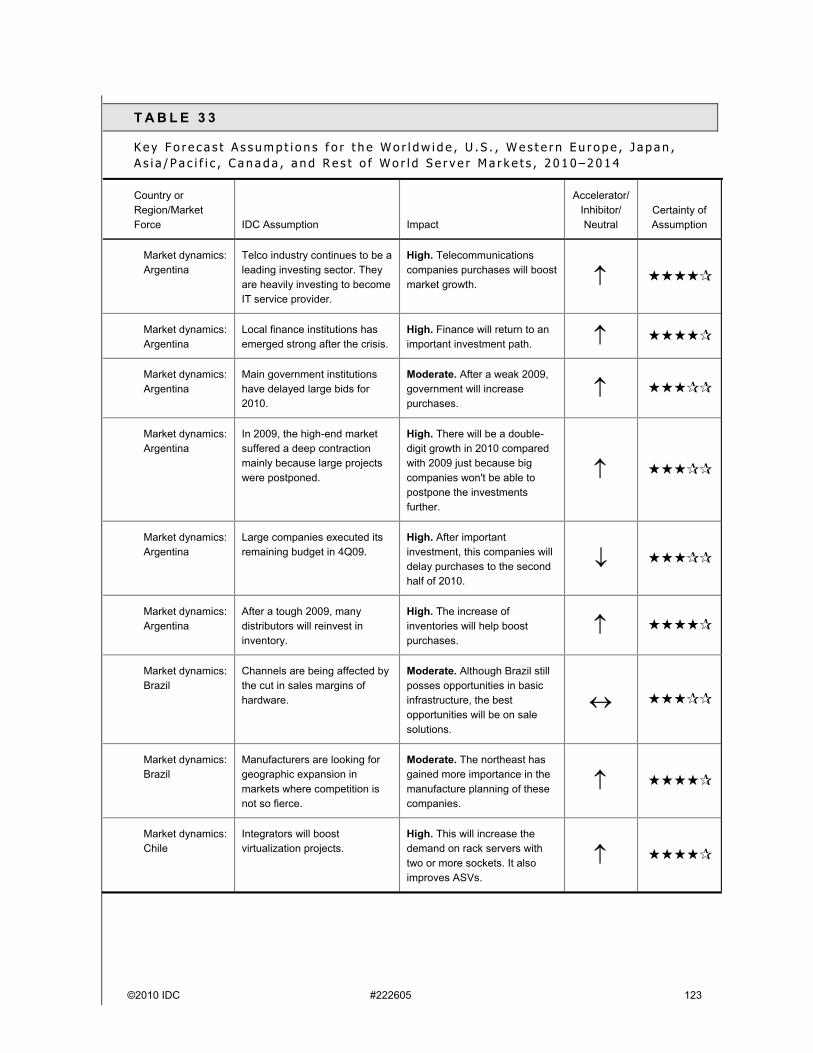
©2010 IDC #222605 123
T A B L E 3 3
K e y F o r e c a s t A s s u m p t i o n s f o r t h e W o r l d w i d e , U . S . , W e s t e r n E u r o p e , J a p a n , A s i a / P a c i f i c , C a n a d a , a n d R e s t o f W o r l d S e r v e r M a r k e t s , 2 0 1 0 – 2 0 1 4
Country or Region/Market Force IDC Assumption Impact
Accelerator/ Inhibitor/ Neutral
Certainty of Assumption
Market dynamics: Argentina
Telco industry continues to be a leading investing sector. They are heavily investing to become IT service provider.
High. Telecommunications companies purchases will boost market growth.
Market dynamics: Argentina
Local finance institutions has emerged strong after the crisis.
High. Finance will return to an important investment path.
Market dynamics: Argentina
Main government institutions have delayed large bids for 2010.
Moderate. After a weak 2009, government will increase purchases.
Market dynamics: Argentina
In 2009, the high-end market suffered a deep contraction mainly because large projects were postponed.
High. There will be a double-digit growth in 2010 compared with 2009 just because big companies won't be able to postpone the investments further.
Market dynamics: Argentina
Large companies executed its remaining budget in 4Q09.
High. After important investment, this companies will delay purchases to the second half of 2010.
Market dynamics: Argentina
After a tough 2009, many distributors will reinvest in inventory.
High. The increase of inventories will help boost purchases.
Market dynamics: Brazil
Channels are being affected by the cut in sales margins of hardware.
Moderate. Although Brazil still posses opportunities in basic infrastructure, the best opportunities will be on sale solutions.
Market dynamics: Brazil
Manufacturers are looking for geographic expansion in markets where competition is not so fierce.
Moderate. The northeast has gained more importance in the manufacture planning of these companies.
Market dynamics: Chile
Integrators will boost virtualization projects.
High. This will increase the demand on rack servers with two or more sockets. It also improves ASVs.

124 #222605 ©2010 IDC
T A B L E 3 3
K e y F o r e c a s t A s s u m p t i o n s f o r t h e W o r l d w i d e , U . S . , W e s t e r n E u r o p e , J a p a n , A s i a / P a c i f i c , C a n a d a , a n d R e s t o f W o r l d S e r v e r M a r k e t s , 2 0 1 0 – 2 0 1 4
Country or Region/Market Force IDC Assumption Impact
Accelerator/ Inhibitor/ Neutral
Certainty of Assumption
Market dynamics: Chile
Prioritization will be given to projects with high ROI.
Moderate. These projects are demanding units with better features that increase ASVs. Units shipments also may be negatively impacted.
Market dynamics: Chile
There will be overcrowding of models based on new processors.
High. The increased processing capacity reduces the number of units required for large virtualization projects.
Market dynamics: Chile
There will be a change of strategy on important wholesaler from box mover to amore complex solutions approach.
Moderate. There will be an increase in blade and high-end x86 units.
Market dynamics: Chile
There will be search for alternatives in servers about price performance.
High. Intel Nehalem–based units will increase.
Market dynamics: Chile
There will be a decrease in dual-core units stock.
Moderate. Dual core–based servers will decline due to the high ASV.
Market dynamics: Chile
There will be an increase in desk virtualization projects.
Moderate. This will increase x86 servers for thin clients or virtualized work stations.
Market dynamics: Chile
Large outsourcing projects are planned in Chile for 2010.
Moderate. There will be an increase in units based on EPIC, RISC, and CISC priced at more than $500,000.
Market dynamics: Chile
Regional economies of scale based on virtualized Unix will allow processing consolidation outside Chile.
Moderate. Units decrease due to consolidations out of Chile.
Market dynamics: Colombia
The good bank's financial results generated in 2009 forecast their growth for 2010 in the same proportion.
High. Finance institutions will recover its level of investment.

©2010 IDC #222605 125
T A B L E 3 3
K e y F o r e c a s t A s s u m p t i o n s f o r t h e W o r l d w i d e , U . S . , W e s t e r n E u r o p e , J a p a n , A s i a / P a c i f i c , C a n a d a , a n d R e s t o f W o r l d S e r v e r M a r k e t s , 2 0 1 0 – 2 0 1 4
Country or Region/Market Force IDC Assumption Impact
Accelerator/ Inhibitor/ Neutral
Certainty of Assumption
Market dynamics: Colombia
It is predicted that by 2010 the companies make their investments taking into account improvements in data security, backup, protection, and energy saving.
Moderate. Evaluation of their actual infrastructure, greater participation on corporate responsibility and green IT, and starting for virtualization environments will be the actual scenario. Server market might be favored.
Market dynamics: Colombia
For 2010, health sector will optimize its information on patient data.
High. Health sector will drive investments of IT infrastructure.
Market dynamics: Colombia
Telecommunications companies will continue to expand its data bases, offering a wider range of services to mobile phone users.
High. The need of IT infrastructure will continue to increase.
Market dynamics: Mexico
The average server life cycle will remain three to five years, depending on server segment. The majority of the worldwide installed base consists of servers that were deployed before the industry began to focus on energy efficiency.
High. Indications to IDC are that customers will adopt energy-efficient systems during typical refresh cycles; only a small minority will shorten life cycles to gain the energy efficiency benefits.
Market dynamics: Peru
Mining international prices keeps holding.
High. Mining sector will invest twice than 2009 because this sector is lacking on infrastructure investment in 2009.
Market dynamics: Peru
Sedapal launches its important bid for 2010.
High. This government bid will positively impact on Peru's market shipments.
Market dynamics: Peru
The area out of Lima is a geography that is looking promising and where vendors are focusing part of their vision.
High. The expanding coverage will generate an increase in the midmarket segment.

126 #222605 ©2010 IDC
T A B L E 3 3
K e y F o r e c a s t A s s u m p t i o n s f o r t h e W o r l d w i d e , U . S . , W e s t e r n E u r o p e , J a p a n , A s i a / P a c i f i c , C a n a d a , a n d R e s t o f W o r l d S e r v e r M a r k e t s , 2 0 1 0 – 2 0 1 4
Country or Region/Market Force IDC Assumption Impact
Accelerator/ Inhibitor/ Neutral
Certainty of Assumption
Market dynamics: Peru
There are at least 12 projects of opening stores (retailers and supermarkets) throughout the country, not only in Lima.
Moderate. Retailer are an important opportunity for computing projects.
Market dynamics: Venezuela
Commerce is one of the sectors that tend to expand.
Moderate. This leads to bigger investments on IT and an opportunity to offer more quick and efficient solutions.
Market dynamics: Venezuela
Electricity power supply restrictions will boost the demand on technologies such as virtualization.
High. This provides opportunity for vendors to offer complete solutions.
Market dynamics: Venezuela
Electricity power supply restrictions spark worries over datacenter investment.
High. Datacenter investments might be postponed.
Market dynamics: Venezuela
Manufacturers along with wholesalers and channels will offer events inside the country.
High. Business opportunities inside country will open informal market for servers. The offering of integration services will add extra value.
Market dynamics: Venezuela
Unified communication is migrating to cloud.
High. This will increase the purchase of servers to speed up this process.
Market dynamics: Venezuela
The companies point to optimized converged infrastructure solutions based on shared cloud computing services.
High. This encourages companies to seek solutions that allow them to choose the power supply that meets their needs and lower electricity power consumption.
Market dynamics: Venezuela
The creation or expansion of datacenter will offer better services.
Moderate. There are opportunities for IT providers on hardware.
Market characteristics
Product dynamics — all Latin American countries
x86 virtualization projects will continue to increase.
Moderate. This will increase the demand of servers with more than two sockets.

©2010 IDC #222605 127
T A B L E 3 3
K e y F o r e c a s t A s s u m p t i o n s f o r t h e W o r l d w i d e , U . S . , W e s t e r n E u r o p e , J a p a n , A s i a / P a c i f i c , C a n a d a , a n d R e s t o f W o r l d S e r v e r M a r k e t s , 2 0 1 0 – 2 0 1 4
Country or Region/Market Force IDC Assumption Impact
Accelerator/ Inhibitor/ Neutral
Certainty of Assumption
Product dynamics — all Latin American countries
Enhanced RISC and EPIC processors has been recently announced.
Moderate. The decrease in $25000–$100,000 price band units will be replaced by volume units.
Product dynamics — all Latin American countries
Enhanced RISC and EPIC processors has been recently announced.
Moderate. The increase in $25,000–$100,000 price band units is to replace units of more than a $100,000.
Product dynamics — all Latin American countries
Enhanced RISC and EPIC processors has been recently announced.
Moderate. The decrease in $100,000–$500,000 price band units is replaced by units with a lower ASV.
Product dynamics — all Latin American countries
There will be use of mainframe legacy applications.
High. There will be replacement of high midrange servers with lower cost units.
Product dynamics — all Latin American countries
Enhanced RISC and EPIC processors has been recently announced.
High. The increase in $100,000–$500,000 price band units is due to renewal on $500,000+ units.
Product dynamics — all Latin American countries
Vendors will continue to expand their blade product portfolios as customers embrace this form factor in ever-increasing numbers.
High. The increasing server densities within the IT rack further drive the need for improved energy efficiencies; without this, the datacenter will be challenged to deliver adequate power and cooling to high-density environments.
Product dynamics — all Latin American countries
There will be proliferation of client devices and end-user or end-use devices at the network edge.
High. The addition of devices will drive the need for more systems to deploy and manage. It will also shift the prevailing traffic from the center of the network outward to edge inward, which will affect computing and communications architectures.

128 #222605 ©2010 IDC
T A B L E 3 3
K e y F o r e c a s t A s s u m p t i o n s f o r t h e W o r l d w i d e , U . S . , W e s t e r n E u r o p e , J a p a n , A s i a / P a c i f i c , C a n a d a , a n d R e s t o f W o r l d S e r v e r M a r k e t s , 2 0 1 0 – 2 0 1 4
Country or Region/Market Force IDC Assumption Impact
Accelerator/ Inhibitor/ Neutral
Certainty of Assumption
Product dynamics — all Latin American countries
Convergence is a complex phenomenon working at many levels — convergence of the telephone network and the Internet; communications and IT technologies; consumer and enterprise technologies; and even storage, routing, and processing in the datacenter.
High. Convergence will drive new competitive dynamics, offer new applications and functions to customers, and strain the legal and regulatory systems. It will also drive increased ICT spending.
Product dynamics — all Latin American countries
The IT domain that was once the care and feeding of mainframes has evolved over the years to include the management of enterprise applications, deployment of software and applications to the workforce, and desktop automation.
High. This migration will generate new staffing and skill set demands on IT organizations, which will create challenges but also create more ultimate demand for ICT.
Product dynamics — all Latin American countries
The energy efficiency of processors has shown improvements in the past couple of years, as CPU vendors have made this a key design point in the new generation of processors.
High. This has become a key element to customer's selection criteria. In the competitive environment, it is now for CPU vendors to deliver improved compute performance within the same power envelope; this will continue to lower the server energy expense.
Product dynamics: Brazil
Due to elections, the government will freeze its spending for the next year.
Moderate. In 2010, government will be reducing its level of investment.
Product dynamics: Brazil
With the increase of performance, many applications hosted today on bigger servers can be migrated to cheaper servers without losing reliability.
Moderate. There will be an increase of volume shipments.
Product dynamics: Brazil
Many companies will keep investing in high-end equipment for business-critical applications.
High. More units will be sold, mostly at enterprise companies.

©2010 IDC #222605 129
T A B L E 3 3
K e y F o r e c a s t A s s u m p t i o n s f o r t h e W o r l d w i d e , U . S . , W e s t e r n E u r o p e , J a p a n , A s i a / P a c i f i c , C a n a d a , a n d R e s t o f W o r l d S e r v e r M a r k e t s , 2 0 1 0 – 2 0 1 4
Country or Region/Market Force IDC Assumption Impact
Accelerator/ Inhibitor/ Neutral
Certainty of Assumption
Product dynamics: Chile
There will be a reduction in IT budgets in SMBs.
High. This will decrease the demand for servers with ASVs less than $15,00.
Product dynamics: Chile
Enhanced RISC processors will be available.
Moderate. There will be an increase in blade units based on RISC.
Product dynamics: Chile
There will be an increase in critical mission projects.
Moderate. This will increase blade units based on EPIC and RISC.
Product dynamics: Chile
There will be an increase of projects involving RISC and EPIC virtualization.
Moderate. This will increase units based on two and four sockets for development and testing.
Product dynamics: Chile
There will be an increase in applications for critical missionprojects as their core business.
Moderate. This will increase the demand for servers with high-availability features.
Product dynamics: Chile
We assume lack of support of local ERPs for new technologies.
High. This inhibits the Unix platforms' renewal due to the high cost.
Product dynamics: Chile
We assume a high cost of renewal of noncompatible applications.
Moderate. This will slowdown the renewal of the platform.
Product dynamics: Chile
Legacy data base platform will be renewed.
Moderate. This will increase the high-end servers with high-availability features.
Product dynamics: Chile
There will be use of mainframe legacy applications.
High. This will favor the mainframe renewals.
Product dynamics: Mexico
Datacenters have limited space and energy capacity.
High. The limitations of space for a new box and power supply will lead to system consolidations.

130 #222605 ©2010 IDC
T A B L E 3 3
K e y F o r e c a s t A s s u m p t i o n s f o r t h e W o r l d w i d e , U . S . , W e s t e r n E u r o p e , J a p a n , A s i a / P a c i f i c , C a n a d a , a n d R e s t o f W o r l d S e r v e r M a r k e t s , 2 0 1 0 – 2 0 1 4
Country or Region/Market Force IDC Assumption Impact
Accelerator/ Inhibitor/ Neutral
Certainty of Assumption
Product dynamics: Mexico
Server virtualization is one of the primary solutions to power and cooling issues. Consolidating many physical servers to virtual machines running on a fewer number of physical servers reduces the overall energy expense for the datacenter.
High. A higher- or lower-than-expected adoption of virtualization technologies would reduce or increase the energy expense, respectively, with more compact and economic servers.
SMBs: Venezuela
SMBs are more focused on IT solutions because they are understanding the better development of their business from technology.
High. New channels serving these customers will help boost this depressed demand.
Virtualization —all Latin American countries
Virtualization adoption has been favored due to crisis environment.
High. In the short term, the impact is positive because most projects involve new shipments.
Virtualization —all Latin American countries
Virtualization adoption has been favored due to crisis environment.
Moderate. In the long term, the increase of adoption might impact the future renewal of installed base.
ROW — CEMA
Macroeconomic and political assumptions
Economic downturn in the CEE region
For the full year 2010, the CEE region is expected to report a year-on-year increase of 3% in revenue and 12% in unit shipments. The region has not yet fully recovered from the economic and financial crises, as some countries in the region still expect to post negative year-on-year results.
High. IT spending freezes, but some countries are showing improvements.

©2010 IDC #222605 131
T A B L E 3 3
K e y F o r e c a s t A s s u m p t i o n s f o r t h e W o r l d w i d e , U . S . , W e s t e r n E u r o p e , J a p a n , A s i a / P a c i f i c , C a n a d a , a n d R e s t o f W o r l d S e r v e r M a r k e t s , 2 0 1 0 – 2 0 1 4
Country or Region/Market Force IDC Assumption Impact
Accelerator/ Inhibitor/ Neutral
Certainty of Assumption
Russia The Russian server market will return to positive yearly growth in 2010. IDC expects the server market to post a 3.5% year-on-year growth in revenue after the contraction witnessed in 2009.
High. The largest CEE country's economy is slowly improving.
Poland The Polish server market is also expected to rebound in 2010, with annual revenue growth at 10% driven by the x86 server space.
High. The largest industries in the country are still somehow affected by the crisis.
Czech Republic IDC foresees the Czech Republic to remain negative in 2010 mostly affected by the downturn of the x86 server market.
High. IT spending freezes.
Economic downturn in the MEA region
For 2010, the Middle East and Africa region is forecast to report a positive growth of 4.1% in revenue terms and 13% in unit shipments year on year.
Moderate. The financial crisis is not yet over, nevertheless IT spending in the region returned.
Gulf countries (UAE, Saudi Arabia, Oman, Bahrain, Qatar, Kuwait)
The Gulf region is not expected to remain afloat despite its known wealth. The server market for 2010 is forecast to drop by 1% in revenue, but increase by 13% in shipments. The countries to bring the decline overall in the region is coming from Saudi Arabia expected to drop by 13% in revenue value year-on-year in 2010.
High. Saudi Arabia is affecting the decline in the Gulf region. Financial crisis and oil prices are expected to affect IT spending in the region.
South Africa 2010 will regain momentum, thanks to the IT investments plus ongoing deployment. IDC's predictions for 2010 are positive, with 14% year-on-year growth in revenue terms and 7% in unit shipments.
Moderate. This will increase IT spending, thanks to the ongoing developments and renew installed base.

132 #222605 ©2010 IDC
T A B L E 3 3
K e y F o r e c a s t A s s u m p t i o n s f o r t h e W o r l d w i d e , U . S . , W e s t e r n E u r o p e , J a p a n , A s i a / P a c i f i c , C a n a d a , a n d R e s t o f W o r l d S e r v e r M a r k e t s , 2 0 1 0 – 2 0 1 4
Country or Region/Market Force IDC Assumption Impact
Accelerator/ Inhibitor/ Neutral
Certainty of Assumption
User segments
Public sector Despite the economic downturn, some of the governments across both regions, CEE and MEA, will try to continue to invest in IT infrastructure to upgrade their systems and develop egovernment. Schools and universities will also renew their IT infrastructure.
Moderate. Governments' IT modernization plans in the region will help sustain demand for servers, from the low end to the high end.
Banking/financial sector
Banking and insurance companies are expected to freeze budgets on their investment in IT across both regions.
Moderate. This sector will exhibit some demand for servers in both the low-end and the high-end segments.
Business spending
The large account segment is approaching saturation for various technologies, and vendors are strengthening their focus on the midmarket.
High. Midmarket customers are price sensitive and reluctant to invest in more advanced technologies.
Telecom sector Telecom operators are expected to continue to invest further in IT to remain competitive in the liberalized markets, but at a lower rate.
Moderate. Telcos will invest in applications and infrastructure to gain the benefits of advanced technologies.
SMB sector Small and medium-sized businesses are a dynamic segment; however, due to the economic crisis, IDC expects some slowdown in purchasing.
Moderate. SMEs will have less funds available to make server purchases; however, they are expected to do some purchases.
Technology developments
Server consolidation
Vendors will push the trend of server consolidation to increase customer satisfaction (cost reduction/full efficiency of hardware) and proliferation of high-end servers.
High. Consolidation will help end users reduce costs and improve system availability and performance.

©2010 IDC #222605 133
T A B L E 3 3
K e y F o r e c a s t A s s u m p t i o n s f o r t h e W o r l d w i d e , U . S . , W e s t e r n E u r o p e , J a p a n , A s i a / P a c i f i c , C a n a d a , a n d R e s t o f W o r l d S e r v e r M a r k e t s , 2 0 1 0 – 2 0 1 4
Country or Region/Market Force IDC Assumption Impact
Accelerator/ Inhibitor/ Neutral
Certainty of Assumption
Virtualization and systems management software
With the objective to make IT resources more flexible and changeable, virtualization and system management software products will be introduced in the region.
High. This will accelerate the server consolidation trend in the medium term.
Form factor changes
Multiprocessor blades are becoming increasingly popular as the server blade market evolves. Rack-optimized server penetration also continues to grow as users start to realize the advantages of this form factor.
High. Blade solutions will support more efficient use of processing cycles by closely matching workloads to available computing resources. HP, Dell, IBM, and Sun Microsystems have had server blade products for several years now, and the market is beginning to move into a highly competitive stage.
Processor performance improvements
As processor performance increases, prices are starting to fall in the x86 space. Non-x86 systems are also facing price pressure, particularly when vendors compete for large tenders in the public sector.
Moderate. A combination of corporate spending and new product launches will buoy demand for four-way and eight-way systems, which will help average system values and vendor margins in this space.
Chip or CPU type dynamics —RISC
Demand for less expensive systems is forcing vendors to lower prices on RISC machines. RISC technology systems are gaining share in the volume server market, competing with cheaper x86 servers and pushing down overall ASPs.
Moderate. As this trend continues, x86 systems will grow in volume at a faster rate than RISC-based systems.
Chip or CPU type dynamics — x86
Linux on EPIC servers will continue to gain traction in the market.
Low. IDC expects cannibalization by EPIC-based systems will be roughly equal in the RISC-based systems markets — predominantly among two-way and four-way machines in the near term.

134 #222605 ©2010 IDC
T A B L E 3 3
K e y F o r e c a s t A s s u m p t i o n s f o r t h e W o r l d w i d e , U . S . , W e s t e r n E u r o p e , J a p a n , A s i a / P a c i f i c , C a n a d a , a n d R e s t o f W o r l d S e r v e r M a r k e t s , 2 0 1 0 – 2 0 1 4
Country or Region/Market Force IDC Assumption Impact
Accelerator/ Inhibitor/ Neutral
Certainty of Assumption
Software development
Rapid advancement in system management software and clustering technology and the continued desegregation of servers into smaller form factors and components should fuel the growth of server blades and modular systems over the course of the forecast period.
High. The migration to this form factor is expected to help drive considerable revenue out of the hardware and into systems management, interconnect, and clustering tools that will be intimately tied to hardware sales.
Chip type and operating system developments —CISC
The increasing maturity of large SMP Unix/RISC machines will continue to chip away at traditional CISC-based server market share, particularly for high-end mainframes that are aging within the customer installed base.
Moderate. Servers based on CISC processors will lose revenue share throughout the forecast period due to price competition from high-performance RISC systems.
Chip type and operating system developments —x86
Both Linux and Windows will gain value share over the forecast period. While Linux will become a major platform for datacenter edge workloads and high-performance and technical clusters, Windows should expand its presence in the packaged application and database segments.
Moderate. As EPIC gains wider market acceptance with the availability of Linux and Windows SOE for these technologies, the server market will slowly lose share in the eight-way+ CPU capacity space and it will likely increase its presence among uniprocessor systems.

©2010 IDC #222605 135
T A B L E 3 3
K e y F o r e c a s t A s s u m p t i o n s f o r t h e W o r l d w i d e , U . S . , W e s t e r n E u r o p e , J a p a n , A s i a / P a c i f i c , C a n a d a , a n d R e s t o f W o r l d S e r v e r M a r k e t s , 2 0 1 0 – 2 0 1 4
Country or Region/Market Force IDC Assumption Impact
Accelerator/ Inhibitor/ Neutral
Certainty of Assumption
Chip type and operating system developments —RISC
Unix-based systems will slowly take share from RISC servers running the IBM z/OS and i5/OS, Open VMS, and HP MPE operating systems.
Moderate. While RISC-based systems will face increased competition from Linux and EPIC-based hardware in the low-end portion of the market, they are expected to increase their presence among high-end machines competing with proprietary mainframe technology.
Chip type and vendor strategies — EPIC
IDC believes that much of HP's PA-RISC product line will continue to make the transition to EPIC in the five-year forecast period. Therefore, IDC has forecast a spending transition from RISC to EPIC in the 2010–2014 period, to reflect HP's strategy.
Moderate. Due to these trends, IDC expects EPIC adoption to continue strongly in the region.
Legend: very low, low, moderate, high, very high
Source: IDC, 2010
M a r k e t C o n t e x t
IDC's forecast for the server market was slightly adjusted upward from the previous forecast issued in Worldwide and Regional Server 2009–2013 Forecast Update (IDC #221439, December 2009). The significant global recession caused massive volatility to the hardware market throughout the end of 2008 and during 2009. IDC sees a return to normalcy in seasonal patterns toward the end of 2010. The expectation for worldwide spending on server customer revenue in 2010 year-on-year change is positive, 6.8%, to $49.3 billion. IDC expects the volume server segment to continue to be the driver of growth through the forecast period fuelled by rackable servers. IDC had anticipated a "V" type of recession, but results in 3Q09 suggest it may be more of a "U" shape, and data from 4Q09 shows as starting up on the right side of the "U". IDC expects the market in the first quarter of 2010 to be seasonably down compared with 4Q09, but less than one would normally expect with customer revenue in totaling $12.0 billion with 1,770,720 units.

136 #222605 ©2010 IDC
Shipments in the x86 market invariably drive the server market growth or decline as the market controlled 96.6% of the server market in 2009. In 4Q09, the x86 market grew 14.9% sequentially in terms of units and 24.0% in revenue. Average selling prices remained above $7,000 overall but are expected to slightly decline over the forecast period. IDC believes it is prudent to look at sequential results more closely throughout 2010, as we come out of the recession rather than just looking at year-over-year results. One should not simply assume quarterly results are a result of seasonality.
Tables 34 and 35 as well as Figures 3 and 4 provide a comparison of the revenue and unit shipment data and growth rates from the December 2009 forecast for 2007–2013 and the current forecast from 2007 to 2014.
T A B L E 3 4
W o r l d w i d e S e r v e r C u s t o m e r R e v e n u e b y R e g i o n 2 0 0 7 – 2 0 1 4 : C o m p a r i s o n o f D e c e m b e r 2 0 0 9 a n d M a r c h 2 0 1 0 F o r e c a s t s
2007 2008 2009 2010 2011 2012 2013 2014
March 2010 forecast ($B)
Americas 25.4 24.1 19.6 22.0 22.2 22.7 23.1 23.4
EMEA 14.6 14.5 13.0 13.5 14.1 14.7 15.3 15.5
Asia/Pacific 19.1 18.4 13.5 13.9 14.2 13.9 13.8 13.7
Total 59.1 57.0 46.2 49.3 50.5 51.3 52.2 52.6
Growth (%)
Americas NA -5.1 -18.6 12.2 1.1 1.9 1.7 1.3
EMEA NA -0.6 -10.4 3.5 4.5 4.3 4.4 1.1
Asia/Pacific NA -3.8 -26.3 2.4 2.4 -2.0 -1.0 -0.1
Total NA -3.6 -19.0 6.8 2.4 1.5 1.7 0.9
December 2009 forecast ($B)
Americas 25.4 24.1 19.4 19.7 19.9 20.3 20.7 NA
EMEA 14.6 18.4 13.0 12.9 13.5 13.6 13.7 NA
Asia/Pacific 19.1 14.5 12.9 13.1 14.0 14.8 15.4 NA
Total 59.1 57.1 45.3 45.7 47.5 48.7 49.8 NA

©2010 IDC #222605 137
T A B L E 3 4
W o r l d w i d e S e r v e r C u s t o m e r R e v e n u e b y R e g i o n 2 0 0 7 – 2 0 1 4 : C o m p a r i s o n o f D e c e m b e r 2 0 0 9 a n d M a r c h 2 0 1 0 F o r e c a s t s
2007 2008 2009 2010 2011 2012 2013 2014
Growth (%)
Americas NA -5.1 -19.6 1.6 1.3 1.7 2.0 NA
EMEA NA 26.2 -29.3 -1.2 5.1 0.3 0.9 NA
Asia/Pacific NA -23.9 -11.2 1.8 6.7 5.5 4.1 NA
Total NA -3.4 -20.6 0.8 3.9 2.4 2.4 NA
Notes:See Worldwide and Regional Server 2009–2013 Forecast Update (IDC #221439, December 2009) for prior forecast.Historical market values presented here are as published in prior IDC documents based on the market taxonomies and current U.S. dollar exchange rates existing at the time the data was originally published. For more details, see the Methodology section in the Learn More section.
Source: IDC, 2010
T A B L E 3 5
W o r l d w i d e S e r v e r S h i p m e n t s b y R e g i o n , 2 0 0 7 – 2 0 1 4 : C o m p a r i s o n o f D e c e m b e r 2 0 0 9 a n d M a r c h 2 0 1 0 F o r e c a s t s
2007 2008 2009 2010 2011 2012 2013 2014
March 2010 forecast
Americas 3,391,704 3,383,990 2,674,071 3,007,798 3,181,678 3,408,596 3,600,695 3,739,633
EMEA 1,965,510 2,069,672 1,894,599 2,078,188 2,275,951 2,491,673 2,704,100 2,827,386
Asia/Pacific 2,612,262 2,680,761 2,049,033 2,206,556 2,324,377 2,425,686 2,496,250 2,604,955
Total 7,969,476 8,134,423 6,617,703 7,292,542 7,782,006 8,325,955 8,801,045 9,171,974
Growth (%)
Americas NA -0.2 -21.0 12.5 5.8 7.1 5.6 3.9
EMEA NA 5.3 -8.5 9.7 9.5 9.5 8.5 4.6
Asia/Pacific NA 2.6 -23.6 7.7 5.3 4.4 2.9 4.4
Total NA 2.1 -18.6 10.2 6.7 7.0 5.7 4.2

138 #222605 ©2010 IDC
T A B L E 3 5
W o r l d w i d e S e r v e r S h i p m e n t s b y R e g i o n , 2 0 0 7 – 2 0 1 4 : C o m p a r i s o n o f D e c e m b e r 2 0 0 9 a n d M a r c h 2 0 1 0 F o r e c a s t s
2007 2008 2009 2010 2011 2012 2013 2014
December 2009 forecast
Americas 3,391,704 3,386,819 2,707,926 2,958,181 3,042,256 3,177,517 3,350,797 NA
EMEA 1,965,510 2,681,480 2,017,847 2,129,717 2,215,874 2,312,157 2,406,342 NA
Asia/Pacific 2,612,262 2,071,574 1,853,636 1,980,853 2,250,234 2,500,765 2,726,390 NA
Total 7,969,476 8,139,873 6,579,408 7,068,751 7,508,364 7,990,439 8,483,529 NA
Growth (%)
Americas NA -0.1 -20.0 9.2 2.8 4.4 5.5 NA
EMEA NA 36.4 -24.7 5.5 4.0 4.3 4.1 NA
Asia/Pacific NA -20.7 -10.5 6.9 13.6 11.1 9.0 NA
Total NA 2.1 -19.2 7.4 6.2 6.4 6.2 NA
Note: See Worldwide and Regional Server 2009–2013 Forecast Update (IDC #221439, December 2009) for prior forecast.
Source: IDC, 2010
F I G U R E 3
W o r l d w i d e S e r v e r C u s t o m e r R e v e n u e , 2 0 0 5 – 2 0 1 3 : C o m p a r i s o n o f D e c e m b e r 2 0 0 9 a n d M a r c h 2 0 1 0 F o r e c a s t s
Source: IDC, 2010
0
10
20
30
40
50
60
70
2005 2006 2007 2008 2009 2010 2011 2012 2013
($B
)
March 2010 forecast
December 2009 forecast

©2010 IDC #222605 139
F I G U R E 4
W o r l d w i d e S e r v e r S h i p m e n t s , 2 0 0 5 – 2 0 1 3 : C o m p a r i s o n o f D e c e m b e r 2 0 0 9 a n d M a r c h 2 0 1 0 F o r e c a s t s
Source: IDC, 2010
E S S E N T I A L G U I D A N C E
The server landscape is changing and will affect all server vendors and users. Issues such as consolidation, virtualization, cloud computing, power and cooling, efficiency, and converged infrastructure will help drive server demand going forward:
For systems vendors: Vendors will appreciate the renewed growth, however moderate it proves to be, in 2010. However, a new period of coopetition (competition and cooperation) will evolve, as battle lines are redrawn. The familiar lines of competition will change, as converged infrastructure is "topped"by software solutions and software "bundles." New partnerships will emerge —and old ones may fray, as the vendors reposition their server products as the "engines" for technology stacks. Vendors should identify new opportunities as they emerge — whether by geographic region, by industry segment, or by software solution. Indeed, software and applications and workloads will likely be the leading drivers for new server deployments — and much of the architectural detail will be integrated into the total solution.
0123456789
10
2005 2006 2007 2008 2009 2010 2011 2012 2013
(M)
March 2010 forecast
December 2009 forecast

140 #222605 ©2010 IDC
For software vendors: If 2010 was a dance floor, then all the ISVs would have to update their dance cards. The reason: the industry is moving to provide integrated "technology stacks," combining server hardware with optimized software stacks. As a result, multiple partnerships may be called for, as each server vendor seeks to differentiate its solution-stack offerings. So, for ISVs, the watchword will be to keep looking to expand/extend the current list of partnerships — and to emphasize ease-of-use and low-cost maintenance — as you ramp up marketing for your software solutions.
For value-added resellers (VARs) and systems integrators (SIs): The role of VARs may be rapidly changing, as systems vendors increasingly work directly with ISVs to optimize hardware/software stacks. As that occurs, VARs need to shift their focus from integration of the stacks alone to helping customers more with ease of use, training of IT staff at customer sites — and monitoring of the whole technology solution, once it is deployed in the customer site. Of course, preconfigured solutions will be one path that customers will take — while many others will resume long-standing patterns of installing new software on existing, upgraded, and brand-new hardware. These meat-and-potato installations will continue to account for a large "slice" of the overall demand for servers, particularly in small and midsize businesses.
L E A R N M O R E
R e l a t e d R e s e a r c h
Worldwide Server Energy Expense 2009–2013 Forecast (IDC #221346, December 2009)
Dell's Efficient Datacenter Solutions Appear on the Scene (IDC #lcUS22133909, December 2009)
Server Workloads 2009: Understanding the Applications Behind the Deployment(IDC #220870, November 2009)
HP Announces Converged Infrastructure for Servers, Storage and Networking(IDC #lcUS22080509, November 2009)
Cisco, VMware, EMC Announce Virtual Computing Environment (VCE) (IDC #220734, November 2009)
Blades Recession Proof? Converged Nature of Platform Sustaining Market (IDC lcUS21998609, September 2009)
Mainframe Directions in the Multiplatform Datacenter, 2009–2013: Today's Workloads and Future Outlook (IDC #219797, September 2009)
U.S. and Worldwide Server Installed Base 2009–2013 Forecast (IDC #219110, July 2009)

©2010 IDC #222605 141
Worldwide Blade Server 2009–2013 Forecast (IDC #218374, May 2009)
Worldwide x86 Hardware Refresh 2009 Vendor Analysis: The Nehalem Factor(IDC #218130, May 2009)
Worldwide and Regional Server 2009–2013 Forecast (IDC #217579, April 2009)
Oracle Announces It's Acquiring Sun Microsystems (IDC #218151, April 2009)
Understanding IT Consolidation: A Demand-Side View (IDC #217521, March 2009
M e t h o d o l o g y
Historical Market Values and Exchange Rates
Historical market values presented here are as published in prior IDC documents based on the market taxonomies and current U.S. dollar exchange rates existing at the time the data was originally published. For markets other than the United States, these as-published values are therefore based on a different exchange rate each year.
Because many individual countries contribute to regional totals, it is difficult to give precise differences between current and constant currency values in this document. However, the scale of the difference can be understood from the movement of the U.S. dollar against major regional currencies. Customers should consider multiplying regional historical market values for each year by the change in value of the U.S. dollar against representative currencies in the region as shown in Table 36. This will provide a better approximation of local market growth. For example, to restate 2008 EMEA values into 2009 dollars, one would adjust the 2008 value downward by 5% (because the dollar appreciated against the euro in 2009).
Please refer to IDC's regional research studies containing historical forecasts for multiple countries for more accurate regional growth in local currencies. Note that this discussion applies only to historical values prior to 2009. 2009 and all future years are forecast at a constant exchange rate.

142 #222605 ©2010 IDC
T A B L E 3 6
E x c h a n g e R a t e s , 2 0 0 3 – 2 0 0 9 ( % )
2003 2004 2005 2006 2007 2008 2009
Euro 123 112 112 111 102 95 100
Pound 96 85 86 85 78 85 100
Yen 124 116 118 124 126 111 100
Canadian dollar 123 114 106 99 94 93 100
Mexican peso 80 84 81 81 81 83 100
Brazilian real 155 146 121 109 97 92 100
Note: To restate prior-year U.S. dollars, multiply historical market values by the percentage indicated in the table.
Source: IDC, January 2010
S y n o p s i s
This IDC study presents our adjusted worldwide and regional forecasts for the server market through 2014.
"The worldwide server market experienced a sharp decline in 2009. The wave first hit the United States and then continued to roll overseas," said Lloyd Cohen research Director, IDC Enterprise platforms group." "IDC believes the same type of modest recovery in the form of a wave will also start in the United States before it travels internationally. IDC had previously predicted a "U" type of recovery but it is beginning to take the form of a "V" with unit x86 shipments increasing each year."

©2010 IDC #222605 143
C o p y r i g h t N o t i c e
This IDC research document was published as part of an IDC continuous intelligence service, providing written research, analyst interactions, telebriefings, and conferences. Visit www.idc.com to learn more about IDC subscription and consulting services. To view a list of IDC offices worldwide, visit www.idc.com/offices. Please contact the IDC Hotline at 800.343.4952, ext. 7988 (or +1.508.988.7988) or [email protected] for information on applying the price of this document toward the purchase of an IDC service or for information on additional copies or Web rights.
Copyright 2010 IDC. Reproduction is forbidden unless authorized. All rights reserved.