influence of sand state on effect of micropiles - terracon · micropiles. lizzi and carnevale...
TRANSCRIPT
Influence of Sand State on Network effect of Micropiles
By
Shanzhi Shu* and Balasingam Muhunthan**
* Geotechnical Engineer, Terracon, 750 Pilot Road, Suite F, Las Vegas, NV 89119, USA.
** Professor, Department of Civil and Environmental Engineering, Washington State University, Pullman, WA 99164, USA.
ABSTRACT
Past studies on micropile behavior on sands have treated the effects of density and
confining stress separately. It had often led to conflicting results in many laboratory and
field tests and problems associated with the interpretation of network behavior of
micropiles. This paper presents the results of a numerical simulation conducted using
FLAC3D to study the combined influence of sand density and stress level on micropile
network performance. The constitutive model used in the analysis explicitly incorporates
the effect of initial state of sand through a state parameter expressed as the difference
between the current void ratio and the void ratio at the critical state at the same confining
pressure. The numerical simulations show that network effect of micropiles is
significantly influenced by initial sand state and sand dilatancy. The study concludes
that the use of initial state parameter rather than density or confining stress alone as often
done in the current state of practice would lead to a consistent methodology in the
interpretation of micropile test results.

Introduction
Micropiles are small diameter (typically less than 300 mm) drilled or cast in-place
piles designed with high structural strength by large amount of steel reinforcement. They
are gaining popularity for foundation support and slope stabilization due to their ready
access to installation in locations with low headroom and restricted access. Micropile
contribution to foundation support is generally derived from two mechanisms: direct
structural support and soil reinforcement. These two mechanisms are designated as Case
1 and Case 2 in the literature, respectively (Bruce et al., 1989, Juran et al. 1997, FHWA,
2000). Case 1 micropiles are generally referred to pile groups vertically installed to
directly support foundation load whereas Case 2 micropiles are three-dimensional array
of reticulated elements, also described by Lizzi as „root pile‟ (1982), to encompass and
internally reinforce soil, resulting in a network or “knot” effect of composite pile-soil
foundation. The potential for enhanced engineering behavior of reticulated micropile
network systems compared to that of micropile group has been investigated by numerous
researchers in the past (Lizzi, 1982, Plumelle, 1984, Forever,2002). The results of
laboratory and full-scale experiments reported by various investigators have, however,
resulted in significantly different and apparently contradictory effects of group of
micropiles. Lizzi and Carnevale (1979) have observed a dramatic positive group effect
(220%) on the capacity of reticulated micropile networks over those vertically installed
micropile groups with the same number of piles with identical dimensions. This dramatic
increase was not observed by other full-scale experiments conducted to re-examine the
results of Lizzi (FOREVER 2002).

It is well known that the behavior of sand is influenced by a number of factors
including two important ones: relative density and confining stress level. It is believed
that the disagreements described above on the behavior of group and network piles are in
part due to not accounting for the state of sand in the different test programs and in the
interpretation of their results. Most full-scale tests replicate the sand with its field
relative density (or the void ratio). Such replication is insufficient to account for the
important effects of confinement stress. Thus, it would be difficult to compare the results
of laboratory and full-scale experiments from a unified perspective, without accounting
for the combined effects of relative density and confining stress level on sand behavior.
The influence of density and confining pressure can be combined through a
measure termed state parameter as shown in Figure 1. The state parameter describes
the proximity of the initial or the current state of the soil to its critical state line (Been and
Jefferies 1985). As seen from Fig. 1, if is negative, the sand is considered in a dilative
state, and if is positive, the sand is in a contractive state. In this regard, at small
confining stress levels even a loose sand may behave in a dilative manner similar to that
of a very dense sand; whereas at a high confining stress a dense sand may in fact behave
in a contrive manner as in the case of a loose sand. The state dependent behavior of sand
implies that caution should be exerted in the interpretation and extrapolation of
experimental results obtained at different test scales. Better interpretation of micropile
test results could be achieved if a single measure such as the state parameter is used
rather than the current use of density alone.
Numerical analysis is an effective way to study the behavior of micropiles under
various states of sand as, once the model is verified, conditions can be changed with little

effort to conduct a parametric study on the system variables. Foerster and Modaressi
(1995), Estephan and Frank (2001), Sadek (2002), and Sadek & Shahrour (2004) have
performed numerical analyses of micropiles under various conditions. Most of them
have, however, not focused on the effects of sand state on the performance of a micropile,
group, or network.
This paper uses a constitutive model that explicitly accounts for soil state through
the state parameter implemented into the widely used commercial 3-dimensional
geotechnical software FLAC3D to investigate the effect of sand state on performances of
network of micropiles.
Constitutive Model and Its Implementation
Complete details of the constitutive model for sand, its implementation into
FLAC 3D, and its validation are presented elsewhere (Li and Dafalias 2000; Li, 2002;
Shu, 2005; Shu et al. 2010). Briefly, the constitutive model is formulated within a critical
state soil mechanics framework (Schofield and Wroth 1968) and incorporates the
concepts of bounding surface plasticity (Dafalias, 1981 & 1986). The model assumes
that the dilatancy of sand is dependent not only on the stress ratio = q/p (q and p are the
deviator and mean effective normal stresses, respectively) as in other family of critical
state models, but also on the state parameter .
The Fast Lagrangian Analysis of Continua in 3 Dimensions (FLAC3D) developed
by Itasca Consulting Group, Inc. is a widely used finite difference commercial code in the
geotechnical field. It has been successfully used to numerically simulate a number of
geotechnical problems. Besides many built-in soil constitutive models, it provides a user
interface to implement new constitutive models. The state dependent sand model was

implemented into the FLAC3D by the authors for purposes of the micropile analysis
presented below. It was verified on some micropile data from the FOREVER test
program (for complete details the reader is referred to Shu 2005, Shu et al. 2010) before
its use in the parametric analyses presented here.
Simulation of Network of Micropiles
Network Model Setup
Figure 3 shows schematic of a 3-pile group or network. The inclination angle =
0° indicates that the network is identical to the vertical group, > 0° constitutes
outwardly inclined piles and < 0° consists of inwardly inclined piles. The latter is
similar to the “basket” group of micropiles of Lizzi (1985). A finite difference mesh
including a 3-pile group or network was prepared with bottom boundary fixed in both x
and y directions and side boundaries fixed in x direction.
The length and diameter of a single pile are chosen to be 6m and 200mm,
respectively, corresponding to 30D
L . The piles were placed at a constant spacing of
400 mm on center (2 diameters) in plan at the top. Note that network micropiles are often
categorized in practice as reinforcement type (Case 2 as defined previously). However,
in order to identify the dominant effects of network on micropile performance, structural
elements were used in FLAC 3D to simulate the micropiles. An assumption is made that
the grouting of micropiles recovers the stress relief caused by boring process and that the
sand state remains relatively unchanged from its initial state before and after pile
installation. It is noted that the grouting process has been shown to be significant in pile
design (Juran, 1999), however, its significance is ignored in the analyses. Such effects

can of course be taken into account properly by modifying the changes to state parameter
in a future analysis.
The soil used in the simulation is Toyoura sand for which the constitutive model
parameters have been extensively studied by Li and Dafalias (2000) and Li (2002). The
parameters used in this study are as shown in Table 1, where G0 and are material elastic
parameters; M is the stress ratio at critical state; c is ratio of M at extension and at
compression; e, c and are material constants determining a straight critical-state line
in e-p plane. The details of model parameters and their determination refer to Li and
Dafalias(2000) and Li(2002). The parameters used for micropiles and the shear coupling
springs are shown in Table 2. The initial state parameter of the sand is assumed to be kept
uniform (by varying the void ratio distribution) with depth to address the effect of sand
state on the performance of micropiles.
Table 1: Model Parameters for Toyoura Sand (Li, 2002)
Elastic parameters
Critical state parameters
Parameters associated with dr-
mechanisms(1)
Parameters associated with dp-
mechanisms(2)
Default parameters
G0=125 =0.25
M=1.25 c=0.75
e=0.934 c=0.019 =0.7
d1=0.41 m=3.5
h1=3.15 h2=3.05 h3=2.2 n=1.1
d2=1 h4=3.5
a=1 b1=0.005
b2=2 b3=0.001
(1) The parameters related to sand response upon the change of deviatoric stress ratio. (2) The parameters related to sand response upon the change of mean effective stress.

Table 2: Model Parameters for Micropiles and the Springs
Elastic Modulus of Micropiles, E 50 GPa
Poisson‟s Ratio, 0.25
Stiffness of the Shear Coupling Spring, ks 2×10¹¹ N/m/m
Friction of the Shear Coupling Spring, s 30o
Cohesive Strength of the Shear Coupling Spring, cs 0
Very small values of continuous vertical velocity (less than 10-5 m/s) were applied to the
top nodes of the pile network to mobilize the side and tip resistances of micropiles from
the surrounding soil. The side and tip resistances against displacement were recorded
when the pile was pushed downward.
Performance of Outward network Piles
The variation of the side, tip and total resistance of outwardly inclined micropile
group with inclination angle installed in various states of sand are shown in the sets of
Figures 3 to 6. These figures also show comparison of the results with a single identical
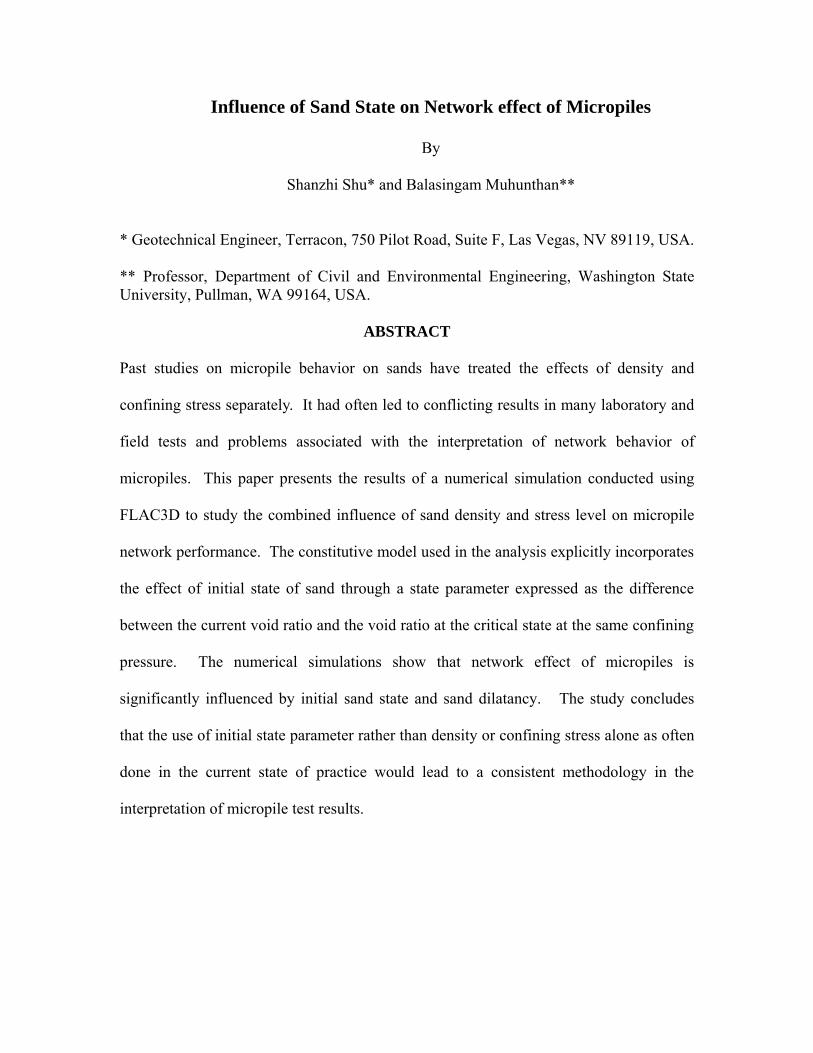
vertical pile. The set of Figure 3 are for micropiles network installed in a dilative sand
with state parameter of = - 0.1; the set of Figure 4 are for those at critical state sand
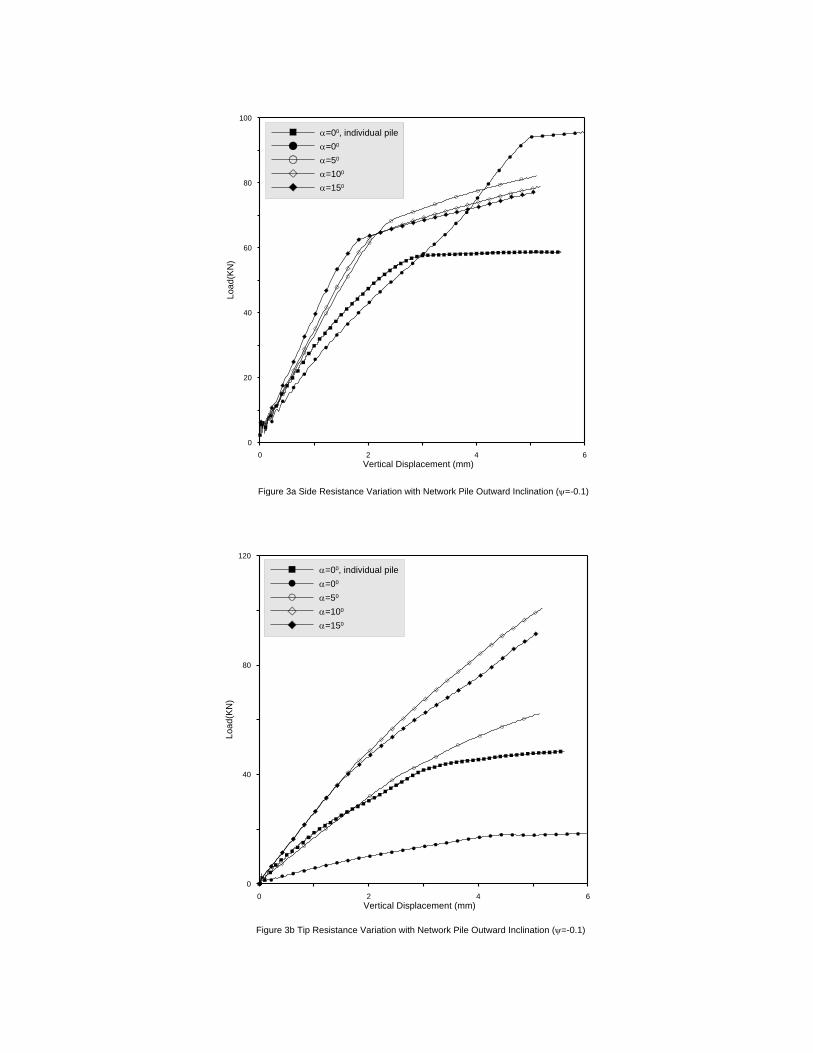
with state parameter of = 0.0, and set of Figures 5 are for those installed in a
contractive sand with state parameter of = 0.1. Within these set of figures, the figures
marked (a) are for variation of side resistance, (b) are for tip resistance.
Performance of Outward Network in Dilative Sand
It is seen that for dilative sand the side resistance is a maximum in the case of a
vertical group piles or (Figure 3a). Generally the side resistance is found to decrease with
increase in inclination angle from 00 to 150. This decrease is higher at smaller

inclinations ( < 50) with only a modest drop observed from 50 to 150 (Figure 3a). Note
that side resistance of a micropile is higher in both vertical group and inclined network
compared to that of an individual pile. This positive effect of side resistance of group
piles and network piles observed may have been due to the induced shear dilation along
the interface between the micropile and the surrounding dilative sand resulting in an
increased normal stress on the pile perimeters.
The tip resistance of a micropile in the dilative sand is higher in a network than
that of a corresponding micropile in a vertical group or a single vertical pile; the
maximum value of tip resistance is reached for a micropile in the network with an
inclination of around 100. Notice that the tip resistance of vertical piles in group is also
less than that of single vertical pile (Figure 3b).
Performance of Outward Network in Sand at critical state
Sand at the critical state has no possibility for dilatancy. The variation of side
resistance of the outward network micropiles installed in critical state sand with
inclination is different from that in dilative sand in that it reaches a maximum at an
inclination angle of about 100 (Figure 4a). The skin friction of all inclined network piles
is larger than that of vertical group piles and individual vertical pile, moreover, the skin
friction of vertical group piles is less than that of individual vertical pile.
Tip resistance of network piles installed in sand at critical state shows very similar
variation with inclination angle as found in dilative sand (Figures 4b), even though the
magnitudes of tip resistance are much lower in the sand at critical state than in dilative
sand. It also reaches a maximum at inclination angle of 100 (Figure 4b), then slightly
decreases towards inclination angle of 150. The tip resistance of a micropile in vertical

group and that of a single pile is about a fourth from a similar pile in network with
inclination angle of 100.
Performance of Outward Network in Contractive Sand
Contractive sand when subjected to shear leads to volume contraction. Performance of
the three-micropile outward network installed in contractive sand is different from those
in dilative sand and critical state sand.
The side, tip, and total resistance of a micropile in network all increased with pile
inclination angle (Figures 5a, 5b). However, all three resistances of a micropile in
vertical group were less than those that of a single vertical pile. This indicates a negative
group effect by the vertical group of piles in contractive sand, as opposite to the positive
group effect of vertical group piles in dilative sand. This negative group effect may have
been contributed by shearing contraction effect of the contractive sand surrounding the
piles leading to reduced normal stress on the pile perimeter.
Performance of Inward Network Piles
The variation of the side, tip and total resistance of inwardly inclined micropile
network with inclination angle are shown in Figures 6a through 8b for the different sand
states.
Performance of Inward Network Micropiles in Dilative Sand
For inward network micropiles in dilative sand, the side resistance is a maximum
in the case of a micropile in vertical group arrangement. The side resistance of micropile
in an inward inclined network is observed to be larger than that of a single vertical pile.
This was similar to that observed in the case of outward group piles. The variation of the
side resistance, however, was not consistent with pile inclination angle (Figure 6a).

The tip resistance of a micropile in dilative sand in an inward network reaches a
maximum at an inclination angle of 150 and drops to lowest at inclination angle of 00.
The tip resistances are very close at inclination angles of 100 and 50. The tip resistance of
a single vertical pile is larger than that of one in vertical group but is less than that in all
inward inclined networks (Figure 6b).
Performance of Inward Network Micropiles in Sand at Critical State
The variation of side resistance of piles installed in critical state sand with
inclination is mixed and different from that in dilative sand in that it reaches a maximum
at an inclination angle of 100 (Figure 7a).
The variation of the tip resistance of piles installed in this sand was not consistent
either (Figure 7b). As in the case of tip resistance of inwardly inclined network piles in
dilative sand, the tip resistance here is a maximum at an inclination angle of 150 and
drops to lowest at inclination angle of 00. The tip resistance of single vertical pie is less
all inwardly inclined network piles but larger than vertical group piles.
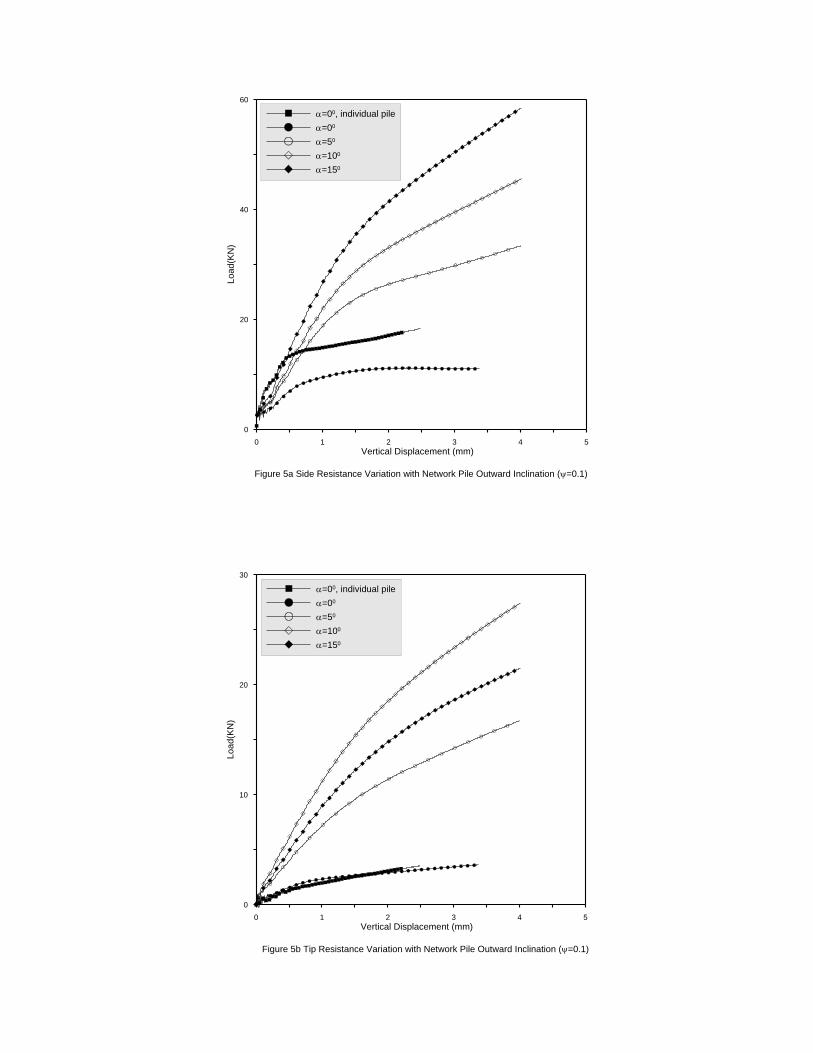
Performance of Inward Network Micropiles in Contractive Sand
In the case of inwardly inclined network piles installed in contractive sand, side
and tip showed a consistent pattern of increase with pile inclination angle (Figures 8a, 8b).
For side resistance, the single vertical pile is less than of a micropile in all inclined
networks but larger than vertical group piles. However for tip resistance, the single
vertical pile is very close to group vertical pile but less than all inclined piles.
Combination of side resistance and tip resistance results in that total resistance of single
vertical pile is larger than that of a pile in vertical group, but again less than those of all
inclined piles.

Conclusions
This paper presents some numerical analyses of the performance of network and
vertical group micropiles is the various state of sand. FLAC3D implemented with a
comprehensive sand constitutive model explicitly accounting for sand state parameter
was used to investigate the effect of the sand state on network effect and group effect of
micropiles. The following conclusions are drawn:
1. For piles installed in dilative sand with inclination angle less than 150 (individual,
inward and outward network), ultimate shaft resistance is less than that of vertical
piles. However, the behavior is opposite for piles installed in contractive sand.
2. The tip resistances of inclined piles are always larger than those of vertical piles
for both contractive sand and dilative sand.
3. Group effect of side resistance of micropiles installed in dilative sand is positive,
but becomes negative when they are installed in contractive sand. Tip resistance
group effect is negative in dilative sand but there is no obvious group effect in
contractive sand.
4. Based on these analyses, it is implied that the network and group effects of
micropiles and piles in sand depends on types of installation, sand state, pile
spacing, ratio of length over diameter, properties of pile-sand interface.
Therefore, it is difficult in practice to compare the performance of micropiles and
groups from one test program to other without consideration of the state of sand.
Use of relative density alone as has been done in the past experiments and model
studies would lead to conflicting results. The FLAC3D model developed here is a

useful means of quantifying the effects of state of sand for design.
Acknowledgements:
The study was sponsored in part by the Federal Highway Administration through a grant
to Washington State University. This support is gratefully acknowledged.
References:
Been, K. and Jefferies, M. G., A state parameter for sands, Geotechnique, 35(2), 99-112.
Bruce, D. A., et al., High Capacity Micropiles – basic Principles and Case Histories, Proc. Third National Conf. Geo-Institute Amer. Soc. Civil Eng., Urbana-Champaign, IL, June 1999. Dafalias, Y. F., 1981, A novel bounding surface constitutive law for the monotonic and cyclic hardening response of metals, Transactions, 6th international conference on SMIRT, Vol. 1, paper No. L 3/4,Paris, France, August, 1981.
Dafalias, Y. F., 1986, Bounding surface plasticity. I: Mathematical foundation and hypoplasticity, Journal of Engineering Mechanics, 112(9), 966-987.
Estephan R. et Frank R., 2001, Analyse du comportement de groupe et de réseaux élémentaires de micropieux sous chargement vertical et horizontal. Application aux essays de chargement du réseau de Saint-Rémy-lés-Chevreuse. Rapport interne N0FO/98-99/06.
FHWA, "Micropile Design and Construction Guidelines Implementation Manual"
FHWA-SA-97-070, 2000
Foerster, E. et Modaressi, H. 1995, Modélisation en elements finis des réseaux ou des groupes de micropieux. Rapport interne No. FO/94/04.
FOREVER, 2002, Synthesis of the results of the national project on micropiles. Research
Report, IREX.
Itasca Consulting Group, Inc. FLAC3D, Fast Lagrangian Analysis of Continua in 3 Dimensions User‟s Guide, Version 2.1, 2002.
Juran, I., Bruce, D. A., Dimillo, A. and Benslimane, A., 1999, Micropiles: the state of practice. Part II: design of single micropile and groups and networks of micropiles, Ground improvement, 3, 89-110.

Li, X. S. and Dafalias, Y. F, 2000, Dilatancy for cohesionless soils, Geotechnique, 50(4),
449-460.
Li, X. S., 2002, A sand model with state-dependent dilatancy, Geotechnique, 52(3), 173-
186.
Lizzi, F., & Carnevale, G. (1979). Les réseaux de pieux raciness pour la consolidation des sols. Aspect theoriques et essays sur modiles. Proc. ENPC-LCPC C. R. coll. Int. Renforcement des sols, 317-324, Paris.
Lizzi, F. (1982) The static restoration of monuments. International Society for Micropiles & The International Association of Foundation Drilling. Plumelle, C., 1984, „„Improvement of the Bearing Capacity of Soil by Inserts of Group and Reticulated Micropiles,‟‟ Proceedings, International Conference on In-situ Soil and Rock Reinforcement, Paris, France, pp. 83–89. Sadek, M., 2002, Three-dimensional finite element modeling of reinforced soil by micropiles. Ph.D. Thesis, University of Sciences and Technologies of Lille, France.
Sadek, M and Shahrour, I., 2004, A three dimensional embedded beam element for reinforced geomaterials, Int. J. Numer. Anal. Meth. Geomech., 28:931-946. Schofield, A.N. and Worth, P. (1968). Critical State Soil Mechanics, McGraw-Hill.
S. Shu, 2005, Sand State and Performance of Micropiles, PhD Dissertation, Washington State University. S. Shu, B. Muhunthan and X. S. Li, 2010, Numerical Simulation of the Influence of Initial State of Sand on Element Tests and Micropiles, Accepted by ASCE International
Journal of Geomechanics.

Critical State Line ec= e- c( p' pa
)
Current State: Contractive
Current State: Dilative= (e - ec) > 0
= (e - ec) < 0
( p'
pa)
Voi
d R
atio
, e
Figure 1. State Parameter and Critical State Line
State Parameter: = e - ec
Figure 2: Model setup for network Micropiles
>0 0 <0
0 2 4 6
Vertical Displacement (mm)
0
20
40
60
80
100
Loa
d(K
N)
=00, individual pile
=00
=50
=100
=150
Figure 3a Side Resistance Variation with Network Pile Outward Inclination (=-0.1)
0 2 4 6
Vertical Displacement (mm)
0
40
80
120
Lo
ad(K
N)
=00, individual pile
=00
=50
=100
=150
Figure 3b Tip Resistance Variation with Network Pile Outward Inclination (=-0.1)

0 2 4 6
Vertical Displacement (mm)
0
20
40
60
80
100
Loa
d(K
N)
=00, individual pile
=00
=50
=100
=150
Figure 4a Side Resistance Variation with Network Pile Outward Inclination (=0.0)
0 2 4 6
Vertical Displacement (mm)
0
20
40
60
Loa
d(K
N)
=00, individual pile
=00
=50
=100
=150
Figure 4b Tip Resistance Variation with Network Pile Outward Inclination (=0.0)
0 1 2 3 4 5
Vertical Displacement (mm)
0
20
40
60
Loa
d(K
N)
=00, individual pile
=00
=50
=100
=150
Figure 5a Side Resistance Variation with Network Pile Outward Inclination (=0.1)
0 1 2 3 4 5
Vertical Displacement (mm)
0
10
20
30
Loa
d(K
N)
=00, individual pile
=00
=50
=100
=150
Figure 5b Tip Resistance Variation with Network Pile Outward Inclination (=0.1)

0 2 4 6
Vertical Displacement (mm)
0
20
40
60
80
100
Loa
d(K
N)
=00, individual pile
=00
=50
=100
=150
Figure 6a Side Resistance Variation with Network Pile Inward Inclination (=-0.1)
0 2 4 6
Vertical Displacement (mm)
0
20
40
60
80
100
Loa
d(K
N)
=00, individual pile
=00
=50
=100
=150
Figure 6b Tip Resistance Variation with Network Pile Inward Inclination (=-0.1)

0 2 4 6
Vertical Displacement (mm)
0
20
40
60
80
Loa
d(K
N)
=00, individual pile
=00
=50
=100
=150
Figure 7a Side Resistance Variation with Network Pile Inward Inclination (=0.0)
0 2 4 6
Vertical Displacement (mm)
0
20
40
60
80
Loa
d(K
N)
=00, individual pile
=00
=50
=100
=150
Figure 7b Tip Resistance Variation with Network Pile Inward Inclination (=0.0)
0 1 2 3 4 5
Vertical Displacement (mm)
0
20
40
60
Loa
d(K
N)
=00, individual pile
=00
=50
=100
=150
Figure 8a Side Resistance Variation with Network Pile Inward Inclination (=0.1)
0 1 2 3 4 5
Vertical Displacement (mm)
0
5
10
15
20
25
Lo
ad
(KN
)
=00, individual pile
=00
=50
=100
=150
Figure 8b Tip Resistance Variation with Network Pile Inward Inclination (=0.1)