influence of reverse logistics practices on …
TRANSCRIPT

International Journal of Supply Chain Management
ISSN 2518-4709 (online)
Vol.3, Issue 1, No.1, pp 1 - 16, 2018 www.iprjb.org
0
INFLUENCE OF REVERSE LOGISTICS PRACTICES ON
ENHANCING COMPETITIVENESS IN MANUFACTURING
FIRMS IN KENYA: A CASE OF EAST AFRICAN BREWERIES
LTD
Daniel Kilonzo Mbovu and Dr. David Kiarie Mburu
International Journal of Supply Chain Management
ISSN 2518-4709 (online)
Vol.3, Issue 1, No.1, pp 1 - 16, 2018 www.iprjb.org
1
INFLUENCE OF REVERSE LOGISTICS PRACTICES ON
ENHANCING COMPETITIVENESS IN MANUFACTURING
FIRMS IN KENYA: A CASE OF EAST AFRICAN BREWERIES
LTD
1*Daniel Kilonzo Mbovu
1Postgraduate Student: Jomo Kenyatta University of Agriculture and Technology-Kenya
*Corresponding Author‟s Email: [email protected]
2Dr. David Kiarie Mburu
Senior Lecturer: Dedan Kimathi University of Technology- Kenya
Abstract
Purpose: The purpose of this study was to establish the influence of reverse logistics practices on
enhancing competitiveness in manufacturing firms in Kenya.
Methodology: The study population was 240 staff in the department of logistics Procurement and
Finance at East Africa Breweries Limited. A questionnaire with both open ended and closed
questions was used to collect raw data from the respondents. The simple random was carried out
and primary data was through the use of questionnaires. The secondary data was obtained from
published documents such as journals, periodicals, magazines and reports to supplement the
primary data. A pilot study was conducted to test the reliability and validity of the data collection
instrument. The data was analyzed with the help of SPSS. The study adopted a regression analysis
at 5% level of significance to determine strength and direction of the relationship of the variables
under study. Descriptive statistics were used to analyze the data in frequency distributions and
percentages presented herein in tables of frequency distribution, percentages, bar graphs and pie-
charts. The study adopted a multiple regression analysis so as to establish the relationship of
independent variables and dependent variables. The study applied SPSS compute the
measurements of the multiple regression analysis.
Results: The findings revealed that there exists a relationship between independent variables and
dependent variable with a correlation coefficient of 0.789. The coefficient of determination is
between zero and one. The data showed that the high R square is 0.622. It showed that the
independent variables in the study were able to explain 62.20% variation in the competitiveness of
the manufacturing firms while the remaining 37.80% is explained by the variables or other aspects
outside the model. This implies that these variables are very significant and they therefore need to
be considered in any effort to boost competitiveness of the manufacturing firms.
Unique contribution to theory, practice and policy: Based on the findings, the study
recommended that the manufacturing firms should collect used products to the repair workshops
from customers to make new products. The firms should train their employees on repair and
refurbishing of the products to meet customers‟ expectations. The manufacturing firms should

International Journal of Supply Chain Management
ISSN 2518-4709 (online)
Vol.3, Issue 1, No.1, pp 1 - 16, 2018 www.iprjb.org
2
repackage the product and resend the same product to the market. There is need to enhance
distributor returns the product for repackaging to the manufacturing firm and thus the firm is able
to save transport costs. Through repackaging the manufacturing firm is able to portray high levels
of responsibility and care for the end users. The study recommended that the manufacturing firms‟
returns used products and packaging to suppliers for recycling. There is need for awareness
creation to the public about recycling of the products, have a well documented and implemented
recycling policy. The study recommended that the manufacturing firm material handling, storage
locations should be where the shipping of the products to minimize picking time. The storage
locations will enable the firm to achieve competitive advantage by consistently reviewing sales
data as the items are stored close to the shipping area. The firm warehouse layout should be in such
that minimize travel time between picking locations. There is need to adopt material handling
technologies such as hand-held reader, pick to light and voice recognition technology to enhance
competitiveness of the firms.
Keywords: Reverse logistics, practices, competitiveness, manufacturing firms
1.0 INTRODUCTION
1.1 Background of the Study
According to Roberta, (2012), reverse logistics stands for all operations related to the reuse of
products and materials. It is the process of planning, implementing, and controlling the efficient,
cost effective flow of raw materials, in-process inventory, finished goods and related information
from the point of consumption to the point of origin for the purpose of proper disposal. More
precisely, reverse logistics is the process of moving goods from their typical final destination for
the purpose of capturing value, or proper disposal.
Remanufacturing and refurbishing activities also may be included in the definition of reverse
logistics. The reverse logistics process includes the management and the sale of surplus as well as
returned equipment and machines from the hardware leasing business. Normally, logistics deal
with events that bring the product towards the customer. In the case of reverse logistics, the
resource goes at least one step back in the supply chain. For instance, goods move from the
customer to the distributor or to the manufacturer (Roberta, 2012).The procedure of reverse
logistics entails the entire logistics process in reverse. This means that the final products or goods
need to be transported from their point of consumption or final destination back to their origin.
According to James, (2010), reverse logistics is a broad concept, encompassing many activities
within, and outside of, logistics. It has been defined as the term most often used to refer to the role
of logistics in product returns, source reduction, recycling, material substitution, reuse of material,
waste disposal, and refurbishing, repair and remanufacturing. Finding sufficient time to properly
plan, implement and control reverse logistics strategies and programs are difficult. In retail
companies or supermarkets, unwanted goods need to be returned to the manufacturer or distributor
if they are damaged or do not meet the customers standards. Surplus goods also need to be returned
through reverse logistics. Many retailers in the supply chain have an understanding with their
manufacturer that goods, such as newspapers are returned if they are not sold. These goods need to
be sent back to their place of origin for recycling or disposal.
The returned goods need to be transported back to their place of origin in the most economical and
time conserving manner. In order for companies not to lose most of their profits on returned goods,

International Journal of Supply Chain Management
ISSN 2518-4709 (online)
Vol.3, Issue 1, No.1, pp 1 - 16, 2018 www.iprjb.org
3
it is imperative for them to have an effective reverse strategy. Companies or retailers that
frequently require reverse logistics often have more advanced reverse logistics solutions in place.
The cost associated with reverse logistics must also be kept low in order for the retailer not to incur
additional costs. A logistics company that offers a professional reverse logistics solution will
ensure the time it takes to return the goods is as short as possible (Fleischmann et al., 2017).
Reuse of products and materials is not a new phenomenon (Fleischmann et al., 2017), waste paper
recycling, deposit systems for soft drink bottles, and metal scrap brokers are all example that have
been around for a long time. However, reverse logistics as a research field is relatively new. A
body of knowledge is beginning to develop around the reverse logistics field (Rogers & Tibben
Lembke, 2012) which only emerged within the last one decade or two. Conventional supply chain
perspectives consider a set of processes, driven by customer demand, that convey goods from
suppliers through manufacturers and distributors to the final customers. However, this is not where
the story ends. Physical goods do not simply vanish once they have reached the customer. Nor does
the value incorporated in them. Therefore, many goods move beyond the conventional supply chain
horizon, thereby triggering additional business transactions: used products are sold on secondary
markets; outdated products are upgraded to meet latest standards again; failed components are
repaired to serve as spare parts; unsold stock is salvaged; reusable packaging is returned and
refilled; used products are recycled into raw materials again. The set of processes that
accommodate these goods flows, which can often be interpreted as running „upstream‟ in a
conventional supply chain scheme, is known as reverse logistics.
1.1.1 Global Perspective of Competitiveness of Manufacturing Firms
In the present competitive world the relationships with supplier and customer plays a significant
role in a company‟s growth. Generally the companies seek benefits for both themselves and their
clients; these benefits can be achieved by a formalized process known as Supply chain. According
to Somoygi et al (2009) Supply chain includes managing supply and demand, purchasing raw
materials and spare parts, manufacturing and assembling, warehousing and inventory managing,
order entry and management, distribution and logistics across all channel and finally delivery to the
customer. Supply chain management can be defined as the integration of all these activities in to
seamless and formalized process (Somoygi et al, 2009). Initially the supply chain was introduced to
integrate the key business process, from supplier to the end user, were the information‟s on the
process adds value for the consumers.
Autry (2005) notes that in 2010,there were more than 1,000 different items recalled from the
marketplace by various U.S. government regulatory agencies from manufacturing firms.Among
others, these included recalls for toys, pharmaceuticals, consumer electronics, medical devices and
automotive parts. The reasons for the recalls ranged from issues with packaging and warning labels
to hazardous conditions created by the products. In addition to fines and penalties from regulatory
agencies, there is a greater potential liability from lawsuits and the impact on company sales from
bad press. Minimizing all of these potential risks from recalled products is a major driver behind
the need to develop a comprehensive reverse logistics program to reduce costs and enhance
profitability of firms. The weakness of this study is that it did not address issues of reverse logistics
practices in large scale manufacturing firms.
Remanufacturing operations involve taking used products, bringing them back to as-new condition,
and selling them again (Atasu et al. 2010). These activities in an industry can be carried out either

International Journal of Supply Chain Management
ISSN 2518-4709 (online)
Vol.3, Issue 1, No.1, pp 1 - 16, 2018 www.iprjb.org
4
by third-party Independent Remanufacturers (IR) or by Original Equipment Manufacturers (OEM).
Especially in the US, majority of remanufacturing is done by IRs (Hauser and Lund2008). The
same study finds that the remanufacturing industry in the U.S. is worth$53 billion, which means
that IRs is not an insignificant competitive threat to Original Equipment Manufacturers. Original
Equipment Manufacturers try to fend off competition from IRs through limiting quantity,
specifically by creating scarcity of cores available for remanufacturing (e.g., by offering free take-
back of cores from consumers or making cores ineligible for remanufacturing, and knowledge that
help a firm improves efficiency and effectiveness (Barney, 2011).
The Organisation for Economic Co-operation and Development (2003) acknowledges that reverse
logistics need to be developed. The imminent need in many countries to reduce, reuse and recycle
waste will only become feasible with a transport system which carries used and returned goods for
reuse and recycling (reversed logistics) in a cost-effective manner. The main reasons to become
active in reverse logistics are different: environmental laws, economic benefits and the growing
environmental consciousness of consumers (Roberta and Pier, 2012). In today‟s competitive
marketplace, it‟s not enough to simply offer reverse logistics as a value-add to already-existing
warehouse services. In fact, one of the most significant mistakes a company can make with regards
to reverse logistics is to consider the process only as an afterthought, or assume that if the right
components are in place, the desired result will magically happen. Balanced relationship between
technology and forethought can propel any company offering reverse logistics to the top of its
industry (Joe, 2008).
1.1.2 Regional Perspective of Competitiveness of Manufacturing Firms
Reverse logistics practices is one of the most essential tools in achieving this objective. Kenya aims
to become the provider of choice for basic manufactured goods in Eastern and Central Africa This
can be done through adoption of reverse logistics practices by all manufacturing firms in Kenya to
increase production and enhance efficiency in production. The manufacturing industry is an
important sector in Kenya as it makes a substantial contribution to the country‟s economic
development. According to the Economic Recovery Strategy for Employment and Wealth Creation
Report, the manufacturing sector in Kenya is amajor source of growth, still with high potential for
growth and investment. The role of the manufacturing sector in Vision 2030 is to create
employment and wealth (Gok, 2014).
As a result, this has heightened the need for alternative means to increase profitability to facilitate
growth and expansion, many manufacturers are prepared to look at more effective and efficient
ways of reducing both returns and their associated costs but are not prepared to allocate the
necessary resources for this operation, most manufacturing firms are looking for ways to make RL
a profit center instead of a cost center, such as deriving greater levels of residual value from returns
is one way to reduce perceived costs (Genchev, Richey & Gabler, 2011).
1.1.3 Local Perspective of Competitiveness of Manufacturing Firms
According to Abdullah (2003) once company is pinpointed with their major wastes, the lean tools
and methodologies should be implemented or practiced to eradicate these wastes. There were
different tools suggested by different authors for lean manufacturing, from these techniques and
tools the best is adapted. Due to its vital role, Kenya‟s vision 2030 identified the manufacturing
sector as one of the key drivers for realizing a sustained annual GDP growth of 10 percent. Kenya
Vision 2030 is the country‟s new development blueprint aimed at transforming Kenya into a newly

International Journal of Supply Chain Management
ISSN 2518-4709 (online)
Vol.3, Issue 1, No.1, pp 1 - 16, 2018 www.iprjb.org
5
industrialized middle income country providing a high quality of life to all citizens by the year
2030.
According to Bigsten et al., (2010), manufacturing sector has high potential in employment
creation and poverty alleviation. Kenya aims to become the provider of choice for basic
manufactured goods in Eastern and Central Africa. This will be achieved through improved
efficiency and competitiveness at firm levels. The manufacturing sector is experiencing a major
problem of stiff competition emanating from illicit and illegal trade (Kenya manufacturing survey
2012). Government of Kenya interventions such as removal of price controls, foreign exchange
controls and introduction of investment incentives aimed at improving performance of these
organizations has not yielded any major changes (KAM, 2012). To drastically manage this
challenge and achieve superior performance manufacturing firms in Kenya require strategy
intervention. However, despite the highlighted benefits a study by Mwaura et al. (2015) found that
due to lack of awareness on the importance of sustainability, there is a low level of adoption of
reverse logistics practices in Kenya. The study recommended that organizational managers should
enhance reverse logistics practices.
1.1.4 East African Breweries Ltd
According to the company‟s website, East African Breweries Limited (EABL) is East Africa's
leading branded alcohol beverage business with an outstanding collection of brands that range from
beer, spirits and adult non alcoholic drinks (ANADs) reaffirming its standing as a total adult
beverage (TAB) company. With breweries, distilleries, support industries and a distribution
network across the region, the group's diversity is an important factor in delivering the highest
quality brands to East African consumers and long-term value to East African investors. Under the
auspices of the EABL Committee, the company has taken further steps towards the adoption of
best practice found worldwide including the U.S. Sarbanes-Oxley Act 2002, which involves a
stringent self-assessment of internal controls. Risk monitoring activities continue to receive focus
from Management and the Board (EABL 2013).
Although EABL owns and manages some warehousing assets, most is outsourced using third-party
logistics (3PL) partners which includes global logistics solutions provider DHL. EABL is working
very closely with these partners to implement Project MOVE, which delivers an integrated,
streamlined, and agile logistics network, all the way from end of packaging line to the distributor.
In-line with more mature markets such as Europe, this will exploit technology to measure how well
the changes are performing. EABL has a four step process to ensure best practices are deployed
which consists of measuring, monitoring, managing, and subsequently making a difference to its
processes. Using reverse logistics practices gathered from packaging line all the way down to
outlet level, the company is able to make informed decisions (backed up by a set of analytics tools)
to create an atmosphere of continuous improvement. EABL„s diversity as a robust regional
company is revealed in its subsidiaries: Kenya Breweries Limited, Uganda Breweries Limited,
Serengeti Breweries Limited, United Distiller Vintners, East African Malting Limited and East
African Breweries International.The study will focus on the role of reverse logistics and
competitive advantage in the manufacturing sector specifically Kenya Breweries Limited one of
the subsidiaries

International Journal of Supply Chain Management
ISSN 2518-4709 (online)
Vol.3, Issue 1, No.1, pp 1 - 16, 2018 www.iprjb.org
6
1.2 Statement of the Problem
The manufacturing industry is a fast growing sector in developing countries, Kenya included. In
Kenya, the sector contributes over 10%to the GDP according to the 2015-2016 national budgets.
However, high cost of production and often low quality of raw materials has become a major
problem for leading manufacturers in the country (RoK, 2016). This, it is alleged, has made some
players in the sector to implement a number of cost cutting measures some of which border on
contravening internationally recognized best practices Muttimos, 2014). Critical reverse logistics
functions can cost companies millions in lost profits due to damaged customer relationships and
external liabilities that could have an enormous impact on their business. Effectively managed,
however, reverse logistics can enable organizations to find hidden competitive advantage improve
customer satisfaction and minimize liabilities.
Fleischmann and Kuik (2013) said that the average manufacturer will spend 9% to 15% of total
revenue on returns, according to a 2010 Aberdeen Group study. They are often unaware of the
impact returns management can have on their customers, their resources or their bottom line. In fact,
improving reverse logistics can help company increase revenue up to 5% of total sales
(Mukhopadhyay & Setoputro, 2004). Many research works have demonstrated that Reverse
Logistics is important to enhance organizational performance (Lambert & Burduroglu, 2000; Zhao
et al., 2001; Daugherty et al., 2002; Stock et al., 2002; Tibben-Lembke & Rogers, 2002; De Brito,
2004; Griffis et al., 2007; Sols et al., 2007). Reverse Logistics could be considered as important
intangible asset of the firm (Wadhwa & Madaan, 2007).
Further, empirical evidence adduced shows that researchers such as Eltayeb et al. (2011), Rao and
Holt (2005), De Giovanni and Vinzi (2012), Green etal. (2011) and Azevedo et al. (2011) have
attempted to link adoption of reverse logistics practices to organizational performance. According to
their research findings, Rao and Holt (2005) showed that there exists a positive relationship between
reverse logistics practices and organizational performance, De Giovanni and Vinzi (2012)
established that the existing relationship was not significant while Azevedo et al. (2011) found a
combination of positive relationship as well as other relationships. Thus organizations that have
been begun taking account these asset have obtained benefits that could support competitive
advantage (Kannan & Aulbur, 2004). There is less research done on reverse logistics and
competitive advantage locally. Therefore the study sought to investigate the role of reverse logistics
in achieving competition advantage in the manufacturing sector in East Africa Brewery Limited.
1.3 Study Objectives
The study sought to be guided by the following specific objectives:
i. To examine how remanufacturing practices influence competitiveness in manufacturing
firms in Kenya
ii. To establish how repackaging practices influence competitiveness in manufacturing firms in
Kenya
iii. To investigate how recycling practices influence competitiveness in manufacturing firms in
Kenya
iv. To determine how warehouse management influence competitiveness in manufacturing
firms in Kenya

International Journal of Supply Chain Management
ISSN 2518-4709 (online)
Vol.3, Issue 1, No.1, pp 1 - 16, 2018 www.iprjb.org
7
2.0 LITERATURE REVIEW
2.1 Conceptual Framework
The purpose of the conceptual framework was to show the aims which a research study strives to
achieve. In essence, the conceptual framework organizes the ideas of the researcher by making
theoretical distinctions in the intended study. Eriksson and Westerberg, (2011), describe it as a
diagrammatical representation that shows the relationship between dependent and independent
variables. It also explains the relationship among interlinked concepts and explains the possible
connection between the variables. The following framework depicts the relationship between the
independent and dependent variables based on four independent variables and a dependent variable
as represented diagrammatically in Figure 2.1
Figure 1: Conceptual Framework
Remanufacturing
Repair workshops
Products warranty
Product making
Dependent Variable
Repackaging
Refurbishing
Replacement of products
Product storing services
Recycling
Return used products
Awareness creation
Structured market incentives
Warehouse Management
Storage locations
Layout
Material handling
Independent Variables
Competitiveness of
Manufacturing Firms
Profitability
Market Share
Cost reduction

International Journal of Supply Chain Management
ISSN 2518-4709 (online)
Vol.3, Issue 1, No.1, pp 1 - 16, 2018 www.iprjb.org
8
3.0 RESEARCH METHODOLOGY
3.1 Research Design
The research design facilitates the smooth sailing of the various research operations, thereby
making research as efficient as possible hence yielding maximum information with minimal
expenditure of effort, time and money (Mugenda, 2008). This study used descriptive research
design. This design refers to a set of methods and procedures that describe variables. It involves
gathering data that describe events and then organizes, tabulates, depicts, and describes the data.
Descriptive studies portray the variables by answering who, what, and how questions (Babbie,
2009). The study sought to be descriptive in nature as it is deemed appropriate because it involves
use of written questionnaires administered to respondents. Yin (2013) recommended descriptive
design as it allows the researcher to describe record, analyze and report conditions that exist or
existed. Since this study sought to establish the influence of reverse logistics on competitiveness of
manufacturing firms in Kenya this has the advantage of providing an in-depth investigation of the
problem under study.
3.2 Target Population
Mugenda and Mugenda (2012) define target population as the entire group of individuals or objects
to which researchers are interested in generalizing the conclusions on. EABL„s diversity as a robust
regional company is revealed in its subsidiaries: Kenya Breweries Limited, Uganda Breweries
Limited, Serengeti Breweries Limited, United Distiller Vintners, East African Malting Limited and
East African Breweries International.The study will focus on the role of reverse logistics and
competitive advantage in the manufacturing sector specifically Kenya Breweries Limited one of
the subsidiaries In this study the population was 240 staff drawn from the supply chain related
departments in the Kenya Breweries Limited. This is illustrated in Table 1;
Table 1: Target Population
Strata Target Population Percentage
Managing Director-
manufacturing
1 1.0
Accounts Department 48 2.42
Purchasing Department 60 25.00
Transport Department 71 29.58
Stores Department 60 25.00
Total 240 100.0
Source: Kenya Breweries Ltd (2018)
3.3 Sample and Sampling Technique
According to Kothari (2005) sampling is the process by which a relative small number of
individual, object or event is selected and analyzed in order to find out something about the entire

International Journal of Supply Chain Management
ISSN 2518-4709 (online)
Vol.3, Issue 1, No.1, pp 1 - 16, 2018 www.iprjb.org
9
population from which will be selected. A Sample is a small proportion of targeted population
selected using some systematic form. The research used stratified random sampling because it
enables generalization of a greater population with a margin of error that is statistically
determinable. The manual calculation method was used to arrive at the sample size using the
following Taro Yamane (1973) formula: Sample Size (n) = N/ [1 + (N) (e)2
where N is the total
population (1973), e is the level of significance(10%) = 240/ [1 + (240) (0.1x0.1) = 72. The sample
size therefore becomes 72.
Table 2: Sample size Distribution
Strata Population(N) Sample Size(n)
Managing Director-
manufacturing
4 2
Accounts Department 46 14
Purchasing Department 60 18
Transport Department 70 24
Stores Department 60 14
Total 240 72
3.4 Data Collection Instruments
According to Kumar and Phrommathed (2005) data collection instrument is the means by which
information is obtained from the selected subject of an investigation. The study collected primary
data using questionnaires. The respondents were specifically targeted for their ability to provide
pertinent information to the study. The questionnaire contained both structured and unstructured
questions. According to Babbie (2009), the questionnaires are used for data collection because of
their simplicity in the administration and scoring of items as well as data analysis. Secondary data
was gathered from existing credible and recognized sources. The secondary data comprised of
materials that were relevant such as library text books, internet, magazines and reports in the
manufacturing firms.
4.0 RESULTS AND DISCUSSION
4.1 Response Rate
A total of 72 questionnaires were distributed to the targeted respondents. Out of the population
covered, 58 were responsive representing a response rate of 80.55%. This was above the 50%
which is considered adequate in descriptive statistics according to Mugenda & Mugenda (2012).
Contacts prior to the dispatch of the questionnaires and follow up calls could account for the fairly
high response rate. Quantitative data obtained from the questionnaires were presented in tables,
frequencies and percentages as shown hereafter.
International Journal of Supply Chain Management
ISSN 2518-4709 (online)
Vol.3, Issue 1, No.1, pp 1 - 16, 2018 www.iprjb.org
10
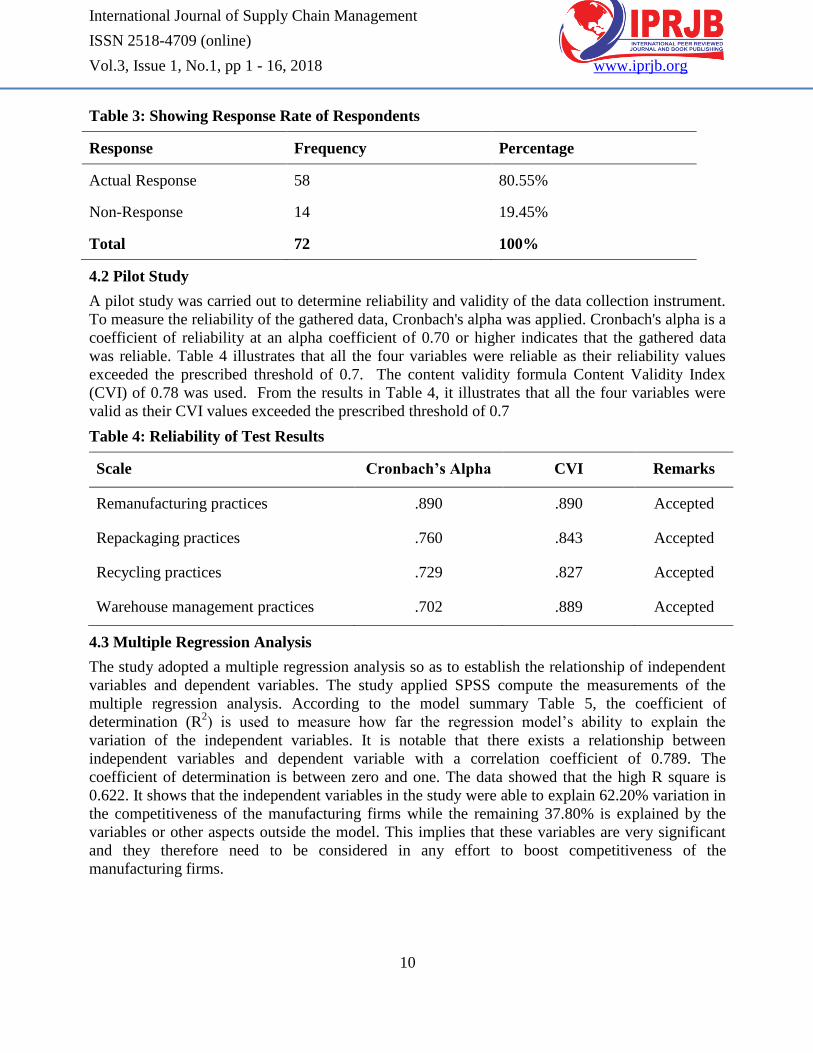
Table 3: Showing Response Rate of Respondents
Response Frequency Percentage
Actual Response 58 80.55%
Non-Response 14 19.45%
Total 72 100%
4.2 Pilot Study
A pilot study was carried out to determine reliability and validity of the data collection instrument.
To measure the reliability of the gathered data, Cronbach's alpha was applied. Cronbach's alpha is a
coefficient of reliability at an alpha coefficient of 0.70 or higher indicates that the gathered data
was reliable. Table 4 illustrates that all the four variables were reliable as their reliability values
exceeded the prescribed threshold of 0.7. The content validity formula Content Validity Index
(CVI) of 0.78 was used. From the results in Table 4, it illustrates that all the four variables were
valid as their CVI values exceeded the prescribed threshold of 0.7
Table 4: Reliability of Test Results
Scale Cronbach’s Alpha CVI Remarks
Remanufacturing practices .890 .890 Accepted
Repackaging practices .760 .843 Accepted
Recycling practices .729 .827 Accepted
Warehouse management practices .702 .889 Accepted
4.3 Multiple Regression Analysis
The study adopted a multiple regression analysis so as to establish the relationship of independent
variables and dependent variables. The study applied SPSS compute the measurements of the
multiple regression analysis. According to the model summary Table 5, the coefficient of
determination (R2) is used to measure how far the regression model‟s ability to explain the
variation of the independent variables. It is notable that there exists a relationship between
independent variables and dependent variable with a correlation coefficient of 0.789. The
coefficient of determination is between zero and one. The data showed that the high R square is
0.622. It shows that the independent variables in the study were able to explain 62.20% variation in
the competitiveness of the manufacturing firms while the remaining 37.80% is explained by the
variables or other aspects outside the model. This implies that these variables are very significant
and they therefore need to be considered in any effort to boost competitiveness of the
manufacturing firms.

International Journal of Supply Chain Management
ISSN 2518-4709 (online)
Vol.3, Issue 1, No.1, pp 1 - 16, 2018 www.iprjb.org
11
Table 5: Model Summary
Model R R2 Adjusted R
2 Std. Error of the Estimate
.789 .622 .599 .004
The study further used Analysis of Variance (ANOVA) in order to test the significance of the
overall regression model. Green and Salkind (2013) posit that Analysis of Variance helps in
determining the significance of relationship between the research variables. The results of Analysis
of Variance (ANOVA) reveal that the significance of the F-test was done to test the effect of
independent variables on the dependent variable simultaneously. The F-statistic test basically
shows whether all the independent variables included in the model jointly influence on the
dependent variable. Based on the study results of the ANOVA Test or F-test in Table 5, obtained F-
count (calculated) value was 17.159 greater the F-critical value (Table 6) (13.890) with
significance of 0.0024. Since the significance level of 0.002< 0.05 we conclude that the set of
independent variables influence the competitiveness in the manufacturing firms (Y-dependent
variable) and this shows that the overall model was significant. Thus the four variables play a
significant role in the competitiveness in the manufacturing firms in Kenya.
Table 6: ANOVA
Model Sum of
Squares
d.f Mean
Square
F Sig.
Regression 10.220 4 2.5550 17.159 .004
Residual 7.890 53 .1489
Total 18.110 57
NB: F-critical Value = 13.890;
The results of multiple regression analysis obtained regression coefficients t value and significance
level as indicated in Table 6. The study conducted a multiple regression analysis so as to determine
the relationship between the dependent variable and independent variables. The general form of the
equation was to predict competiveness of the manufacturing firms from remanufacturing,
repackaging, recycling and warehouse management practices is:(Y = β0 + β1X1 + β2X2 + β3X3 +
β4X4 +ε) becomes: Y= 10.562+ 0.760X1+ 0.679X2+ 0.629X3 + 0.588X4 + 1.860. This indicates
that competiveness of the manufacturing firms = 10.562 + 0.760* Remanufacturing +
0.679*Repackaging practices + 0.629*Recycling practices + 0.588*Warehouse management +
1.860.
From the study findings on the regression equation in Table 7, established, taking all factors into
account (independent variables) constant at competiveness of the manufacturing firms would be
10.562.The data findings analyzed also shows that taking all other independent variables at zero, a
unit increase in remanufacturing practices would lead to a 0.760 increase in competitiveness of the
manufacturing firms; a unit increase in repackaging would lead to a 0.679 increase in
competitiveness of the manufacturing firms, a unit increase in recycling practices would lead to

International Journal of Supply Chain Management
ISSN 2518-4709 (online)
Vol.3, Issue 1, No.1, pp 1 - 16, 2018 www.iprjb.org
12
0.629 increase in competitiveness of the manufacturing firms and a unit increase in warehouse
management would lead to 0.588 increase in competitiveness of the manufacturing firms This
infers that remanufacturing practices contributed most to competitiveness of the manufacturing
firms Based at 5% level of significance, remanufacturing practices had a .000 level of significance;
repackaging practices showed a .002 level of significance, recycling practices show a .004 level of
significance and warehouse management show a .005 level of significance hence the most
significant factor was remanufacturing Practices.
Table 7: Regression Coefficient Results
Model Unstandardized
Coefficients
Standardized
Coefficients
t Sig.
β Std. Error β
(Constant) 10.562 1.860 5.679 .000
Remanufacturing .760 .143 .665 5.325 .000
Repackaging .679 .138 .654 4.908 .002
Recycling .629 .149 .455 4.221 .004
Warehouse management .588 .150 .332 3.908 .005
5.0 DISCUSSION CONCLUSIONS AND RECOMMENDATIONS
5.1 Conclusion of the Study
Based on the study findings, the study concludes that competitiveness of the manufacturing firms is
affected by reverse logistics practices The study concludes that remanufacturing practices are the
first important factor that affects competitiveness of the manufacturing firms in Kenya The
regression coefficients of the study show that remanufacturing practices has a significant influence
on competitiveness of the manufacturing firms in Kenya. This implies that increasing levels of
remanufacturing practices would increase the levels of competitiveness of the manufacturing firms
in Kenya. This shows that remanufacturing practices have a strong positive influence on
competitiveness of the manufacturing firms in Kenya.
The study concludes that repackaging practices are the second important factor that affects
competitiveness of the manufacturing firms in Kenya. The regression coefficients of the study
show that repackaging practices has a significant influence on competitiveness of the
manufacturing firms in Kenya. This implies that increasing levels of repackaging practices would
increase the levels of competitiveness of the manufacturing firms in Kenya. This shows that
repackaging practices have a strong positive influence on competitiveness of the manufacturing
firms in Kenya
Further, the study concludes that recycling practices is the third important factor that affects
competitiveness of the manufacturing firms in Kenya. The regression coefficients of the study

International Journal of Supply Chain Management
ISSN 2518-4709 (online)
Vol.3, Issue 1, No.1, pp 1 - 16, 2018 www.iprjb.org
13
show that repackaging practices has a significant influence on competitiveness of the
manufacturing firms in Kenya. This implies that increasing levels of repackaging practices would
increase the levels of competitiveness of the manufacturing firms in Kenya. This shows that
repackaging practices have a strong positive influence on competitiveness of the manufacturing
firms in Kenya
Finally, the study concludes that warehouse management practices is the fourth most important
factor that affects competitiveness of the manufacturing firms in Kenya The regression coefficients
of the study show that warehouse management practices has a significant influence on
competitiveness of the manufacturing firms in Kenya. This implies that increasing levels of
warehouse management practices would increase the levels of competitiveness of the
manufacturing firms in Kenya. This shows that warehouse management practices have a strong
positive influence on competitiveness of the manufacturing firms in Kenya
5.2 Recommendations of the Study
The study recommends that the manufacturing firms should collect used products to the repair
workshops from customers to make new products. The firms should train their employees on repair
and refurbishing of the products to meet customers‟ expectations. There is need to implement
product warranty to meet the customers‟ expectations and have manufacturing firm use reverse
logistic to have competitive advantage and reduce customer risk when buying products to enhance
competitiveness of the firms.
The manufacturing firms should repackage the product and resend the same product to the market.
There is need to enhance distributor returns the product for repackaging to the manufacturing firm
and thus the firm is able to save transport costs. Through repackaging the manufacturing firm is
able to portray high levels of responsibility and care for the end users. The manufacturing firms
should repackage damaged products which are beyond salable attractiveness to enhance its
competitiveness
The study recommends that the manufacturing firms‟ returns used products and packaging to
suppliers for recycling. There is need for awareness creation to the public about recycling of the
products, have a well documented and implemented recycling policy. The manufacturing firms
should have a structured market incentives on the recycling of the products.
The study recommends that the manufacturing firm material handling, storage locations should be
where the shipping of the products to minimize picking time. The storage locations will enable the
firm to achieve competitive advantage by consistently reviewing sales data as the items are stored
close to the shipping area. The firm warehouse layout should be in such that minimize travel time
between picking locations. The manufacturing firms should develop processes to regularly monitor
picking travel times and storage locations. There is need to adopt material handling technologies
such as hand-held reader, pick to light and voice recognition technology to enhance
competitiveness of the firms.

International Journal of Supply Chain Management
ISSN 2518-4709 (online)
Vol.3, Issue 1, No.1, pp 1 - 16, 2018 www.iprjb.org
14
REFERENCES
Ballou, R.H. (1999). Business Logistics Management. (4th
ed.). Upper Saddle River, New Jersey:
Prentice Hall.
Canadian Ed.), Canada: McGraw Hill Ryerson ISBN 0-07-281947-2
Cooper, M.C., Lambert, D.M., & Pagh, J. (1997) Supply Chain Management: More Than a New
Name for Logistics. The International Journal of Logistics Management 8, (1), 1–14
Cozzolino A (2012) Humanitarian Logistics and Supply Chain Management. In Humanitarian
Logistics, Springer Berlin Heidelberg
Donovan, R. (2006), Management Information Systems For the Information Age (3rd
Ellinger, A.; Daugherty, P. & Keller, S. (2000)“The relationship between marketing/ logistics
interdepartmental integration and performance in U.S. manufacturing firms: An empirical
study”, Journal of Business Logistics, 21 (1) 1-22.
Ellinger, A.; Taylor, J.C. & Daugherty, P.J. (2000)“Automatic Replenishment Programs and Level
of Involvement: Performance Implications”, The International Journal of Logistics
Management, 10 (1) 29-40.
FAO, 2007, Agro-industrial supply chain management: Concepts and applications. AGSFO
ccasional Paper 17 Rome.
Garver, M.S. & Mentzer, J.T. (1999)“Logistics Research Methods: Employing Structural Equation
Modelling to test for construct validity”, Journal of Business Logistics, 20 (1) 33-57.27
Gimenez, C. & Ventura, E. (2003) “Supply Chain Management as a competitive advantage in the
Spanish grocery sector”, The International Journal of Logistics Management,14 ( 1) 77-88.
Gimenez, C. (2000) “Supply Chain Management in the Spanish Grocery Sector”, First World
Conference on Production and Operations Management, POM Sevilla 2000, Sevilla
(Spain).
Groves, G. & Valsamakis, V. (1998) “Supplier-customer relationships and company performance”,
The International Journal of Logistics Management, 9 (2) 51-63.
Halldorsson, A., Kotzab, H., Mikkola, J. H., Skjoett-Larsen, T. (2007). Complementary theories to
supply chain management. Supply Chain Management: An International Journal, 12 (4),
284296.
Herbert K & Tage S.L (2003). Inter-organizational theories behind Supply Chain Management –
discussion and applications, In Seuring.
Hines, T. (2004). Supply chain strategies: Customer driven and customer focused. Oxford:
Elsevier.
John T. Phelan, (2009) Jr. P.E. “Guest Column: Knowing When a WMS or WCS Is Right for Your
Company”. Supply & Demand Chain Executive. Enom, Inc. Retrieved 17 September, 2017
Ketchen Jr., G., & Hult, T.M. (2006). Bridging organization theory and supply chain management:
The case of best value supply chains. Journal of Operations Management, 25(2) 573-580.
Kotler, Keller and Burton, (2009). Marketing Management, Pearson Education Australia: Frenchs
Forest

International Journal of Supply Chain Management
ISSN 2518-4709 (online)
Vol.3, Issue 1, No.1, pp 1 - 16, 2018 www.iprjb.org
15
Kouvelis, P.; Chambers, C.; Wang, H. (2006): Supply Chain Management Research and
Production and Operations Management: Review, Trends, and Opportunities Baziotopoulos
(2008) An Investigation of Logistics Outsourcing Practices In the Greek Manufacturing
Sector. PhD thesis.
Krejcie & Morgan (2000) Educational and Psychological. In: Production and Operations
Management, 15, (3) 449–469.
Kumar, R. and Chandrakar, R. (2012). Overview of Green Supply Chain Management: Operation
and Environmental Impact at Different Stages of the Supply Chain. International Journal
of Engineering and Advanced Technology, 1(3), 2249 – 8958.
Kumar,S. Dieveney, E. and Dieveney, A. (2008). Reverse logistic process control measures for the
pharmaceutical industry supply chain. International Journal of Productivity and
Performance Management, 58 (2), 188-204
Larson, P.D. and Halldorsson, A. (2004). Logistics versus supply chain management: an
international survey. International Journal of Logistics: Research & Application, 7 (1), 17-
26
Lavassani K., Movahedi B., Kumar V. (2009) Developments in Theories of Supply Chain
Management: The Case of B2B Electronic Marketplace Adoption, The International
Journal of Knowledge, Culture and Change Management, 9 (6) 85–98.
Mallik, S (2010). “Customer Service in Supply Chain Management”. In Hossein Bidgoil. The
Handbook of Technology Management: Supply Chain Management, Marketing and
Advertising, and Global Management, 2 (1). Hoboken, New Jersey: John Wiley & Sons. P.
104. ISBN 978-0-470-24948-2.
Masella, C. & Rangone, A. (2000)“A contingent approach to the design of vendor selection
systems for different types of cooperative customer/supplier”, International Journal of
Operations and Production Management, (20 (1) 70-84.
Mentzer, J.T. & Flint, D.J. (1997) “Validity in Logistics Research”, Journal of Business Logistics,
18 (2) 199-216.
Mentzer, J.T. et al. (2001): Defining Supply Chain Management, in: Journal of Business Logistics,
22 (2), 2001, 1–25
Movahedi B., Lavassani K., Kumar V. (2009) Transition to B2B e-Marketplace Enabled Supply
Chain: Readiness Assessment
and Success Factors, The International Journal of Technology, Knowledge and Society,
5(3) 75–88.
Parente, D.H.; Pegels, C.C. & Suresh, N. (2002) “An exploratory study of the sales production
relationship and customer satisfaction”, International Journal of Operations & Production
Management, 22 (9) 997-1013.
Scannell, T.V.; Vickery, S.K. & Dröge, C.L. (2000)“Upstream supply chain management and
competitive performance in the automotive supply industry”, Journal of Business Logistics,
21 (1) 23-48.
Simchi-Levi D.,Kaminsky P., Simchi-levi E. (2007), Designing and Managing the Supply Chain,
third edition, Mcgraw Hill

International Journal of Supply Chain Management
ISSN 2518-4709 (online)
Vol.3, Issue 1, No.1, pp 1 - 16, 2018 www.iprjb.org
16
Stank, T.P.; Crum, M. & Arango, M. (1999) Benefits of inter-firm coordination in food industry
supply chains, Journal of Business Logistics, 20 (2) 21-41.
Stank, T.P.; Daugherty, P.J. & Autry, C. (1999) Collaborative planning: Supporting automatic
replenishment programs, Supply Chain Management, 4 (2) 75-85.
Stank, T.P.; Keller, S. & Daugherty, P. (2001) Supply chain collaboration & logistical service
performance, Journal of Business Logistics, 22 (1) 29-48.
Torre et al. (2012), Disaster relief routing: Integrating research and practice Socio-Economic
Planning Sciences vol 46, March
Tracey, M. (1998) The Importance of Logistics Efficiency to Customer Service and Firm
Performance, International Journal of Logistics Management, The, Vol. 9
Vargas, G.; Cardenas, L. & Matarranz, L. (2000) Internal and external integration of assembly
manufacturing activities, International Journal of Operations and Production Management,
20 (7), 809-822
Wallenburg, C., Cahill, D., Michael Knemeyer, A., and Goldsby, T. (2011): Commitment and
Trust as Drivers of Loyalty in Logistics Outsourcing Relationships: Cultural Differences
between the United States and Germany. Journal of Business Logistics, Vol. 32 (1) 83-
Wiendahi H.P (2009) Fundamentals of Production Logistics, Springer Berlin Heidelberg
Xie, Y. and Breen, L. (2012). “Greening community pharmaceutical supply chain in UK” Supply
Chain Management: An International Journal, 17 (1), 40–53.